Article

Validation of the Short Forms of Centrality of Religiosity Scale in Russia

1
Department of Psychology, University of Fribourg, 1700 Fribourg, Switzerland
2
Faculty of Theology, St. Tikhon’s Orthodox University, 127051 Moscow, Russia
*
Author to whom correspondence should be addressed.
Religions 2020, 11(11), 577; https://doi.org/10.3390/rel11110577
Submission received: 29 September 2020 / Revised: 27 October 2020 / Accepted: 28 October 2020 / Published: 4 November 2020
(This article belongs to the Special Issue Research with the Centrality of Religiosity Scale (CRS))

Abstract

:
Since the end of the Soviet Union, Christian Orthodoxy has regained importance in Russian society. Considering the religious dynamics in the decades after 1990, scholars working in the field have been debating about a reliable measuring tool for religiosity. The present study provides a validation of two short forms of the Centrality of Religiosity Scale (CRS), the CRS-5, and CRSi-7 in Russia, as well as its corresponding translated items. Therefore, data from two large-scale sociological surveys from 2008 (N = 894) and 2019 (N = 1768) were used. A multigroup confirmatory factor analysis with restrictions on the variance and covariance structure of the model shows good results in terms of absolute, parsimony, and relative model fit for the CRS-5 and CRSi-7. Moreover, the models indicate time-invariance, which is a consistent psychometric characteristic of both short forms. The time-invariance is accompanied by the good internal consistency of the scales: The CRS-5 with α = 0.85 and the CRSi-7 with α = 0.84 . The results of the analysis encourage the use of the CRS-5 and the CRSi-7 for research on religiosity in Russia. While the CRS-5 is especially suitable for the Orthodox-dominated religious landscape, the CRSi-7 should be used if non-monotheistic private religious practice and religious experience are the focus of the scientific investigation.

1. Introduction

1.1. Status Quo of the Empirical Research on Religiosity in Russia

A substantial gap concerning church affiliation and religious practice can be identified in sociological research on religiosity in Russia. While a large share of the population belongs to the Russian Orthodox Church (according to various surveys, between 60% to 80%), low levels of religious practices like regular attendance of religious services, confession, and receiving communion, have been observed (according to various sources, between 3% to 15% of the population). See, for example, Sahgal and Cooperman (2017), Emelyanov (2016), and Sinelina (Синелина 2013) for in-depth statistical analyses on this discrepancy.
The low religiosity level is usually explained by the strong link between Russian Orthodox religious affiliation and ethnicity, national identity, or loyalty to the state, which substitutes “true” religious commitment. For example, Zorkaya (Зоркая 2009) argues that the mass conversion to Orthodoxy since the 1990s is not a manifestation of religious revival, since Orthodoxy is only a component of the post-Soviet identity. On the same topic, Kääriäinen and Furman (Каариайнен and Фурман 2007a, 2007b) conclude that the “pro-Orthodox consensus”—a positive attitude towards religion and the Russian Orthodox Church in the mass consciousness, accompanied by the conviction that there is no “Russianness” without Orthodoxy—cause the growth of religious affiliation not confirmed by either practice or belief in God. Filatov and Lunkin (Филатов and Лункин 2005) complete these thoughts by adding that the religious factor only has a minor effect on public life in Russia, as for the majority of Orthodox Christians faith has become just a cultural symbol. In her article, Mchedlova (Мчедлова 2009) discusses the ambiguity of religiosity in Russian society and distinguishes between two contradictory aspects in the perception of religion: As a cultural identification characteristic, and as a way of life with faith as a primary principle. Lastly, Karpov et al. (2012) (Карпов, Лисовская, and Barry 2012) sum up the discussion by stating that religiosity in Russia is characterized by “ethnodoxy”—“a belief system that rigidly links a group’s ethnic identity to its dominant religion”. This lively discussion among scholars in Russia and outside its borders is accompanied by the question of the assessment of religiosity to establish a measurement that allows for the evaluation of the “gap” between the associated members of a religious community and the practitioners. While the interest can lie in a distinction between “true believers” and associated members of a religious community, the greater question behind this discussion is the general comprehensive assessment of someone’s religiosity.
The most systematic among the currently existing and applied approaches in measuring Orthodox religiosity in Russia is the method developed by Chesnokova (Чеснокова 2009). It is based on the construction of the “Index of churching” (short “V-index”, Russian: “в-индекс”, “в” transcribes as the Latin letter “v” which stands for “воцерковлённость” translated as “churching”).
Churching is characterized as a change in one’s way of life, behavior, and practices caused by conversion to Orthodoxy, and, accordingly, the adoption of a certain belief system. Churching is measured using the V-index, which includes five main indicators: Frequency of attending church services, frequency of confession and communion, observation of fasting, frequency, and type of prayer (church prayers or prayers in one’s own words), and reading of sacred texts. These practices are the key to contemporary Orthodox church life. Each indicator is measured on a five-point scale. The respondents are subsequently classified according to their maximum response level on any of the five scales. In total, there are five groups: (1) “zero group”—the weakest in terms of the level of churching (i.e., “do not attend services”, “did not receive communion”, “do not read holy scripture”, “do not pray”, “do not fast”); (2) “weak churching”—those who selected the second position on any of the five scales at least once, without rising higher; (3) “beginners”—everyone who reached at least the third position at least once; (4) “semi-churching”—those who reached the fourth position on at least one variable; (5) “full churching”—everyone who attained the fifth and highest position at least once on any of the subscales. The main indicators can be supplemented by several additional questions (knowledge of the Church Slavonic language, presence of liturgical literature in the home library, knowledge of the Christian creeds, and participation in the restoration of churches, icons, religious literature). These supplementary indicators allow for an increase in the respondent’s position on the “Index of Churching”. Thus, this scale neither uses a summary or an average score to assess nor does it take into account the unbalanced scores of different participants for the categorization of one’s religiosity.
The Churching Scale is a relatively recent development but has already been adopted for others than the Christian Orthodox religious communities in Russia. Sinelina further developed this approach and applied it in several studies. She constructed a similar measure to study the religiosity of Muslims, which allowed for the examination of the Orthodox and Muslims based on comparable scales. For example, Sinelina discussed the relationship between churching and superstitious behavior (Синелина 2006, 2013).
The V-scale remains one of the most elaborate and well-thought-out approaches to measure Russian Orthodox religiosity. Its main advantage is the possibility to take different religious practices into account simultaneously. The inquired practices constitute the core of people’s faith life. However, Chesnokova’s approach assumes a certain dynamic—from the lowest to the highest degree of churching. The operationalization is of that kind that the respondents “accumulate” points in different domains of faith life and by that summary score are categorized on different levels of churching. In the early 1990s, when Chesnokova developed this method, such an approach was relevant. Many people had joined the Church recently. There was a great lack of church infrastructure and priests. Most of the newly converted Orthodox did not have any experience in a church way of life nor were they socialized religiously. In this case, each little step on the way of churching was significant. This is directly reflected in the logic of the V-index construction which is based on the respondent’s strongest answer.
Nevertheless, in the current situation, the second decade of the 2000s, the approach of the V-scale is much less relevant as churches have been rebuilt and information about, as well as the access to the religious communities, is greatly available. Hence, the low level of the core religious practices in Russia can no longer be explained so easily. Therefore, the rationale of the V-scale has been criticized. Criticism came, for example, from Lebedev and Sukhorukov (Лебедев and Сухоруков 2013), who claim that the V-scale overestimates the number of churched Orthodox Russians. They also scrutinized the question wording and pointed out the flaws in some of them (for example, combining several issues in one question, like type and frequency of personal prayer). Hence, there is room for improvement or alternatives, еspecially in the domain of multidimensional scales assessing religiosity, as Prutskova and Markin conclude (Пруцкова and Маркин 2017).
In comparison to the Index of Churching, the Centrality of Religiosity Scale (CRS) approach discussed in the current paper, allows for a detailed study of several dimensions of Orthodox religiosity—not only private and public practice, but also intellect, ideology, and religious experience. The questions are worded much more elaborately and a more appropriate logic consisting of a total centrality score computation is used. It allows for the comparison of different religious traditions based on the same indicators and takes both the interactive (a human being with a personalized entity) and participative (human being with a universal principle or the like) patterns of spirituality into account.
The CRS already proved its suitability for large-scale comparison in and among different countries and religious traditions (
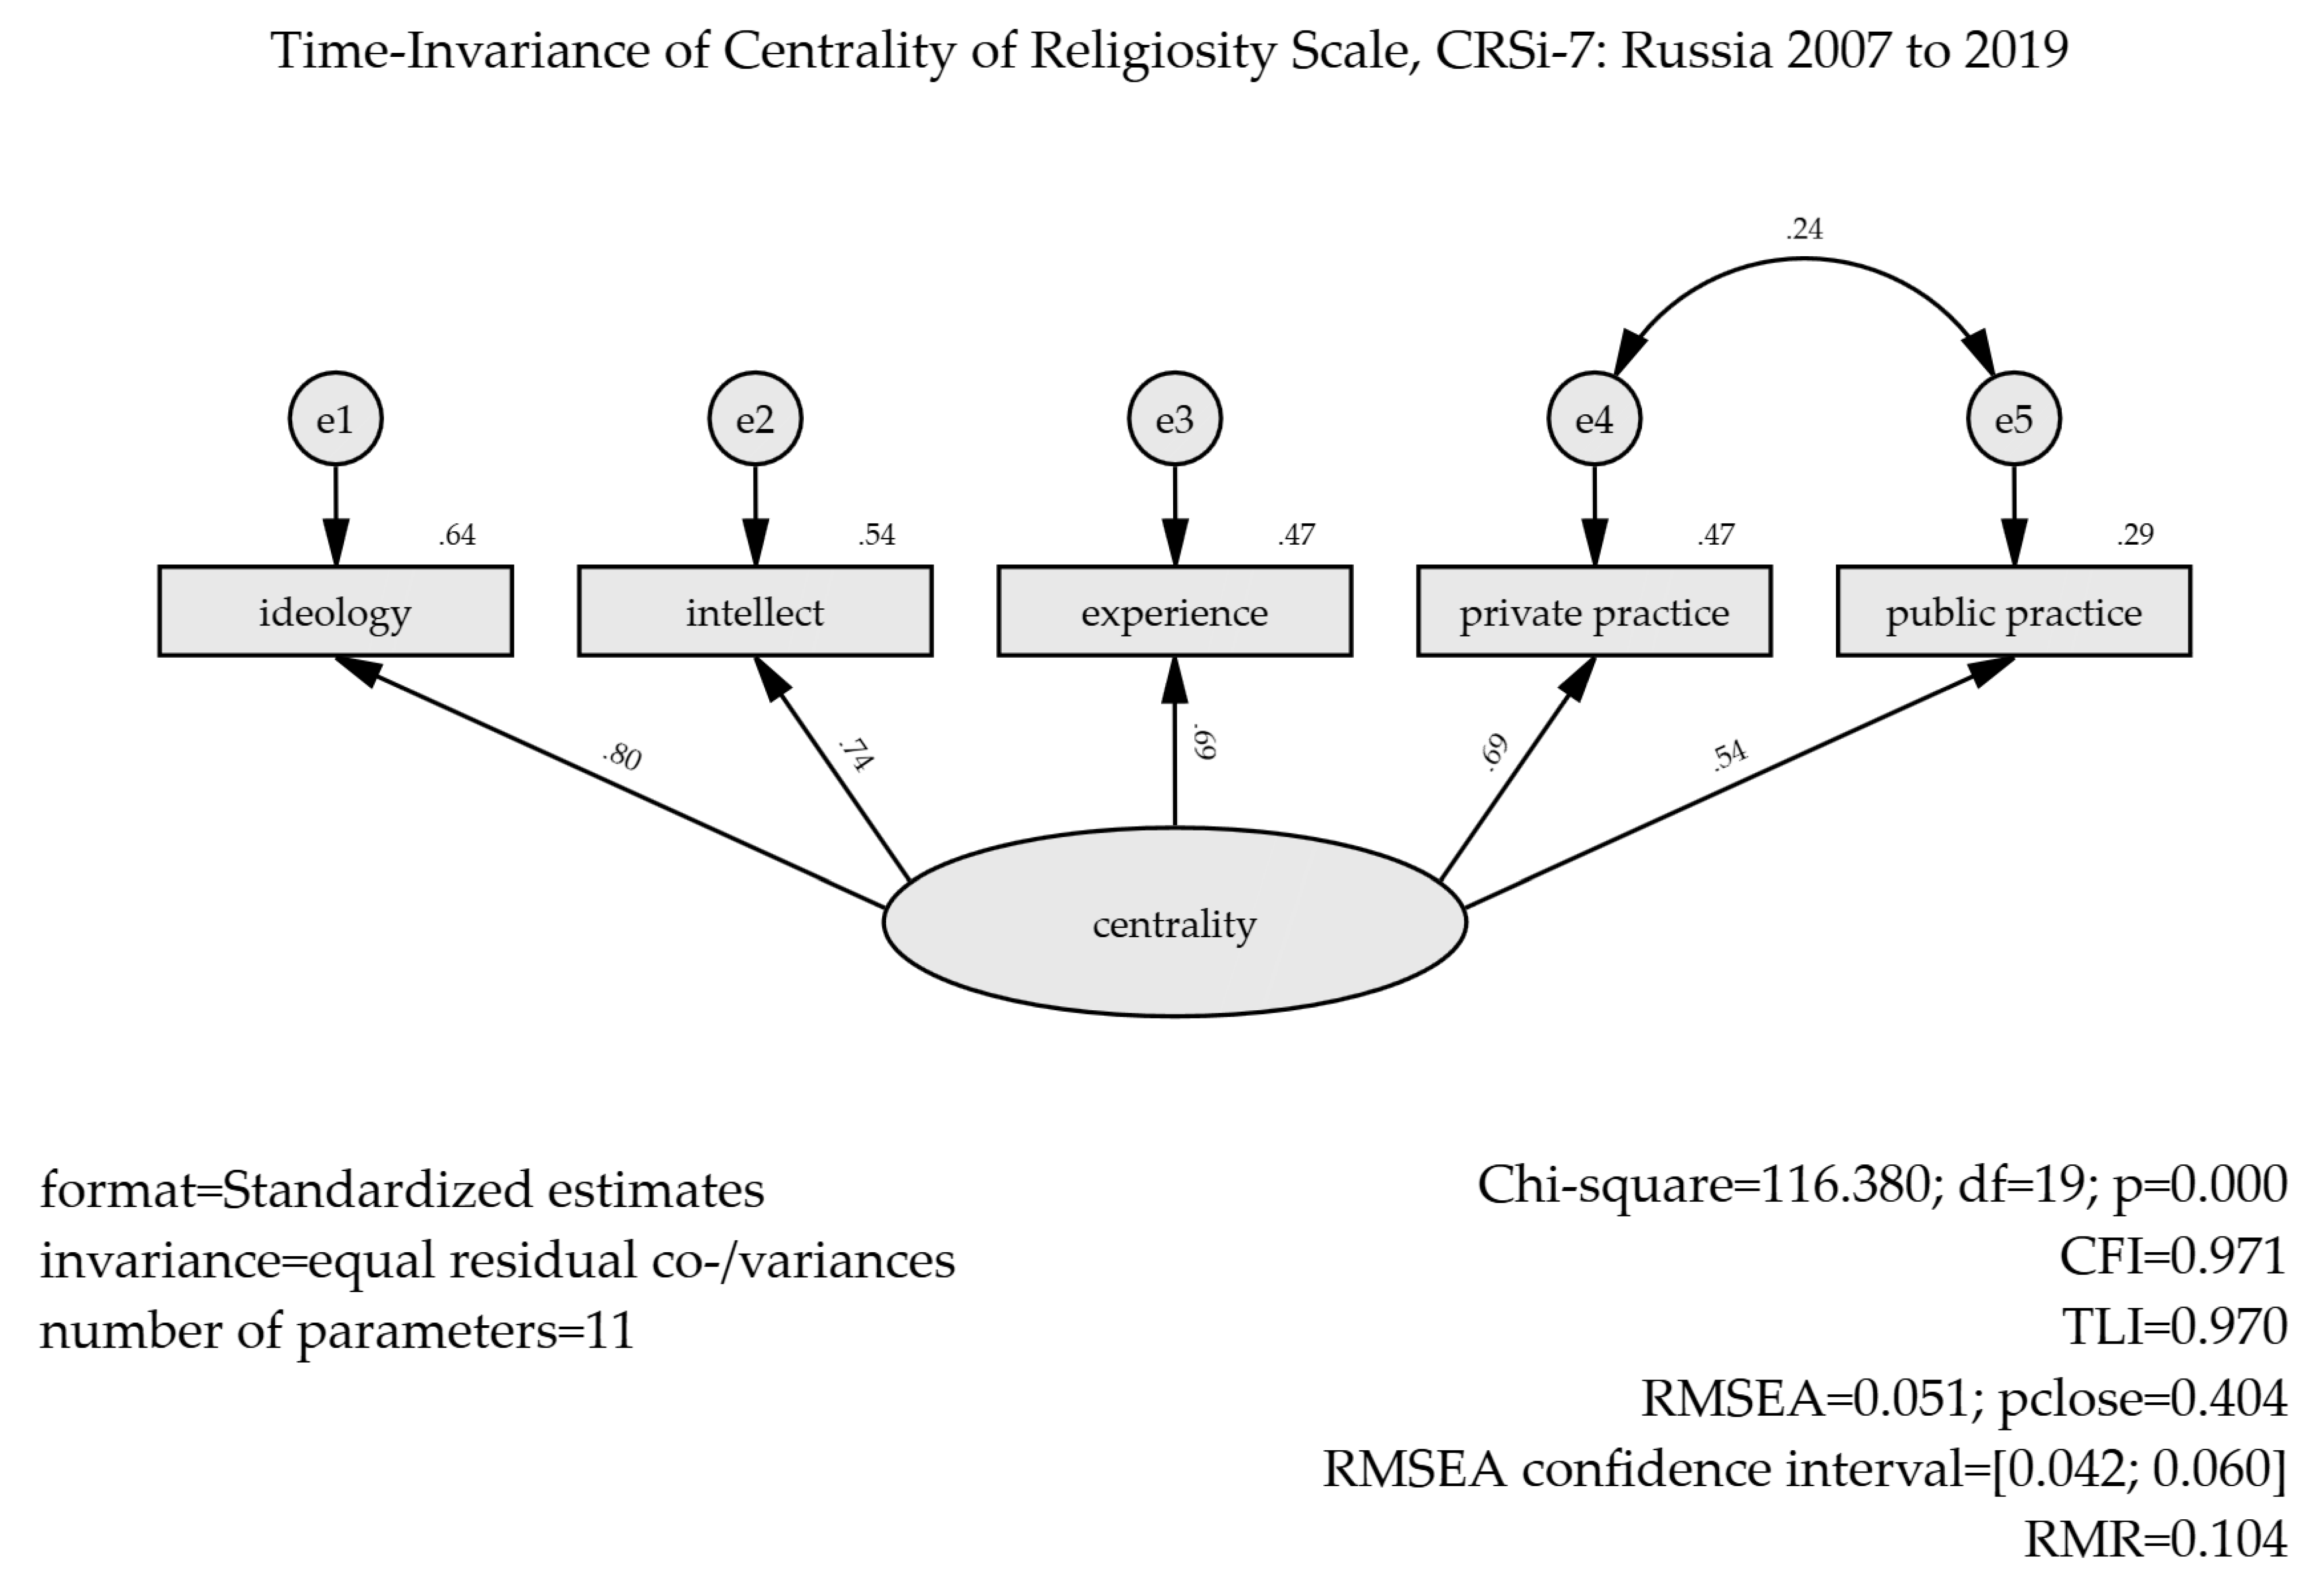
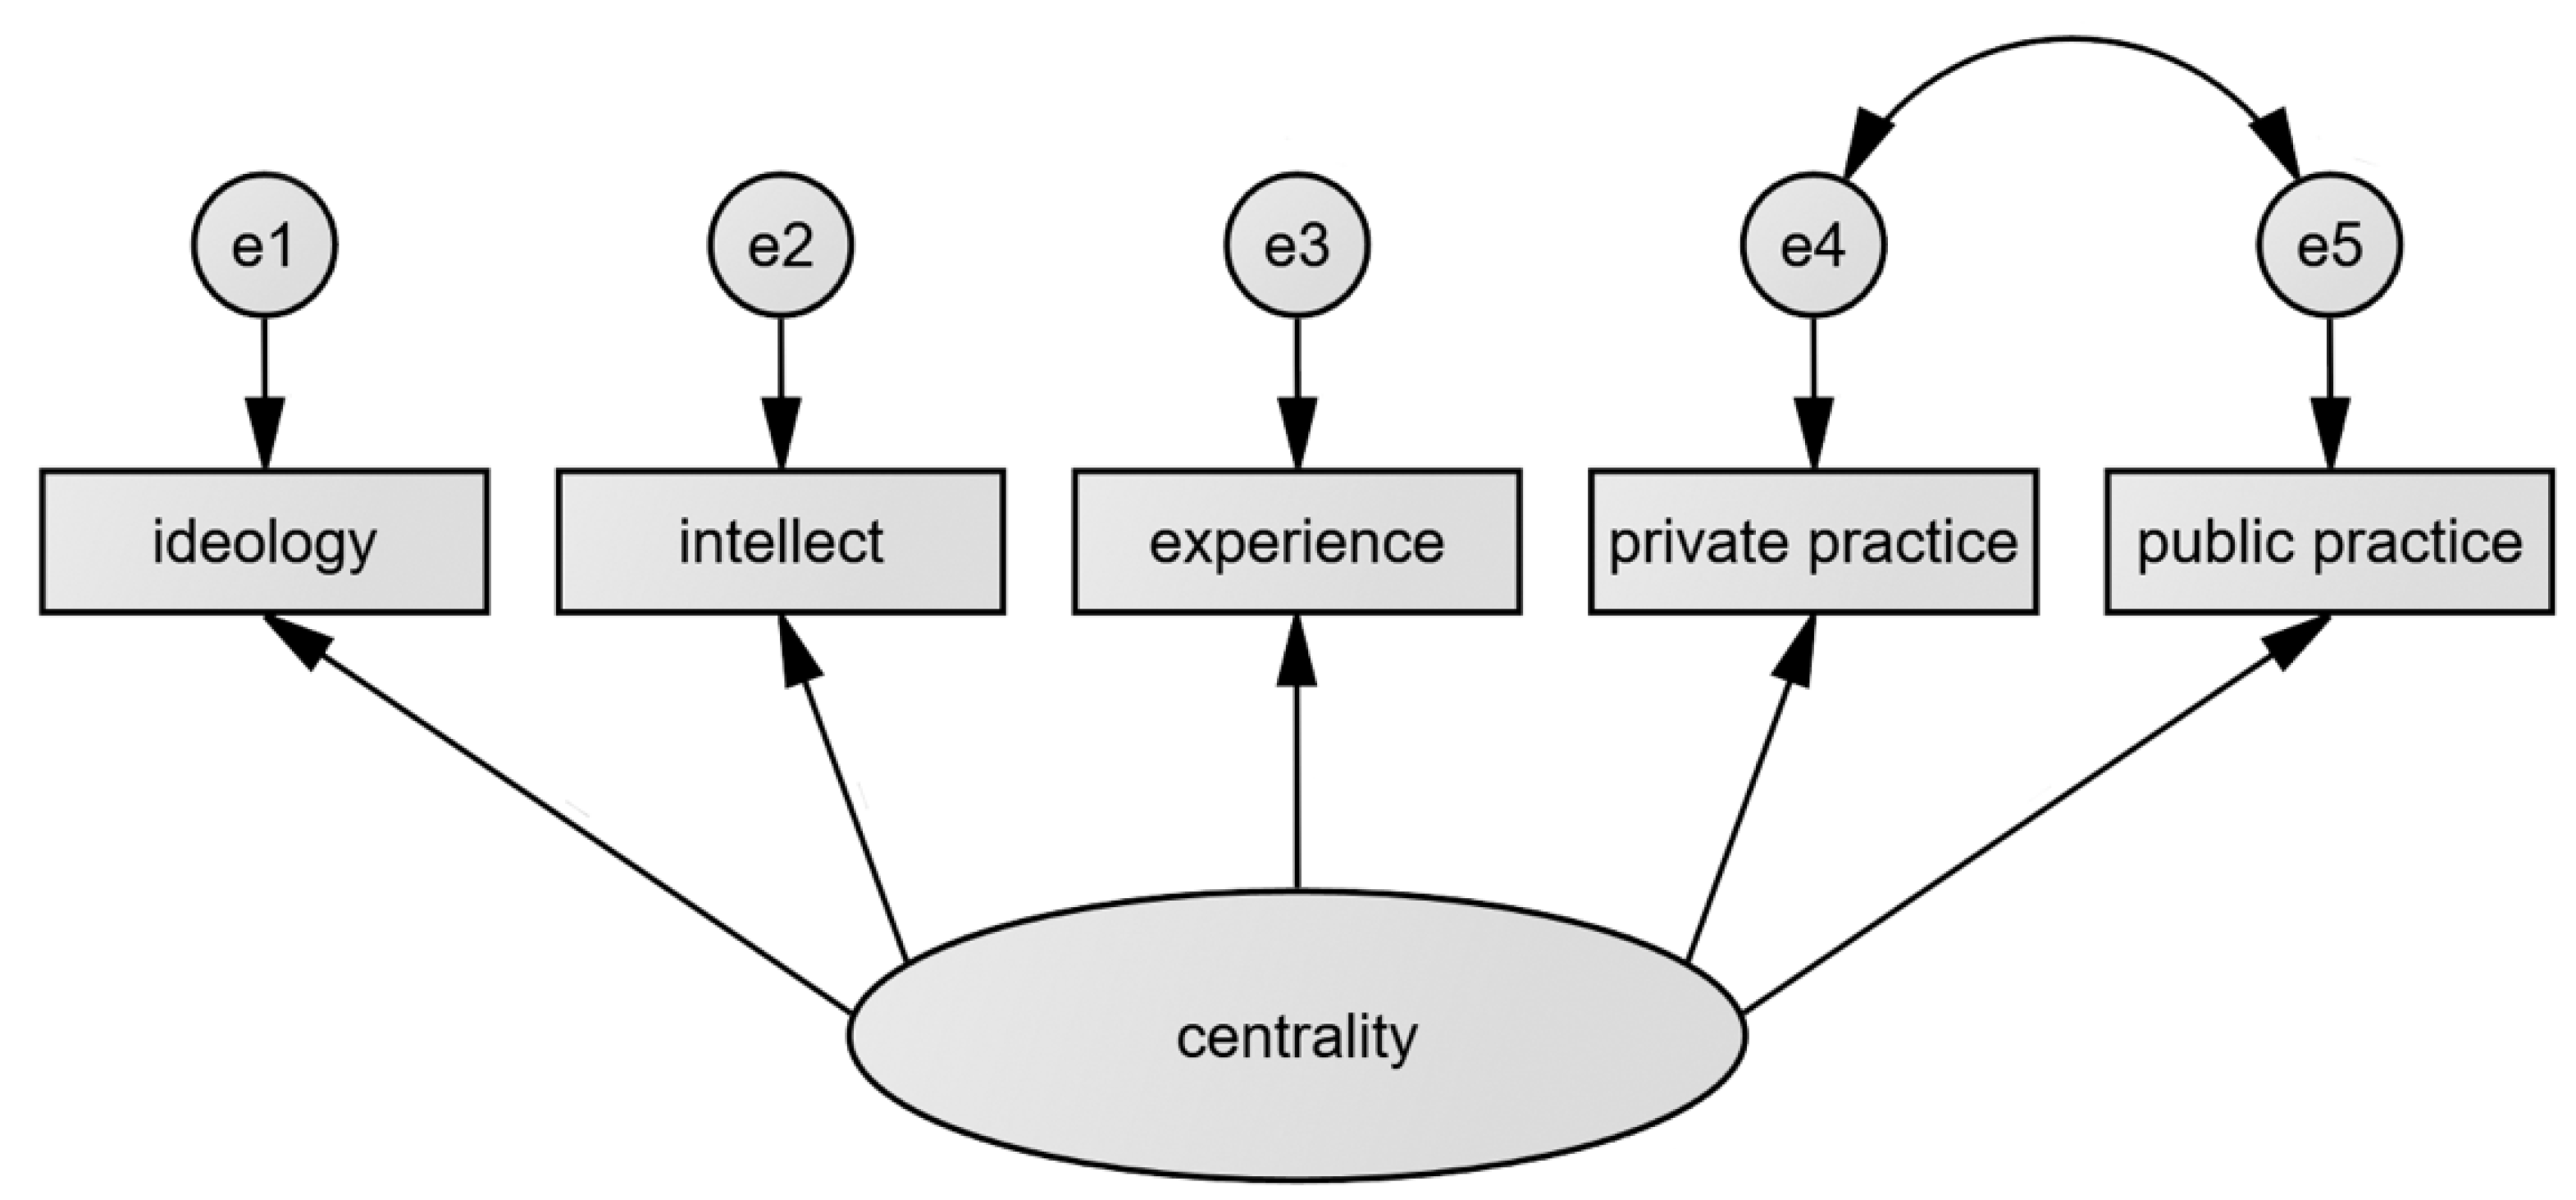
Huber and Huber 2012), but this is not enough. In this paper, we argue that for the empirical examination of the changes of religiosity in a country or a religious tradition or among them a scale should not only be multidimensional and show good internal reliability, but also have consistent psychometrical characteristics over time, in other words, to be time-invariant. Regarding the time-invariance examination of the CRS, it has been studied in the Christian Orthodox tradition of Georgia. In that study by Ackert et al. (
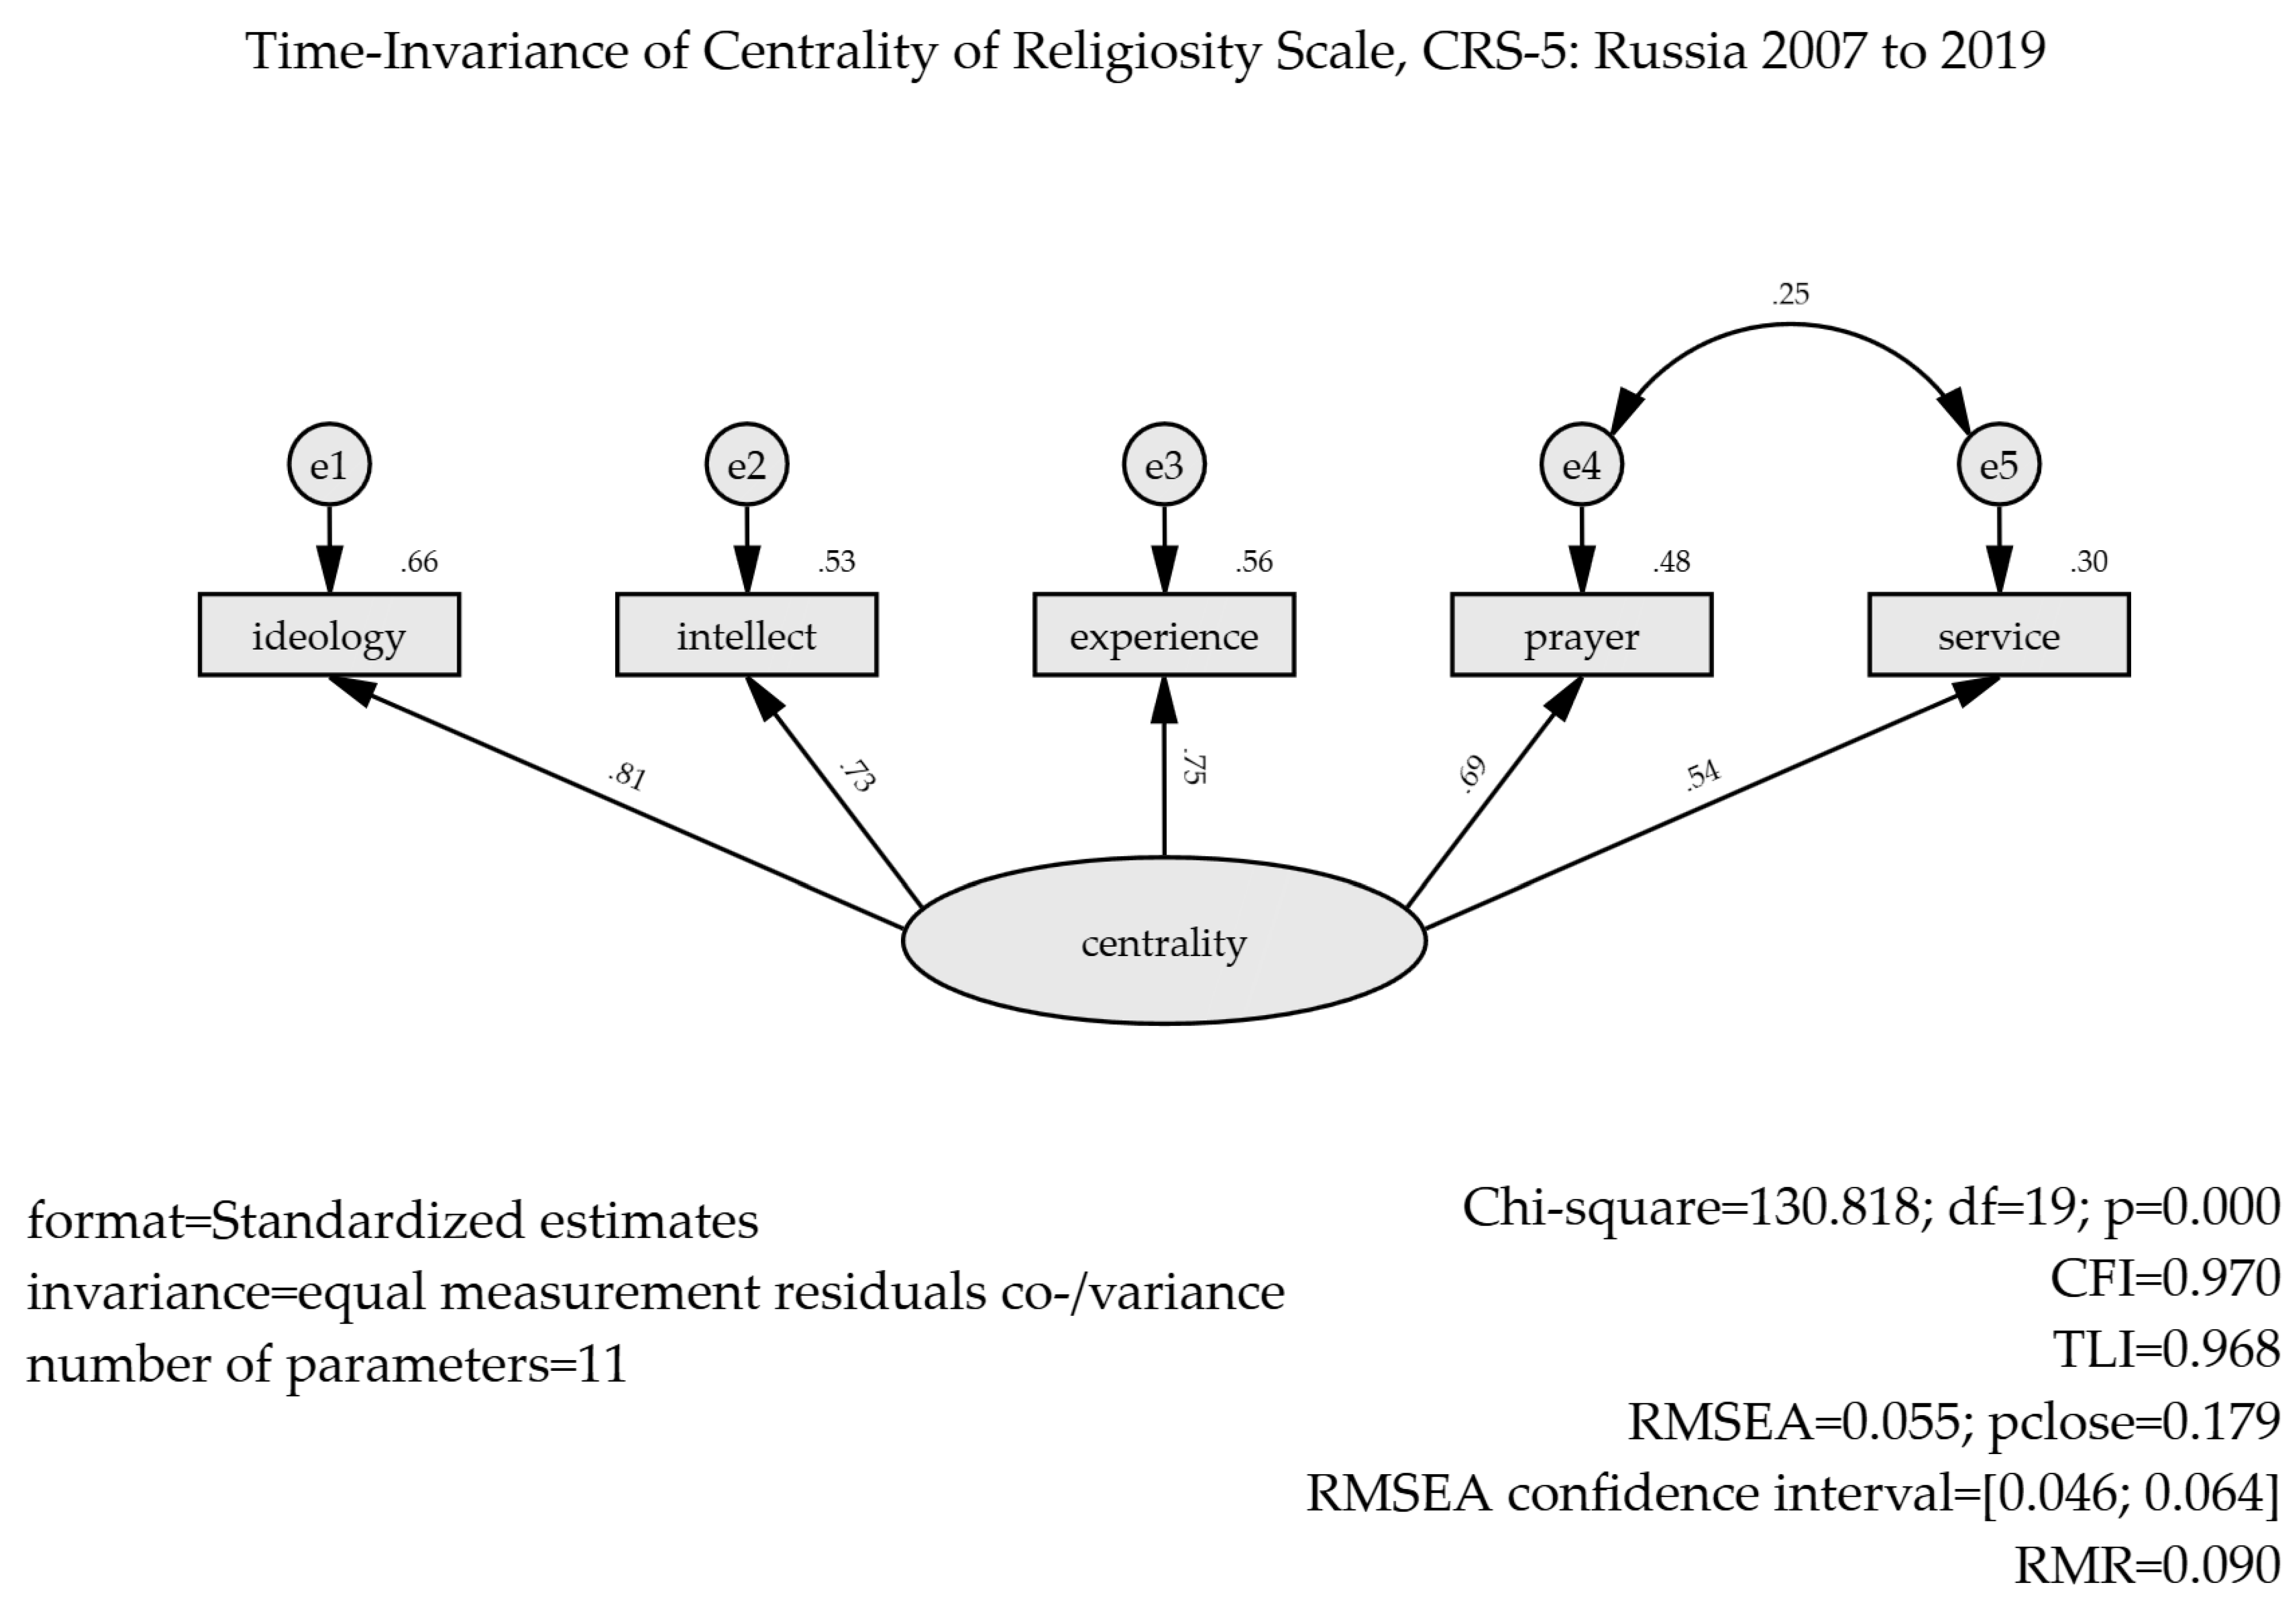
2020), the scale demonstrated good statistical fit with one particularity of an extra-factorial association between the private and public practice core-dimensions. We, therefore, pick this observation and integrate it into the present analyses as a test of the particularity of the Christian Orthodox Churches.

1.2. Centrality of Religiosity Scale

Speaking about religiosity in Russia, the term is defined as a personal psychological trait in demarcation to religion as an organized, tradition-oriented social phenomenon and to spirituality as a privatized, experience-oriented, individual phenomenon (Streib and Hood 2016, p. 9). In the present study, religiosity is operationalized by the Centrality of Religiosity Scale. The Centrality of Religiosity Scale (CRS) was developed by Huber (2003) as a synthesis of the sociological religiosity model by Charles Y. Glock (Glock 1962; Stark and Glock 1968) and the psychological religiosity model by Gordon W. Allport (Allport 1950; Allport and Ross 1967). The CRS found wide application as the five- and seven-items-versions of the scale (CRS-5, CRSi-7) were integrated into the international Religion Monitor of the German foundation “Bertelsmann Stiftung” (
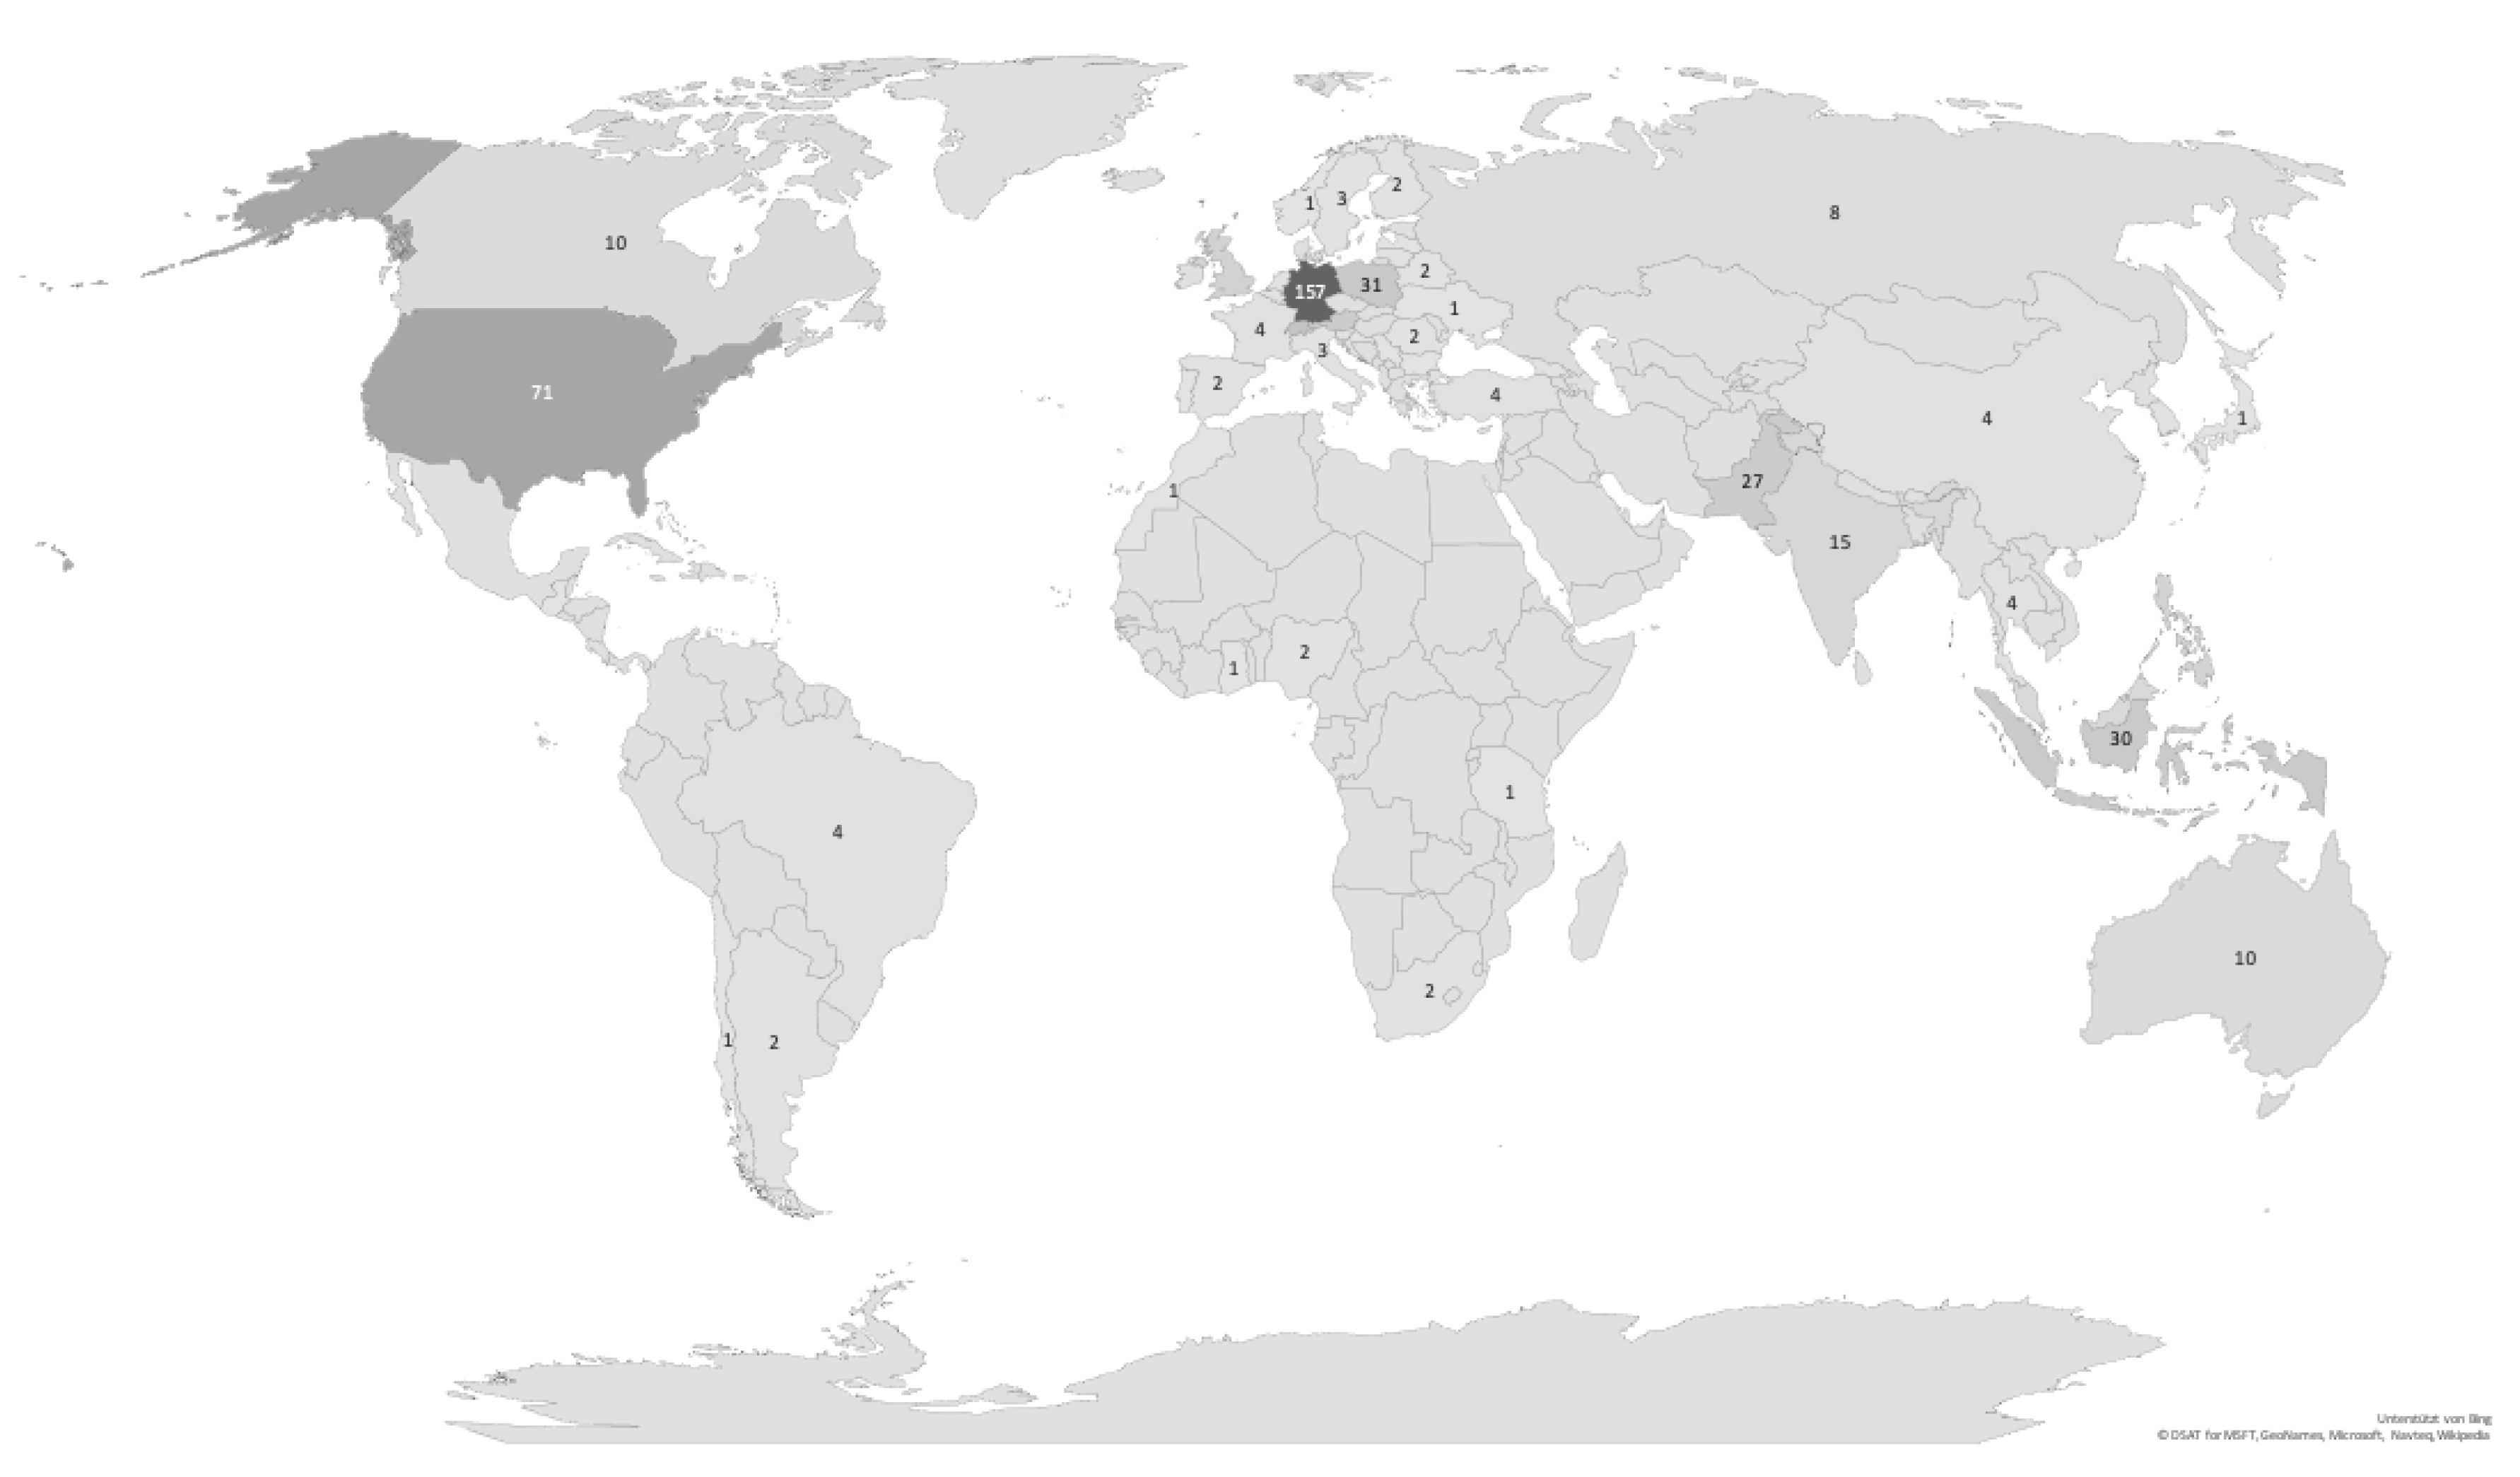
Huber 2009). In the 17 years since the first publication of the CRS (Huber 2003), 6101 applications of this scale have been documented so far (see Figure 1 for a global overview of the applications).
An introduction to the construction principles of the CRS, the core-dimensions of religiosity, the coding of the indicators, the application in different religious cultures as well as the different versions of the CRS is provided by Huber and Huber (2012). In this article, we will therefore only briefly describe the basic ideas, the five core-dimensions, and the composite score, or in other words the CRS-index.

1.2.1. Basic Concepts

The measurement strategy of the CRS is based on the following assumptions. First: Individuals mainly articulate their religious attitudes, experiences, and behavior in five core-dimensions i.e., ideology, intellect, experience, private practice, and public practice. Second: The more central religiousness becomes for a person, the more frequently and intensively she or he expresses her or his religiousness in form of the five core-dimensions. Third: The measurement of the general intensity of the five core-dimensions allows for an estimation of the centrality of religiosity, which is a personal construct (Kelly 1991).

1.2.2. Core-Dimensions of Religiosity

According to Huber (2003), there are five so-called core-dimension in which the religious life of a human being is given expression to:
  • The ideological dimension refers to the social expectation that religious individuals have beliefs regarding the existence and the nature of a spiritual reality. A general indicator of this dimension should exclusively focus on the aspect of the plausibility of the existence of spiritual experience without determining certain concepts of the nature of this reality. This can be achieved by concurrently referring to a theistic and pantheistic concept of the spiritual world—the existence of God or something divine.
  • The intellectual dimension refers to the social expectation that religious people have some knowledge of religion and that they can explain their views on transcendence, religion, and religiosity. A general indicator is the frequency of thinking about religious issues. It indicates how often religious contents are activated in personal reflections.
  • The experiential dimension refers to the social expectation that religious individuals have “some kind of direct contact to an ultimate reality” (Glock 1973). In line with theistic and pantheistic concepts of the spiritual reality two basic patterns of religious experiences can be postulated. In correspondence with theistic concepts, the interactive experiences of God, e.g., the experience of a situation in which God or something divine intervenes in somebody’s/a person’s life. In correspondence with pantheistic concepts the participative experiences of the spiritual reality, e.g., the experience of a situation in which somebody feels they are one with everything.
  • The dimension of private practice refers to the social expectation that religious individuals devote themselves to the spiritual reality in individualized activities and rituals in private space. There are two basic and irreducible forms of addressing oneself to a spiritual reality—prayer and meditation. In prayer, a transcendent counterpart is addressed. This implies an interactive pattern of spirituality and corresponds with theistic concepts of spiritual reality. In contrast, meditation is structured regarding either one or both of the following: The self or an all-pervasive principle. Therefore, it is more in line with a participative pattern of spirituality and corresponds with pantheistic concepts of the spiritual reality and respective types of religious experiences.
  • The dimension of public practice refers to the social expectation that religious individuals belong to religious communities, which are manifested in the public participation in religious rituals and communal activities. The general intensity of this dimension can be measured easily by inquiring about the frequency with which somebody takes part in religious services or similar activities.

1.2.3. Centrality of Religiosity Index

Each core-dimension is represented in the various forms of the CRS by an equal number of indicators—either one, two, or three indicators, which results in the CRS-5, CRS-10, and CRS-15, respectively. This means that the five core-dimensions are equally weighted in the CRS index, which is calculated as the average score over all core-dimensions. The same principle applies to the interreligious versions of the CRS—the CRSi-7, CRSi-14, and CRSi-20 in which only the higher of two alternative indicators for one dimension is counted. The only two core-dimensions that have alternative indicators are experience, i.e., the interactive and participative pattern of experience, and private practice i.e., prayer and meditation. If, for example, both the frequency of prayer and the frequency of meditation are asked, only the higher value of both indicators is included in the calculation of the CRS index. Therefore, the two alternative indicators in the CRS only have the weight of one indicator. In this article, we only focus on the short forms: The CRS-5 and the CRSi-7. The seven items are (see also Appendix A for a comprehensive translation of the CRS):
  • How often do you think about religious issues? (in CRS-5 and CRSi-7, core-dimension: Intellect).
  • To what extent do you believe that God or something divine exists? (in CRS-5 and CRSi-7, core-dimension: Ideology).
  • How often do you take part in religious services? (in CRS-5 and CRSi-7, core-dimension: Public practice).
  • How often do you pray? (in CRS-5 and CRSi-7, core-dimension: Private practice).
  • How often do you meditate? (only in CRSi-7, core-dimension: Private practice).
  • How often do you experience situations in which you have the feeling that God or something divine intervenes in your life? (in CRS-5 and CRSi-7, core-dimension: Experience).
  • How often do you experience situations in which you have the feeling that you are in one with all? (only in CRSi-7, core-dimension: Experience).
The measurement is based on a rating of Likert-scales. Two types of ratings are provided: Importance and frequency. Participants are asked to rate ideology in a range of “very much so (5)—quite a bit (4)—moderately (3)—not very much (2)—not at all (1)”, which is the only importance rating in the CRS-5 and CRSi-7 versions. The plainest subjective type of frequency rating is applied to the intellect and experience core-dimensions: “very often (5)—often (4)—occasionally (3)—rarely (2)—never (1)”. Public practice is assessed by an objective seven-point frequency scale: “several times a day—once a day (7)—more than once a week (6)—once a week (5)—one to three times a month (4)—a few times a year (3)—less often (2)—never (1)”. Finally, public practice is assessed by objective frequency in six answer options “more than once a week (6)—once a week (5)—one to three times a month (4)—a few times a year (3)—less often (2)—never (1)” (see Appendix A, Table A3 for details). After the assessment, the answers are recoded according to a calculation proposed by the author of the scale (Huber and Huber 2012). Finally, all indicators of the CRS range between 1 and 5 with 1 being the minimum and 5 the maximum values.
The CRS index is a composite score based on the average of all items and ranges from 1 to 5. According to Huber and Huber (2012) three groups can be distinguished based on the CRS index—the “highly religious”, the “religious”, and the “non-religious”. If the CRS index is higher than 4.0, the respondent is categorized as “highly religious”. This means that she or he has a profound religious life. In this case, faith likely plays a central role in her or his life. If the CRS index is lower than 2.0, the respondent is categorized as “non-religious”. This means that she or he has almost no faith life. In such a case, it is very likely that religion does not matter to her or him at all or only has little influence. If the CRS index is between 2.0 and 4.0, the respondent is categorized as “religious”, which means that faith is lived sporadically. Religion is present and a part of that individual’s life but does not play a central role in life decisions.

1.3. Study Goals and Hypotheses

Before coming to the main goal, there are some notable byproducts to mention. The study should deliver norm values of every core-dimension in Russia and can be used as a reference for future investigations with the CRS in Russia. Besides the norm values, which are of statistical nature, the translated CRS items are provided in Appendix A to facilitate a unified use of the CRS in Russian.
The main goal of this study is to test the statistical validity, consistency, and performance of the short forms of the CRS in Russia. The CRS is in itself a psychometrical measurement instrument that is based on the concept of the centrality of religiosity—a personality construct. Such constructs are said to be relatively stable over time in an individual. Technically spoken, we therefore expect that both short forms, the CRS-5 and the CRSi-7, have a time-invariance in measurement corroborated by confirmatory factor analysis (CFA) with one latent variable and five reflective indicators. The latent variable in the CFA statistically represents the concept of “centrality of religiosity” and is said to be relatively stable. Hence, stability is operationalized as configural invariance over time. Reliability analysis, on the other hand, refers to the consistency of the structural equation model. Moreover, starting with configural invariance we restrict the models and establish metric invariance. Regarding the mean structure in the CFA, no hypotheses are posed on its invariance between the two time points of assessment. This is done because the main interest lies in the consistency of the measurement and less in the changes in the centrality of religiosity in the population, which we describe but do not test statistically.
We expect the CRS-5 to perform better, in terms of having a better model fit than the CRSi-7 due to the mainly Orthodox samples, which are largely Christian and therefore Abrahamitic, making them more suitable for the dialogical formulation of the items incorporated by the CRS-5.
Considering the association of private and public practice in Orthodox church traditions we postulate a stable association between these two dimensions. This association is extra-factorial and therefore is captured by the residuals of the indicators of both practical dimensions. Such an association was already found in the mainly Orthodox samples from Georgia (Ackert et al. 2020) and is to be corroborated in this investigation. This means, in addition to the main goal of the validation of the scale, that this study explores the potential of the CRS to capture the particularities of religious traditions with the example of Christian Orthodoxy in this article.

2. Method

2.1. Translation

The CRS was originally published in German and English (Huber 2003; Huber and Huber 2012), therefore, its application in Russia is preceded by its translation. The translation procedure took place in two parts. In the first round, the short forms CRS-5 and CRSi-7 were translated into Russian by the Bertelsmann foundation project team in 2007. The second round was done by the Religion & Economics project team in 2016 while the intermediate CRS-10, CRSi-14, and long forms CRS-15, CRSi-20 were added to the translation of the short forms. The article “The Centrality of Religiosity Scale (CRS)” by the author of the scale (Huber and Huber 2012) was entirely translated into Russian (Хубер and Хубер 2019) as a byproduct, rendering all items for the use in this language. See Appendix A, Table A1 for an overview of the items after translation and Table A2 for the item composition of the short, intermediate, and long form of the CRS. Appendix A provides items of all forms of the scales. However, only the short forms of the CRS-5 and CRSi-7 are tested and validated statistically in the presented article.

2.2. Procedure

On a larger scale, the CRS was applied in Russia three times since its publication. The first application took place within the international project Religion Monitor in 2008 (Rieger and Stiftung 2009). The second time the CRS was applied within the international project on Religion and Economics between Russia and Switzerland in 2019. The same year another project at the same lab “The Paradox of Interrelation between Religion and Family in Modern Russia” made use of the CRS. Data from both 2019 projects in Russia were combined into one sample. From all the named surveys only data from Russia are analyzed in the current paper. Data collection was done in 2007 and 2019 by specialized polling institutes via computer-assisted telephone interviews and online surveys supervised by the leading researchers in the teams.

2.3. Samples

Stemming from three projects with different goals and with different data management concepts, the data had to be harmonized for the analyses. The first dataset comes from the Religion Monitor’s 1st wave (most recent dataset, (Huber and Stiftung 2010)) from 2007. However, the data were first available in 2008, therefore, hereafter it is abbreviated as RM08, with a total amount of N = 1002 respondents. Data were collected according to a five-stage sampling plan, where administrative districts or agglomerations are the first stage, towns and rural soviets are the second stage, voting districts are the third stage, households at the fourth stage, and randomly selected respondents at the final fifth stage. Sampling units in the first three stages are drawn with a probability-proportional-to-the-unit-size method. Households are drawn systematically from the list of addresses and the “last birthday”-procedure is used for random selection of a respondent in the household. All respondents are aged 18 years or older.
The second dataset is derived from two projects, which took place at the same lab in 2019. The first portion of the second sample comes from the “Project on Religiosity and Economics” and the second portion was collected within the project “The Paradox of Interrelation between Religion and Family in Modern Russia”. Hereafter, this dataset is abbreviated as RE19, with a total sample size of N = 1768 respondents. Details on the demographical characteristics of the samples before data preprocessing are listed in Table 1. The data selection and preparation are described in the following paragraphs.

2.4. Data Preparation

The samples were preprocessed before the main analyses resulting in an equal sample size of N = 984. The RM08 dataset is a population-representative dataset and therefore served as a template for the matching procedure. The two datasets RM08 and RE19 were matched via a statistical procedure according to recommendations by Ho et al. (2007). The matching of two datasets reduces the model dependency on unequal distributed covariates. The data were taken from two different projects, therefore not many variables overlapped. In addition to the items of the CRS, three demographical variables were chosen as covariates for the matching process i.e., “sex”, “age” and “religious affiliation”. One major reason for this decision is that the homogenization of the categories could not be applied to any other variable in the datasets. Nevertheless, sex and age are important sociodemographic determinants whereas religious affiliation is related to the patterns of religious behaviors and attitudes. Controlling for them means reducing the bias of these sociodemographic and religious covariates. Even though harmonization was not possible for education, the distribution of the educational level in RM08 24.7% indicated to have between 10 to 17 years of education, 34.5% indicated 11 to 21 years, and 27.9% indicated more than 21 years of education including kindergarden. Of the respondents, 12.9% provided no sufficient data to indicate their educational level. In RE19, the categories were somewhat different: 3.8% had basic secondary education or lower, 43.9% had upper secondary or professional education, 51.1% had tertiary education, and 1.1% had a doctoral degree, 0.1% gave no answer.
All cases in the two datasets are compared and paired according to covariates and not according to the items of the CRS. The variables “age” and “sex” did not need any transformation. “Age” was an integer scale from 18 to 93. “Sex” was a dichotomous variable with two instances “female” and “male”. The variable “religious affiliation” was aggregated into three categories “Christian”, “other”, and “none”. Respondents who had a missing value on religious affiliation were excluded from further analysis (18 respondents in 2008th and 39 respondents in 2019th dataset) resulting in no missing values on covariates. CRS variables had some missing values that were imputed in the next step right before the matching.
The matching procedure requires data with no missing values on the target variables as well as the covariates, therefore multiple imputations (Schafer [1999] 1997) were done in IBM AMOS® Version 26 (IBM, Armonk, NY, USA) using the stochastic regression imputation according to Little and Rubin (2002). We do not apply listwise deletion as this method would lead to a loss of power in the successive analyses. In the RM08-dataset 4.8% and in the RE19-dataset 3.2% of the data had missing values. Table A4 in Appendix B summarizes the missingness in the data before imputation. Each dataset received 10 copies with imputed values. The sets of 10 datasets each were aggregated using the mean function and rounded to integers. As a result, the datasets RM08 and RE19 had no missing values on the CRS items and were ready to be matched.
For the matching procedure in R (R Development Core Team 2020) the package “MatchIt” was used (Ho et al. 2007, 2011). The fact that the RE19 dataset has 1.76 times more cases allows the application of the so-called optimal matching algorithm that “finds the matched samples with the smallest average absolute distance across all the matched pairs” (Ho et al. 2011). That means that every case in RM08 receives the optimal match on its covariates in RE19. The results of the matching procedure can be found in Appendix B. A summary of the sample characteristics after matching and before data analysis is listed in Table 2.

2.5. Analytic Plan

For the analysis, the authors of the original scale recommend recoding the answers of the private and public practice from a 7-point to 5-point scale (Huber and Huber 2012). We followed these recommendations, which led to an all-equal 5-step scale for all core-dimensions. Such an equal metric on all CRS items facilitates the interpretation of the statistical models and comparison of its parameters in further steps.
Firstly, descriptive statistics and reliability calculations with τ -equivalent—better known as Cronbach’s α —and congeneric reliability—we make use of McDonald’s ω —were done. Differences between the mean CRS-scores in the two samples are reported along with their statistical significance. The calculation of the effect sizes Cohen’s d is done using a formula provided by Borenstein (2009).
In a second step, we run an exploratory factor analysis (EFA) for both short forms of the CRS (CRS-5 and CRSi-7) in both datasets (RM08 and RE19) to test the plausibility of the one-factor solution in the following CFA.
After the EFA a multigroup confirmatory factor analysis (multigroup-CFA) was modeled for the examination of time-invariance of both scales. In the following subsections, we report on the procedures and parameters of the EFA and CFA.

2.5.1. Notation

Throughout the result and discussion sections, we use common naming rules. We refer to a so-called “latent X”-notation e.g., found in Timothy A. Brown’s book on CFA (Brown 2015). Thus, parameter estimates in factor analyses are labeled with Greek letters: λ —factor loading, τ—intercept of the indicator, κ—factor mean, φ—factor variance, δ—with one-digit subscript designates variance of residual, δ—with two digits subscript designates covariance of residuals, ξ represents the factor. Parameter estimates for the core-dimensions receive subscripts with a numbered x : x 1 for ideology, x 2 for intellect, x 3 for experience (interactive and participative), x 4 for private practice (prayer and meditation), and x 5 for public practice. For example, according to this scheme λ x 3 stands for the factor loading of the experience core-dimension, δ x 45 is the covariance between the two residuals of private and public practice, and r x 1 x 2 labels the correlation between the ideology and intellect dimensions and so on.

2.5.2. Exploratory Factor Analysis

Exploratory factor analysis lets us examine whether the expected one factorial structure of the scales is truly suitable for the subsequent CFA. Therefore, EFA is calculated with the following model parameters: Maximum likelihood estimator (ML), varimax rotation (applies only if the number of factors is greater than 1). Factors are considered as such by having an eigenvalue > 1. After having considered the results of the EFA, we formulated the proper models for the multigroup-CFA.

2.5.3. Confirmatory Factor Analysis

After the EFA we move on to the CFA, first verifying whether the distributions of the indicators are suitable for the CFA. Checks on the distributions of the CRS-items reveal that the variables in the datasets are not multivariate normally distributed, which is a prerequisite of structural equation modeling (SEM). Modern statistical software packages provide estimators that are robust to deviations from the mean and variance of normally distributed data but are less suitable for deviations in skewness and kurtosis. Therefore, we use a method for examining the multivariate skewness and kurtosis proposed by Mardia (1970). See Table 3 for more details on multivariate skewness and kurtosis examination conducted according to recommendations of Cain et al. (2017). Violations of multivariate normality have minimal effects on type I errors (i.e., rejecting the null hypothesis when it is true). Still, as a correction to the distribution distortion models, the model estimates were calculated with 90% bootstrap confidence intervals.
The CFA was done to test a hypothesis of metric invariance of the CRS-5 and CRSi-7 over time, which is between the two sampling time points in 2007 and 2019. The EFA revealed a one-factor structure in all 4 analyses, therefore a time-invariance of a “centrality of religiosity”-factor by 5 indicators (here: the core-dimensions of the CRS) seemed plausible to model. Furthermore, the correlations matrix reveals that the core-dimensions are associated in a range of r = 0.38–0.64 for the CRS-5 and in a range of r = 0.33–0.59 for the CRSi-7. Therefore, each core-dimension contributed, especially to the latent variable.
To test the ability of the CRS to statistically point out particularities of certain religious traditions an additional parameter was placed into the CFA. From a study on the time-invariance of the short forms of the CRS in Georgia (Ackert et al. 2020), there is evidence that the practice-related core-dimensions (private and public practice) are closely and stably related to each other in Orthodox dominated culture, which Russia represents. Therefore, we let the residuals of private and public practice covariate and constrain this correlation to be time-invariant. The final structure is presented in Figure 2.
For the estimation of the variance-covariance matrices, we use the maximum likelihood estimator (ML) within the IBM AMOS® software version 26 (IBM, Armonk, New York, USA). Bootstrap 90% confidence intervals with B = 200 drawings were calculated for all parameter estimates and are reported along with the point estimates. Global fit measures are adopted from the recommendations of Hu and Bentler (1999) with an acceptable fit of the models established by the following criteria: R M S E A 0.06 ,   90 %   C I 0.06 ,   p c l o s e > 0.05 , S R M R 0.08 , C F I 0.95 , and T L I 0.95 . These indices inspect different aspects of the model (i.e., absolute fit, fit adjusted for model parsimony, fit relative to a null model). In sum, these indices allow a more conservative and reliable evaluation of the global fit of the model. For the distinct parameter estimates, modification indices bigger than 4.00 (i.e., expected parameter change χ 2 > 4.00 ) are considered as a point of model discussion. The modification indices are considered as a model comparison with 1 degree of freedom and a critical p < 0.05 where Δ χ 2 > 3.84 suggests that the overall model fit can be significantly improved if the fixed or constrained parameter is freely estimated. We round up to 4.00 for practical reasons as it is done by many statistical software packages.

2.5.4. Multigroup Confirmatory Factor Analysis

Multigroup CFA has been applied in the analysis with the aim of the examination of the time-invariance of the scales i.e., its consistency of measurement quality over time. In the analyses, groups are defined by both datasets, RM08 and RE19. Consequently, the differences or similarities in the data can be interpreted as time effects between the years 2008 and 2019. We do not assume that the intercepts of the indicators do not vary over time. In fact, there are hints that they change substantially e.g., if looking at the mean differences in Table 4. Therefore, we do not put any restrictions on the mean vector of indicator intercepts ( τ x 1 τ x 5 ) or the mean vector of the latent means ( κ R M 08 ; κ R E 19 ) in the models. Thus, unlinking the intercept and mean pattern from the co-/variance pattern in the data. The vector of thetas ( τ x 1 τ x 5 ) is allowed to vary freely and the mean of the latent variables of the centrality of religiosity is set to be κ R M 08 = κ R E 19 = 0 . The factor variance of the factors is fixed to φ R M 08 = φ R E 19 = 1 for model identification. In contrast to the freely estimated indicator intercepts, we put restrictions on the factor loadings ( λ x 1 λ x 5 ) first, secondly on the variances of the residuals ( δ x 1 δ x 5 ) , and third on the covariance of the residuals of private and public practice ( δ x 4 x 5 ). This approach results in four models i.e., equal form, equal factor loadings, equal residual variances, and equal residual co-/variances. The restrictions hold each parameter to be equal across groups. Following this rationale, we restrict the co-/variances in the models step by step, working through nesting models to compare them with the conventional goodness-of-fit criteria.

3. Results

3.1. Descriptive Statistic

All means and standard deviations followed by correlations of the core-dimensions as well as of the composite score of the CRS-5 and CRSi-7 are reported in the subsequent paragraphs and tables.
After the recommended transformation of all Likert-answer scales to the same metric ranging from 1 to 5 with 1 being the minimum and 5 being the maximum value, the mean value of M = 3 represents the expected mean of the scale. In the RM08, all dimensions remain below the M = 3 mark ranging from the highest M x 1 = 2.92 (ideology) and the lowest M x 4 = 1.22 (meditation). The composite scores of the CRS-5 and CRSi-7 in RE08 are M C R S 5 = 2.47 and M C R S i 7 = 2.55 , respectively. Thus, the CRSi-7 index shows a higher value in the descriptive statistic coefficient. Considering the standard deviations among all core values ranging from S D x 1 = 1.24 for ideology and S D x 4 = 0.74 for meditation with S D C R S 5 = 0.97 and S D C R S i 7 = 0.96 the difference between the composite scores of CRS-5 and CRSi-7 constitutes 8% of the pooled SD in the RM08-data. A dependent t-test proves a significant but small difference between the composite score values of the two short CRS versions t ( 983 ) = 15.29 ,   p < 0.001 ,   C o h e n s   d = 0.08 .
A similar picture manifests itself in the RE19-data. The ideology core-dimension has the highest mean among all core-dimensions with M x 1 = 3.21 , while meditation has the lowest mean with M x 4 = 1.57 . The composite scores of the CRS-5 and the CRSi-7 differ from each other with M C R S 5 = 2.74 and M C R S i 7 = 2.82 by 0.08, which represents 9% of pooled SD. This difference is significant but small according to a dependent t-test t ( 983 ) = 14.33 ,   p < 0.001 ,   C o h e n s   d = 0.09 .
If we compare the two datasets from the RM08 and RE19 (two most right columns in Table 4) we can see that except for the mean of the core-dimension of public practice which went down by Δ M x 5 = 0.05 all the others went up in a range from Δ M x 3 = 0.21 to Δ M x 2 = 0.46 . The same increase can be seen for both composite scores, which went up by Δ M C R S 5 = Δ M C R S i 7 = 0.27 . At the same time, the standard deviations slightly decreased by a range between Δ S D x 4 = 0.04 to Δ S D x 3 = 0.14 , except for meditation where it is increased by Δ S D x 4 = 0.31 . We do not compare the distinct values through statistical tests as we planned to do a CFA, which allows modeling the differences from RM08 to RE19 on a global level. Before looking at the factor analysis results, we report on the psychometric properties of the CRS-5 and CRSi-7.

3.1.1. Psychometric Properties of the CRS-5

Psychometric characteristics of the CRS-5 are described by some common statistical parameters and show good values for the scale in the given samples. The following coefficients of internal consistency are given with a 95% confidence interval in square brackets. The Cronbach’s α for the RM08-data is α = 0.85   [ 0.83 ; 0.86 ] ; subsequently, McDonald’s ω is ω = 0.85   [ 0.83 ; 0.87 ] . Coefficients for the RP19-data are very similar considering the confidence interval α = 0.85   [ 0.83 ; 0.86 ] and ω = 0.86   [ 0.84 ; 0.87 ] .
Table 5 presents the correlations among the core-dimensions and the total score of the CRS-5. In the RM08-data (left from the slash in each cell), the correlations among the core-dimensions fluctuate between r x 1 x 5 = 0.41 and r x 1 x 3 = 0.59 . The correlations between the total score and the distinct dimensions range between r C R S 5 t o t a l x 5 = 0.70 to r C R S 5 t o t a l x 1 = r C R S 5 t o t a l x 4 = 0.81 . Taking a look at the RE19-data (number to the right of the slash in each cell) the correlations among the core-dimensions go from r x 4 x 5 = 0.38 to r x 1 x 3 = 0.64 . The total CRS-5 score correlates with the distinct subscales in a range from r C R S 5 t o t a l x 5 = 0.72 to r C R S 5 t o t a l x 4 = 0.85 . None of the specific values exceed the correlations with the total score. Taking a glance at the coefficient pairs i.e., numbers in the same cell, one can see that they do not differ by more than Δ r x 4 x 5 = 0.09 . Here it is the correlation of the two religious practice dimensions. No difference regarding the correlations in the two samples is found for Δ r x 2 x 4 = 0.00 , which is the association between intellect and prayer.

3.1.2. Psychometric Properties of the CRSi-7

The CRSi-7 coefficients of internal consistency show numbers comparable to that of the CRS-5. Cronbach’s α for the RM08 is α = 0.84   [ 0.82 ; 0.85 ] and McDonald’s ω differs only in the upper bound of the 95% confidence interval ω = 0.84   [ 0.82 ; 0.86 ] . The internal consistency in the RE19 data moves along the same range α = 0.84   [ 0.82 ; 0.85 ] and ω = 0.85   [ 0.83 ; 0.86 ] .
Regarding the correlations of the subscales of CRSi-7, the picture is similar to that of the CRS-5. It is not surprising because only two core-dimensions i.e., experience and private practice, differ. This means that scores of ideology, intellect, and public practice are the same. For the transformation of experience and private practice, only the maximum value of either the interactive or participative experience (experience) or meditation or prayer (private practice) is conveyed in the further analysis.
First, we have a look at the comparison between the two datasets before going to compare both the short scales with each other. The same pattern of data presentation as in Table 5 is applied in Table 6 where the number left of the slash is the RM08 and the number right of the slash is the RE19 correlation. The correlations of the RM08-data range from r x 3 x 5 = 0.37 to r x 1 x 2 = 0.57 . In the 2019 dataset, the scope of correlations varies from r x 3 x 5 = 0.33 to r x 1 x 2 = 0.59 . In both samples, the lowest value goes to the association of experience and public practice and the highest value to the association of ideology and intellect. The total range of correlations is smaller for the 2008 dataset.
At first sight, the coefficients lie close to each other if compared in pairs (numbers in the same cell), with the biggest difference for the correlation of public and private practice Δ r x 4 x 5 = 0.07 and the smallest change in Δ r x 2 x 4 = 0.01 .
If we note that the difference between the CRS-5 and CRSi-7 is only in the core-dimensions of religious experience and private practice, we can expect that the correlations of these two indicators with other indicators change in each sample. This effect is seen if one compares the numbers in the corresponding cells between Table 5 and Table 6. Interestingly, only the correlations between experience and other core-dimensions go up by Δ r x 1 x 3 = Δ r x 2 x 3 = Δ r x 3 x 4 = 0.03 with a slightly higher impact on the correlation with public practice Δ r x 3 x 5 = 0.06 in the RM08-data. The same effect is seen in the RP19-data. Here, the differences in the correlations between the CRS-5 and CRSi-7 are as following: Δ r x 1 x 3 = 0.11 , Δ r x 2 x 3 = Δ r x 3 x 4 = 0.03 and Δ r x 3 x 5 = 0.02 . Regarding the impact of the transformation of private practice only the correlations with ideology Δ r x 1 x 4 = 0.03 and public practice Δ r x 4 x 5 = 0.02 had an effect.

3.2. Results of the Exploratory Factor Analyses

We use an EFA to examine whether the presumed structure of one latent variable is suitable to explain the theoretical construct of the “centrality of religiosity” in Russian data from 2008 and 2019. To put it in other words, it is plausible to assume that a large part of the variance in the indicators is common variance and should be summed up under one unifying psychometrical construct.
Prechecks on the suitability of the data via Kaiser-Meyer-Olkin measure of sampling adequacy (KMO) and Bartlett’s sphericity test show decent parameter values for KMO (third row from left in Table 7) and significant results for the comparison with an identity correlation matrix for Bartlett’s sphericity test (Hutcheson and Sofroniou 1999, pp. 224–26). The latter test proves that there are substantial correlations among the indicators and that it is appropriate to run an EFA with the given sample. The results of the analyses for both short CRS scales in both datasets are summed up in Table 7. Four examinations give a similar picture of the scales factorial structure and its parameters. CRS-5 and CRSi-7 both have one factor underlying the indicators in both datasets. The explained variance by the “centrality of religiosity” factor moves around 50 ± 3% in all analyses (cf. right column in Table 7).
All in all, the results of the EFA allow for further analyses of the CRS-5 and CRSi-7 in a CFA, modeling the time-invariance as a multigroup comparison between the two datasets RM08 and RE19.

3.3. Results of the Confirmatory Factor Analyses

The systematical examination is done by stepwise restriction of the model parameters while comparing the nested models with each other and while observing the model performance according to the global and local fit measures. In a first step, we discuss the CRS-5 in its global and local fit indices. The same procedure follows for the CRSi-7 as a second part, in the CFA result section.

3.3.1. CRS-5

According to our hypothesis of the time-invariant performance of the CRS-5, the differences between model implied variance-covariance-matrices and the two sample-derived variance-covariance-matrices (here: From RM08 and RE19 samples) should not exceed the acceptable global model fit according to the established fit criteria.

Global Fit

The examination of nested models has shown that the model with restrictions on factor loadings, the residual variances, and the covariance of private and public practice being equal over time, performs well according to the set-up fit criteria cf. Appendix C, Table A10. Therefore, we report on the model parameters of the “equal indicator residual co-/variance” model. As can be seen from the goodness of fit statistics, there was an RMSEA of R M S E A = 0.055 ,   90 %   C I   [ 0.046 ; 0.064 ] ,   p c l o s e = 0.18 , an SRMR of S R M R = 0.034 , and a CFI and TLI of C F I = 0.97 , T L I = 0.97 , respectively. Compared with the recommendations by Hu and Bentler (1999) only the higher bound of the confidence interval of the R M S E A does not fit with the proposed values. In combination with the close fit function’s p-value of p c l o s e = 0.18 (Browne and Cudeck 1993), it still means that the model reproduces the conditions in the population well. The fit indices taken together propose a good model fit of the CRS-5 “equal indicator residual co-/variance”-model.

Local Fit

The global fit of the selected model with restriction put on the co-/variances demonstrates that the overall populational conditions are well met. It allows for meaningful interpretation of the parameter estimates and localization of ill fits if present. Considering the local fit, one can see that all factor loadings are greater than λ x 0.54 which indicates at least salient to moderate association with the factor, see Table 8 for more details.
Squared correlations range from R x 5 = 0.30   [ 0.26 ; 0.34 ] to R x 1 = 0.66   [ 0.63 ; 0.69 ] with the weakest for public practice and strongest for ideology following the magnitude pattern of the factor loadings.
The greatest residual variances go with the two practice dimensions, which means that a considerable part is not covered by the factor. The only correlation of residuals in the model is set between the residuals of private and public practice. This correlation is estimated to be δ x 4 x 5 = 0.26   [ 0.21 ; 0.31 ] , which is a medium effect size according to Cohen (1988, p. 82). The conventional significance level of 5% is not violated by any of the parameter estimates.
Modification indices greater than Δ χ 2 = 4.00 are present for the covariances of the residuals in the combination of δ x 4 with δ x 5 (private and public practice), of δ x 1 with δ x 4 (ideology and private practice, as well as δ x 1 with δ x 3 (ideology and experience). In terms of modification indices for variances only the residual of the intellect core-dimension is not listed: Modification is therefore suggested for residual variances of ideology— δ x 1 , experience— δ x 3 , private— and public practice— δ x 5 . Modification indices for factor loadings are suggested for the regression of public practice on private practice ( x 5 x 4 ) as well as for the regression of ideology on private practice ( x 1 x 4 ) . Implications of these modification indices are considered in the discussion section.

3.3.2. CRSi-7

The same hypothesis as for the CRS-5 was formulated for the CRSi-7. That is, the CRSi-7 model performs stably over time according to global fit criteria. Additionally, the covariance between the residuals of private and public practice is constant over time.

Global Fit

Considering the nested models, stepwise restrictions on factor loadings, the residual variances, and the covariance of private and public practice to be the same over time leads to good model performance according to the set-up fit criteria cf. Appendix C, Table A11. We, therefore, do not report on the comparison of nested models but only on the “equal indicator residual co-/variance”-model. As can be seen from the goodness of fit statistics the RMSEA is R M S E A = 0.050 ,   90 %   C I   [ 0.041 ; 0.059 ] ,   p c l o s e = 0.49 , the SRMR is S R M R = 0.034 , and the CFI and TLI are C F I = 0.97 , T L I = 0.97 . Considering the recommendations by Hu and Bentler (1999) the model performs well according to suggested goodness of fit values.

Local Fit

Each factor loading, squared correlation, residual variance, and the residual correlation of the residuals of private and public practice has a significance level under the conventional 5% which means that no local misfit is present in the estimated parameters. Therefore, we discuss each of them one after another. Table 9 presents all parameter estimates in detail.
The core-dimension of public practice shows the smallest parameter estimates as compared with others, still, the factor loadings are of a salient to a substantial size of λ x 0.54 . Squared correlations vary from R x 5 = 0.29   [ 0.26 ; 0.34 ] to R x 1 = 0.64   [ 0.60 ; 0.67 ] following the magnitude pattern of the factor loadings. The residual variance is smallest for the core-dimension of ideology δ x 1 = 0.50 and biggest for the two practical core-dimensions. The estimated correlation between the residuals of the practical dimensions is δ x 4 x 5 = 0.25   [ 0.21 ; 0.30 ] and is of a medium effect size according to Cohen (1988, p. 82).
Modification indices greater than Δ χ 2 = 4.00 were suggested for the covariances of the residuals in combination with δ x 4 with δ x 5 (private and public practice), of δ x 1 with δ x 4 (ideology and private practice, as well as δ x 3 with ξ c e n t r a l i t y (ideology and centrality-factor). The modification indices for variances affect all but the variance of the core-dimension of intellect: i.e., modification is suggested for residual variances of ideology— δ x 1 , experience— δ x 3 , private δ x 4 and public practice— δ x 5 , and for the variance of the centrality-factor— φ c e n t r a l i t y . Modification indices for factor loadings are suggested for the regression of private practice on public practice ( x 5 x 4 ) , for the regression of experience on public practice ( x 5 x 3 ) and the modification of the factor loading λ x 3 (experience core-dimension). These modification indices are to be reviewed in the following discussion section.

4. Discussion

Previous studies have shown that the short forms of the CRS represent a reasonably universal and reliable psychometric tool to record common expressions of religious life. With this study, we pursued the objective of testing the validity and time-invariance performance of the two short forms of the Centrality of Religiosity Scale in Russia. Despite its mainly good to excellent τ -equivalent reliability coefficients in many countries (Huber and Huber 2012) the question of consistency of the measurement over time was raised only once. The sole scientific investigation that posed the question of invariance of the short forms of the CRS over time is Ackert et al. (2020) in the Orthodox context of Georgia, which served as a prototype in some regards in this investigation. In this article, we addressed the question of the time-invariant performance of the CRS and examined it in the Orthodox context of Russia. Along with the investigation of time-invariance of the short forms of the CRS a special focus was given to the association of the private and public practice core-dimensions—a hypothesized particularity of the Orthodox church traditions. With the mainly Russian Orthodox background of the participants in the samples from 2008 and 2019, we link the idea of a stable association of private and public practice operationalized as a time-invariant association of both residuals of private and public practice in the CFA.
In summary, the main results are: (1) The Russian versions of the CRS-5 and the CRSi-7 both have excellent internal consistencies and (2) both short scales could prove time-invariance, therefore, consistency of the measurement of the centrality of religiosity in the given samples, (3) both scales, the CRS-5 and CRSi-7, perform comparably well in the given samples, (4) a time-stable association between private and public practices is found in the mainly Orthodox samples.
Our hypothesis of the CRS-5 performing better than the CRSi-7 did not withstand this examination, however all other hypotheses are verified by the present study i.e., both short forms perform well according to conventional criteria of confirmatory factor analysis, delivering consistent psychometric properties over time. The association of the residuals of both practice dimensions is also stable over time, showing that a particular pattern is inherent for the Russian Orthodox tradition, same as in Georgian Orthodox samples (Ackert et al. 2020). More detailed findings are in the next paragraphs.

4.1. Preliminary Observations and Remarks

Upon examining the means in 2008 and 2019, it is revealed that the mean values of the CRS-5 and CRSi7 increased over time with a small Cohen’s d (Table 4). Nevertheless, we would like to bring the fact that this change should be tracked if talking about the changes in religiosity in Russia to future investigations attention. Technically, this article offers the norm values for future investigations to compare the mean development throughout time.
We leave out the in-depth discussion of the indicator means or the indicator intercepts and latent mean of the factor as it is not the goal of the present study. What is, however, of importance to this article is that the change in the standard deviations of the core-dimensions remained quite stable between 2008 and 2019 (Table 4). The stable variance of the core-dimensions is in itself a central observation; nonetheless, the stability of the concept of investigation—the centrality of religiosity—cannot be concluded by this alone. Therefore, the covariance, which is found in each combination of the core-dimensions (Table 5 and Table 6), is of interest to this analysis and for this purpose constitutes the main input in the EFA and CFA.
It is worth looking at the covariance pattern prior to the EFA or CFA. The relatively stable covariance pattern in RM08 and RE19 already slightly suggests the hypothesized consistency of the underlying structure. In the covariance pattern, none of the combinations of the core-dimensions dominate each other. None of them correlate perfectly with each other or do not correlate at all, whereby the correlation with the total score is always higher than the correlation among the dimensions. This means that each of the core-dimensions contributes to the total score by enclosing the existing common variance and adding some specific nature to the underlying core-dimension on top of it. Hence, none of the core-dimensions seem to be redundant. It is a vital point of the theory behind the concept of the centrality of religiosity that every core-dimension has its place and should be taken into account while investigating religiosity. Therefore, we recommend to researchers not to cut the CRS in items of interest but rather to take the short form as is and calculate the centrality of religiosity based on all core-dimensions.
If looking at the separate core-dimensions, a major split can be made between inward and outward processes. On the one hand, ideology, intellect, and religious experience are inner processes that are not observable if not inquired in oral or in written form. These three can be summed up under the term religious attitudes and experience. On the other hand, private and public practice are at least potentially observable, which leads to higher visibility hence the possibility of social control among believers. Based on the theory behind the CRS that each core-dimension has its own social expectation, it is a crucial point in the scale evaluation. When thinking about religious behavior, private practices such as prayer or meditation are commonly practiced during religious ceremonies, which is also true for Orthodox churches. Bearing this in mind it seems plausible that the stable extra-factorial association between private and public practice that we face in the models can be of that kind of ceremonial origin or linked to some religion-related items. For example, it is common for a Russian Orthodox believer to “do a sign of the cross” (Latin: signum crucis) and say a short prayer or praise in front of icons, be it in churches or at home where icons are common household items.
Coming back from the content of the practical core-dimension to their quantification one can see that except meditation—as a sub-form of private practice—which is about M 1.5 all other indicators range somewhere between M 2.0 and M 3.5 . Ideology shows the highest mean in the RM08 and RE19; at the same time it is the only core-dimension that surpasses the normal distributed expected mean of M = 3.0 in RE19-dataset. Moreover, there is neither a ceilin- nor a floor effect with any of the indicators, which is not always the case. For example, Huber and Huber (2012) identified five countries i.e., Turkey, Nigeria, Morocco, Guatemala, and Indonesia where the CRS had ceiling effects and the variance of the items collapsed, blocking any calculations with the scale. Hence, datasets from Russia are of good quality in this regard and comparable with many others across the world where the CRS has been applied successfully.
One special observation to mention is that public practice is the only dimension that decreased from 2008 to 2019, whereas intellect and interactive experience increased by about 40% of their standard deviations. A distinctiveness of private practice is that it has the highest variance among all core-dimensions in both datasets, which is a sign of greater diversion in this practice among believers than for the other dimensions. This condition leads to a particularity that seems plausible in religious traditions where private practices like prayer not only happen in private but occur as a part of public practice e.g., prayer during Sunday ceremonies. Both private and public practice are rituals in which a person refers to higher reality/transcendence. Churchgoers have regular ceremonies that contribute to private prayer. The collective prayer may stimulate the prayer at home or in private as a kind of socialization process. Another remark is again linked with the social expectation towards religion-specific practices that are directly visible, therefore, people asked anonymously may answer more honestly and not conform to the social desirability, which causes greater variance of the private practice core-dimension.
Adding the EFA on top of the descriptive statistics shows that a unifying concept of a factor that explains around 50% of the variation in the data is reasonable. None of the indicators drop in the analyses and none of the samples show more than one underlying factor. The scale works as expected allowing for the calculation of a total consistent score for categorization of the respondents if needed.
Finally, considering the CRS index, the CRSi-7 yields a higher total score than the CRS-5, which is expected because of the algorithm behind the composite score calculation. Both composite scores grew by the exact same amount Δ M = 0.27 from 2008 to 2019, and the standard deviations decreased by a small amount of around Δ S D = 0.1 from 1.0 to 0.9. These observations are to be tested for their statistical significance and practical importance in future analyses.

4.2. Deduction from Statistical Models

The preliminary observations of the descriptive statistics and the EFA suggest that the concept of the centrality of religiosity is confirmed in the data and that its consistency is a reasonable question. One thing to consider is that the concept of the centrality of religiosity work under certain statistical conditions. A large threat to the statistical models occurs, for example, when the indicators are highly correlated or if they do not correlate at all, as well as if the variance is too small or too large. Some examples where the CRS does not properly work because of such phenomena can be found in Huber et al. (2020).
Statistically, the models in this article do not face the problem of multicollinearity or even singularity or variance limitations in CFA. This can be seen from the correlations: The highest values for bivariate correlations found for CRS-5 are r x 1 x 3 = 0.59 in RM08 data and r x 1 x 3 = 0.64 in RE19 data, similar values appear for the CRSi-7 r x 1 x 2 = 0.57 in the RM08 dataset and r x 1 x 2 = 0.59 in RE19 dataset, thus no multicollinearity appears there. On the other hand, correlations are high enough to provide sufficient common variance. The smallest correlations in the CRS-5 are: r x 1 x 5 = 0.41 in RM08-data and r x 4 x 5 = 0.38 in RE19-data; in CRSi-7: r x 3 x 5 = 0.37 in the RM08-dataset and r x 3 x 5 = 0.33 in the RE19-dataset. Furthermore, the common indicator variance of about 50% represented by the one-factor solution in the EFA is further evidence for a one-factor solution. All in all, these initial reflections of the data lead to the idea of examining the scales’ consistency over time.
We leave the discussion of nested models as well as that of standardized residuals out because the χ 2 -test is sensitive to sample size and the differences in our analyses are caused by this factor. Nevertheless, the nested model with the highest grade of restrictions still has acceptable fit indices indicating that this model is close to the sample variance-covariance matrix, therefore, close to the empirical data. Considering the modification indices, we tested the model where all indicator residuals covariances were restricted to be zero. The result was that the time-invariant models only become acceptable according to posited parameters by including an association between private and public practice. This pattern seems to be essential for the tested samples.
Modification indices (MIs) greater than Δ χ 2 = 4.00 are given in both CFA models for CRS-5 and CRSi-7 with “equal residual co-/variances”. In both models, the MIs are related to the restrictions, which are the result of the multigroup comparison. For CRS-5, expected parameter changes in variance, covariance, or factor loadings do not exceed 0.15. The same applies to the CRSi-7 modification indices. In both models, the highest change would affect the variance of the residual of public practice. We think that the restrictions we put on the models justify such a trade-off and do not think that any kind of modifications proposed after the restrictions would make theoretical sense with the knowledge we have by now.
Looking at the cut-off criteria, we would like to draw attention to alternatives to the recommendations by Hu and Bentler (1999). There is an option to run parametric based Monte Carlo simulations within specialized software e.g., R or Mplus to establish model-specific cut-off criteria for S R M R , C F I , and R M S E A . An article by McNeish and Wolf (2020) has considered this topic and developed a parametric bootstrap procedure which calculates a 95% confidence interval for the above-mentioned fit indices. Such sample-specific cut-off criteria would allow for a stricter estimation of the model parameters e.g., putting restrictions on the intercepts and mean structure without violating the global goodness of fit and should be considered in future investigations.

4.2.1. CRS-5

The factor loadings in descending order are ideology, experience, intellect, and private and public practice. This means that the non-behavioral core-dimensions have the strongest predictive potential in the model. On the one hand, this means that both practical core-dimensions have less statistical weight in predicting the centrality of religiosity and therefore religiosity itself according to its multidimensional definition. Both practical core-dimensions are linked together by a medium-size correlation of δ x 4 x 5 = 0.26 . The same pattern was found in the Orthodox context of Georgia with a size of δ x 4 x 5 = 0.31 (Ackert et al. 2020). Any further investigations about Christian Orthodox traditions should keep this in mind and preferably extend the methodological access to this association by using the intermediate or the long form of the Abrahamitic CRS i.e., CRS-10 and CRS-15, respectively.
The model with configural invariance between 2008 and 2019 has excellent fit indices. Moreover, with an increasing number of restrictions, it stands the test of time-invariance with factor loadings, variance, and covariance of the residuals set equal between RM09 and RE19. This means that it has consistent psychometric properties and is, therefore, suitable to examine the changes of religiosity in time.

4.2.2. CRSi-7

The CRSi-7 has its particularities with the measurement of the experience and private practice core-dimensions. The items for the other threee core-dimensions are the same as with the CRS-5. On the contrary, the CRSi-7 incorporates the maximum values on the two dimensions of experience and private practice, which leads to slightly higher composite values if a person is practicing meditation or experiencing being one with all. The participative aspect of religious practice and experience addressed in the CRSi-7 broadens the scope of application of the CRS and has the potential to contribute empirical arguments to the debate about the association of religiosity and spirituality. Considering its short length and the inclusion of the CRS-5, the CRSi-7 also has potential in the Abrahamitic context. A further argument to apply the CRSi-7 in Abrahamitic religious traditions is that it has a comparable global model fit and performs equally well in the local estimates. Considering the bootstrapped confidence intervals for the parameters of the CRSi-7 and CRS-5, they differ only in the experience core-dimension, where the factor loading in the CRS-5 is higher. The very close model fit of the CRSi-7 to CRS-5 is assumed to be due to the fact that the participative religious pattern is not yet well established and that the ongoing individualization in society can change the pattern or religious practices in Russia. In conclusion, with the CRSi-7 one can capture the changes in the individualization of private and public religious practices, which is our recommendation for future empirical work with the CRS in Russia.

4.3. Limitations and Strengths

The CRS is a widely used scale when it comes to the assessment of religiosity. Not many scales in the psychology of religion underwent such a strict examination of time-invariance. Nevertheless, we are aware of the fact that we left out the restriction on the mean structure of the latent variables and the intercepts of the indicators. Such a step will certainly change the global fit indices and increase the χ 2 -test value of model implied and observed matrices. They will differ considerably with such large sample sizes. Higher values of the χ 2 -test of model fit will affect many derived fit indices rendering the models not acceptable according to conventional recommendations by Hu and Bentler (1999). We, therefore, would like to draw attention to alternatives to the cut-off criteria. A recently proposed alternative is to run parametric-based Monte Carlo simulations to establish model-specific cut-off criteria for S R M R , C F I , and R M S E A . An article by McNeish and Wolf (2020) has considered this topic and developed a parametric bootstrap procedure that calculates a 95% confidence interval for the above-mentioned fit indices. This paper came up as we were about to finish our report, which is why we did not introduce this method in the present study.
Staying with the statistical matters we point out that the preprocessing of the data leads to a harmonization of the sample covariates (i.e., sex, gender, religious affiliation), hereby the bias of the covariates is lessened. Such an approach is a way that does not reduce the statistical power of the analyses as e.g., listwise deletion and in addition, in EFA and CFA it leads to an equal weight of two samples, which reduces the distortion that is often the case with unequal sample sizes in multigroup-CFAs. The samples did not allow for matching on the important demographic covariate of education. This is a limitation to a generalization of the present analyses even though in both sampling procedures it was taken care of representativeness of the sample regarding the educational level.
Regarding the content-related position of the CRS, we see its suitability to be an alternative to the Index of Churching as it covers all the relevant dimensions and allows for the categorization of personal religiosity of every person regardless of membership in a religious community. Such an approach may be in favor of the research questions of the sociology of religion in Russia. Moreover, the CRS-Index still clearly distinguishes between the non-religious, religious, and highly religious. In combination with the religious affiliation, it is more flexible and independent than scales that are built on specific religious knowledge or participation in specific ceremonies.
If taking the perspective of the psychology of religion, moving along the personality trait paradigm, and taking the well-known example of the Intelligence Quotient (IQ), the CRS-index would represent the general IQ of a person and the core-dimensions portray the structure of the IQ of an individual. Hence, the CRS provides all possibilities which are inherent to Differential Psychology i.e., comparing test scores over time (longitudinal) as well as with other individuals at the same time (cross-sectional). While the personality trait paradigm is an established view, the CRS itself is based on the psychology of personal constructs (Kelly 1991). This leads to another way of interpretation of the CRS index. The higher the index, the more importance religiosity has in the personal construct system of an individual. This means that religiosity becomes more and more relevant in all domains of human life. We give this example with the two different paradigms in psychology to demonstrate the universality of the CRS which is an advantage of this scale.

5. Conclusions and Outlook

Generally said, the multidimensional model of religiosity operationalized by the Centrality of Religiosity Scale works well. This study is a further examination that shows the ability of the scale to encompass various expressions of religion in human life and to condense it to a working statistical model. We tried to break down the complex statistical models and calculations for the reader. For comprehensibility reasons, we sum up the study in short concluding sentences in a final step.
Both the CRS-5 and the CRSi-7 perform well and are suitable for future studies on religiosity not only in Russia but in many other cultural, religious, and linguistical contexts (cf. Huber and Huber 2012). There is now evidence that the CRS can statistically capture particularities of the Christian Orthodox tradition. A test should be done in a country where orthodox and other religious denominations are present, to examine whether the covariance of private and public practice is exclusively orthodox.
When compared, the CRSi-7 is not necessary for the Orthodox tradition; the more frugal CRS-5 is sufficient in this case but the CRSi-7 has only two more items and includes the CRS-5. This circumstance and the additional possibility of assessing participative religiosity patterns favor the CRSi-7.
In further studies, it should be taken into account that the respondents are more ready to report on non-behavioral core-dimensions because they are less controllable. Such tendencies are usually present in surveys as well as in interviews and should not be forgotten while interpreting the statistical estimates.
It is desirable to investigate the change of the latent mean, which would reveal the change in the centrality of religiosity. Such a statistical approach is less prone to bias as compared to an ANOVA for example and should be run even if the CRS has good to excellent internal consistency.
All things considered, we encourage the use of the CRS, its further development, and statistical examination.

Author Contributions

Conceptualization, M.A.; Data curation, M.A. and E.P.; Formal analysis, M.A.; Funding acquisition, I.Z.; Investigation, E.P. and I.Z.; Methodology, M.A.; Project administration, I.Z.; Resources, I.Z.; Software, M.A.; Supervision, I.Z.; Validation, M.A. and E.P.; Visualization, M.A.; Writing—original draft, M.A. and E.P.; Writing—review & editing, M.A. All authors have read and agreed to the published version of the manuscript.

Funding

This research was funded by two funding institutions: the Russian Humanitarian Scientific (Российский гуманитарный научный фонд [РГНФ]) and the Swiss National Science Foundations in a form of grants. The grant in Russia was given to Saint Tikhon’s Orthodox University (project № 18-78-10089, grant number 16-23-41006). The grant in Switzerland was provided to the University of Bern (project № IZLRZ1_163880). The APC was funded by Swiss National Science Foundation (grant number IZLRZ1_163880).

Conflicts of Interest

The authors declare no conflict of interest.

Statistical Disclaimer

Any rounding errors are due to the software used in this investigation. The authors report any numbers with the best-given method available at the time of manuscript writing.

Appendix A. Translated Russian CRS Items with the Correspondence Items in English

Table A1. Overview of the CRS items in English and Russian with corresponding core-dimensions.
ItemDimensionEnglishRussianAnswer Pattern
1IntellectHow often do you think about religious issues? Как часто вы задумываетесь на религиозные темы?b
2IdeologyTo what extent do you believe that God or something divine exists? Насколько сильно вы верите в существование Бога или некоей божественной силы?a
3Public practiceHow often do you take part in religious services? Как часто вы принимаете участие в религиозных службах?c
4Private practiceHow often do you pray? Как часто вы молитесь?d
4bPrivate practiceHow often do you meditate?Как часто вы медитируете?d
5ExperienceHow often do you experience situations in which you have the feeling that God or something divine intervenes in your life? Как часто вы переживаете ситуации, в которых у вас появляется чувство, что Бог или некая божественная сила вмешивается в вашу жизнь?b
5bExperienceHow often do you experience situations in which you have the feeling that you are in one with all? Как часто вы переживаете ситуации, в которых у вас возникает чувство, что вы и мир единое целое?b
6IntellectHow interested are you in learning more about religious topics? Насколько вам интересно больше узнавать о религиозных темах? a
7IdeologyTo what extent do you believe in an afterlife—e.g., immortality of the soul, resurrection of the dead, or reincarnation? Насколько сильно вы верите в существование жизни после смерти–например, в бессмертие души, воскресение из мертвых или реинкарнацию?a
8Public practiceHow important is to take part in religious services? Насколько для вас важно принимать участие в религиозных службах?a
9Private practiceHow important is personal prayer for you? Насколько важна для вас личная молитва?a
9bPrivate practiceHow important is meditation for you?Насколько важна для вас медитация?a
10ExperienceHow often do you experience situations in which you have the feeling that God or something divine wants to communicate or to reveal something to you? Как часто вы переживаете ситуации, в которых возникает ощущение, что Бог, или некая божественная сила хочет вам что-то сказать или показать?b
10bExperienceHow often do you experience situations in which you have the feeling that you are touched by a divine power? Как часто вы переживаете ситуации, когда у вас появляется чувство, что вас коснулась божественная сила? b
11IntellectHow often do you keep yourself informed about religious questions through radio, television, internet, newspapers, or books? Как часто вы поддерживаете свою осведомленность о религиозных вопросах с помощью радио, телевидения, Интернета, газет или книг? b
12IdeologyIn your opinion, how probable is it that a higher power really exists?По вашему мнению, насколько вероятно, что действительно существует высшая сила?a
13Public practiceHow important is it for you to be connected to a religious community? Насколько для вас важно принадлежать к религиозной общине? a
14Private practiceHow often do you pray spontaneously when inspired by daily situations? Как часто вы незапланированно молитесь в связи с возникающими повседневными ситуациями? b
14bPrivate practiceHow often do you try to connect to the divine spontaneously when inspired by daily situations?Как часто вы незапланированно пытаетесь войти в контакт с божественным в связи с возникающими повседневными ситуациями? b
15ExperienceHow often do you experience situations in which you have the feeling that God or something divine is present?Как часто вы переживаете ситуации, когда у вас появляется чувство присутствия Бога или некой божественной силы? b
Note. Item translation is from Huber and Huber (Хубер and Хубер 2019). CRS—Centrality of Religiosity Scale. Items marked with “b” are additional items for the constitution of the interreligious form of the CRS, see Table A2 for more details. Answer patterns are coded as letters and can be found in Table A3 in Appendix A.
Table A2. Composition of the short, intermediate and long form of the CRS with existing items.
FormatBasicInterreligious
short1; 2; 3; 4; 5short + 4b; 5b
intermediateabove + 6; 7; 8; 9; 10above + 9b; 10b
longabove + 11; 12; 13; 14; 15above + 14b
Note. CRS—Centrality of Religiosity Scale. See Table A1 for an overview of the items.
Table A3. Answer options as Likert-scales in English and Russian with its corresponding recoding scheme.
PatternEnglishRussianNumerical Code
Importanceavery much so—quite a bit—moderately—not very much—not at allочень—довольно сильно—средне—слабо—совсем нет5-4-3-2-1
Frequencybvery often—often—occasionally—rarely—neverочень часто—часто—иногда—редко—никогда5-4-3-2-1
cmore than once a week—once a week—one to three times a month—a few times a year—less often—neverчаще, чем раз в неделю—раз в неделю—от одного до трёх раз в месяц—несколько раз в год—реже, чем раз в год—никогда5-5-4-3-2-1
dseveral times a day—once a day—more than once a week—once a week—one to three times a month—a few times a year—less often—neverнесколько раз в день—один раз в день—чаще, чем раз в неделю—раз в неделю—от одного до трёх раз в месяц—несколько раз в год—реже, чем раз в год—никогда5-5-4-3-3-2-2-1
Note. Answer options “a” and “b” are subjective, while answer options “c” and “d” are objective. The numerical code shows the recoding scheme after the collection of the data. For the pattern “c”, it means that 6-5-4-3-2-1 becomes 5-5-4-3-2-1 i.e., 6 is recoded to 5. For the pattern “d” it means that 8-7-6-5-4-3-2-1 becomes 5-5-4-3-3-2-2-1 i.e., 8 and 7 are recoded to 5, 6 is recoded to 4, 5 and 4 are recoded to 3, 3 and 2 are recoded to 2. The original wording of the answer options is established by Huber and Huber (2012). For the scales “c” and “d” one more answer option was added in the “Religion & Economics” and “The Paradox of Interrelation between Religion and Family in Modern Russia”—projects. The additional answer option was “once a year/один раз в год” and was placed between “a few times a year/несколько раз в год” and “less often/реже чем раз в год” with the numerical code of “2”. This answer option was tested in Russia for technical reasons but did not change the scale characteristic, or the respondent answering patterns and was therefore dropped in analyses in the present article.

Appendix B. Results of the Matching Procedure of the Datasets RM08 and RE19

After the data imputation. The complete data is passed to the matching procedure. The formula, the so-called “call” in R with the package “MatchIt” to match both datasets:
matchit(formula = GR ~ sex + rel + age, data = CRSRUS, method = “optimal”)
Both datasets RM08 and RE19 combined to one file with the name “CRSRUS” and distinguished by the dichotomous group variable “GR” are processed at once. The formula has an arrangement of a multiple regression calculation in R. The group “GR” is matched by (~) three covariates “sex”—sex, “rel”—religious affiliation, and “age”—age of the respondents by the “optimal” algorithm which means that every respondent in one group is associated with one respondent in the other group with a minimal distance on all covariates. RE19 has 1.78 times more cases than RM08 which leads to the result that every case in RM08 receives an associated case in RE19. Table A5, Table A6, Table A7, Table A8 and Table A9 show the results.
The results of the matching procedure can be shown graphically. Figure A1, Figure A2, Figure A3, Figure A4 and Figure A5 show the difference before and after data preprocessing.
Table A4. Overview of the missing values before data imputation.
DatasetNIdeologyIntellectInteractive ExperienceParticipative ExperiencePrayerMeditationChurch AttendanceAveragePercent
RM08984351159102366423474.8
RE19172955195494836026563.2
Note. RM08—data from the first wave of Religion Monitor from Russia in 2008. RE19—combined data from the projects “Religion & Economics” and “The Paradox of Interrelation between Religion and Family in Modern Russia” in Russia in 2019. N—number of cases. Numbers in cells indicate the number of missing values per variable. Average—count of average missing values in the dataset. Percent—count of average missing values in the dataset presented in percent of the total sample size.
Table A5. Summary of balance for all data.
Means RE19Means RM08SD RE19Mean DifferenceeQQ MedianeQQ MeaneQQ Max
distance0.420.330.120.090.090.090.17
female0.340.530.50-0.190.000.191.00
male0.660.470.500.190.000.191.00
rel (other)0.050.050.220.000.000.001.00
rel (none)0.150.270.45-0.130.000.131.00
age46.5439.8113.096.737.006.8328.00
Note. RM08—data from the first wave of Religion Monitor from Russia in 2008. RE19—combined data from the projects “Religion & Economics” and “The Paradox of Interrelation between Religion and Family in Modern Russia” in Russia in 2019. SD—standard deviation. eQQ—empirical quantile function. rel—religious affiliation with the category in parenthesis; rel (Christian) does not appear in the table because it is the reference category for the three-level categorical variable and therefore set to zero. Female and male are representations of a dichotomous variable coded 1 = male, 0 = female therefore means can be interpreted as percentages, the standard deviations, and the median have no meaningful interpretation in this case with a dichotomous variable. Distance–the mathematical coefficient for the propensity score between the two samples.
Table A6. Summary of balance for matched data.
Means RE19Means RM08SD RE19Mean DifferenceeQQ MedianeQQ MeaneQQ Max
distance0.420.380.120.040.010.040.15
female0.340.380.49-0.050.000.051.00
male0.660.620.490.050.000.051.00
rel (other)0.050.050.220.000.000.001.00
rel (none)0.150.170.38-0.030.000.031.00
age46.5442.2013.304.343.005.2028.00
Note. RM08—data from the first wave of Religion Monitor from Russia in 2008. RE19—combined data from the projects “Religion & Economics” and “The Paradox of Interrelation between Religion and Family in Modern Russia” in Russia in 2019. SD—standard deviation. eQQ Med, eQQ Mean, and eQQ Max—median, mean, and maximum value of differences in empirical quantile functions.
Table A7. Percent Balance Improvement.
Mean DifferenceeQQ MedianeQQ MeaneQQ Max
distance56.4384.6656.4215.14
female75.670.0075.660.00
male75.670.0075.660.00
rel (other)48.950.0050.000.00
rel (none)78.010.0077.950.00
age35.4857.1423.940.00
Note. eQQ Med, eQQ Mean, and eQQ Max—median, mean, and maximum value of differences in empirical quantile functions. The improvement of the categorical covariate religious affiliation is represented by two of three categories “no religious affiliation” and “other religious affiliation”, the third category “Christian” is the reference category for the variable “religious affiliation” and does not appear in the table.
Table A8. Sample sizes of all, matched, unmatched, and discarded cases.
N in RE19N in RM08
All1729984
Matched984984
Unmatched7450
Discarded00
Note. RM08—data from the first wave of the Religion Monitor from Russia in 2008. RE19—combined data from the projects “Religion & Economics” and “The Paradox of Interrelation between Religion and Family in Modern Russia” in Russia in 2019. N—number of cases.
Table A9. Summary of the Centrality of Religiosity Scale items distributions in the matched data.
MinimumMedianMeanMaximum
ideology1.003.003.075.00
intellect1.003.002.645.00
interactive experience1.003.002.565.00
participative experience1.002.002.345.00
prayer1.002.002.645.00
meditation1.001.001.405.00
attendance of religious service1.002.002.125.00
Note. The table contains CRS-5 as well as CRSi-7 items.
Figure A1. Distribution of the propensity scores of the samples before and after matching preprocessing. Each circle represents a case. RM08—data from the first wave of Religion Monitor from Russia in 2008. RE19—combined data from the projects “Religion & Economics” and “The Paradox of Interrelation between Religion and Family in Modern Russia” in Russia in 2019. The upper void bar titled “Unmatched RM08 Units” shows that all units were matched. The bottom bar titled “Unmatched RE19 Units” shows the units which were not matched to any case in RM08 data. The two bars in the middle “Matched RM08 Units” and “Matched RE19 Units” show the distribution of 984 cases which has been associated according to the matching algorithm.
Religions 11 00577 g0a1
Figure A2. Histograms of the propensity scores of the samples before and after matching preprocessing. RM08—data from the first wave of the Religion Monitor from Russia in 2008. RE19—combined data from the projects “Religion & Economics” and “The Paradox of Interrelation between Religion and Family in Modern Russia” in Russia in 2019.
Religions 11 00577 g0a2
Figure A3. Quantile-Quantile Plots for the dichotomous sex covariate and the categorical religious affiliation covariate with the category “other religious affiliation”. Each circle represents a case. RM08—data from the first wave of Religion Monitor from Russia in 2008. RE19—combined data from the projects “Religion & Economics” and “The Paradox of Interrelation between Religion and Family in Modern Russia” in Russia in 2019.
Religions 11 00577 g0a3
Figure A4. Quantile-Quantile Plots for the continuous age covariate and the categorical religious affiliation covariate with the category “no religious affiliation”. Each circle represents a case. RM08—data from the first wave of the Religion Monitor from Russia in 2008. RE19—combined data from the projects “Religion & Economics” and “The Paradox of Interrelation between Religion and Family in Modern Russia” in Russia in 2019.
Religions 11 00577 g0a4
Figure A5. “distance”–the global score of improvement; “age”–an improvement on the continuous covariate of age; “female”–the dichotomous sex covariate is represented by only the improvement for the cases coded as female; the improvement on the categorical covariate religious affiliation is represented by two of three categories “no religious affiliation” and “other religious affiliation”, the third category “Christian” is the reference category for the variable “religious affiliation” and does not appear in the plot.
Religions 11 00577 g0a5

Appendix C. Results of the Confirmatory Factor Analyses

Table A10. Overview of the models of time-invariance test: comparison of nested models for the CRS-5 between 2008 and 2019.
ModelNpar χ 2 dfp Δ χ 2 Δ d f SRMRCFITLIRMSEA [90% CI]pclose
single groupRM08119.6540.047--0.0131.000.990.038 [0.004; 0.069]0.70
RE191120.154<0.001--0.0160.990.980.064 [0.038; 0.093]0.17
measurement invarianceequal form2229.808<0.001--0.0130.990.990.037 [0.024; 0.052]0.92
equal factor loadings1839.3512<0.0019.5640.0150.990.990.034 [0.023; 0.046]0.99
equal residual variances13101.6717<0.00162.3150.0310.980.970.050 [0.041; 0.060]0.46
equal residual co-/variances12124.0218<0.00122.3510.0340.970.970.055 [0.046; 0.064]0.18
Note. RM08—data from the first wave of the Religion Monitor from Russia in 2008. RE19—combined data from the projects “Religion & Economics” and “The Paradox of Interrelation between Religion and Family in Modern Russia” in Russia in 2019. The sample size for the singe group models is N = 984 , the sample size for the measurement invariance models is 984 × 2 = 1968 ; Npar–number of estimated parameters; χ 2 —chi-square test value; df—degrees of freedom; Δ χ 2 —the difference in chi-square value to the previous model; Δ d f —the difference in degrees of freedom to the previous model; SRMR—standardized root mean square residual; CFI—comparative fit index; TLI—Tucker-Lewis index; RMSEA—root mean square error of approximation; CI—confidence interval; pclose—probability value of the Close-Fit-function proposed by Browne and Cudeck (1993).
Table A11. Overview of the models of time-invariance test: comparison of nested models for the CRSi-7 between 2008 and 2019.
ModelNpar χ 2 dfp Δ χ 2 Δ d f SRMRCFITLIRMSEA [90% CI]pclose
single groupRM08118.7340.068 0.0131.000.990.035 [0.000; 0.066]0.75
RE191112.9240.012 0.0141.000.990.048 [0.020; 0.078]0.50
measurement invarianceequal form2221.6580.006 0.0131.000.990.029 [0.015; 0.045]0.99
equal factor loadings1832.18120.00110.5340.0180.990.990.029 [0.017; 0.042]1.00
equal residual variances1391.1417<0.00158.9650.0320.980.970.047 [0.038; 0.057]0.67
equal residual co-/variances12106.2518<0.00115.1110.0340.970.970.050 [0.041; 0.059]0.49
Note. RM08—data from the first wave of Religion Monitor from Russia in 2008. RE19—combined data from the projects “Religion & Economics” and “The Paradox of Interrelation between Religion and Family in Modern Russia” in Russia in 2019. The sample size for the single group models is N = 984 , the sample size for the measurement invariance models is 984 × 2 = 1968 ; Npar–number of estimated parameters; χ 2 —chi-square test value; df—degrees of freedom; Δ χ 2 —the difference in chi-square value to the previous model; Δ d f —the difference in degrees of freedom to the previous model; SRMR—standardized root mean square residual; CFI—comparative fit index; TLI—Tucker-Lewis index; RMSEA—root mean square error of approximation; CI—confidence interval; pclose—probability value of the Close-Fit-function proposed by Browne and Cudeck (1993).
Figure A6. IBM SPSS AMOS output oft he final confirmatory factor analysis time-invariant model of the Centrality of Religiosity Scale CRS-5 in Russia in 2007 and 2019. Standardized Root Mean Residual for the model is S R M R = 0.022 .
Religions 11 00577 g0a6
Figure A7. IBM SPSS AMOS output of the final confirmatory factor analysis time-invariant model of the Centrality of Religiosity Scale CRSi-7 in Russia in 2007 and 2019. Standardized Root Mean Residual is S R M R = 0.019 .
Religions 11 00577 g0a7

References

  1. Ackert, Michael, Erekle Maglakelidze, Irina Badurashvili, and Stefan Huber. 2020. Validation of the Short Forms of the Centrality of Religiosity Scale in Georgia. Religions 11: 57. [Google Scholar] [CrossRef] [Green Version]
  2. Allport, Gordon W., and J. Michael Ross. 1967. Personal religious orientation and prejudice. Journal of Personality and Social Psychology 5: 432–43. Available online: https://www.ncbi.nlm.nih.gov/pubmed/6051769 (accessed on 8 October 2020). [CrossRef] [PubMed]
  3. Allport, Gordon W. 1950. The Individual and His Religion: A psychological Interpretation. Reprint, Fifth Printing 1965. New York: The Macmillan Company. [Google Scholar]
  4. Borenstein, Michael. 2009. Effect sizes for continuous data. In The Handbook of Research Synthesis and Meta-Analysis. Edited by Harris Cooper, Larry V. Hedges and Jeffrey C. Valentine. New York: Russell Sage Foundation, pp. 221–35. [Google Scholar]
  5. Browne, Michael W., and Robert Cudeck. 1993. Alternative ways of assessing model fit. In Testing Structural Equation Models. Edited by Kenneth A. Bollen and J. Scott Long. Newbury Park: SAGE Publications, pp. 136–10. [Google Scholar]
  6. Brown, Timothy A. 2015. Confirmatory factor analysis for applied research. In Methodology in the Social Sciences, 2nd ed. New York: The Guilford Press. [Google Scholar]
  7. Cain, Meghan K., Zhiyong Zhang, and Ke-Hai Yuan. 2017. Univariate and multivariate skewness and kurtosis for measuring nonnormality: Prevalence, influence and estimation. Behavior Research Methods 49: 1716–35. Available online: https://www.ncbi.nlm.nih.gov/pubmed/27752968 (accessed on 3 September 2020). [CrossRef] [PubMed]
  8. Cohen, Jacob. 1988. Statistical Power Analysis for the Behavioral Sciences, 2nd ed. Mahwah: Lawrence Erlbaum Associates. [Google Scholar]
  9. Emelyanov, Nikolay. 2016. The temporal structure of the activities of priests and the substantive effects of religious life in contemporary Russia. Социологическое Обозрение 15: 176–201. Available online: https://cyberleninka.ru/article/n/the-temporal-structure-of-the-activities-of-priests-and-the-substantive-effects-of-religious-life-in-contemporary-russia/viewer (accessed on 30 September 2020). [CrossRef] [Green Version]
  10. Glock, Charles Y. 1962. On the Study of Religious Commitment. Religious Education 57: 98–110. [Google Scholar] [CrossRef]
  11. Glock, Charles Y. 1973. Religion in Sociological Perspective; Essays in the Empirical Study of Religion. The Wadsworth Series in Sociology. Belmont: Wadsworth Pub. Co. [Google Scholar]
  12. Ho, Daniel E., Kosuke Imai, Gary King, and Elizabeth A. Stuart. 2007. Matching as nonparametric preprocessing for reducing model dependence in parametric causal inference. Political Analysis 15: 199–236. [Google Scholar] [CrossRef] [Green Version]
  13. Ho, Daniel E., Kosuke Imai, Gary King, and Elizabeth A. Stuart. 2011. MatchIt: Nonparametric preprocessing for parametric causal inference. Journal of Statistical Software. Available online: http://gking.harvard.edu/matchit (accessed on 2 March 2020). [CrossRef] [Green Version]
  14. Hu, Li-tze, and Peter M. Bentler. 1999. Cutoff Criteria for Fit Indexes in Covariance Structure Analysis: Conventional Criteria Versus New Alternatives. Structural Equation Modeling-A Multidisciplinary Journal 6: 1–55. [Google Scholar] [CrossRef]
  15. Huber, Stefan, and Bertelsmann Stiftung. 2010. Religionsmonitor der Bertelsmann Stiftung. ZA4663 Datenfile Version 1.0.0 (2010). Köln: GESIS Datenarchiv. [Google Scholar] [CrossRef]
  16. Huber, Stefan, and Odilo W. Huber. 2012. The Centrality of Religiosity Scale (CRS). Religions 3: 710–24. [Google Scholar] [CrossRef]
  17. Huber, Stefan, Michael Ackert, and Herbert Scheiblich. 2020. Religiosität in unterschiedlichen Religionskulturen—Vergleiche auf der Basis der Centrality of Religiosity Scale. Cultura & Psyché. [Google Scholar] [CrossRef]
  18. Huber, Stefan. 2003. Zentralität und Inhalt. Ein Neues Multidimensionales Messinstrument der Religiosität. Edited by Christel Gärtner, Winfried Gebhardt, Volkhard Krech, Gert Pickel and Monika Wohlrab-Sahr. Opladen: Springer Fachmedien Wiesbaden, vol. 9. [Google Scholar]
  19. Huber, Stefan. 2009. Religion Monitor 2008: Structuring principles, operational constructs, interpretive strategies. In What the World Believes: Analysis and Commentary on the Religion Monitor 2008. Gütersloh: Verlag Bertelsmann Stiftung, pp. 17–51. [Google Scholar]
  20. Hutcheson, Graeme, and Nick Sofroniou. 1999. The Multivariate Social Scientist: Introductory Statistics Using Generalized Linear Models. London and Thousand Oaks: Sage Publications. [Google Scholar]
  21. Karpov, Vyacheslav, Elena Lisovskaya, and David Barry. 2012. Ethnodoxy: How popular ideologies fuse religious and ethnic identities. Journal for the scientific Study of Religion 51: 638–55. [Google Scholar] [CrossRef]
  22. Kelly, George Alexander. 1991. The Psychology of Personal Constructs. London and New York: Taylor & Francis Ltd. [Google Scholar]
  23. Little, Roderick J. A., and Donald B. Rubin. 2002. Statistical Analysis with Missing Data, 2nd ed. Wiley Series in Probability and Mathematical Statistics Applied Probability and Statistics; New York: Wiley. [Google Scholar]
  24. Mardia, Kanti V. 1970. Measures of multivariate skewness and kurtosis with applications. Biometrika 57: 519–30. [Google Scholar] [CrossRef]
  25. McNeish, Daniel, and Melisa Gordon Wolf. 2020. Dynamic Fit Index Cutoffs for Confirmatory Factor Analysis Models. PsyArXiv. [Google Scholar] [CrossRef]
  26. R Development Core Team. 2020. R: A language and environment for statistical computing: R Foundation for Statistical Computing. Available online: http://www.r-project.org (accessed on 16 July 2020).
  27. Rieger, Martin, and Bertelsmann Stiftung. 2009. What the World Believes: Analyses and Commentary on the Religion Monitor 2008. Gütersloh: Verlag Bertelsmann Stiftung. [Google Scholar]
  28. Sahgal, Neha, and Alan Cooperman. 2017. Religious Belief and National Belonging in Central and Eastern Europe. Washington: Pew Research Center, Available online: https://www.pewforum.org/wp-content/uploads/sites/7/2017/05/CEUP-FULL-REPORT.pdf (accessed on 10 September 2020).
  29. Schafer, Joseph L. 1997. Analysis of Incomplete Multivariate Data. Boca Raton: CRC Press. First published 1999. [Google Scholar]
  30. Stark, Rodney, and Charles Young Glock. 1968. American Piety: The Nature of Religious Commitment. Berkeley: University of California Press, vol. 1, Reprint, Third Printing 1974. [Google Scholar]
  31. Streib, Heinz, and Ralph W. Hood Jr. 2016. Semantics and Psychology of Spirituality: A Cross-Cultural Analysis. Edited by Heinz Streib and Ralph W. Hood Cham Jr. Heidelberg, New York, Dordrecht and London: Springer International Publishing. [Google Scholar]
  32. Зоркая, Наталия. 2009. Православие в безрелигиозном обществе. Вестник Общественного Мнения. Данные. Анализ. Дискуссии, 65–84. [Google Scholar]
  33. Каариайнен, Киммо, and Дмитрий Фурман. 2007a. Религиозность в России на рубеже XX–XXI столетий (Окончание). Общественные Науки и Современность, 78–95. Available online: http://ecsocman.hse.ru/ons/msg/19004859.html (accessed on 11 September 2020).
  34. Каариайнен, Киммо, and Дмитрий Фурман. 2007b. Религиозность в России на рубеже XX–XXI столетий (часть 1). Общественные Науки и Современность. pp. 103–19. Available online: http://ecsocman.hse.ru/ons/msg/297333.html (accessed on 11 September 2020).
  35. Лебедев, Сергей Дмитриевич, and Виктор Викторович Сухоруков. 2013. Тесный путь не туда? Социологические Исследования, 118–26. [Google Scholar]
  36. Мчедлова, Мария Мирановна. 2009. Роль религии в современном обществе. Социологические Исследования, 77–84. [Google Scholar]
  37. Пруцкова, Елена Викторовна, and Кирилл Васильевич Маркин. 2017. Типология православных россиян: проблема конструирования обобщенного показателя религиозности. Социологические Исследования, 95–105. [Google Scholar]
  38. Синелина, Юлия Юрьевна. 2006. Изменение Религиозности Населения России. Москва: Наука. [Google Scholar]
  39. Синелина, Юлия Юрьевна. 2013. О динамике религиозности россиян и некоторых методологических проблемах ее изучения (религиозное сознание и поведение православных и мусульман). Социологические Исследования, 104–15. [Google Scholar]
  40. Филатов, Сергей Борисович, and Роман Николаевич Лункин. 2005. Статистика российской религиозности: магия цифр и неоднозначная реальность. Социологические Исследования, 35–45. [Google Scholar]
  41. Хубер, Штефан, and Одило Хубер. 2019. Шкала центральности религиозности (CRS). Социология: Методология, Методы, Математическое Моделирование (4М), 144–71. [Google Scholar]
  42. Чеснокова, Валентина Федоровна. 2009. Тесным Путем. Процесс Воцерковления Населения России в Конце XX Века. Moscow: Академический Проект. [Google Scholar]
1
For continuous updates of the map please navigate to this web-address: www.ier.unibe.ch Forschung Centrality of Religiosity Scale (CRS).
Figure 1. Applications of the Centrality of Religiosity Scale (CRS) by country until May 2020. The number on the territory of each country indicates the number of applications within empirical studies. Darker shades of grey mean a higher number of applications in one country.
Religions 11 00577 g001
Figure 2. Graphical representation of the tested models for the CRS-5 and the CRSi-7. Residuals e1 to e5 are depicted as small circles. Rectangles represent (from left to right) the items of the scale i.e., the core-dimensions of religious ideology, intellectual reflections on religious topics, religious experience, private and public religious practice. The oval represents the latent variable of “centrality of religiosity”. Straight arrows show factor loadings, curved arrow represents the covariance of two residuals e4 and e5.
Religions 11 00577 g002
Table 1. Sample characteristics for the demographical variables in the datasets from 2008 and 2019 on the CRS in Russia.
RM08RE19
N9841768
sex, female in %33.552.7
age, M(SD)46.5 (18.8)39.8 (13.1)
religious affiliation in %Christian *80.067.4
Other5.55.1
None14.527.5
Note. * Christian–the majority of the Christian group is constituted of Orthodox Christians: In the RM08-dataset, no further breakdown of the Christian denomination can be made, in RE19 N = 1147 are Orthodox, N = 7 are Catholic, N = 6 are Protestant, N = 4 are Pentecostals, N = 20 another Christian denomination. CRS—Centrality of Religiosity Scale. RM08—data from the first wave of Religion Monitor from Russia in 2008. RE19—combined data from the projects “Religion & Economics” and “The Paradox of Interrelation between Religion and Family in Modern Russia” in Russia in 2019. N—number of cases; M—mean; SD—standard deviation.
Table 2. Sample characteristics for the demographical variables in the datasets from 2008 and 2019 on the CRS in Russia after matching preprocessing.
RM08RE19
N984984
sex, female in %33.538.2
age, M(SD)46.5 (18.7)42.2 (13.3)
religious affiliation in %Christian *80.077.3
Other5.55.3
None14.517.4
Note. * Christian–the majority of the Christian group are Orthodox Christians, after the data preprocessing no detailed information can be given on the distribution of the Christian denominations within the group. CRS—Centrality of Religiosity Scale. RM08—data from the first wave of the Religion Monitor from Russia in 2008. RE19—combined data from the projects “Religion & Economics” and “The Paradox of Interrelation between Religion and Family in Modern Russia” in Russia in 2019. N—number of cases; M—mean; SD—standard deviation.
Table 3. Skewness and kurtosis of the data from RM08 and RE19 as an assessment of non-normality.
ScaleProjectSkewnessKurtosis
b 1 , p χ 2 ( p ) adj- χ 2   ( p ) b 2 , p N ( b 2 , p ) ,   ( p )
CRS-5RM081.69277.21 (<0.001)278.33 (<0.001)38.576.69, (<0.001)
RE192.36387.60 (<0.001)389.17 (<0.001)38.606.75, (<0.001)
CRSi-7RM081.54252.98 (<0.001)254.01 (<0.001)37.715.08, (<0.001)
RE191.85303.65 (<0.001)304.89 (<0.001)38.075.75, (<0.001)
Note. CRS—Centrality of Religiosity Scale. RM08—data from the first wave of the Religion Monitor from Russia in 2008. RE19—combined data from the projects “Religion & Economics” and “The Paradox of Interrelation between Religion and Family in Modern Russia” in Russia in 2019. Sample size N = 984 for each sample. b1,p—Mardia’s multivariate skewness, b2,p—Mardia’s multivariate kurtosis. N(b2,p)—Mardia’s test value of multivariate kurtosis. Values of b1,p > 0 and b2,p > 35 (which is the result of the term p(p + 2), where p is the number of items, here p = 5) show deviations from multivariate normality in skewness and kurtosis respectively.
Table 4. Means, standard deviations, and differences from the datasets from the RM08 and the RE19 data in Russia.
RM08RE19Difference
MeanSDMeanSDMeanSD
Ideology2.921.243.211.120.29−0.12
Intellect2.411.102.871.020.46−0.08
Interactive Experience2.351.142.771.000.42−0.14
Participative Experience2.241.182.451.080.21−0.10
Prayer2.531.552.751.510.22−0.04
Meditation1.220.741.571.050.350.31
Public practice2.151.192.101.03−0.05−0.16
CRS-52.470.972.740.900.27−0.07
CRSi-72.550.962.820.870.27−0.09
Note. The difference is calculated by subtracting the RM08 from RE19 values. SD—standard deviation. The range of the values for each category on the left is from 1 to 5. The RM08-data are from the first wave of the Religion Monitor from Russia in 2008. The RE19-combined data are from the projects “Religion & Economics” and “The Paradox of Interrelation between Religion and Family in Modern Russia” in Russia in 2019.
Table 5. Correlations of the core-dimensions of the CRS-5 in the matched data of RM08 and RE19.
CRS-5 Ideology   ( x 1 ) Intellect   ( x 2 ) Interactive   Experience   ( x 3 ) Prayer   ( x 4 )
Ideology ( x 1 )0.81/0.84
Intellect. ( x 2 )0.77/0.760.57/0.59
Interactive experience ( x 3 )0.78/0.760.59/0.640.58/0.55
Prayer ( x 4 )0.81/0.850.57/0.610.50/0.500.47/0.50
Public practice ( x 5 )0.70/0.720.41/0.460.42/0.410.43/0.380.49/0.58
Note. N = 984 for each cell. All listed correlations are significant at p < 0.001 level. In each cell, the number left of the slash is the RM08, and right to the slash is the RE19 correlation. CRS—Centrality of Religiosity Scale. RM08—data from the first wave of Religion Monitor from Russia in 2008. RE19—combined data from the projects “Religion & Economics” and “The Paradox of Interrelation between Religion and Family in Modern Russia” in Russia in 2019.
Table 6. Correlations of the core-dimensions of the CRSi-7 in the matched date of RM08 and RE19.
CRSi-7 Ideology   ( x 1 ) Intellect   ( x 2 ) Experience   ( x 3 ) Private   Practice   ( x 4 )
Ideology ( x 1 )0.81/0.82
Intellect. ( x 2 )0.77/0.760.57/0.59
Experience ( x 3 )0.74/0.710.56/0.530.54/0.51
Private practice ( x 4 )0.81/0.840.56/0.580.49/0.500.44/0.47
Public practice ( x 5 )0.70/0.710.41/0.460.42/0.410.37/0.330.49/0.56
Note. N = 984 for each cell. All listed correlations are significant at p < 0.001 level. In each cell, the number left of the slash is the RM08, and right of the slash is the RE19 correlation. Experience is the maximum value of interactive or participative experience. Private practice is the maximum value of prayer or meditation. CRS—Centrality of Religiosity Scale. RM08—data from the first wave of Religion Monitor from Russia in 2008. RE19—combined data from the projects “Religion & Economics” and “The Paradox of Interrelation between Religion and Family in Modern Russia” in Russia in 2019.
Table 7. Results of the exploratory factor analyses of the CRS short versions in RM08 and RE19.
ProjectScaleKMOBartlett’s Test χ 2 ( d f ) ,   p Factors with Eigenvalue > 1Explained Variance
RM08CRS-50.841753.87 (10), <0.001150.58%
CRSi-70.841640.88 (10), <0.001148.91%
RE19CRS-50.831967.43 (10), <0.001152.71%
CRSi-70.831742.89 (10), <0.001150.03%
Note. The sample size for all listed samples is N = 984 . RM08—data from the first wave of the Religion Monitor from Russia in 2008. RE19—combined data from the projects “Religion & Economics” and “The Paradox of Interrelation between Religion and Family in Modern Russia” in Russia in 2019. CRS—Centrality of Religiosity Scale. CRSi—interreligious CRS. KMO—Kaiser-Meyer-Olkin criterion, p—probability level, df—degrees of freedom.
Table 8. An overview of the parameter estimates of the time-invariant model of the CRS-5
Core-DimensionDesig-NationFactor Loading— λ   [ 90 %   C I ] ,   p Squared Correlations— R 2   [ 90 %   C I ] ,   p Residual Variance— δ   [ 90 %   C I ] ,   p
ideology x 1 0.82 [0.79; 0.83], 0.020.66 [0.63; 0.69], 0.020.47 [0.43; 0.51], 0.01
intellect x 2 0.73 [0.69; 0.75], 0.020.53 [0.48; 0.56], 0.020.53 [0.50; 0.59], <0.01
interact. exp. x 3 0.75 [0.73; 0.78], <0.010.56 [0.53; 0.61], <0.010.50 [0.46; 0.54], 0.01
priv. pract. x 4 0.69 [0.67; 0.72], 0.010.48 [0.44; 0.51], 0.011.22 [1.14; 1.31], 0.01
publ. pract. x 5 0.54 [0.51; 0.58], 0.010.30 [0.26; 0.34], 0.010.87 [0.81; 0.93], 0.02
Note. CRS—Centrality of Religiosity Scale. CRSi—interreligious CRS. Interact.—interactive; exp.—experience; priv.—private; publ.—public; pract.—practice. Each cell contains a point estimate along with a 95% bootstrap confidence interval. All parameter estimates are reported with a 90% bootstrap confidence interval with B = 200 drawings. CI—confidence interval. p—probability. The modeled correlation of the residuals of private and public practice is δ x 4 x 5 = 0.26   [ 0.21 ; 0.31 ] ,   p = 0.02 .
Table 9. An overview of the parameter estimates of the time-invariant model of the CRSi-7.
Core-DimensionDesig-NationFactor Loading— λ   [ 90 %   C I ] ,   p Squared Correlations— R 2   [ 90 %   C I ] ,   p Residual Variance— δ   [ 90 %   C I ] ,   p
ideology x 1 0.80 [0.77; 0.82], 0.020.64 [0.60; 0.67], 0.010.50 [0.46; 0.56], <0.01
intellect x 2 0.74 [0.71; 0.76], 0.010.54 [0.50; 0.58], 0.010.52 [0.47; 0.57], 0.01
experience x 3 0.69 [0.66; 0.72], <0.010.47 [0.44; 0.52], <0.010.60 [0.55; 0.64], 0.01
priv. pract. x 4 0.69 [0.66; 0.71], 0.010.47 [0.44; 0.51], 0.011.23 [1.13; 1.32], 0.01
publ. pract. x 5 0.54 [0.51; 0.58], 0.010.29 [0.26; 0.34], 0.020.88 [0.81; 0.93], 0.03
Note. CRS—Centrality of Religiosity Scale. CRSi—interreligious CRS. Priv.—private; publ.—public; pract.—practice. Each cell contains the point estimate along with a 95% bootstrap confidence interval. All parameter estimates are reported with a 90% bootstrap confidence interval with B = 200 drawings. CI—confidence interval. p—probability. The correlation of the residuals of private and public practice δ x 4 x 5 = 0.25   [ 0.21 ; 0.30 ]   p = 0.01 .
Publisher’s Note: MDPI stays neutral with regard to jurisdictional claims in published maps and institutional affiliations.

