MicroRNA-34a (miR-34a) Mediates Retinal Endothelial Cell Premature Senescence through Mitochondrial Dysfunction and Loss of Antioxidant Activities


Abstract

1. Introduction
2. Materials and Methods
2.1. Cells and Treatment
2.2. Micro RNA Detection
2.3. MiR-34a Over-Expression or Inhibition in HuREC
2.4. Senescence-Associated β-Galactosidase Activity Assay
2.5. Protein Detection
2.6. Assessment of Mitochondrial Function
2.7. Reactive Oxygen Species Assays
2.8. Fluorescence-Activated Cell-Sorting (FACS) Analysis for Mitochondrial Membrane Potential and Density
2.9. Luciferase Assay
2.10. Statistical Analysis
3. Result
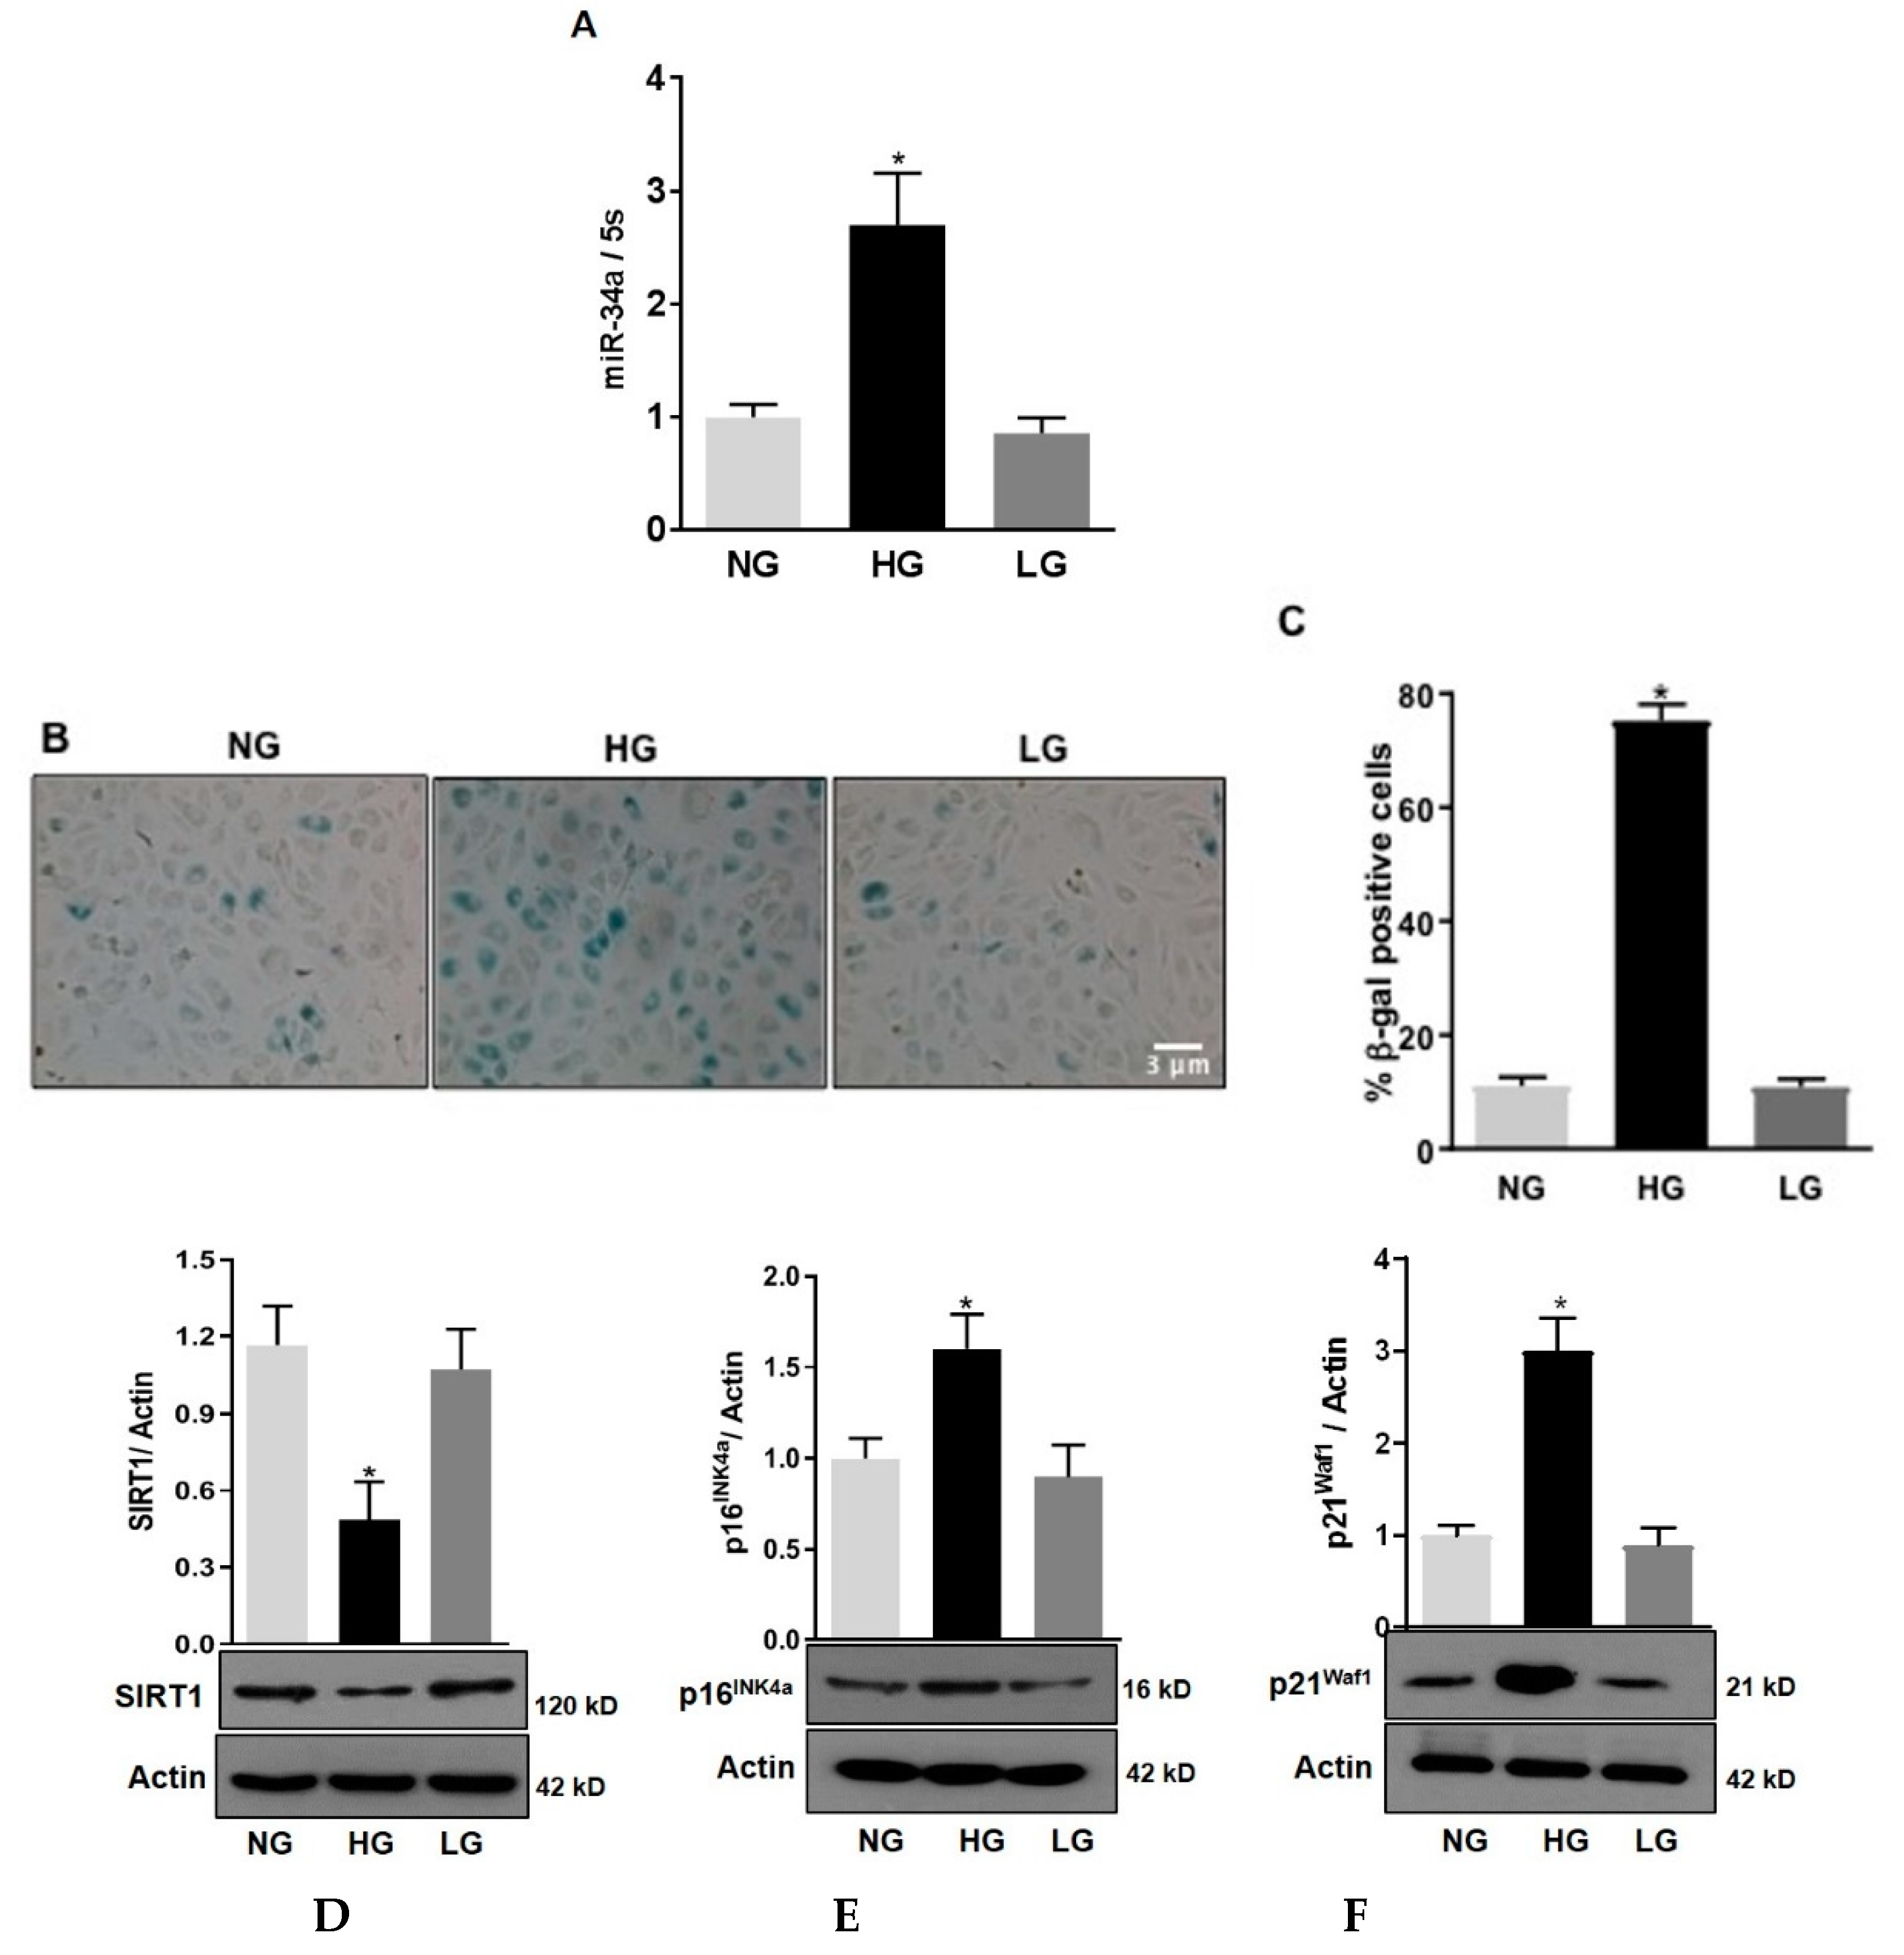
3.1. High Glucose Stimulates miR-34a Expression and Promotes HuREC Senescence
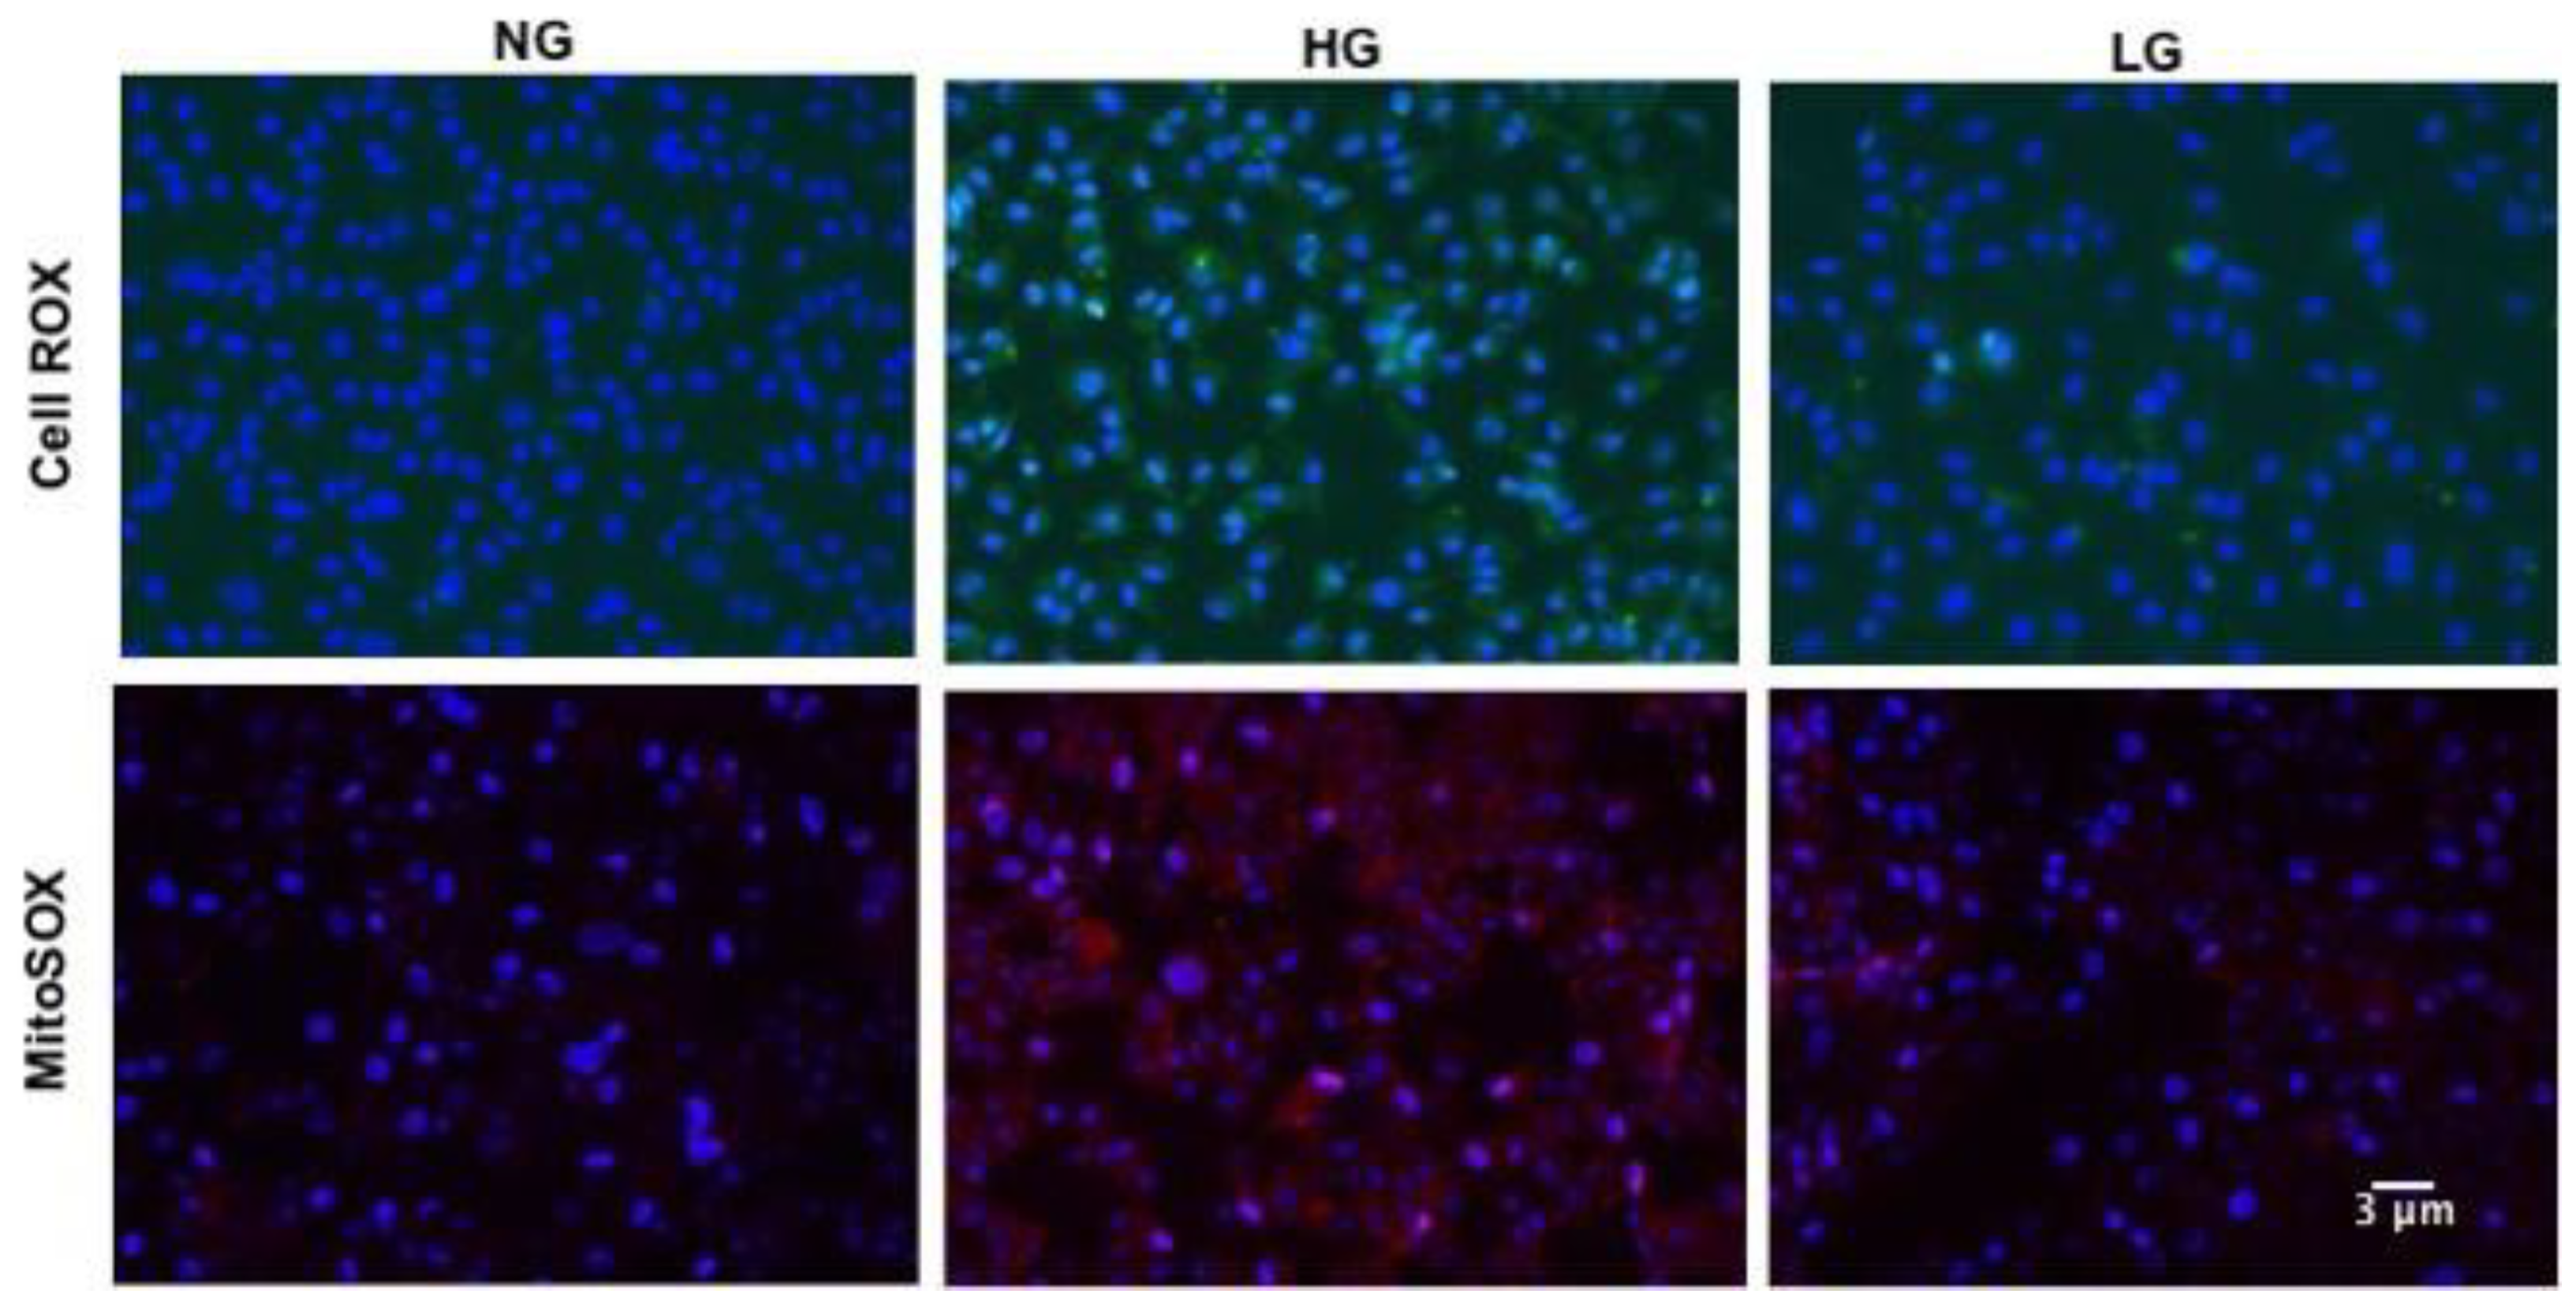
3.2. High Glucose Promotes Mitochondrial ROS Production in HuREC
3.3. MiR-34a Inhibition Prevents High Glucose-Induced Vascular Senescence and Oxidative Stress in HuREC
3.4. MiR-34a Mimic Triggers Vascular Senescence and ROS Production in HuREC
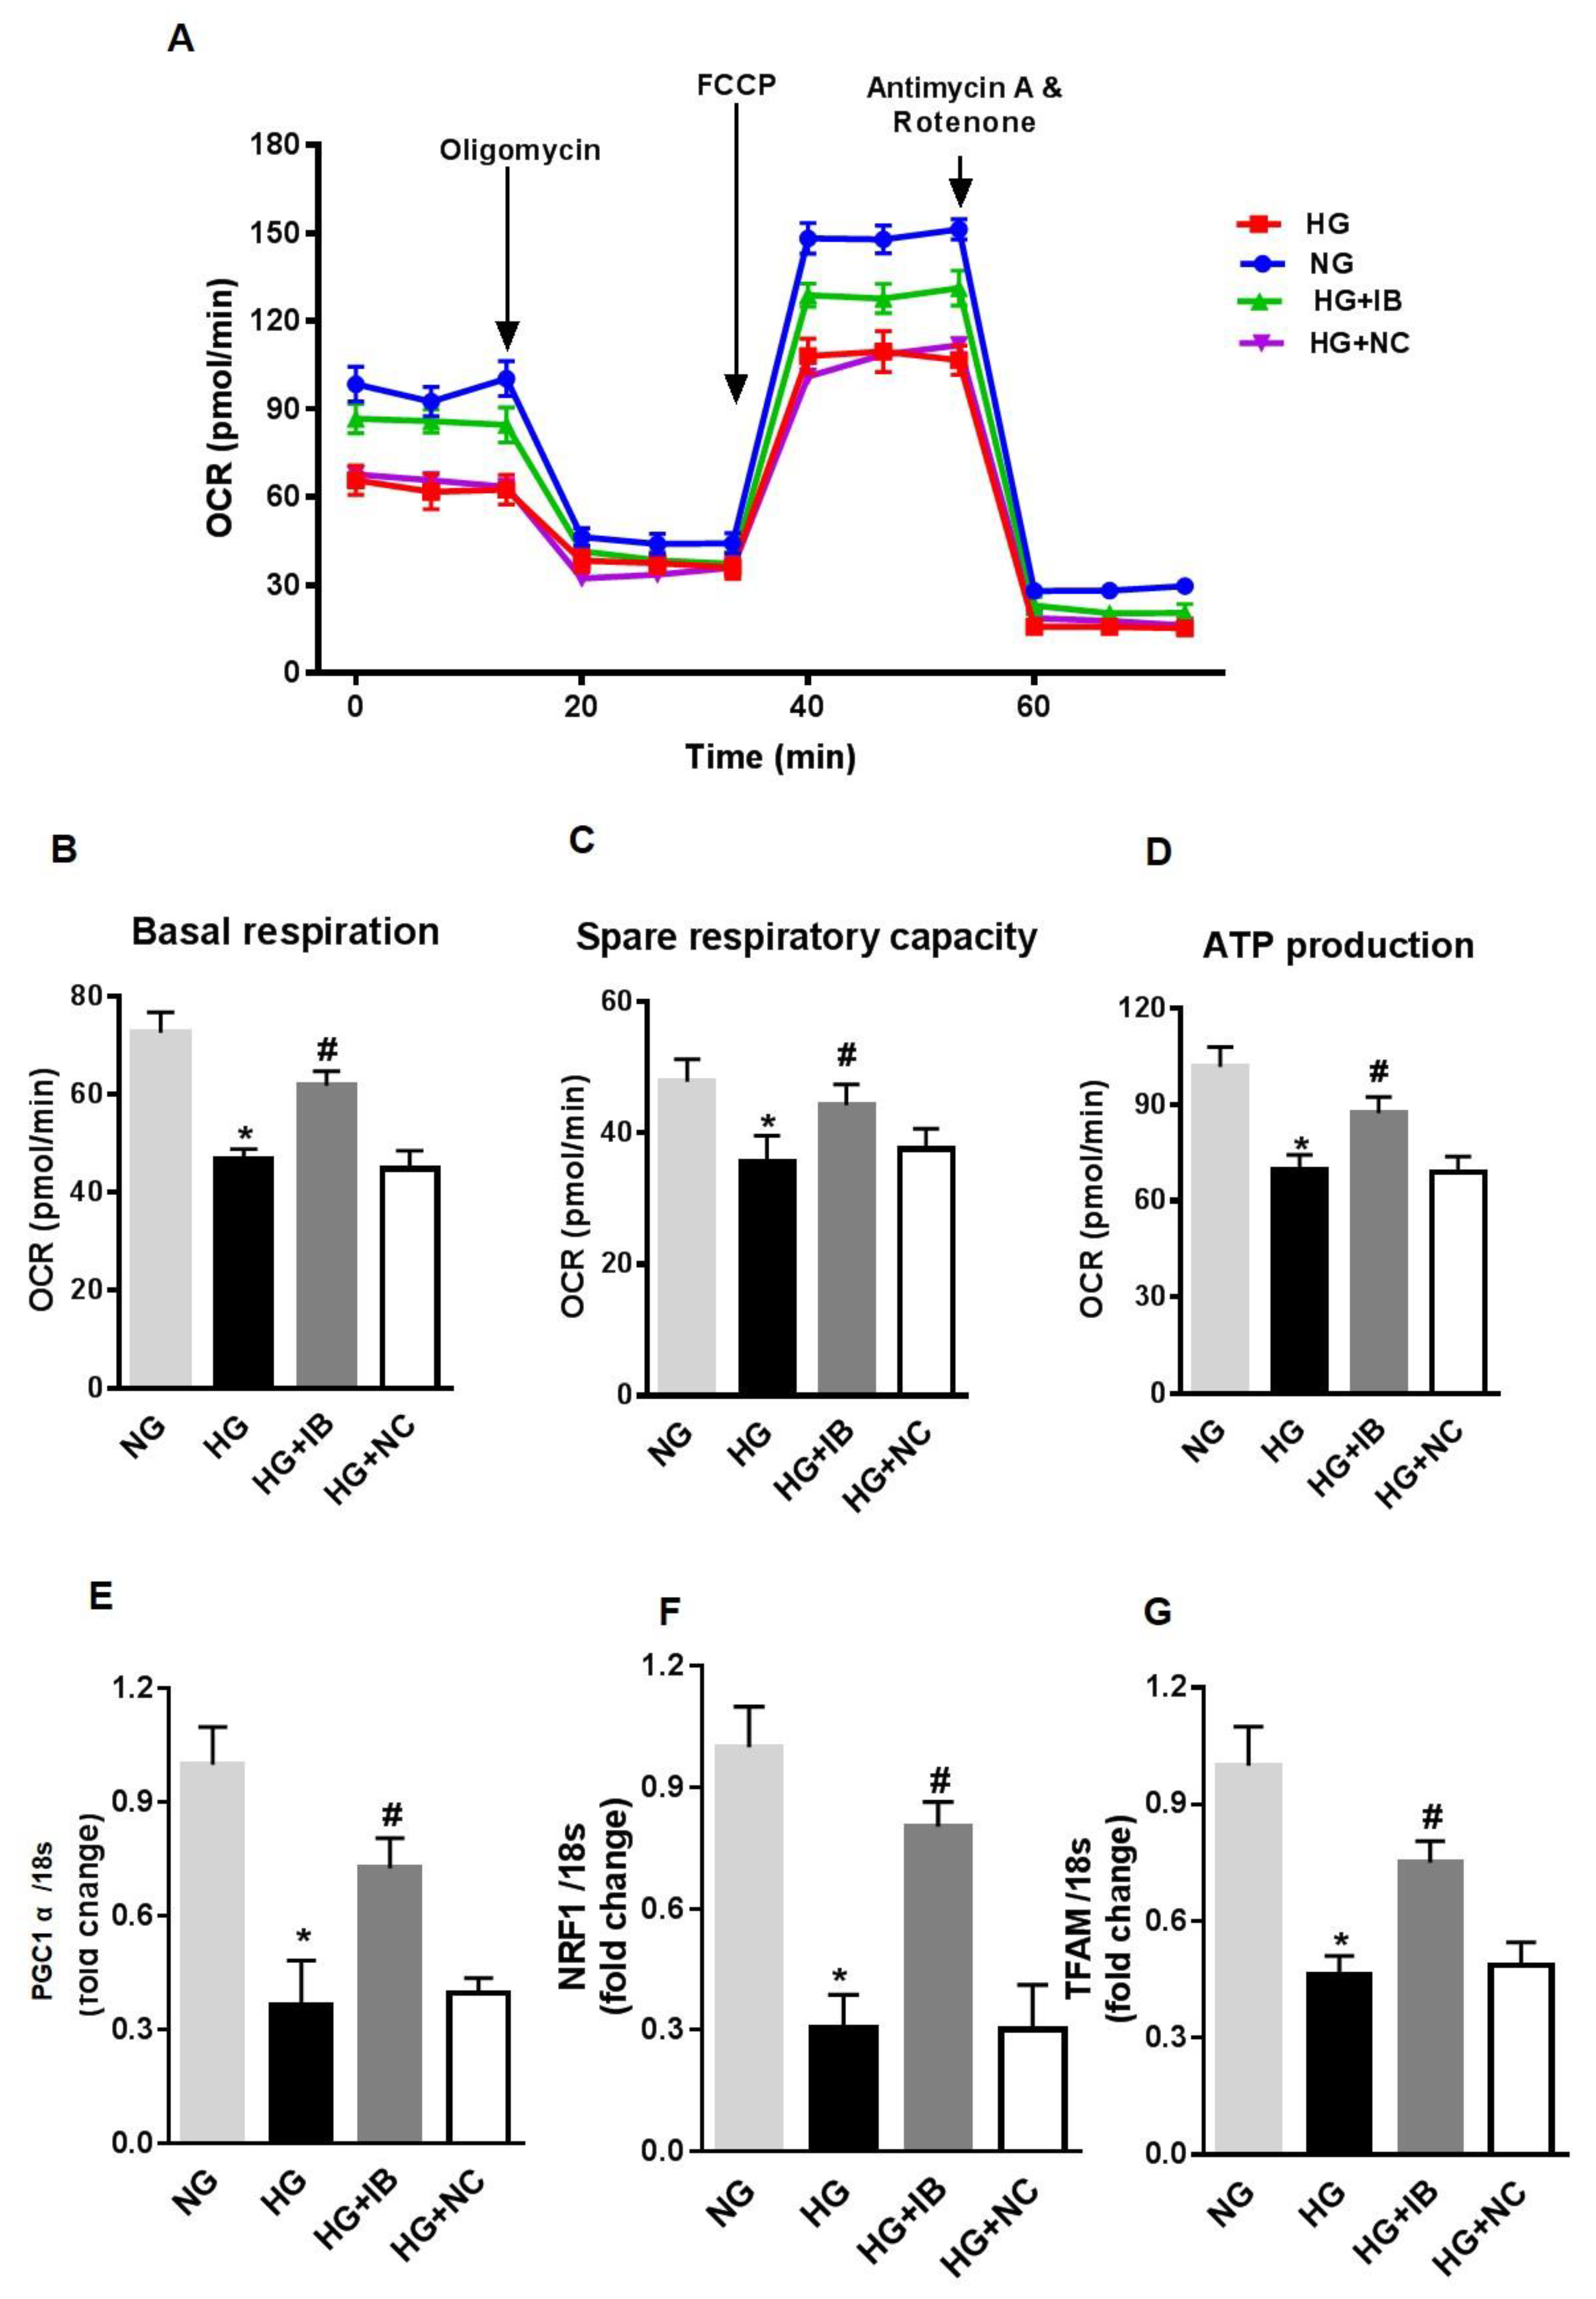
3.5. Inhibition of MiR-34a Halts High Glucose-Induced Loss of SIRT1, SOD2, and TrxR2
3.6. MiR34a Mimic Inhibits the Expression of SOD2, TrxR2, and SIRT1
3.7. SIRT1 and TrxR2 but Not SOD2 Are Direct Targets of MiR34a
4. Discussion
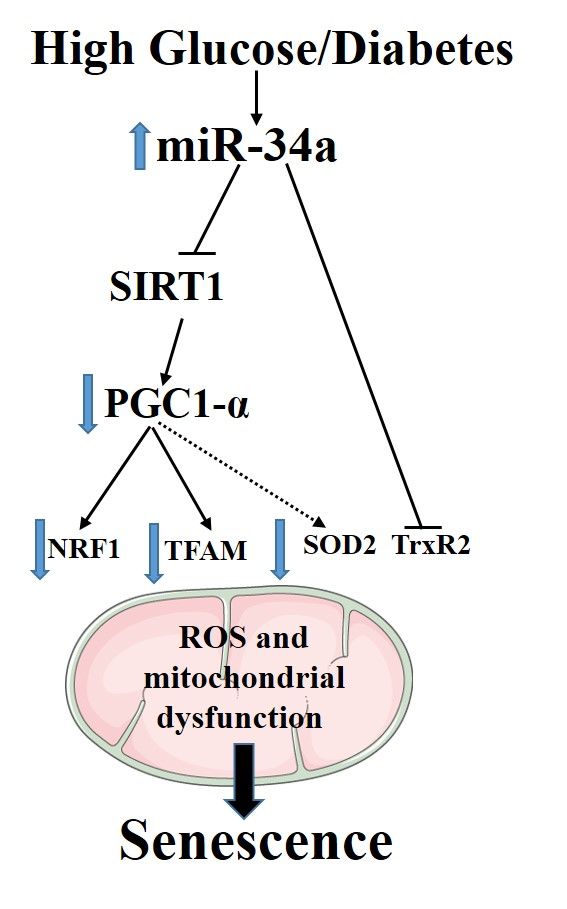
5. Conclusions
Author Contributions
Funding
Acknowledgments
Conflicts of Interest
References
- Duh, E.J.; Sun, J.K.; Stitt, A.W. Diabetic retinopathy: Current understanding, mechanisms, and treatment strategies. JCI Insight 2017, 2. [Google Scholar] [CrossRef] [PubMed]
- Antonetti, D.A.; Klein, R.; Gardner, T.W. Diabetic retinopathy. N. Engl. J. Med. 2012, 366, 1227–1239. [Google Scholar] [CrossRef] [PubMed]
- Lamoke, F.; Sean, S.; Yuan, J.; Ananth, S.; Duncan, M.; Martin, P.; Bartoli, M. Increased oxidative and nitrative stress accelerates aging of the retinal vasculature in the diabetic retina. PLoS ONE 2015, 10, e0139664. [Google Scholar] [CrossRef] [PubMed]
- Kitada, K.; Nakano, D.; Ohsaki, H.; Hitomi, H.; Minamino, T.; Yatabe, J.; Felder, R.A.; Mori, H.; Masaki, T.; Kobori, H.; et al. Hyperglycemia causes cellular senescence via a SGLT2- and p21-dependent pathway in proximal tubules in the early stage of diabetic nephropathy. J. Diabetes Its Complicat. 2014, 28, 604–611. [Google Scholar] [CrossRef] [PubMed]
- Maeda, M.; Hayashi, T.; Mizuno, N.; Hattori, Y.; Kuzuya, M. Intermittent high glucose implements stress-induced senescence in human vascular endothelial cells: Role of superoxide production by NADPH oxidase. PLoS ONE 2015, 10, e0123169. [Google Scholar] [CrossRef] [PubMed]
- Chen, H.; Wan, Y.; Zhou, S.; Lu, Y.; Zhang, Z.; Zhang, R.; Chen, F.; Hao, D.; Zhao, X.; Guo, Z.; et al. Endothelium-specific SIRT1 overexpression inhibits hyperglycemia-induced upregulation of vascular cell senescence. Sci. China Life Sci. 2012, 55, 467–473. [Google Scholar] [CrossRef] [PubMed]
- Mortuza, R.; Chen, S.; Feng, B.; Sen, S.; Chakrabarti, S. High glucose induced alteration of SIRTs in endothelial cells causes rapid aging in a p300 and FOXO regulated pathway. PLoS ONE 2013, 8, e54514. [Google Scholar] [CrossRef] [PubMed]
- Arunachalam, G.; Samuel, S.M.; Marei, I.; Ding, H.; Triggle, C.R. Metformin modulates hyperglycaemia-induced endothelial senescence and apoptosis through SIRT1. Br. J. Pharmacol. 2014, 171, 523–535. [Google Scholar] [CrossRef]
- Childs, B.G.; Durik, M.; Baker, D.J.; van Deursen, J.M. Cellular senescence in aging and age-related disease: From mechanisms to therapy. Nat. Med. 2015, 21, 1424–1435. [Google Scholar] [CrossRef]
- Satari, M.; Aghadavod, E.; Mirhosseini, N.; Asemi, Z. The effects of microRNAs in activating neovascularization pathways in diabetic retinopathy. J. Cell. Biochem. 2019, 120, 9514–9521. [Google Scholar] [CrossRef]
- Mastropasqua, R.; Toto, L.; Cipollone, F.; Santovito, D.; Carpineto, P.; Mastropasqua, L. Role of microRNAs in the modulation of diabetic retinopathy. Prog. Retin. Eye Res. 2014, 43, 92–107. [Google Scholar] [CrossRef] [PubMed]
- Yamakuchi, M.; Ferlito, M.; Lowenstein, C.J. miR-34a repression of SIRT1 regulates apoptosis. Proc. Natl. Acad. Sci. USA 2008, 105, 13421–13426. [Google Scholar] [CrossRef] [PubMed]
- Tian, X.F.; Ji, F.J.; Zang, H.L.; Cao, H. Activation of the miR-34a/SIRT1/p53 Signaling Pathway Contributes to the Progress of Liver Fibrosis via Inducing Apoptosis in Hepatocytes but Not in HSCs. PLoS ONE 2016, 11, e0158657. [Google Scholar] [CrossRef] [PubMed]
- Ito, T.; Yagi, S.; Yamakuchi, M. MicroRNA-34a regulation of endothelial senescence. Biochem. Biophys. Res. Commun. 2010, 398, 735–740. [Google Scholar] [CrossRef] [PubMed]
- Badi, I.; Burba, I.; Ruggeri, C.; Zeni, F.; Bertolotti, M.; Scopece, A.; Pompilio, G.; Raucci, A. MicroRNA-34a Induces Vascular Smooth Muscle Cells Senescence by SIRT1 Downregulation and Promotes the Expression of Age-Associated Pro-inflammatory Sretory Factors. J. Gerontol. Ser. A Biol. Sci. Med. Sci. 2015, 70, 1304–1311. [Google Scholar] [CrossRef] [PubMed]
- Banerjee, J.; Khanna, S.; Bhattacharya, A. MicroRNA Regulation of Oxidative Stress. Oxidative Med. Cell. Longev. 2017, 2017, 2872156. [Google Scholar] [CrossRef]
- Zhang, H.; Zhao, Z.; Pang, X.; Yang, J.; Yu, H.; Zhang, Y.; Zhou, H.; Zhao, J. MiR-34a/sirtuin-1/foxo3a is involved in genistein protecting against ox-LDL-induced oxidative damage in HUVECs. Toxicol. Lett. 2017, 277, 115–122. [Google Scholar] [CrossRef]
- Hermeking, H. The miR-34 family in cancer and apoptosis. Cell Death Differ. 2010, 17, 193–199. [Google Scholar] [CrossRef]
- Slabakova, E.; Culig, Z.; Remsik, J.; Soucek, K. Alternative mechanisms of miR-34a regulation in cancer. Cell Death Dis. 2017, 8, e3100. [Google Scholar] [CrossRef]
- Li, N.; Wang, K.; Li, P.F. MicroRNA-34 Family and Its Role in Cardiovascular Disease. Crit. Rev. Eukaryot. Gene Expr. 2015, 25, 293–297. [Google Scholar] [CrossRef]
- Bernardo, B.C.; Ooi, J.Y.; Matsumoto, A.; Tham, Y.K.; Singla, S.; Kiriazis, H.; Patterson, N.L.; Sadoshima, J.; Obad, S.; Lin, R.C.; et al. Sex differences in response to miRNA-34a therapy in mouse models of cardiac disease: Identification of sex-, disease- and treatment-regulated miRNAs. J. Physiol. 2016, 594, 5959–5974. [Google Scholar] [CrossRef] [PubMed]
- Zhao, D.; Wang, N.S.; Chen, F.; Li, Z.B.; Li, X.T.; Zhu, X.X. Intravenous Injection of miR-34a Inhibitor Alleviates Diabetes Mellitus-Induced Vascular Endothelial Dysfunction by Targeting NOTCH1. Exp. Clin. Endocrinol. Diabetes 2019, 127, 255–262. [Google Scholar] [CrossRef] [PubMed]
- Shen, Y.; Xu, H.; Pan, X.; Wu, W.; Wang, H.; Yan, L.; Zhang, M.; Liu, X.; Xia, S.; Shao, Q. miR-34a and miR-125b are upregulated in peripheral blood mononuclear cells from patients with type 2 diabetes mellitus. Exp. Ther. Med. 2017, 14, 5589–5596. [Google Scholar] [CrossRef] [PubMed]
- Lin, Y.; Shen, J.; Li, D.; Ming, J.; Liu, X.; Zhang, N.; Lai, J.; Shi, M.; Ji, Q.; Xing, Y. MiR-34a contributes to diabetes-related cochlear hair cell apoptosis via SIRT1/HIF-1alpha signaling. Gen. Comp. Endocrinol. 2017, 246, 63–70. [Google Scholar] [CrossRef] [PubMed]
- Kowluru, R.A.; Mishra, M. Oxidative stress, mitochondrial damage and diabetic retinopathy. Biochim. Et Biophys. Acta 2015, 1852, 2474–2483. [Google Scholar] [CrossRef]
- Wu, Y.; Tang, L.; Chen, B. Oxidative stress: Implications for the development of diabetic retinopathy and antioxidant therapeutic perspectives. Oxidative Med. Cell. Longev. 2014, 2014, 752387. [Google Scholar] [CrossRef] [PubMed]
- Fan, F.; Zhuang, J.; Zhou, P.; Liu, X.; Luo, Y. MicroRNA-34a promotes mitochondrial dysfunction-induced apoptosis in human lens epithelial cells by targeting Notch2. Oncotarget 2017, 8, 110209–110220. [Google Scholar] [CrossRef]
- Bukeirat, M.; Sarkar, S.N.; Hu, H.; Quintana, D.D.; Simpkins, J.W.; Ren, X. MiR-34a regulates blood-brain barrier permeability and mitochondrial function by targeting cytochrome c. J. Cereb. Blood Flow Metab. 2016, 36, 387–392. [Google Scholar] [CrossRef]
- Murri, M.; El Azzouzi, H. MicroRNAs as regulators of mitochondrial dysfunction and obesity. Am. J. Physiol. Heart Circ. Physiol. 2018, 315, H291–H302. [Google Scholar] [CrossRef]
- Bai, X.Y.; Ma, Y.; Ding, R.; Fu, B.; Shi, S.; Chen, X.M. miR-335 and miR-34a Promote renal senescence by suppressing mitochondrial antioxidative enzymes. J. Am. Soc. Nephrol. 2011, 22, 1252–1261. [Google Scholar] [CrossRef]
- Thounaojam, M.C.; Powell, F.L.; Patel, S.; Gutsaeva, D.R.; Tawfik, A.; Smith, S.B.; Nussbaum, J.; Block, N.L.; Martin, P.M.; Schally, A.V.; et al. Protective effects of agonists of growth hormone-releasing hormone (GHRH) in early experimental diabetic retinopathy. Proc. Natl. Acad. Sci. USA 2017, 114, 13248–13253. [Google Scholar] [CrossRef] [PubMed]
- Warren, M.; Subramani, K.; Schwartz, R.; Raju, R. Mitochondrial dysfunction in rat splenocytes following hemorrhagic shock. Biochim. Et Biophys. Acta. Mol. Basis Dis. 2017, 1863, 2526–2533. [Google Scholar] [CrossRef] [PubMed]
- Kitada, M.; Ogura, Y.; Monno, I.; Koya, D. Sirtuins and Type 2 Diabetes: Role in Inflammation, Oxidative Stress, and Mitochondrial Function. Front. Endocrinol. 2019, 10, 187. [Google Scholar] [CrossRef] [PubMed]
- Candas, D.; Li, J.J. MnSOD in oxidative stress response-potential regulation via mitochondrial protein influx. Antioxid. Redox Signal. 2014, 20, 1599–1617. [Google Scholar] [CrossRef] [PubMed]
- Santiago, A.R.; Boia, R.; Aires, I.D.; Ambrosio, A.F.; Fernandes, R. Sweet Stress: Coping with Vascular Dysfunction in Diabetic Retinopathy. Front. Physiol. 2018, 9, 820. [Google Scholar] [CrossRef] [PubMed]
- Kong, L.; Zhu, J.; Han, W.; Jiang, X.; Xu, M.; Zhao, Y.; Dong, Q.; Pang, Z.; Guan, Q.; Gao, L.; et al. Significance of serum microRNAs in pre-diabetes and newly diagnosed type 2 diabetes: A clinical study. Acta Diabetol. 2011, 48, 61–69. [Google Scholar] [CrossRef] [PubMed]
- Yamakuchi, M.; Lowenstein, C.J. MiR-34, SIRT1 and p53: The feedback loop. Cell Cycle 2009, 8, 712–715. [Google Scholar] [CrossRef]
- Yuan, Y.; Cruzat, V.F.; Newsholme, P.; Cheng, J.; Chen, Y.; Lu, Y. Regulation of SIRT1 in aging: Roles in mitochondrial function and biogenesis. Mech. Ageing Dev. 2016, 155, 10–21. [Google Scholar] [CrossRef]
- Tang, B.L. Sirt1 and the Mitochondria. Mol. Cells 2016, 39, 87–95. [Google Scholar] [CrossRef]
- Valle, I.; Alvarez-Barrientos, A.; Arza, E.; Lamas, S.; Monsalve, M. PGC-1alpha regulates the mitochondrial antioxidant defense system in vascular endothelial cells. Cardiovasc. Res. 2005, 66, 562–573. [Google Scholar] [CrossRef]
- Scarpulla, R.C. Metabolic control of mitochondrial biogenesis through the PGC-1 family regulatory network. Biochim. Et Biophys. Acta 2011, 1813, 1269–1278. [Google Scholar] [CrossRef]
- Ventura-Clapier, R.; Garnier, A.; Veksler, V. Transcriptional control of mitochondrial biogenesis: The central role of PGC-1alpha. Cardiovasc. Res. 2008, 79, 208–217. [Google Scholar] [CrossRef] [PubMed]
- Olmos, Y.; Sanchez-Gomez, F.J.; Wild, B.; Garcia-Quintans, N.; Cabezudo, S.; Lamas, S.; Monsalve, M. SirT1 regulation of antioxidant genes is dependent on the formation of a FoxO3a/PGC-1alpha complex. Antioxid. Redox Signal. 2013, 19, 1507–1521. [Google Scholar] [CrossRef] [PubMed]
- Khullar, M.; Cheema, B.S.; Raut, S.K. Emerging Evidence of Epigenetic Modifications in Vascular Complication of Diabetes. Front. Endocrinol. 2017, 8, 237. [Google Scholar] [CrossRef] [PubMed]
- Zhong, Q.; Kowluru, R.A. Epigenetic changes in mitochondrial superoxide dismutase in the retina and the development of diabetic retinopathy. Diabetes 2011, 60, 1304–1313. [Google Scholar] [CrossRef] [PubMed]


© 2019 by the authors. Licensee MDPI, Basel, Switzerland. This article is an open access article distributed under the terms and conditions of the Creative Commons Attribution (CC BY) license (http://creativecommons.org/licenses/by/4.0/).
Share and Cite
Thounaojam, M.C.; Jadeja, R.N.; Warren, M.; Powell, F.L.; Raju, R.; Gutsaeva, D.; Khurana, S.; Martin, P.M.; Bartoli, M. MicroRNA-34a (miR-34a) Mediates Retinal Endothelial Cell Premature Senescence through Mitochondrial Dysfunction and Loss of Antioxidant Activities. Antioxidants 2019, 8, 328. https://doi.org/10.3390/antiox8090328
Thounaojam MC, Jadeja RN, Warren M, Powell FL, Raju R, Gutsaeva D, Khurana S, Martin PM, Bartoli M. MicroRNA-34a (miR-34a) Mediates Retinal Endothelial Cell Premature Senescence through Mitochondrial Dysfunction and Loss of Antioxidant Activities. Antioxidants. 2019; 8(9):328. https://doi.org/10.3390/antiox8090328
Chicago/Turabian StyleThounaojam, Menaka C., Ravirajsinh N. Jadeja, Marie Warren, Folami L. Powell, Raghavan Raju, Diana Gutsaeva, Sandeep Khurana, Pamela M. Martin, and Manuela Bartoli. 2019. "MicroRNA-34a (miR-34a) Mediates Retinal Endothelial Cell Premature Senescence through Mitochondrial Dysfunction and Loss of Antioxidant Activities" Antioxidants 8, no. 9: 328. https://doi.org/10.3390/antiox8090328
APA StyleThounaojam, M. C., Jadeja, R. N., Warren, M., Powell, F. L., Raju, R., Gutsaeva, D., Khurana, S., Martin, P. M., & Bartoli, M. (2019). MicroRNA-34a (miR-34a) Mediates Retinal Endothelial Cell Premature Senescence through Mitochondrial Dysfunction and Loss of Antioxidant Activities. Antioxidants, 8(9), 328. https://doi.org/10.3390/antiox8090328