1. Introduction
Reactive oxygen species (ROS) are generated in the body as byproducts of several cellular metabolic reactions; they consist of radical and non-radical oxygen species formed by the partial reduction of oxygen [
1] Low levels of ROS are necessary for cellular processes such as intracellular signaling, cell progression and cell defense. Conversely, high levels of the ROS or the inability of the antioxidant system to regulate ROS levels efficiently results in oxidative stress. Oxidative stress results in direct or indirect ROS-mediated damage of nucleic acids, proteins, and lipids [
1]. Two examples of reactions that generate ROS (hydrogen peroxide) are the conversion of lipids and fat into carbohydrates, another component of food, and the conversion of amino acids into glucose, the basic “fuel” for the body. To prevent a buildup of ROS, the body produces defenders that extinguish ROS as soon as they are produced; these defenders or molecules are collectively known as “antioxidants”. The antioxidant system consists of the enzymatic defenses, such as superoxide dismutase (SOD), glutathione peroxidase (GPX) and catalase (CAT), as well as the non-enzymatic defenses ascorbic acid (Vitamin C), a-tocopherol (Vitamin E), and B-carotene. The balance and efficiency of this system is essential for the health of the organism [
2].
Consuming dietary antioxidant supplements to fight diseases, especially cancer, has become popular among the general public. However, the exact mechanism(s) for the effect of antioxidants in cancer is unclear. In addition clinical trials have reported inconsistent outcomes. Hennekens
et al. [
3] reported that twelve years of beta carotene supplementation in healthy men did not produce benefit in terms of incidence of malignant neoplasms and cardiovascular diseases. Conversely, Herceberg
et al. reported that low-dose antioxidant supplementation for 7.5 years lowered total cancer incidence and all-cause mortality in men but not in women [
4].
Several studies including state of the art transcriptomic expression analysis using RNA-Sequencing (RNA-Seq), have reported on the effects of antioxidants on gene expression [
5,
6,
7,
8]. According to Matsumoto
et al., antioxidant supplementation up-regulated the cardiac endothelial cell gene expression of the ras homolog gene family member A, which has a role in cardiovascular disease progression [
9]. In another study, dietary glutamine supplementation decreased oxidative stress-related gene expression, increased the antioxidant potential and attenuated renal oxidative damage in rats with streptozotocin-induced diabetes [
10].
Until the late 2000s, the focus of gene expression studies was mainly on coding mRNA expression. It was previously believed that RNA transcribed from the intronic regions was destined to be degraded and hence did not have a biological function. However, in recent years, studies have highlighted critical functional roles for these non-coding regions [
11]. Martianov
et al. experimentally validated the repression of the human dihydrofolate reductase gene by a non-coding interfering transcript [
12]. Subsequently, several studies have reported on the role of non-coding intronic RNAs in diseases. Brito
et al. reported that in renal cell carcinoma, the expression of non-coding intronic RNA discriminates tumor from adjacent non-malignant cells [
13]. Similarly, Reis
et al. showed that the expression of six antisense intronic non-coding RNA transcripts correlated with the degree of tumor differentiation in prostate cancer [
14]. However, to the best of our knowledge, previous studies have not investigated the effect of antioxidant supplements on non-coding RNA expression in cancers. This project examined the effect of antioxidant supplements on non-coding intronic RNA expression in cancers.
The hypothesis for this study was that antioxidant supplements would influence the expression of intronic RNAs in genes linked to ROS system. We utilized two publicly available RNA-Seq datasets for studying the effect of antioxidant supplements on intronic RNA expression. The antioxidants studied in these datasets were Vitamin E,
n-Acetyl cysteine and Sulforaphane. The rationale for choosing these data sets was that the datasets were of good quality and that the antioxidant supplements studied are commonly used, while research on the effects of these supplements has yielded contradictory results [
15,
16,
17,
18,
19,
20].
For both RNA-Seq datasets, prior to sequencing, the RNA samples were enriched for polyadenylated RNA fractions containing processed spliced RNA transcripts. Polyadenylated RNA-Seq data should generate reads that map to exons. However, it has been shown that RNA-Seq data also capture intronic sequences [
21]. The interpretation for the expression of intronic RNA has remained controversial. Some have suggested that the intronic reads originate from DNA contamination or nascent RNAs whereas others report that they are unknown exons or intronic enhancers [
21,
22]. Gaidatzis
et al. show that most intronic reads arise from nuclear RNA and changes in intronic read counts accurately predict changes in transcriptional activity [
23]. In the present study we demonstrate that antioxidant supplements cause significant differential intronic RNA expression in several genes linked to cancer-related processes. Furthermore, we experimentally validate the expression of introns of two oncogenes, DLK1 and LRG1, which are major players in lung cancer progression [
24,
25].
3. Results
The summary of genes with significantly differentially expressed (FDR < 0.01 and fold change >2) intronic regions in the antioxidant supplement treated tumor groups compared to the untreated tumor group is given in
Table 2. The complete list of genes with differentially expressed intronic RNA in the two dataset analyses is given in
Supplementary Data 1 and 2. The numbers of genes where all the introns of the gene were significantly differentially expressed in NAC and Vitamin E treated groups were 35 and 149, respectively. In other instances the differential intronic RNA expression was detected only in certain introns of the gene (
Supplementary Figure S1).
3.1. Murine Lung Cancer Dataset
Differentially expressed intronic RNA: The summary of the results from the analyses of murine lung cancer dataset is given in
Table 2a. The antioxidant supplement treatments tend to reduce the intronic RNA expression as evident by the higher number of genes with significantly reduced expression (
Table 2a). The numbers of genes with differentially expressed intronic RNA were much greater in the Vitamin E treated group compared to NAC-treated group.
Table 2.
Summary of the total number of genes with significant differential expression of introns (FDR < 0.01 and fold change >2 (up or down)).
Table 2.
Summary of the total number of genes with significant differential expression of introns (FDR < 0.01 and fold change >2 (up or down)).
| a. Summary of Results from Murine Model for KRAS-Induced Lung Cancer Data Analysis |
|---|
| Total Number of Genes with Significant Differences in the Intronic Read Counts from Antioxidant Supplement (NAC, Vitamin E) Treated Tumor Tissues Compared to Control Tumor Tissue |
| | NAC | Vitamin E |
| Down | Up | Down | Up |
| Number of genes | 459 | 86 | 1143 | 315 |
| b. Summary of Results from Human Prostate Cancer Cells Data Analysis |
| Total Number of Genes with Significant Differences in the Intronic Read Counts in Sulforaphane Treated Cells Compared to Untreated Cells |
| | Normal Prostate Epithelial Cells | LNCAP (Prostate Cancer Cells, Hormone, Dependent) | PC3 (Prostate Cancer Cells, Hormone Independent) |
| Down | Up | Down | Up | Down | Up |
| 6 h | 1680 | 1971 | 428 | 575 | 569 | 707 |
| 24 h | 1522 | 1437 | 1313 | 476 | 496 | 457 |
Antioxidant enzymes: Since we wanted to know if the supplements would have an effect on the ROS-system, we also studied the changes in expression in the major antioxidant enzymes including, catalase (CAT), glutathione peroxidases (GPXs) and superoxide dismutases (SODs). The exonic expression of these antioxidant enzymes was generally reduced after supplement treatments and a significant decrease was observed after Vitamin E treatment. Furthermore, we found significant decrease in intronic RNA expression of SOD2 after Vitamin E supplementation.
3.2. Functional Annotation of Genes with Differentially Expressed Intronic RNA
NAC supplement: According to Gene set enrichment analyses, out of a total 86 genes with significantly increased intronic RNA expression in the NAC supplemented murine model group, 16 overlapped with the gene-expression signature of KRAS2 mutation in human lung cancer [
44] (
Table 3).
Table 3.
List of genes with increased intronic RNA expression after Vitamin E supplement treatment that overlapped with the genes in the oncogenic KRAS2 expression signature. The gene symbols with asterisk also had increased expression of introns after NAC supplement treatment.
Table 3.
List of genes with increased intronic RNA expression after Vitamin E supplement treatment that overlapped with the genes in the oncogenic KRAS2 expression signature. The gene symbols with asterisk also had increased expression of introns after NAC supplement treatment.
| Gene Symbols |
|---|
| ALDOC | F7 * | IL18 | MRC1 * | SOCS3 |
| AREG | FCGR2B | ITGAX * | MSR1 | STARD10 |
| AXL | GAPDH | ITGB2 | PTGS1 | TNFSF9 |
| CAMSAP1 | GJA1 | ITIH4 * | ROS1 * | TYROBP |
| CD68 | HDC | KRAS | RPL3 | |
| CRLF1 | HK1 * | LCP1 | SERPINE1 | |
| CTSK | HK2 * | LRG1 * | SH3RF1 | |
| ELL2 | HSPA1B | LRP2 * | SIRPA | |
| EPHA7 | HSPA8 | ME1 | SLAIN1 | |
| F10 | HSPH1 | MMP12 | SLC38A2 | |
The top five pathways after the enrichment analyses of the genes with differential expression of introns after NAC supplement treatment are shown in
Table 4.
Table 4.
Top 5 enriched pathways for the genes with differentially expressed introns after NAC supplement treatment.
Table 4.
Top 5 enriched pathways for the genes with differentially expressed introns after NAC supplement treatment.
| For Genes with Increased Expression of Introns |
|---|
| Fructose and mannose metabolism |
| Ensemble of genes encoding ECM-associated proteins including ECM-affiliated proteins, ECM regulators and secreted factors |
| Ensemble of genes encoding extracellular matrix and extracellular matrix-associated proteins |
| Genes involved in Transmembrane transport of small molecules |
| Type II diabetes mellitus |
| For Genes with Decreased Expression of Introns |
| Drug metabolism—cytochrome P450 |
| Genes involved in Biological oxidations |
| Genes involved in Muscle contraction |
| Metabolism of xenobiotics by cytochrome P450 |
| Glutathione metabolism |
Vitamin E supplement: Table 3 shows the list of 44 genes with increased intronic RNA expression after Vitamin E supplement treatment that overlapped with the gene-expression signature of human lung cancer with KRAS2 mutation [
44]. Immune system, extracellular matrix and transmembrane transport were the top gene sets from the enrichment analyses of genes with increased expression of introns after Vitamin E treatment. Similar to NAC treatment, drug metabolism via cytochrome p450 was among the top-ranking pathway for the genes with decreased expression of introns after Vitamin E supplement treatment (
Table 5).
Figure 2 shows genomic alignment of reads mapping to Leucine-Rich Alpha-2-Glycoprotein 1 (LRG1). Both NAC and Vitamin E supplement treatments increased the intronic RNA expression as shown in
Figure 2.
Table 5.
Top 5 enriched pathways for the genes with differentially expressed introns after Vitamin E supplement treatment.
Table 5.
Top 5 enriched pathways for the genes with differentially expressed introns after Vitamin E supplement treatment.
| Enriched Canonical Pathways |
|---|
| For genes with Increased Expression of Introns |
| Ensemble of genes encoding extracellular matrix and extracellular matrix-associated proteins |
| Genes involved in Adaptive Immune System |
| Beta2 integrin cell surface interactions |
| Ensemble of genes encoding ECM-associated proteins including ECM-affiliated proteins, ECM regulators and secreted factors |
| Genes involved in Transmembrane transport of small molecules |
| For Genes with Decreased Expression of Introns |
| Drug metabolism—cytochrome P450 |
| Genes involved in Biological oxidations |
| Metabolism of xenobiotics by cytochrome P450 |
| Ensemble of genes encoding extracellular matrix and extracellular matrix-associated proteins |
| Genes involved in Phase 1—Functionalization of compounds |
Signaling pathways: Gene Set enrichment of genes with increased expression of introns after Vitamin E supplementation showed genes enriched in signaling pathways including beta 2 integrin, CXCR4, MAPK and TOLL-like receptor pathways. No signaling pathways were enriched in Gene Set enrichment analysis of the 86 genes, which showed increased expression of introns after NAC supplementation.
Figure 2.
Illustration of genomic alignment of reads mapping to LRG1. For LRG1 gene, the exonic regions of the gene are shown as blue blocks and the intronic region as blue line (two exons and one intron). The regions with reads mapping to the gene are shown as black blocks. Both NAC and Vitamin E treated groups had reads mapping to the single intronic region compared to that of untreated control tumor tissue.
3.3. Human Normal and Prostate Cancer Cells Dataset
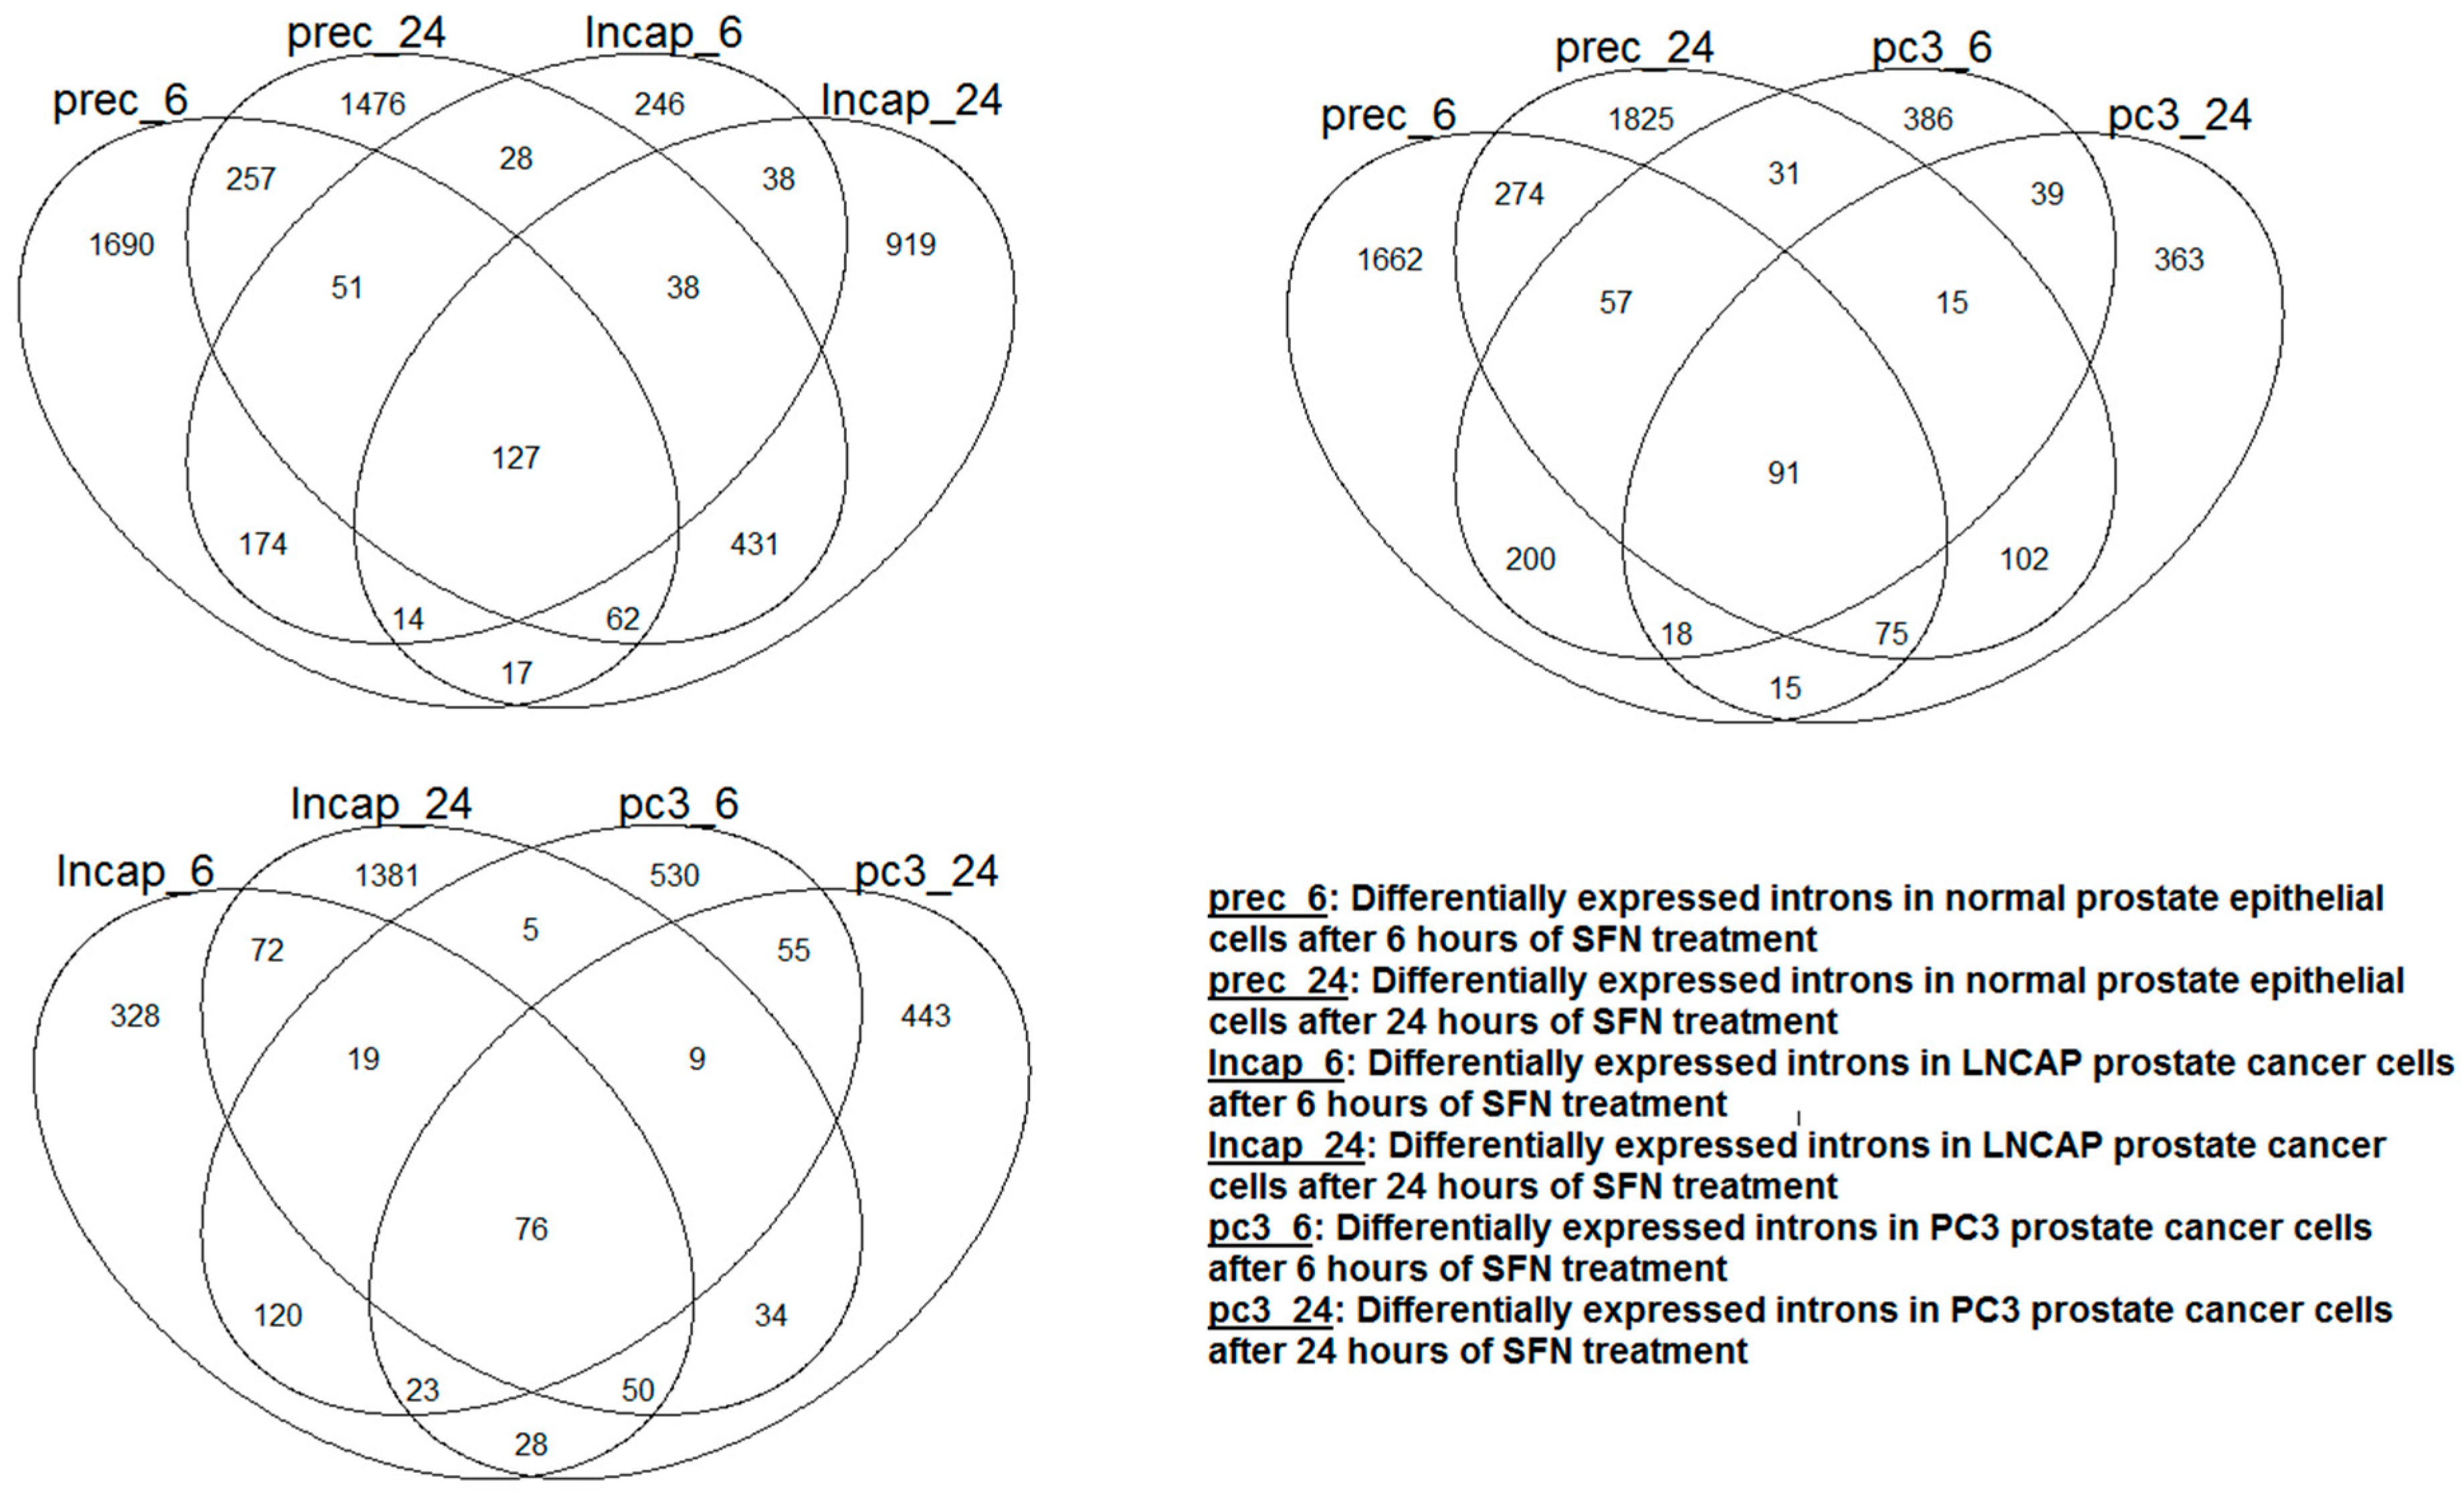
Differentially expressed intronic RNAs: The summary of the results from the differential expression analyses is shown in
Table 2b. The effect of SFN supplement treatment on the expression of introns was distinct depending on cell type and treatment time. This is evident in
Figure 3, which shows the Venn diagram of the differentially expressed introns; each cell type had a large number of differentially expressed introns that were unique to them. More genes with differentially expressed introns after SFN treatment were observed in normal epithelial cells compared to that of the two prostate cancer cell lines. In contrast to PC3 cancer cells, exposure of LNCAP cancer cells to SFN tended to decrease the intronic RNAs of several genes.
The exonic expression of the three main antioxidant enzyme groups (CAT, GPXs and SODs) did not show any significant change after SFN treatment. However, significant decreases in SOD2 expression of introns were observed in LNCAP and PC3 prostate cancer cells.
Differential Expression analyses: The results from the differential expression analyses of the three prostate cell types after SFN treatment are shown in
Table 2b. Sulforaphane (SFN) treatments for 6 and 24 h resulted in significant intronic differential expression (FDR < 0.01 with two-fold expression change) of many genes in normal prostate epithelial cells; increased in 1971 and 1437 genes and decreased in 1680 and 1522 genes, respectively (
Table 2b). In LNCAP cells, the number of genes with increased expression of introns tripled after 24 h of SFN treatment compared to that of 6 h (
Table 2a). In PC3 cells, a smaller number of genes had significantly differentially expressed intronic RNA compared to that of normal prostate epithelial cells (
Table 2b).
Figure 3.
Venn diagram showing the overlap of the introns that were differentially expressed after SFN treatment in each cell type. The overlap was small between the cell types regardless of the cell type and treatment period.
Figure 3.
Venn diagram showing the overlap of the introns that were differentially expressed after SFN treatment in each cell type. The overlap was small between the cell types regardless of the cell type and treatment period.
The top canonical pathways of the genes with differentially expressed introns after SFN treatment in the three prostate cell types are shown in
Table 6.
Table 6.
Top 5 enriched canonical pathways for the genes with differentially expressed introns after SFN treatment.
Table 6.
Top 5 enriched canonical pathways for the genes with differentially expressed introns after SFN treatment.
| Enriched Canonical Pathways |
|---|
| Normal Prostate Epithelial Cells with 6 h of SFN Treatment |
| Ensemble of genes encoding extracellular matrix and extracellular matrix-associated proteins |
| Genes involved in Developmental Biology |
| Genes involved in Transmission across Chemical Synapses |
| Genes involved in Immune System |
| Genes involved in Axon guidance |
| Normal Prostate Epithelial Cells with 24 h of SFN Treatment |
| Genes involved in Transmembrane transport of small molecules |
| Arrhythmogenic right ventricular cardiomyopathy (ARVC) |
| Focal adhesion |
| Genes involved in Immune System |
| Genes involved in Developmental Biology |
| LNCAP Prostate Cancer Cells with 6 h of SFN Treatment |
| Caspase cascade in apoptosis |
| Endocytosis |
| Genes involved in Developmental Biology |
| Peroxisome |
| Genes involved in Signaling by Rho GTPases |
| LNCAP Prostate Cancer cells with 24 h of SFN Treatment |
| Genes involved in Collagen formation |
| Genes involved in Developmental Biology |
| Genes involved in Neuronal System |
| Genes involved in Metabolism of lipids and lipoproteins |
| Genes involved in Extracellular matrix organization |
| PC3 Prostate Cancer Cells with 6 h of SFN Treatment |
| Genes involved in Collagen formation |
| Genes involved in Extracellular matrix organization |
| Regulation of RhoA activity |
| Genes involved in Metabolism of lipids and lipoproteins |
| Ensemble of genes encoding extracellular matrix and extracellular matrix-associated proteins |
| PC3 Prostate Cancer Cells with 24 h of SFN Treatment |
| Genes involved in Axon guidance |
| Genes involved in Immune System |
| Genes involved in NRAGE signals death through JNK |
| Genes involved in Signaling by Rho GTPases |
| Genes involved in Signaling by NGF |
3.4. Validation of Intronic RNA in DLK1 and LRG1
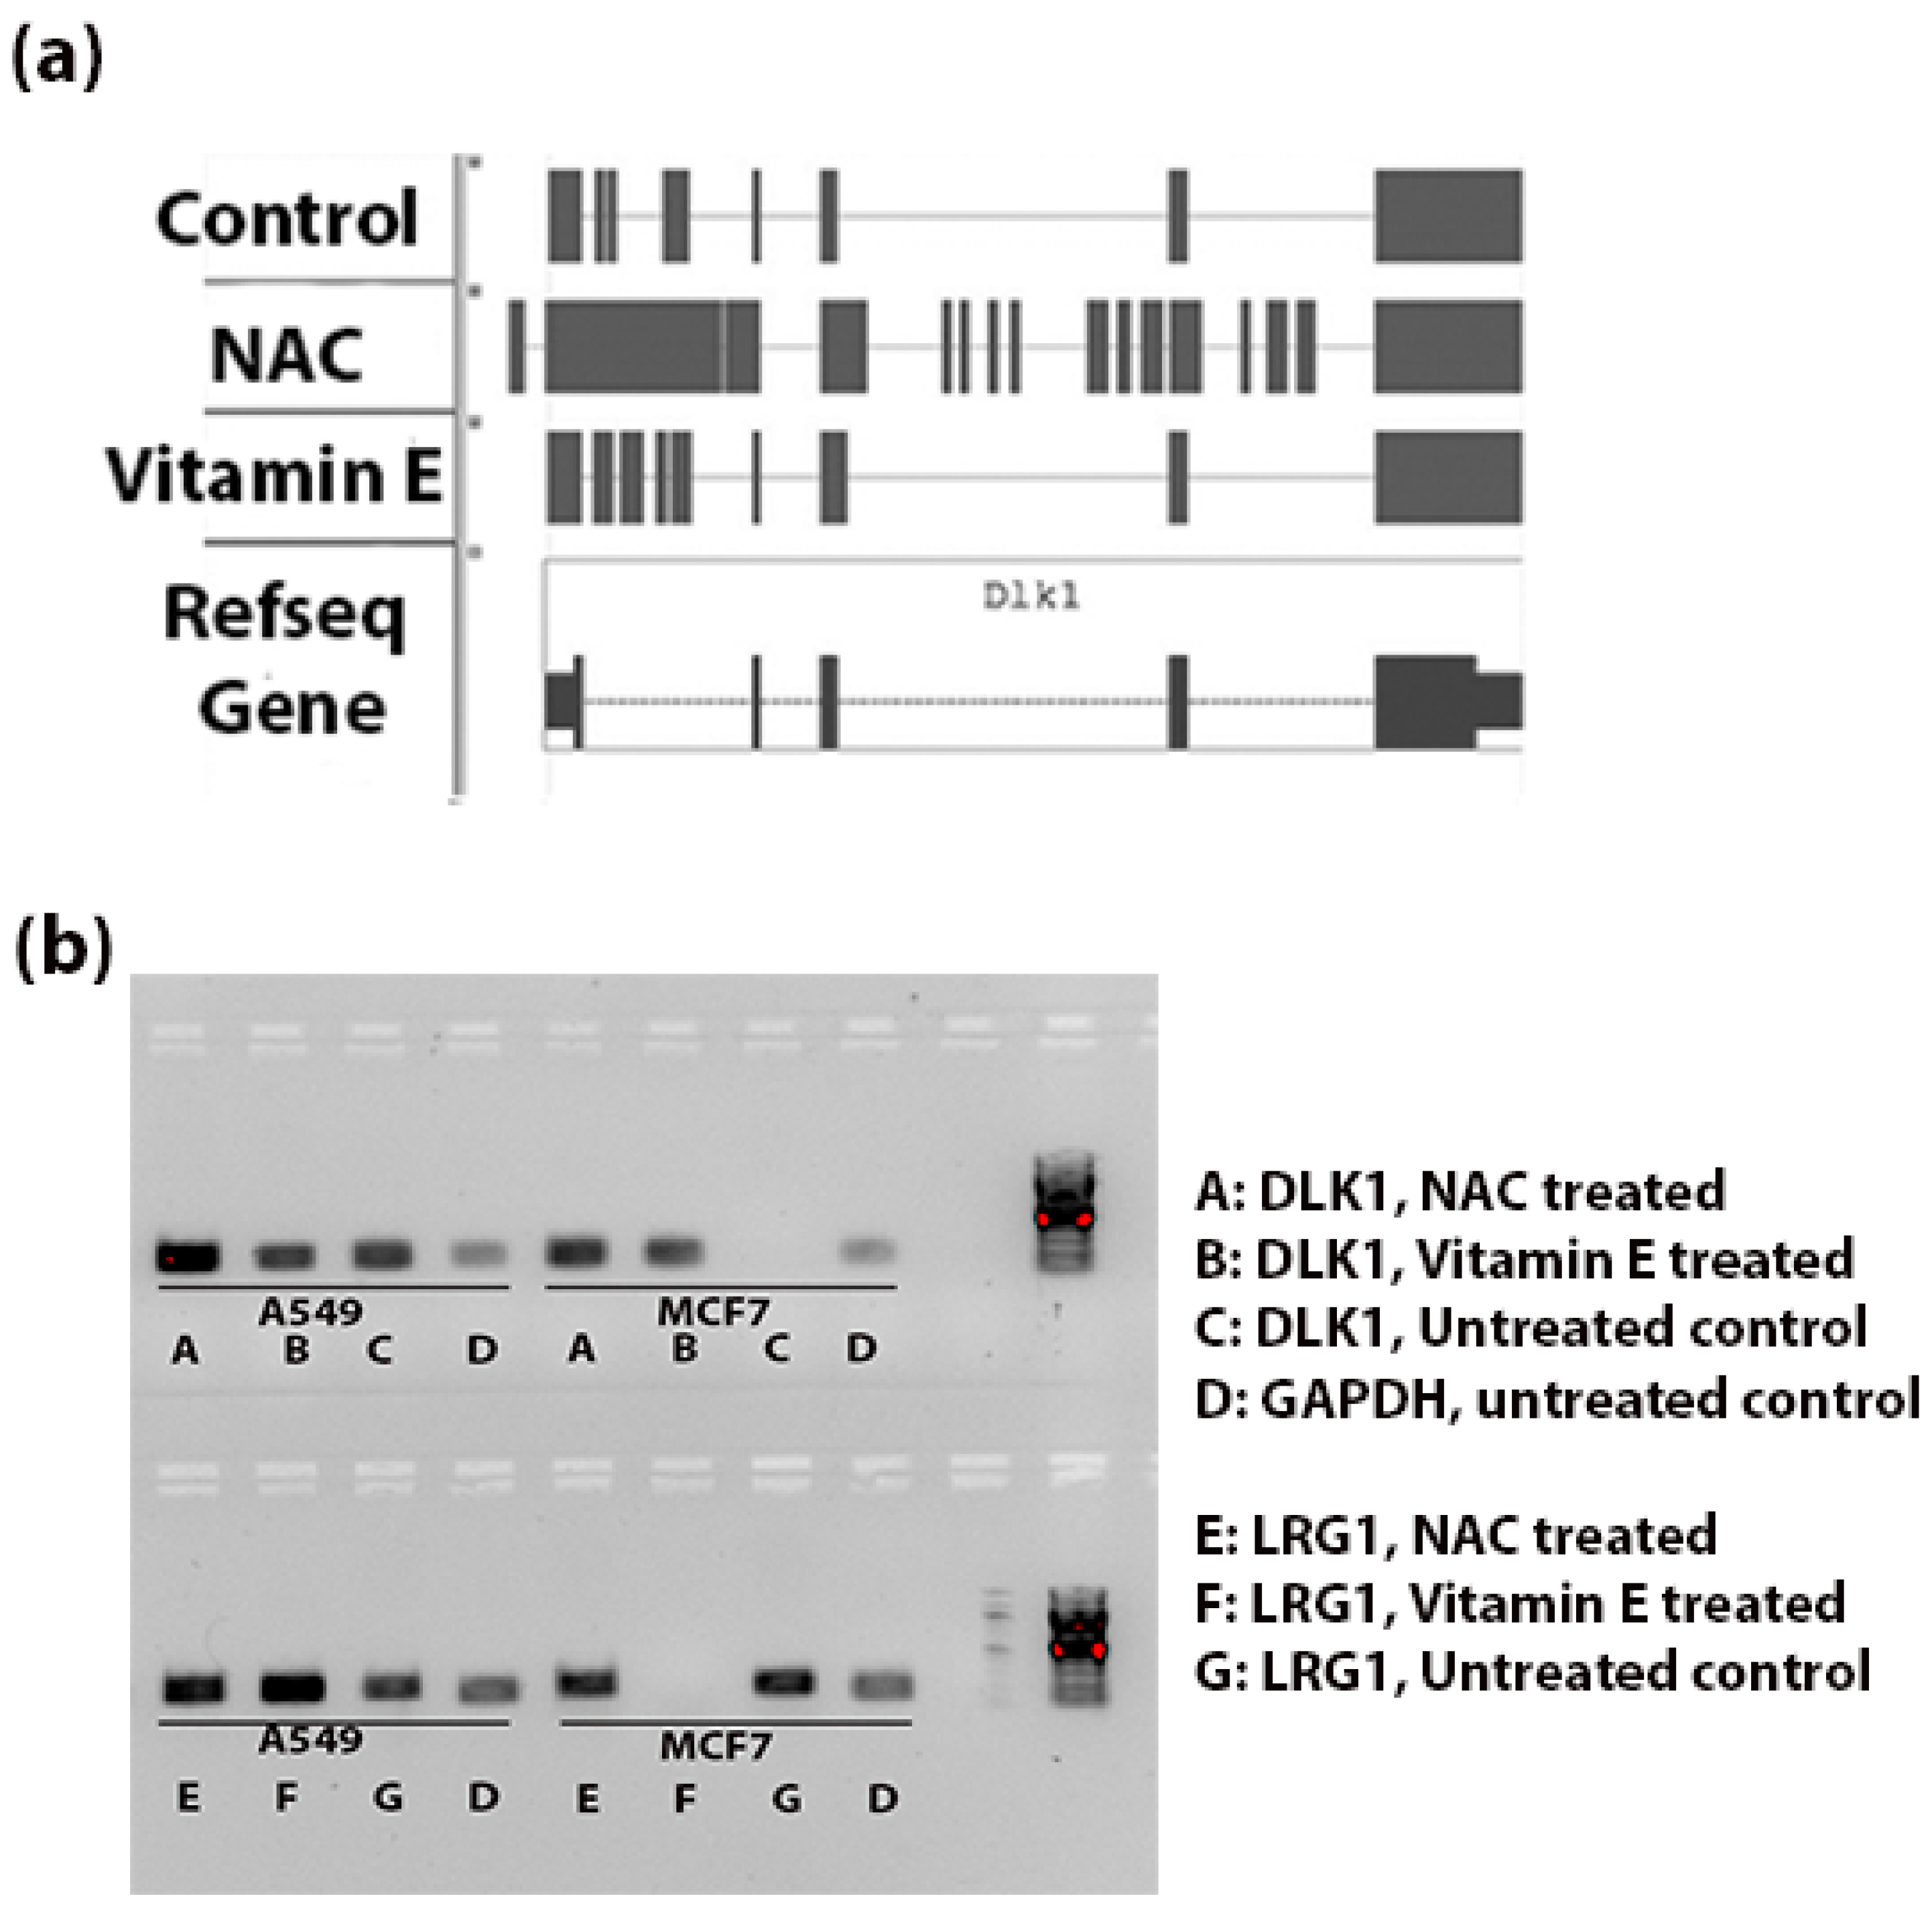
Figure 4a shows the genomic alignments of the RNA-seq reads against the exonic and intronic regions of DLK1 gene. NAC treatment resulted in significant increase (FDR < 0.003) in expression of introns of DLK1. Whereas Vitamin E treatment increased the expression of introns compared to control tumor tissue, this difference was not statistically significant (
p < 0.3).
Figure 4b indicates the intronic RNA expression in A549 and MCF7 using RT-PCR; the DLK1 expression of introns was comparatively stronger in the NAC treated A549 cells and LRG1 expression of introns was more in the vitamin E treated A549 cells.
Figure 4.
Intronic RNA expression of DLK1 and LRG1 (a) Schematic diagram to show the alignment of reads in the BAM files (Tophat output from the genomic alignment of RNA-seq data). Comparatively more reads are aligned to the intronic region (thin blue line) in the NAC-treated group than the control tumor and Vitamin E-treated groups. (b) RT-PCR validation of intronic RNA of DLK1 and LRG1 genes. Expression of introns of these two genes was observed in A549 and MCF7 cells. In A549 cells, NAC treatment seems to increase the expression of intronic RNA of DLK1; similarly the expression of introns of LRG1 was strong for the vitamin E treated A549 cells. No PCR amplification was observed with DLK1 intronic primers in the MCF7 control group and with LRG1 intronic primers in the MCF7 vitamin E treated group. The amplicon sizes of DLK1, LRG1 and GAPDH were 183 bp, 215 bp and 173 bp, respectively.
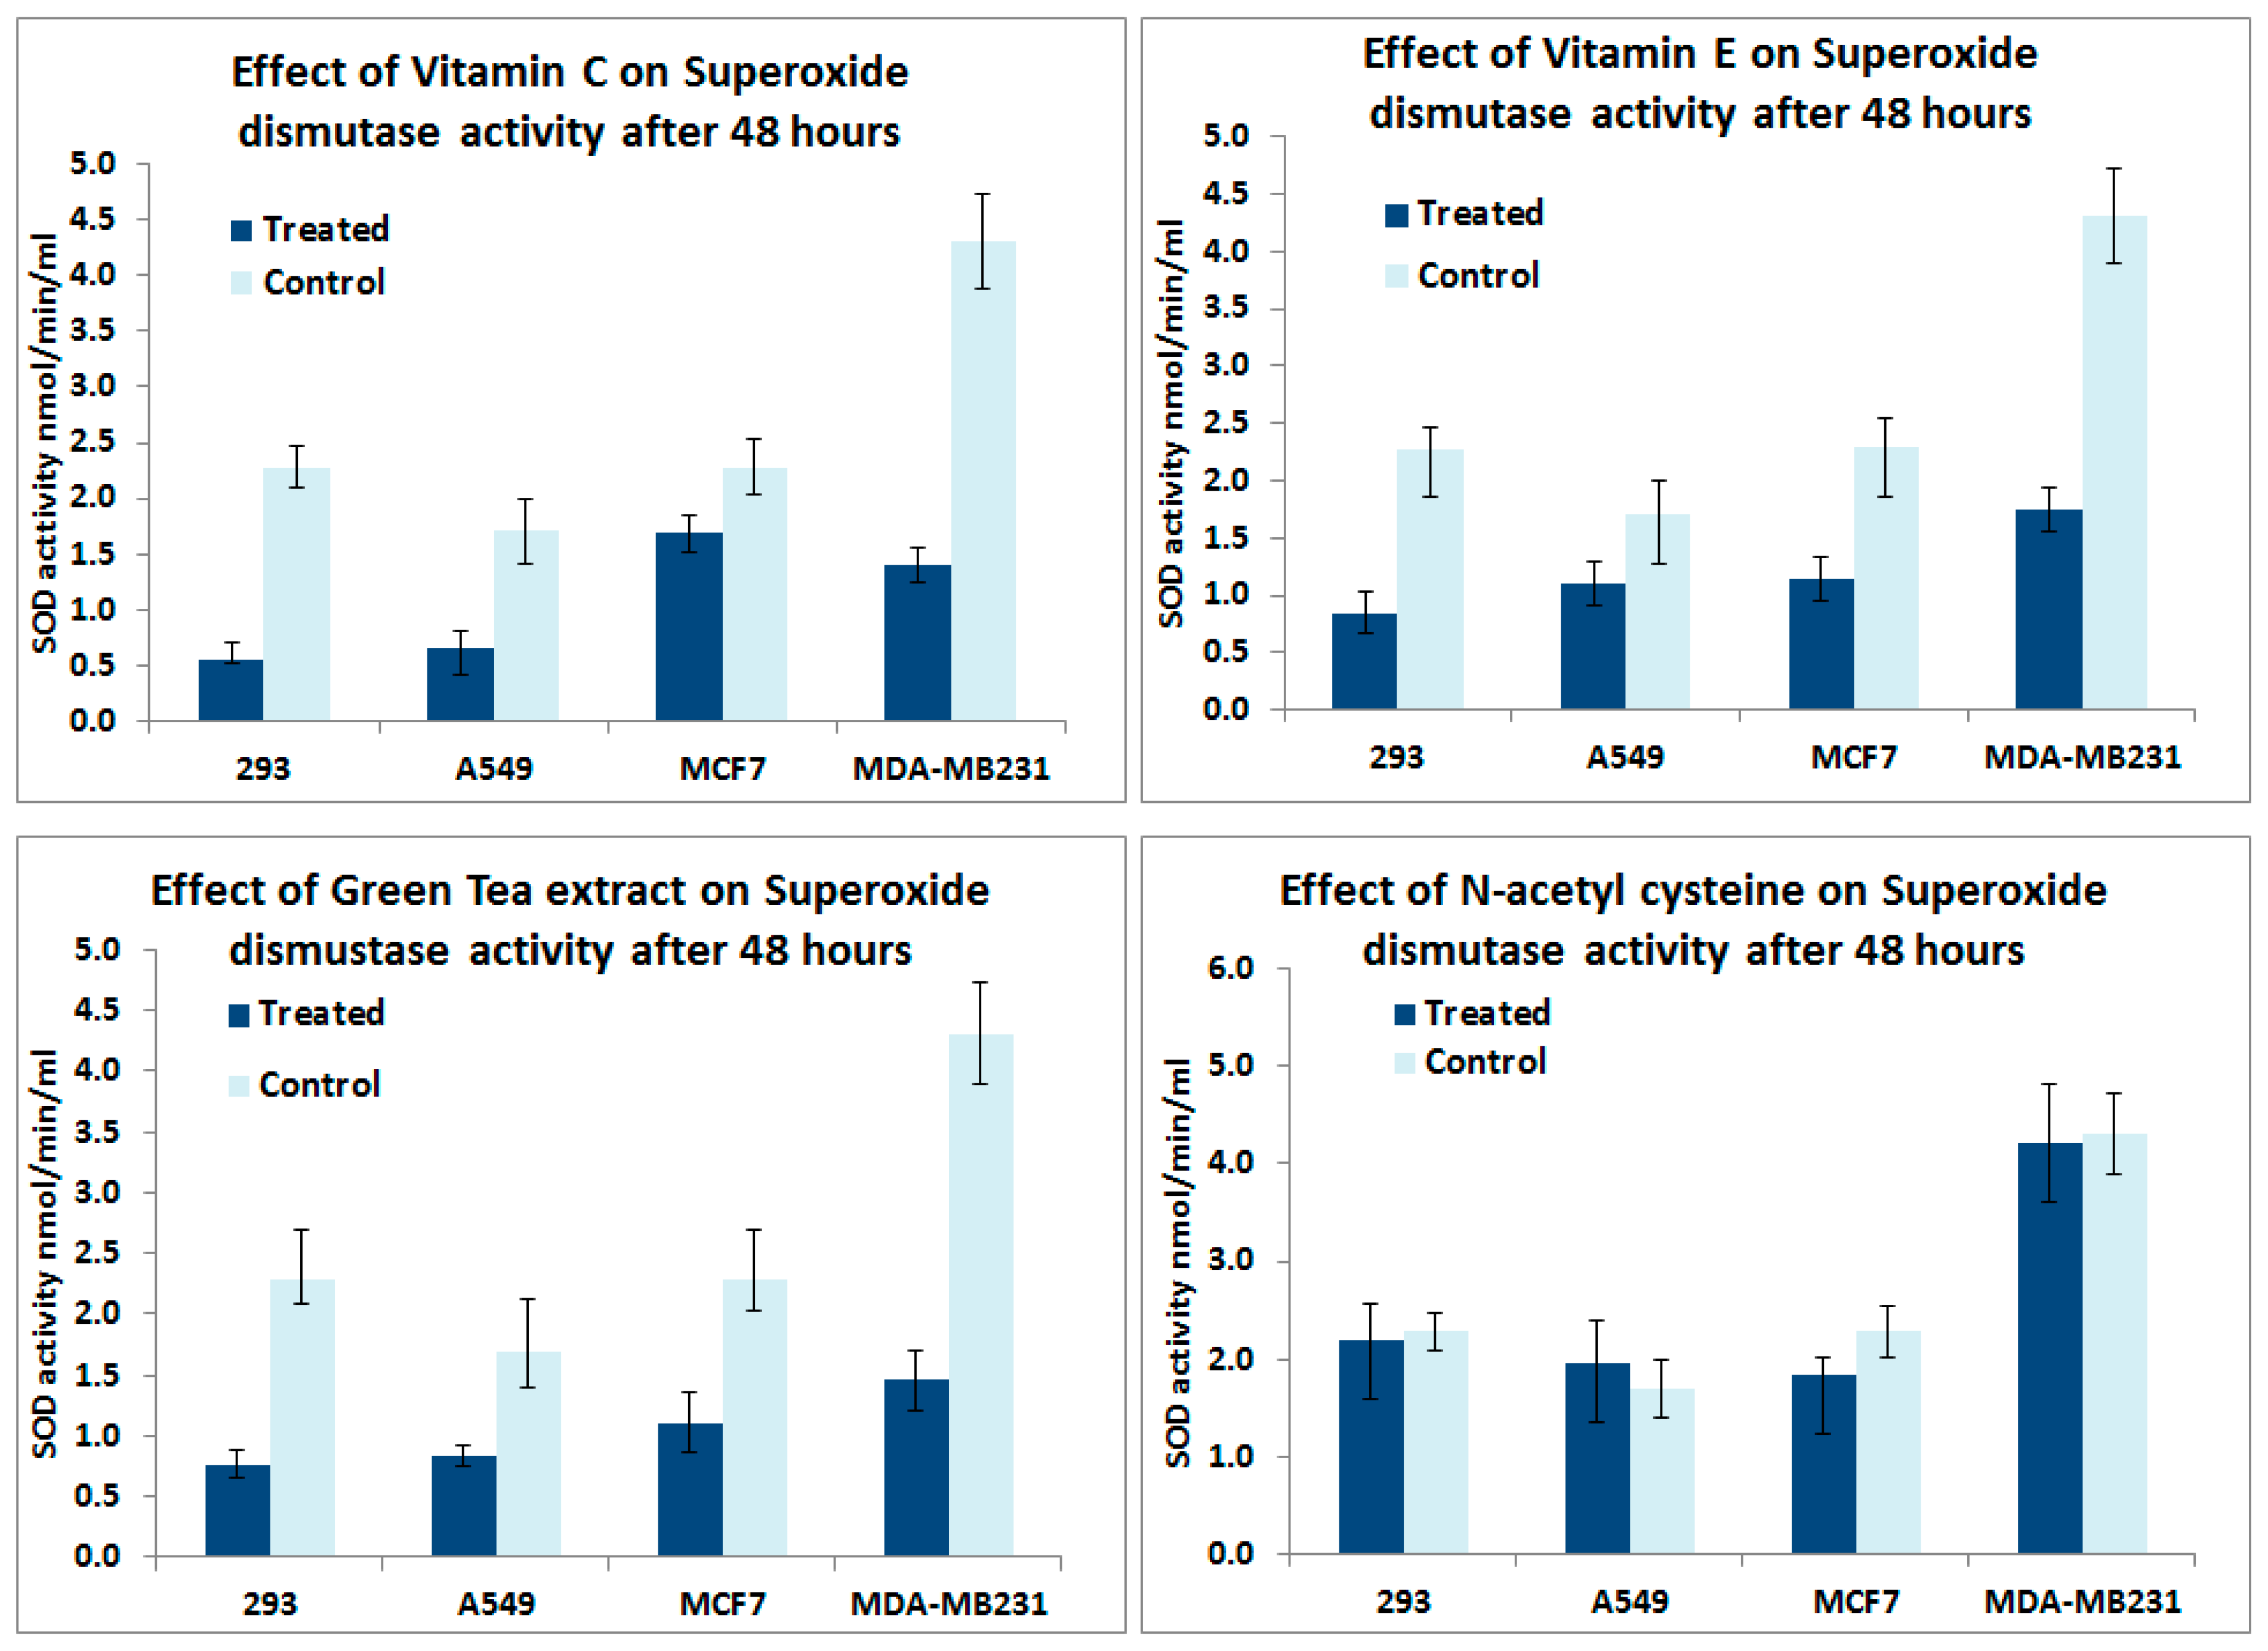
In vitro analyses of antioxidant supplements on superoxide enzyme activity: Figure 5 shows the effect of Vitamin C, Vitamin E, Green tea extract and NAC on superoxide dismutase activity in normal 293, MCF-7, MDA-MB231 and A549 lung cancer cells. Vitamin C, Vitamin E and Green tea extract treatments for 48 h reduced the SOD enzyme activity in all cell types. However, we did not observe a significant change in the enzyme activity in all cell types after NAC treatments.
Figure 5.
In vitro analyses on the effect of antioxidant supplements for 48 h on Superoxide dismutase activity in 293, MCF-7, MDA-MB231 and A549 lung cancer cells.
Figure 5.
In vitro analyses on the effect of antioxidant supplements for 48 h on Superoxide dismutase activity in 293, MCF-7, MDA-MB231 and A549 lung cancer cells.
4. Discussion
In recent years, owing in part to increased media attention, the popularity and use of antioxidant supplements as health adjuvants has been rising. However, studies showing both beneficial and harmful effects of antioxidant supplements have been reported [
45,
46,
47]. The exact mechanisms by which antioxidants act on the human body are not yet clearly known. In the present study using bioinformatics analysis we found significant differential effects of antioxidant supplements on intronic RNA expression in human cancer cells. Two other interesting observations include: (a) for many genes the differential expression was intron-specific;
i.e., not all introns were differentially expressed and (b) distinct signaling pathways were enriched for the genes with increased expression of introns after Vitamin E and SFN treatments.
Several recent studies clearly demonstrate the identification of functional intronic RNAs from RNA-Seq data [
13,
14,
23]. This is in contrast to earlier thoughts that the presence of intronic RNA is either due to contamination of genomic DNA in the RNA library prep or from unspliced nascent RNA. In our analyses, we found many genes with significantly increased intronic RNA expression without increase in corresponding exonic RNA after the antioxidant supplementation. It is difficult to explain this phenomenon due to genomic DNA leakage or by the unspliced nascent RNA. The expression of intronic regions could be due to antisense mRNA expression or intronic retention. However, we were not able to discern antisense mRNA expression, as both of the RNA-Seq datasets we used in this study were not strand-specific. In malignancy, normal cellular processes including cell cycle, splicing and metabolism are altered [
48]. Changes in splicing could be one of the mechanisms responsible for the expression of introns.
Intronic RNA has been shown to play roles in development [
49], transcription regulation and alternative splicing [
50]. Our analyses show that the intronic RNA of many genes, including oncogenes, showed significant differential expression after exposure of the cancer cells to antioxidant supplements. RT-PCR validation of expression of introns of DLK1 and LRG1, lung cancer genes verified the results of the bioinformatic analyses. Intronic RNA expression was stronger after NAC supplement treatment in A549 cells, as seen in
Figure 4.
Gene Set enrichment analyses of the genes that exhibited changes only in the expression of introns yielded cell cycle, lipid metabolism, and immune system as the top ranking pathways. Similar to our observation, Nakaya
et al. identified exonic and intronic tissue-specific expression signatures for human liver, prostate and kidney [
51]. These investigators reported that the most highly expressed introns were transcribed from introns of protein-coding genes significantly enriched in the “Regulation of transcription” Gene Ontology category. They also showed that RNA polymerase II inhibition resulted in increased expression of a fraction of intronic RNAs in cell cultures, suggesting that other RNA polymerases may be involved in the biosynthesis of intronic RNA.
Gene Set enrichment analyses of genes with differential expression of introns from our analyses on cancer datasets yielded significant enrichment in the immune system. All three antioxidants analyzed in this study, NAC, SFN and Vitamin E influenced immune pathways. Antioxidant supplements are generally considered to boost immune responses and to prevent diseases [
52]. However, recent studies show adverse effects of antioxidant supplements in malignancies and tumor progression [
53,
54]. The novel mechanistic role of antioxidants on the intronic RNA expression of the genes involved in immune system may have a regulatory role in cancer progression.
The expression of introns of several genes that are linked to lung cancer was significantly increased with NAC and Vitamin E treatments (
Table 3).
Figure 2 shows the schematic representation of RNA-Seq reads from both NAC and Vitamin E treated cells mapping to the intronic region of LRG1. Expression of introns of LRG1 was significantly increased in the antioxidant treated tissues compared to control tumor tissue. LRG1 plays roles in protein-protein interaction, signal transduction, and cell adhesion and development; this gene has been linked to lung cancer [
46,
47]. According to Liu
et al., LRG1 was overexpressed in both the blood level and tumor sections, which can be referred to separate lung cancer patients from healthy cases [
55]. Li
et al. identified LRG1 as a candidate biomarker in urine for non-invasive NSCLC [
25]. Increased intronic RNA expression observed for LRG1 in our study may exert a regulatory role on function and expression of the normal LRG1 protein. We were able to validate the expression of introns in two cancer cell types using RT-PCR.
Figure 4 shows a strong band for the LRG1 intronic RNA in the vitamin E treated A549 cells, which agrees with our observation in the computational intronic analyses (
Figure 2).
Delta-like 1 homolog (DLK1) gene is another example where antioxidant treatment increased intronic RNA expression; the increase was significant with NAC supplement treatment. Furthermore, we validated the intronic RNA expression using RT-PCR. DLK1 gene encodes a transmembrane protein containing six Epidermal Growth Factor repeats; the protein is involved in the differentiation of several cell types. Aberrant expression of DLK1 has been found in various types of human cancers, including lung cancer [
24]. Li
et al. [
24] suggest that DLK1 can promote the invasion of lung cancer cells by upregulating MMP9 expression. It is tempting to speculate that the aberrant DLK1 intronic RNA expression may have a role in lung cancer progression.
In this study antioxidant supplements reduced the exonic expression of ROS enzymes including catalase, GPXs and SODs in the murine lung cancer dataset. This was further supported by cell culture experiments showing decreased SOD activity after exposure of cancer cell lines to Vitamin C, Vitamin E and Green tea extract. The observed decrease in endogenous SOD activity could be the result of the antioxidant supplements exerting a negative feedback on the endogenous antioxidant enzyme systems and could negate any potential beneficial effect of the antioxidant supplements.


