
Micro-Encapsulation of Phytochemicals in Passion Fruit Peel Waste Generated on an Organic Farm: Effect of Carriers on the Quality of Encapsulated Powders and Potential for Value-Addition


Abstract
:1. Introduction
2. Materials and Methods
2.1. Materials and Chemicals
2.2. Methods
2.2.1. Passion Fruit Peel Extract Preparation
2.2.2. Encapsulation and Freeze-Drying Procedure
2.3. Physicochemical Attributes of PFPP
2.3.1. Color Measurements and Moisture Content
2.3.2. Titratable Acidity, Total Soluble Solids, and pH
2.4. Technofunctional Properties of PFPP
2.4.1. Hygroscopicity, Solubility, and Bulk Density Determination
2.4.2. Oil-and Water-Holding Capacity Determination
2.5. Particle Size Distribution and Morphology
2.5.1. Microstructure Analysis
2.5.2. X-ray Diffraction Analysis
2.6. Bioactive Compounds, Encapsulation Efficiency, and Antioxidant Activity
2.6.1. Total Phenolic Content, Encapsulation Efficiency, and Total Monomeric Anthocyanin
2.6.2. Ferric Reducing Antioxidant Power and DPPH Radical Scavenging Activity
2.7. Liquid Chromatography Mass Spectrometry (LC-MS/MS) Analysis
2.7.1. Determination of Individual Phenolic Compounds Concentration
2.7.2. Data Acquisition
2.8. Statistical Analysis
3. Results and Discussion
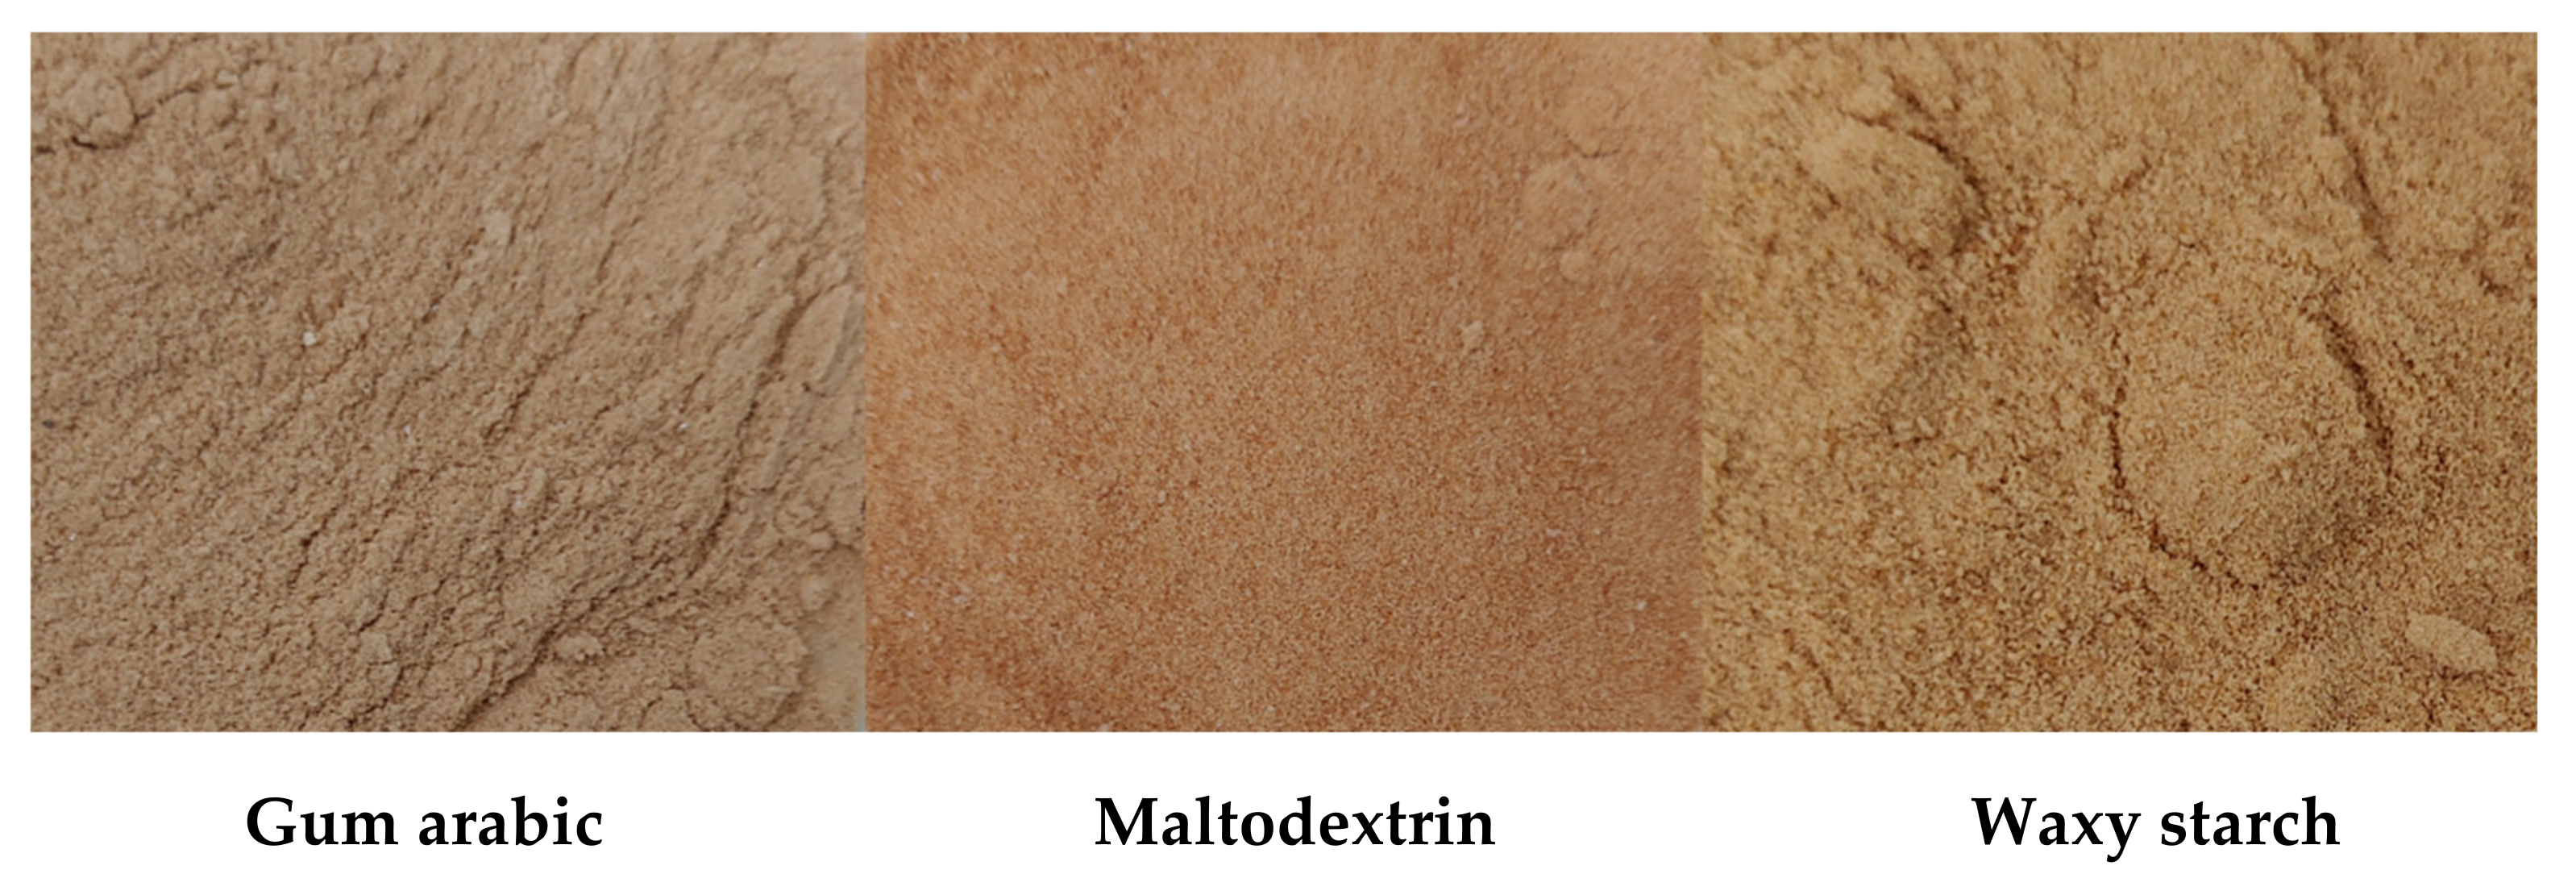
3.1. Moisture Content, Yield and Colour Attributes
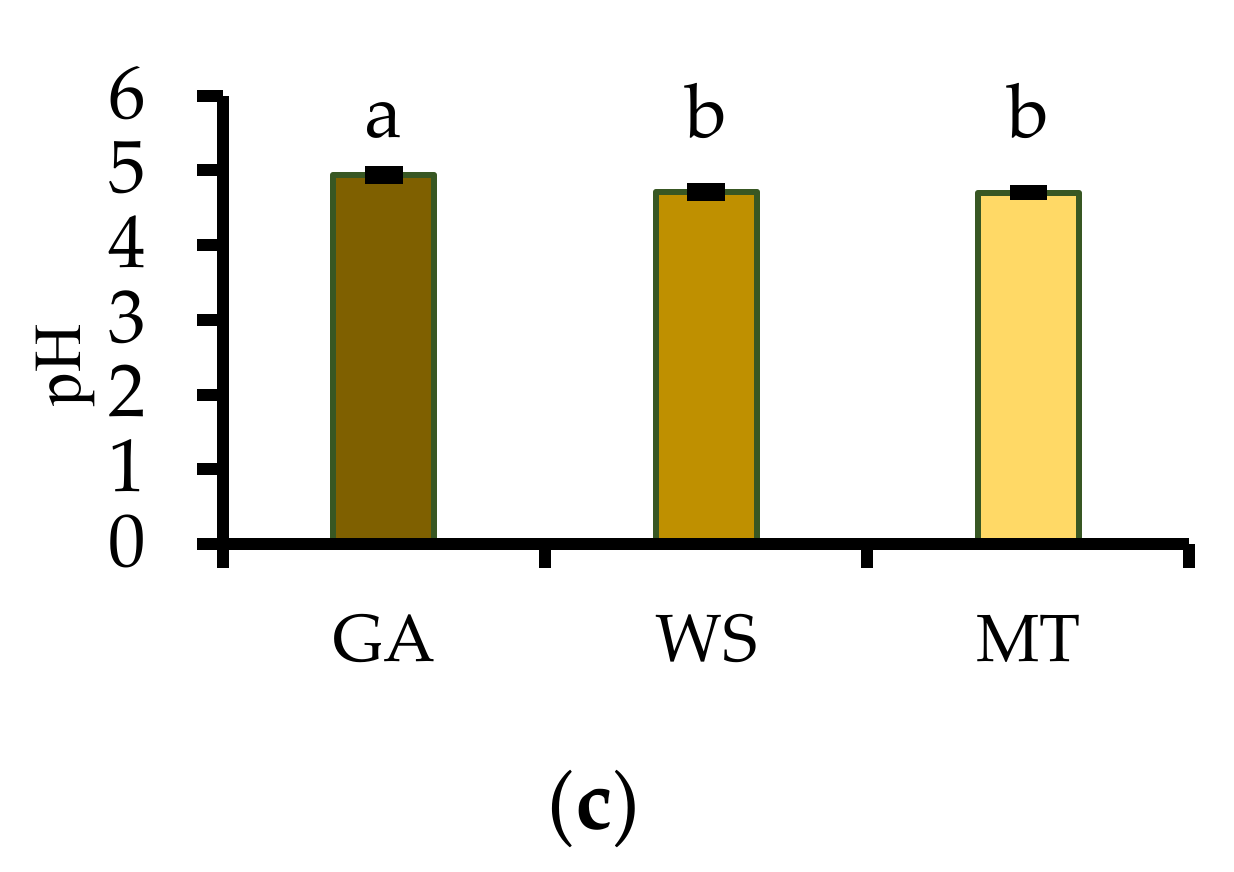
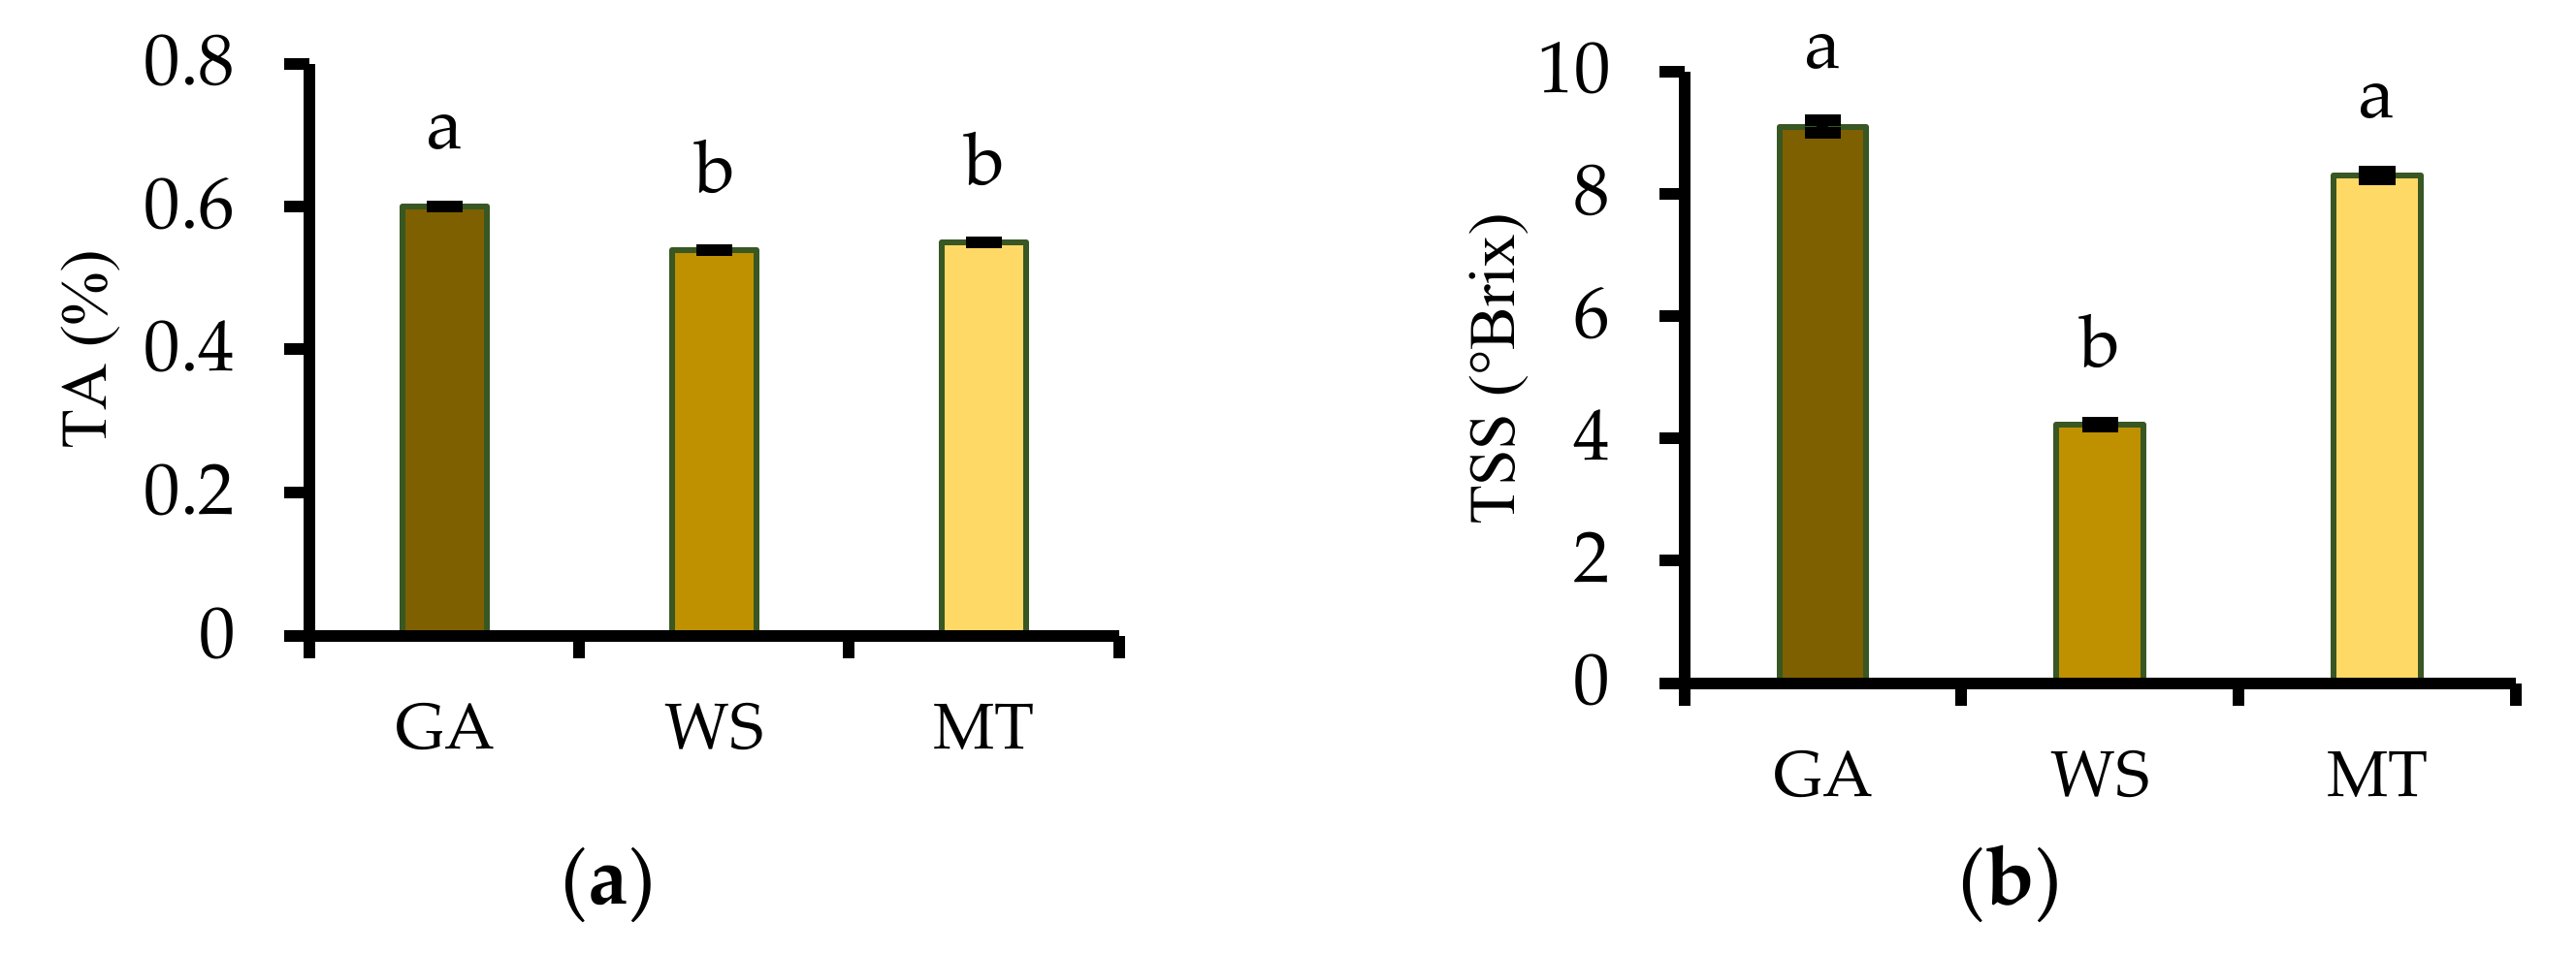
3.2. Titratable Acidity, Total Soluble Solids, and pH
3.3. Solubility, Hygroscopicity, and Bulk Density
3.4. Oil-and Water-Holding Capacity
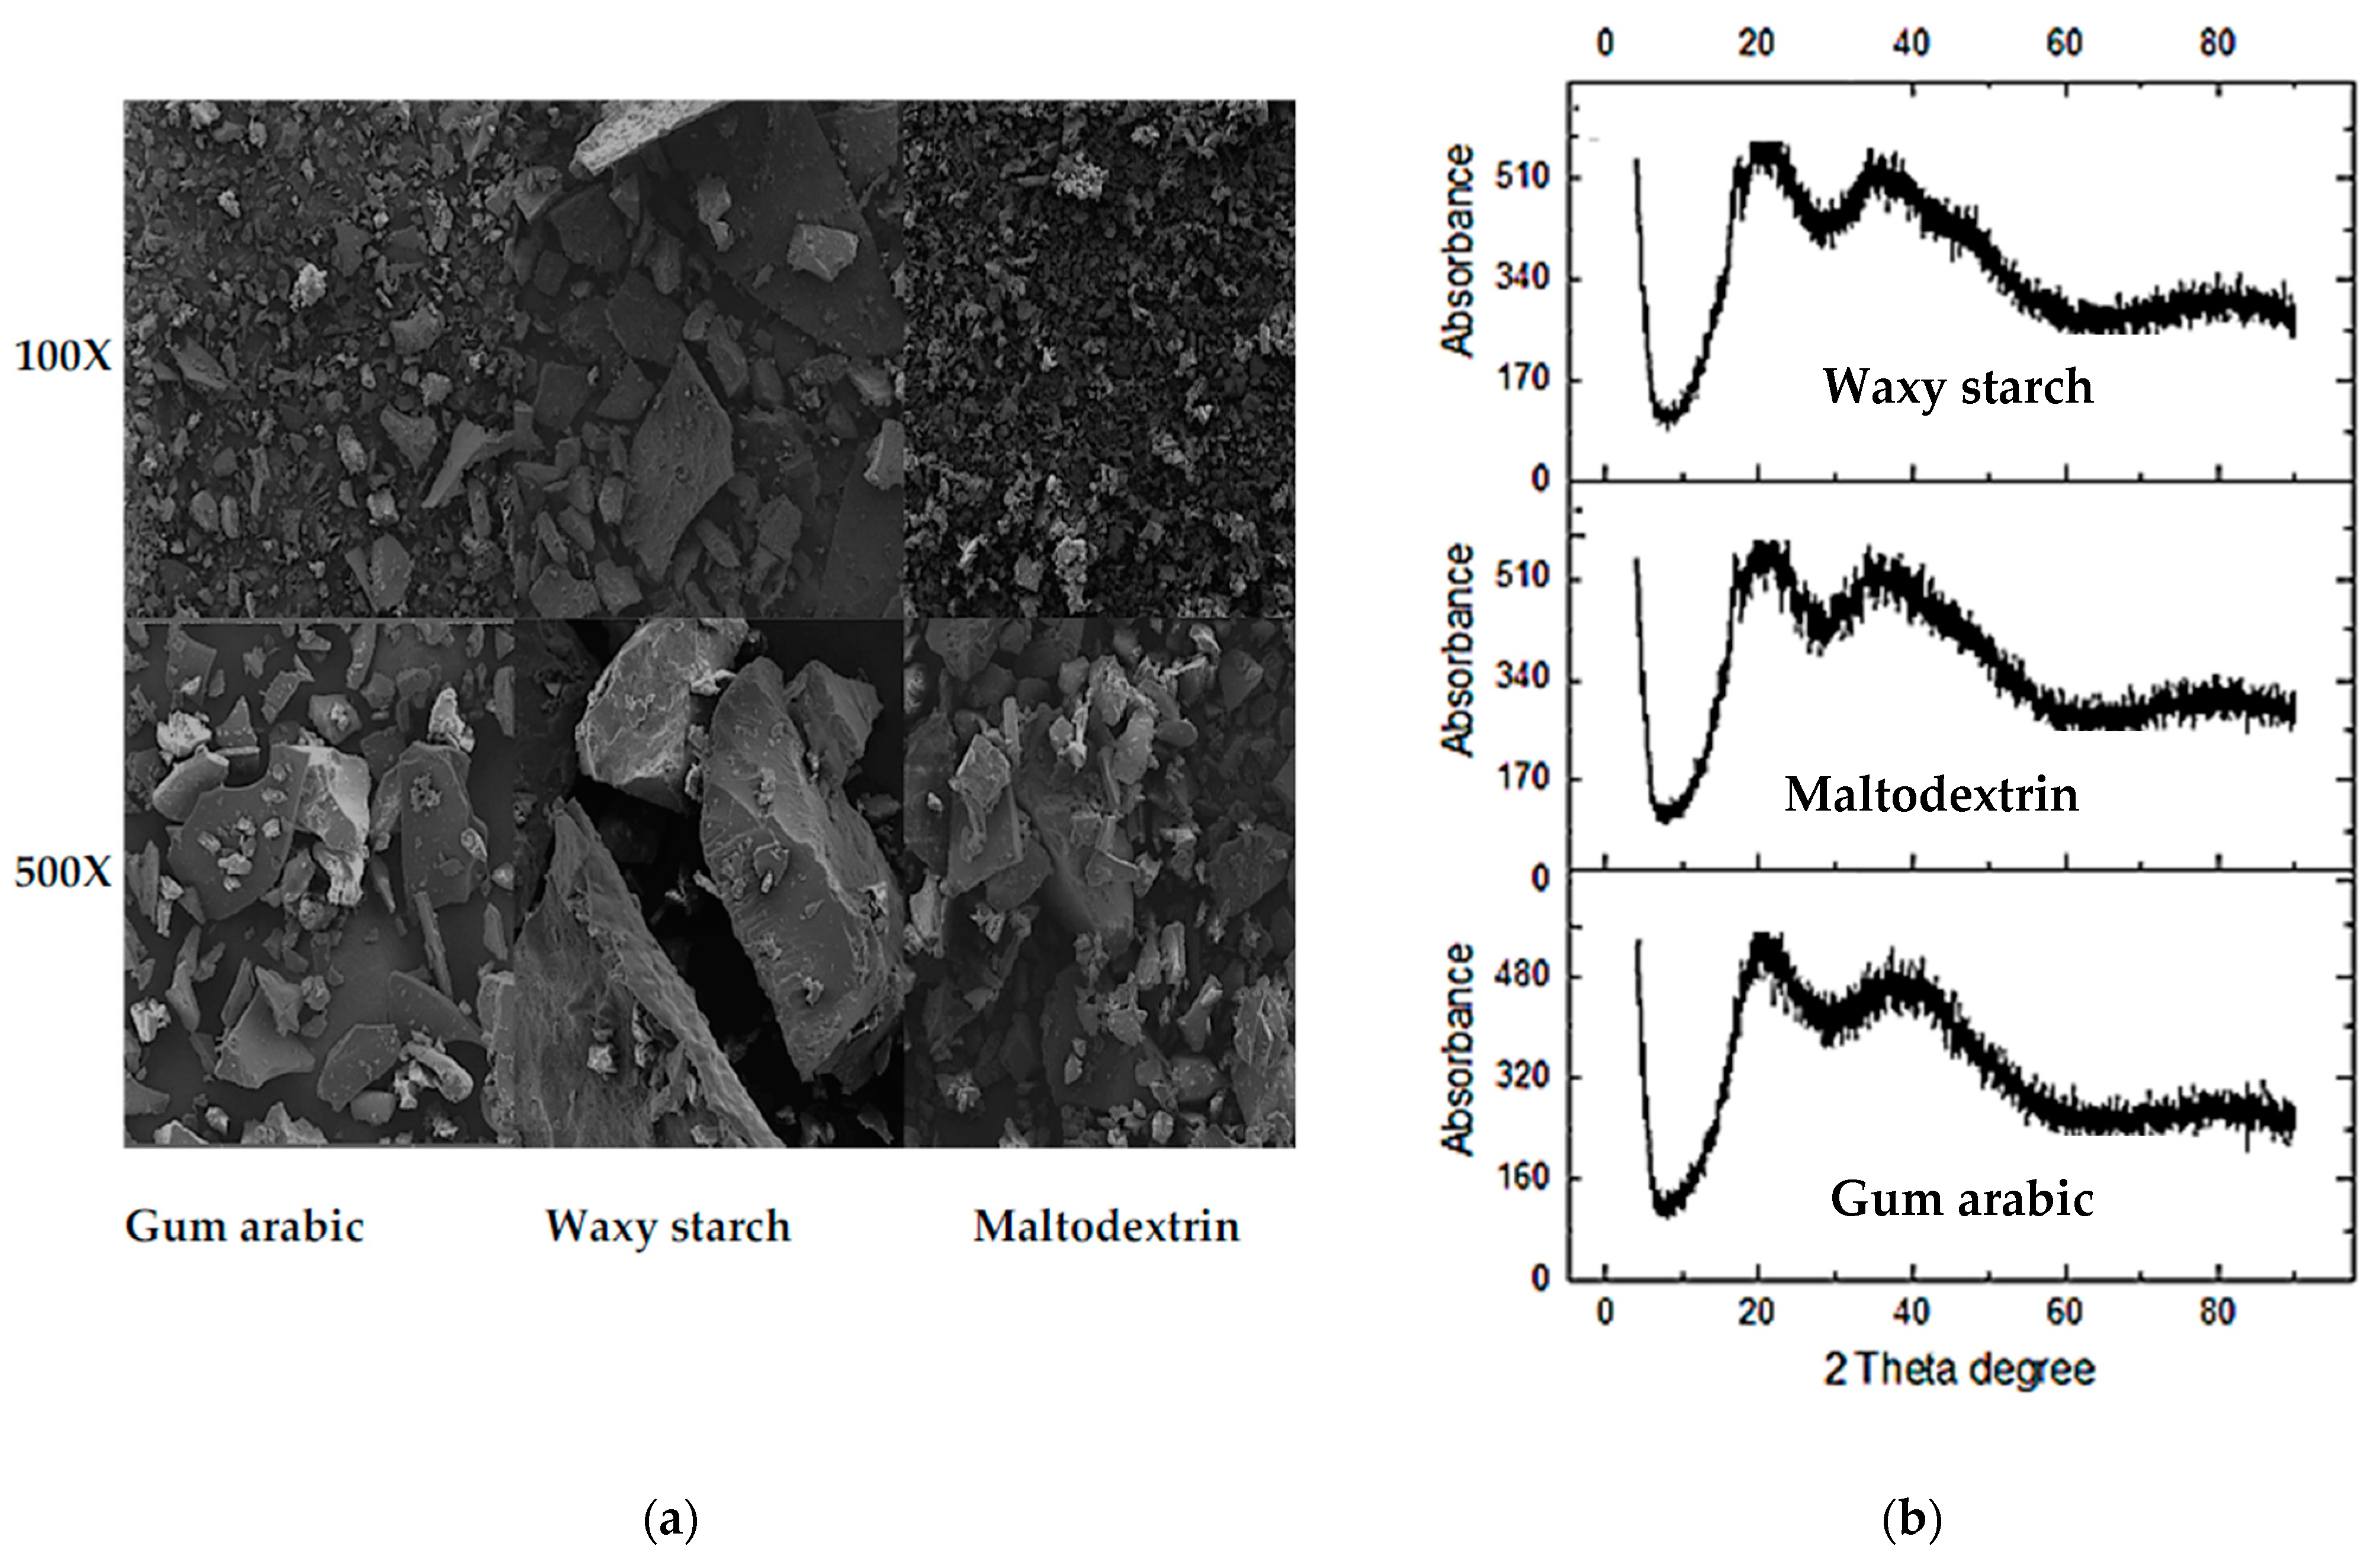
3.5. Microstructures of PFPP
3.6. X-ray Diffraction of PFPP
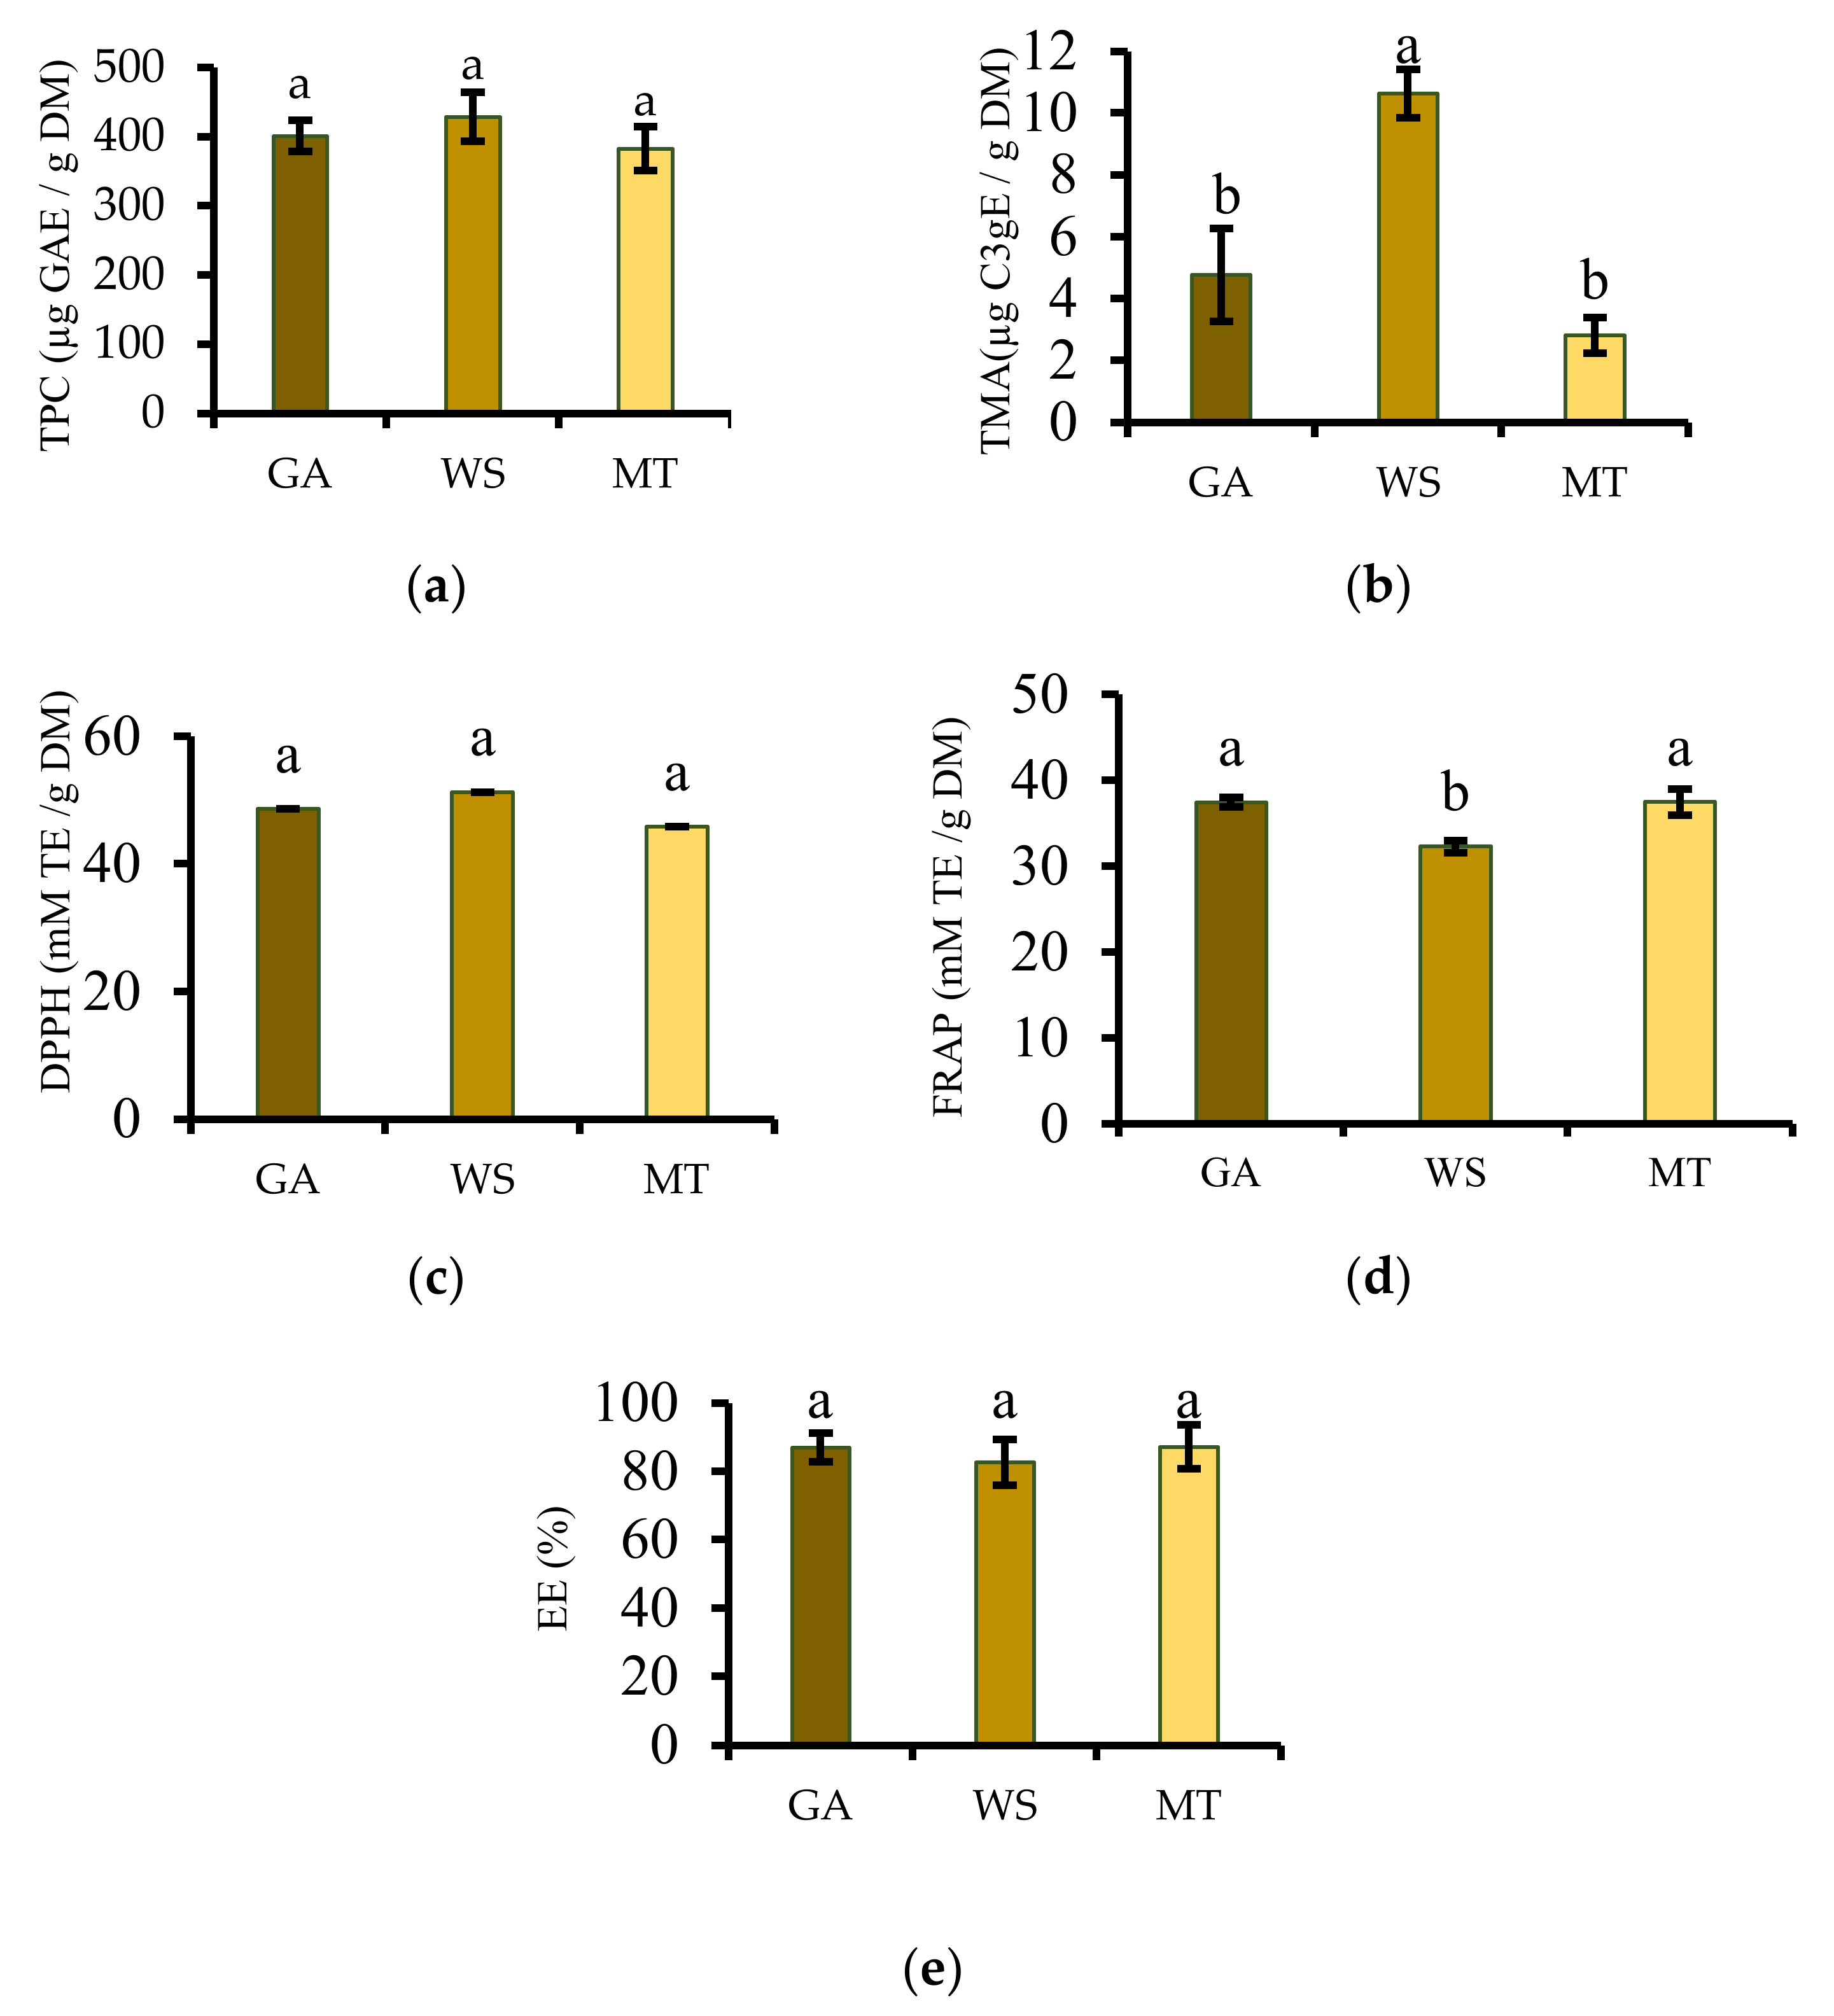
3.7. Total Phenolic Content and Total Monomeric Anthocyanin
3.8. Antioxidant Activity
3.9. Encapsulation Efficiency
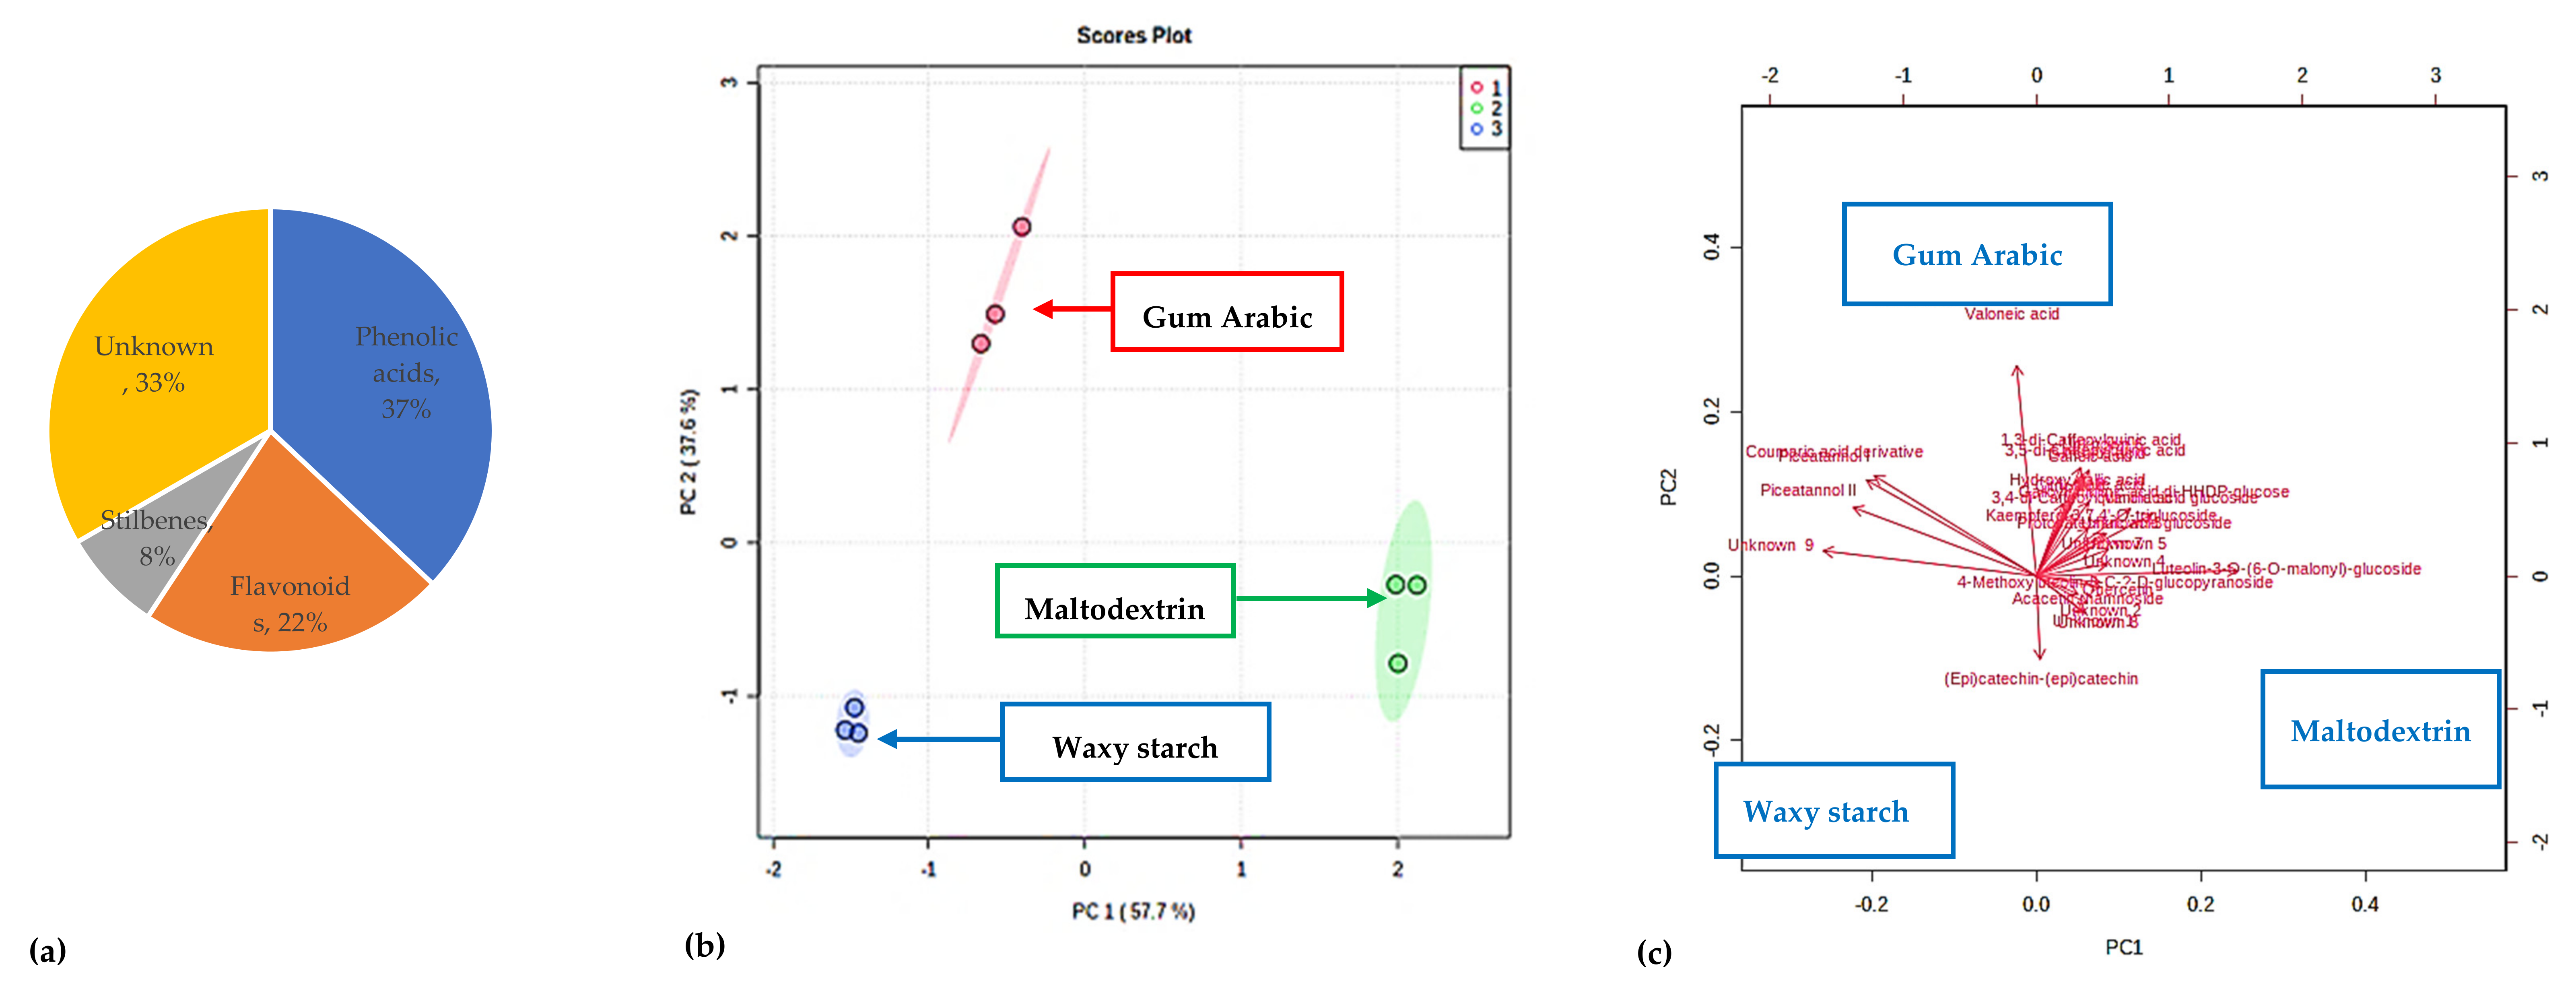
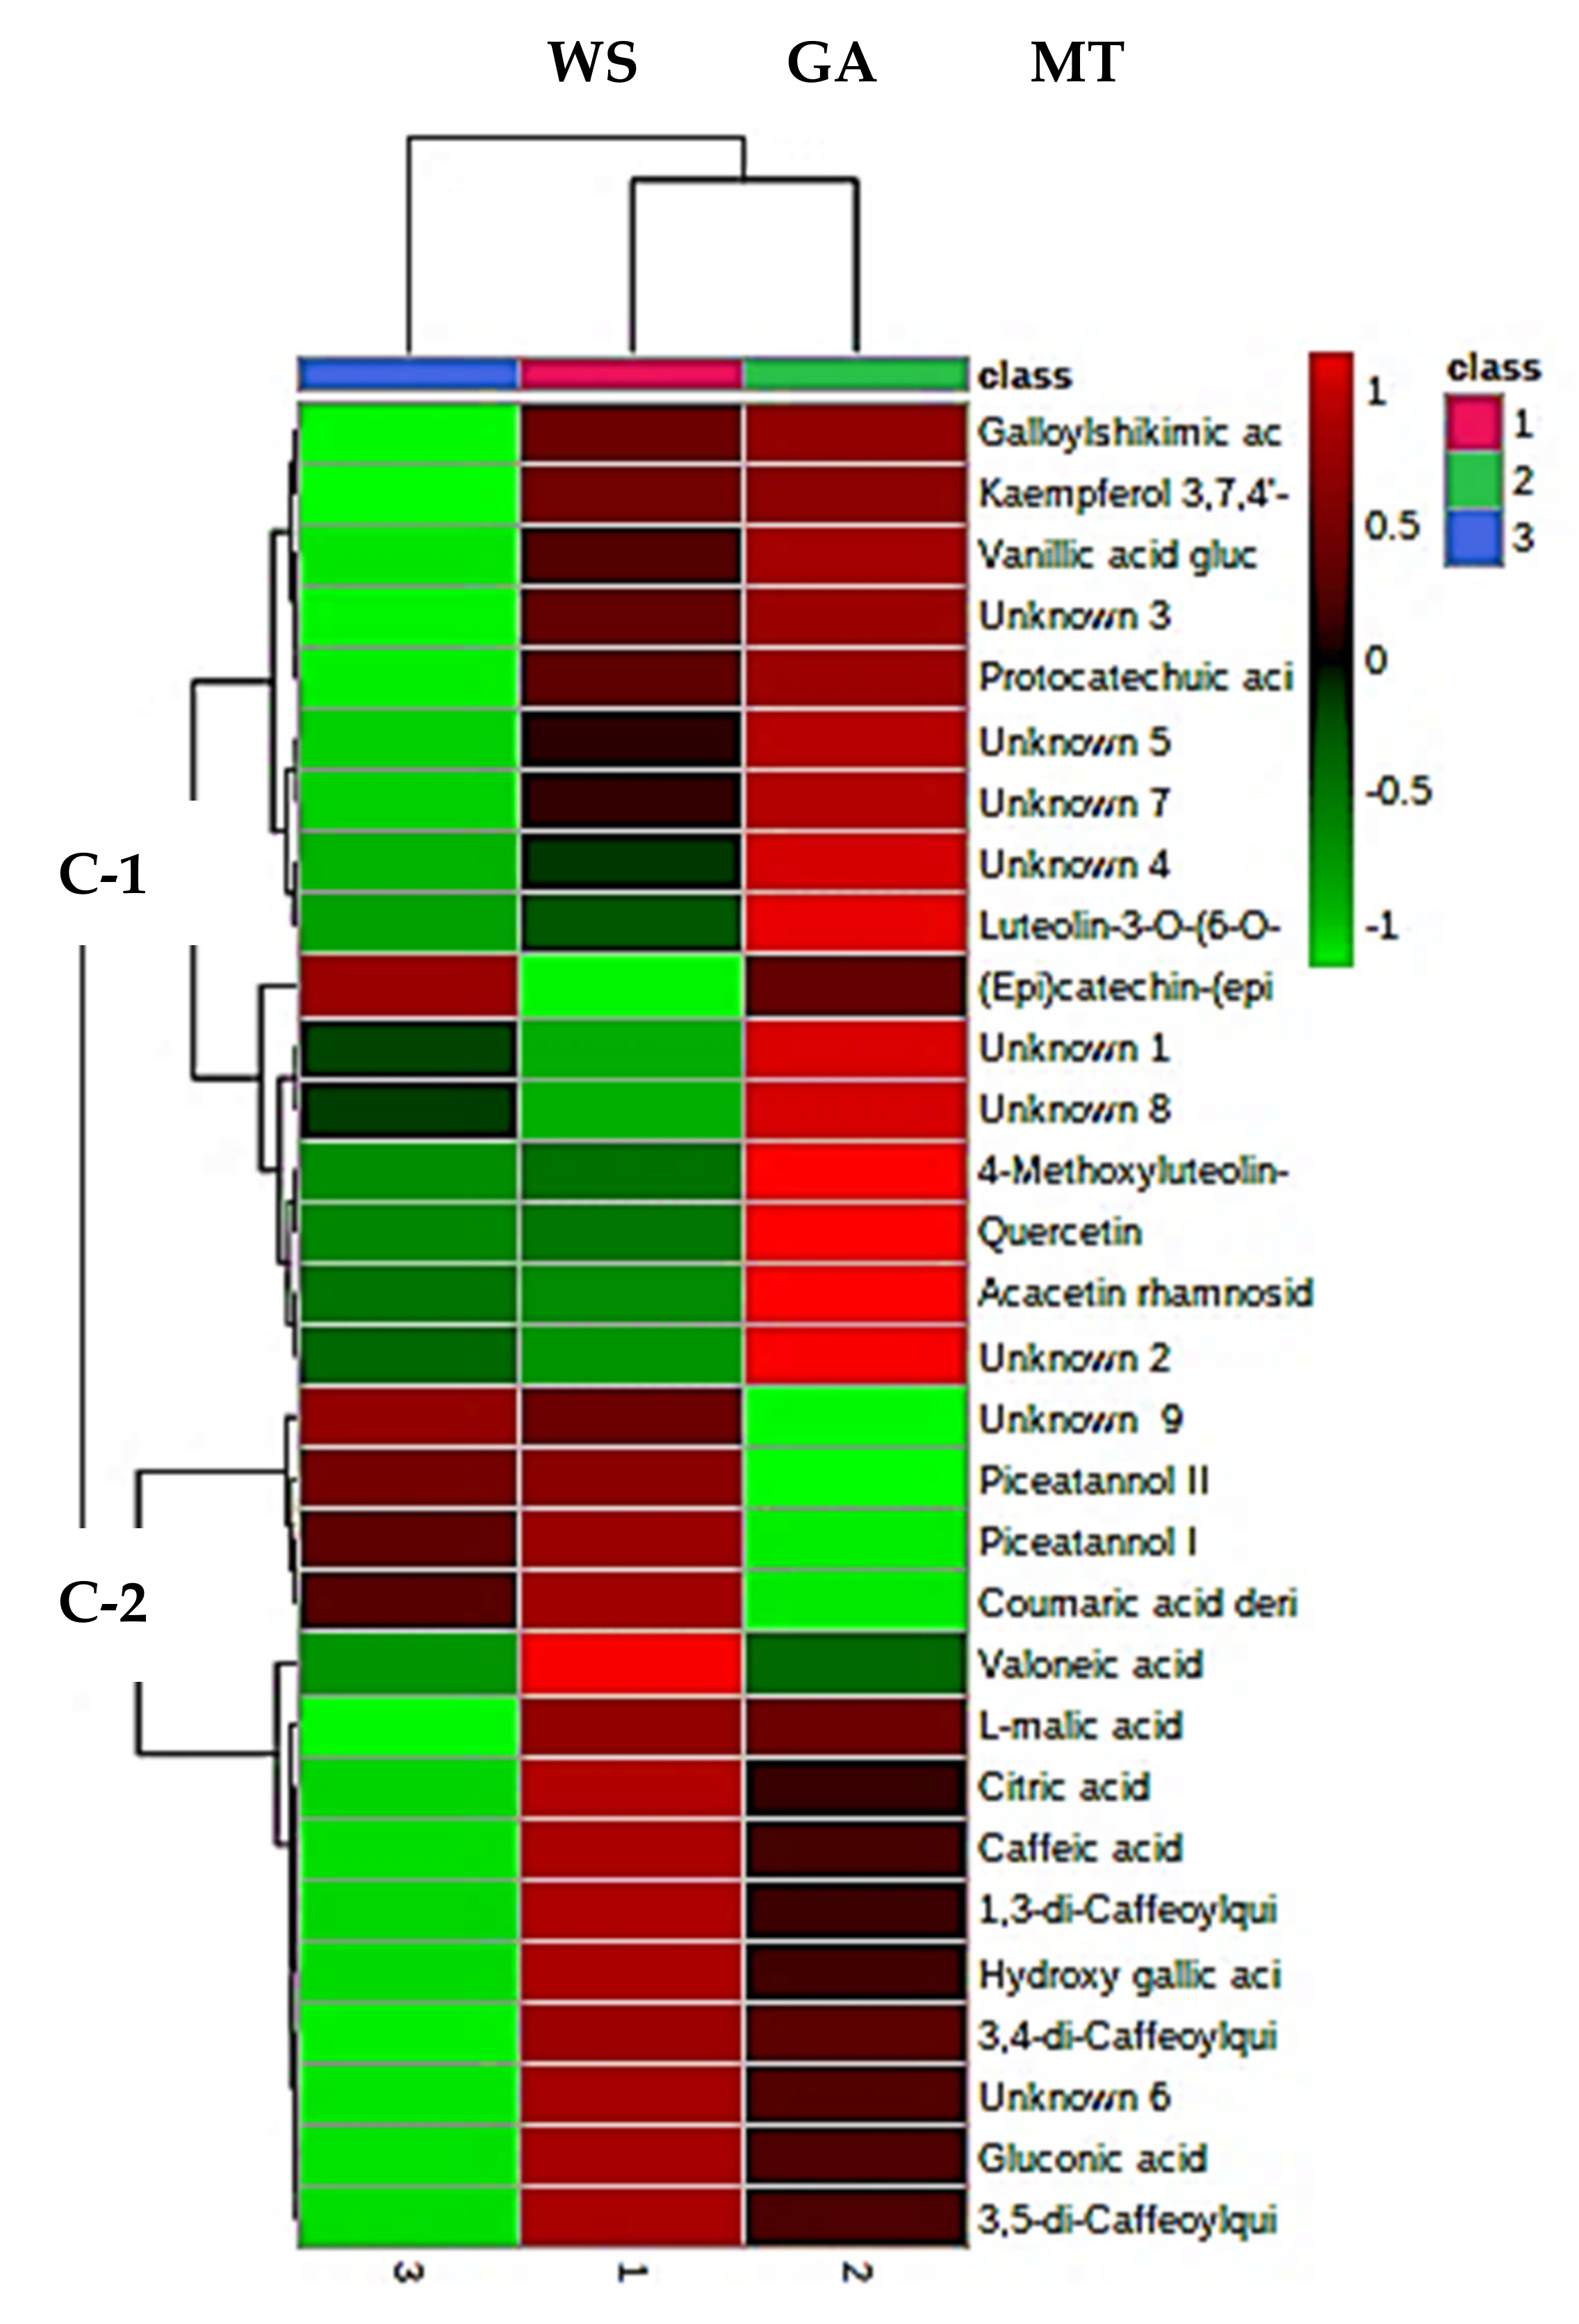
3.10. PFPP Metabolomic Analysis
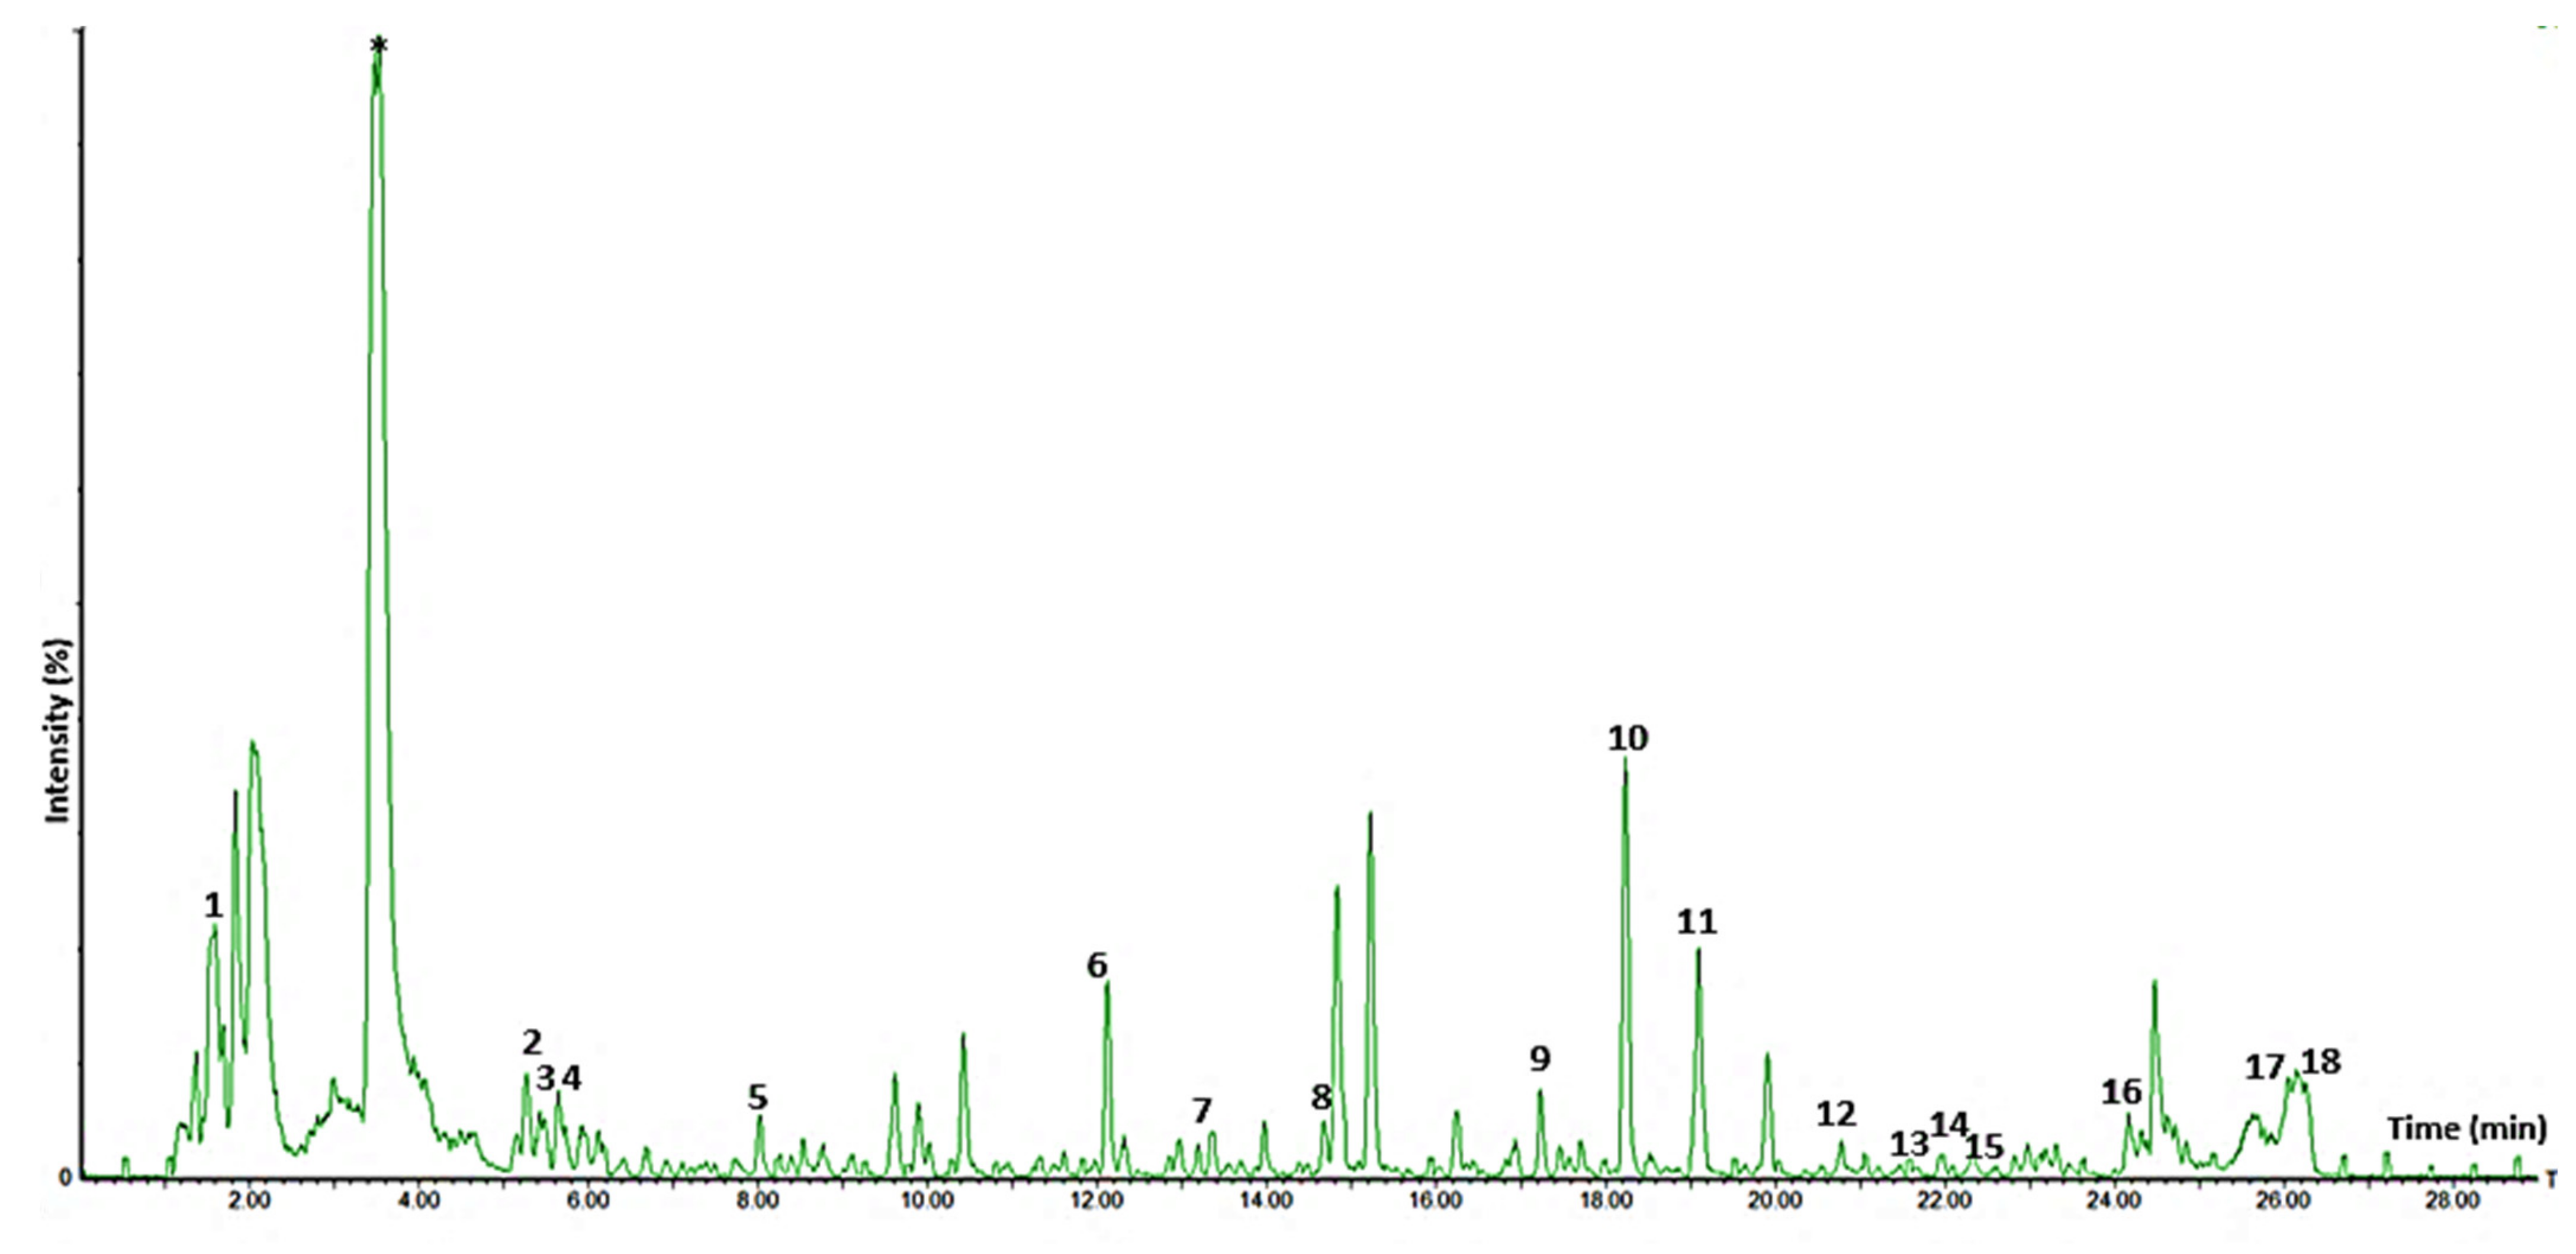
3.10.1. Tentative Identification of Metabolites
3.10.2. Quantification of Some of the Metabolites
4. Conclusions
Supplementary Materials
Author Contributions
Funding
Institutional Review Board Statement
Informed Consent Statement
Data Availability Statement
Conflicts of Interest
References
- Banerjee, J.; Singh, R.; Vijayaraghavan, R.; MacFarlane, D.; Patti, A.F.; Arora, A. Bioactives from fruit processing wastes: Green approaches to valuable chemicals. Food Chem. 2017, 225, 10–22. [Google Scholar] [CrossRef] [PubMed]
- Kaseke, T.; Opara, U.L.; Fawole, O.A. Fatty acid composition, bioactive phytochemicals, antioxidant properties and oxidative stability of edible fruit seed oil: Effect of preharvest and processing factors. Heliyon 2020, 6, 1–15. [Google Scholar] [CrossRef] [PubMed]
- Oliveira, C.F.; Gurak, P.D.; Cladera-Olivera, F.; Marczak, L.D.F. Evaluation of physicochemical, technological, and morphological characteristics of powdered yellow passion fruit peel. Int. Food Res. J. 2016, 23, 1653–1662. [Google Scholar]
- Ramli, A.N.M.; Manap, N.W.A.; Bhuyar, P.; Azelee, N.I.W. Passion fruit (Passiflora edulis) peel powder extract and its application towards antibacterial and antioxidant activity on the preserved meat products. SN Appl. Sci. 2020, 2, 1–11. [Google Scholar] [CrossRef]
- De Faveri, A.; De Faveri, R.; Broering, M.F.; Bousfield, I.T.; Goss, M.J.; Muller, S.P.; Pereira, R.O.; e Silva, A.M.D.O.; Machado, I.D.; Quintão, N.L.M.; et al. Effects of passion fruit peel flour (Passiflora edulis f. flavicarpa O. Deg.) in cafeteria diet-induced metabolic disorders. J. Ethnopharmacol. 2020, 250, 1–9. [Google Scholar] [CrossRef]
- García-Villegas, A.; Rojas-García, A.; Villegas-Aguilar, M.D.C.; Fernández-Moreno, P.; Fernández-Ochoa, Á.; Cádiz-Gurrea, M.L.; Arráez-Román, D.; Segura-Carretero, A. Cosmeceutical Potential of Major Tropical and Subtropical Fruit By-Products for a Sustainable Revalorization. Antioxidants 2022, 11, 203. [Google Scholar] [CrossRef]
- Hernández-Santos, B.; Vivar-Vera, M.D.L.Á.; Rodríguez-Miranda, J.; Herman-Lara, E.; Torruco-Uco, J.G.; Acevedo-Vendrell, O.; Martínez-Sánchez, C.E. Dietary fibre and antioxidant compounds in passion fruit (Passiflora edulis f. flavicarpa) peel and depectinised peel waste. Int. J. Food Sci. Technol. 2015, 50, 268–274. [Google Scholar] [CrossRef]
- He, X.; Luan, F.; Yang, Y.; Wang, Z.; Zhao, Z.; Fang, J.; Wang, M.; Zuo, M.; Li, Y. Passiflora edulis: An insight into current research on phytochemistry and pharmacology. Front. Pharmacol. 2020, 11, 1–16. [Google Scholar] [CrossRef]
- Kuck, L.S.; Noreña, C.P.Z. Microencapsulation of grape (Vitis labrusca var. Bordo) skin phenolic extract using gum Arabic, polydextrose, and partially hydrolyzed guar gum as encapsulating agents. Food Chem. 2016, 194, 569–576. [Google Scholar] [CrossRef]
- Adetoro, A.O.; Opara, U.L.; Fawole, O.A. Effect of carrier agents on the physicochemical and technofunctional properties and antioxidant capacity of freeze-dried pomegranate juice (Punica granatum) powder. Foods 2020, 9, 1388. [Google Scholar] [CrossRef]
- Ballesteros, L.F.; Ramirez, M.J.; Orrego, C.E.; Teixeira, J.A.; Mussatto, S.I. Encapsulation of antioxidant phenolic compounds extracted from spent coffee grounds by freeze-drying and spray-drying using different coating materials. Food Chem. 2017, 237, 623–631. [Google Scholar] [CrossRef] [PubMed]
- Sarabandi, K.; Jafari, S.M.; Mahoonak, A.S.; Mohammadi, A. Application of gum Arabic and maltodextrin for encapsulation of eggplant peel extract as a natural antioxidant and color source. Int. J. Biol. Macromol. 2019, 140, 59–68. [Google Scholar] [CrossRef] [PubMed]
- Lourenco, S.C.; Campos, D.A.; Gómez-García, R.; Pintado, M.; Oliveira, M.C.; Santos, D.I.; Alves, V.D. Optimization of natural antioxidants extraction from pineapple peel and their stabilization by spray drying. Foods 2021, 10, 1255. [Google Scholar] [CrossRef] [PubMed]
- Šavikin, K.; Nasti´c, N.; Jankovi´c, T.; Bigovi´c, D.; Milicevi´c, B.; Vidovi´c, S.; Menkovi´c, N.; Vladi´c, J. Effect of type and concentration of carrier material on the encapsulation of pomegranate peel using spray drying method. Foods 2021, 10, 1968. [Google Scholar] [CrossRef] [PubMed]
- Nthimole, C.T.; Kaseke, T.; Fawole, O.A. Micro-Encapsulation and Characterization of Anthocyanin-Rich Raspberry Juice Powder for Potential Applications in the Food Industry. Processes 2022, 10, 1038. [Google Scholar] [CrossRef]
- El-Messery, T.M.; El-Said, M.M.; Demircan, E.; Ozçelik, B. Microencapsulation of natural polyphenolic compounds extracted from apple peel and its application in yoghurt. Acta Sci. Pol. Technol. Aliment. 2019, 18, 25–34. [Google Scholar]
- Nowak, D.; Jakubczyk, E. The freeze-drying of foods—The characteristic of the process course and the effect of its parameters on the physical properties of food materials. Foods 2020, 9, 1488. [Google Scholar] [CrossRef]
- Magangana, T.P.; Makunga, N.P.; la Grange, C.; Stander, M.A.; Fawole, O.A.; Opara, U.L. Blanching pre-treatment promotes high yields, bioactive compounds, antioxidants, enzyme inactivation and antibacterial activity of ‘Wonderful’pomegranate peel extracts at three different harvest maturities. Antioxidants 2021, 10, 1119. [Google Scholar] [CrossRef]
- Fawole, O.A.; Opara, U.L. Seasonal variation in chemical composition, aroma volatiles and antioxidant capacity of pomegranate during fruit development. Afr. J. Biotechnol. 2013, 12, 4006–4019. [Google Scholar]
- Yousefi, S.; Emam-Djomeh, Z.; Mousavi, S.M. Effect of carrier type and spray drying on the physicochemical properties of powdered and reconstituted pomegranate juice (Punica Granatum L.). J. Food Sci. Technol. 2011, 48, 677–684. [Google Scholar] [CrossRef]
- Shofinita, D.; Bindar, Y.; Samadhi, T.W.; Choliq, N.S.; Jaelawijaya, A.A. Increasing the Yield of Powder and Bioactive Materials during Extraction and Spray Drying of Dragon Fruit Skin Extracts. J. Eng. Technol. Sci. 2021, 53, 210612. [Google Scholar] [CrossRef]
- Dag, D.; Kilercioglu, M.; Oztop, M.H. Physical and chemical characteristics of encapsulated goldenberry (Physalis peruviana L.) juice powder. LWT-Food Sci. Technol. 2017, 83, 86–94. [Google Scholar] [CrossRef]
- Mahdavi, S.A.; Jafari, S.M.; Assadpoor, E.; Dehnad, D. Microencapsulation optimization of natural anthocyanins with maltodextrin, gum Arabic and gelatin. Int. J. Biol. Macromol. 2016, 85, 379–385. [Google Scholar] [CrossRef]
- Anekella, K.; Orsat, V. Optimization of microencapsulation of probiotics in raspberry juice by spray drying. LWT-Food Sci. Technol. 2013, 50, 17–24. [Google Scholar] [CrossRef]
- Caparino, O.A.; Tang, J.; Nindo, C.I.; Sablani, S.S.; Powers, J.R.; Fellman, J.K. Effect of drying methods on the physical properties and microstructures of mango (Philippine ‘Carabao’var.) powder. J. Food Eng. 2012, 111, 135–148. [Google Scholar] [CrossRef]
- Barbosa, J.; Borges, S.; Amorim, M.; Pereira, M.J.; Oliveira, A.; Pintado, M.E.; Teixeira, P. Comparison of spray drying, freeze drying and convective hot air drying for the production of a probiotic orange powder. J. Funct. Foods 2015, 17, 340–351. [Google Scholar] [CrossRef]
- Chang, L.S.; Karim, R.; Abdulkarim, S.M.; Yusof, Y.A.; Ghazali, H.M. Storage stability, color kinetics and morphology of spray-dried soursop (Annona muricata L.) powder: Effect of anticaking agents. Int. J. Food Prop. 2018, 21, 1937–1954. [Google Scholar] [CrossRef]
- Lee, C.W.; Oh, H.J.; Han, S.H.; Lim, S.B. Effects of hot air and freeze drying methods on physicochemical properties of citrus ‘hallabong’powders. Food Technol. Biotechnol. 2012, 21, 1633–1639. [Google Scholar] [CrossRef]
- Wang, W.; Zhou, W. Characterisation of spray dried soy sauce powders made by adding crystalline carbohydrates to drying carrier. Food Chem. 2015, 168, 417–422. [Google Scholar] [CrossRef]
- George, T.T.; Oyenihi, A.B.; Rautenbach, F.; Obilana, A.O. Characterization of Moringa oleifera leaf powder extract encapsulated in maltodextrin and/or gum arabic coatings. Foods 2021, 10, 3044. [Google Scholar] [CrossRef]
- Cano-Chauca, M.; Stringheta, P.C.; Ramos, A.M.; Cal-Vidal, J. Effect of the carriers on the microstructure of mango powder obtained by spray drying and its functional characterization. Innov. Food Sci. Emerg. Technol. 2005, 6, 420–428. [Google Scholar] [CrossRef]
- GEA Niro. Hygroscopicity—Method A14a. GEA Niro Analytical Methods of Dry Milk Products, GEA Niro, Soeborg, Denmark. 2005, pp. 1–3. Available online: https://efps.gr/products/dryers-particle-processing-plants/spray-dryers/food-dairy-products/analytical-methods-dry-milk-products/ (accessed on 22 April 2022).
- Gabas, A.L.; Telis, V.R.N.; Sobral, P.J.A.; Telis-Romero, J. Effect of maltodextrin and arabic gum in water vapor sorption thermodynamic properties of vacuum dried pineapple pulp powder. J. Food Eng. 2007, 82, 246–252. [Google Scholar] [CrossRef]
- Tonon, R.V.; Brabet, C.; Pallet, D.; Brat, P.; Hubinger, M.D. Physicochemical and morphological characterisation of açai (Euterpe oleraceae Mart.) powder produced with different carrier agents. Int. J. Food Sci. Technol. 2009, 44, 1950–1958. [Google Scholar] [CrossRef]
- Michalska-Ciechanowska, A.; Hendrysiak, A.; Brzezowska, J.; Wojdyło, A.; Gajewicz-Skretna, A. How Do the Different Types of Carrier and Drying Techniques Affect the Changes in Physico-Chemical Properties of Powders from Chokeberry Pomace Extracts? Foods 2021, 10, 1864. [Google Scholar] [CrossRef] [PubMed]
- Caliskan, G.; Dirim, S.N. The effects of the different drying conditions and the amounts of maltodextrin addition during spray drying of sumac extract. Food Bioprod. Process. 2013, 91, 539–548. [Google Scholar] [CrossRef]
- Shi, H.; Mohanty, R.; Chakravarty, S.; Cabiscol, R.; Morgeneyer, M.; Zetzener, H.; Ooi, J.Y.; Kwade, A.; Luding, S.; Magnanimo, V. Effect of particle size and cohesion on powder yielding and flow. KONA Powder Part. J. 2018, 35, 1–22. [Google Scholar] [CrossRef]
- Saifullah, M.; Yusof, Y.A.; Chin, N.L.; Aziz, M.G. Physicochemical and flow properties of fruit powder and their effect on the dissolution of fast dissolving fruit powder tablets. Powder Technol. 2016, 301, 396–404. [Google Scholar] [CrossRef]
- Mahdavi, S.A.; Jafari, S.M.; Assadpour, E.; Ghorbani, M. Storage stability of encapsulated barberry’s anthocyanin and its application in jelly formulation. J. Food Eng. 2016, 181, 59–66. [Google Scholar] [CrossRef]
- Ramakrishnan, Y.; Adzahan, N.M.; Yusof, Y.A.; Muhammad, K. Effect of wall materials on the spray drying efficiency, powder properties and stability of bioactive compounds in tamarillo juice microencapsulation. Powder Technol. 2018, 328, 406–414. [Google Scholar] [CrossRef]
- Belorio, M.; Sahagún, M.; Gómez, M. Influence of flour particle size distribution on the quality of maize gluten-free cookies. Foods 2019, 8, 83. [Google Scholar] [CrossRef]
- Dias, C.O.; de Almeida, J.D.S.O.; Pinto, S.S.; de Oliveira Santana, F.C.; Verruck, S.; Müller, C.M.O.; Prudêncio, E.S.; Amboni, R.D.D.M.C. Development and physico-chemical characterization of microencapsulated bifidobacteria in passion fruit juice: A functional non-dairy product for probiotic delivery. Food Biosci. 2018, 24, 26–36. [Google Scholar] [CrossRef]
- Liu, S.; Yu, J.; Zou, J.; Yang, Y.; Cui, L.; Chang, X. Effects of different drying and milling methods on the physicochemical properties and phenolic content of hawthorn fruit powders. J. Food Process. Preserv. 2020, 44, 1–11. [Google Scholar] [CrossRef]
- Gan, C.; Liu, Q.; Zhang, Y.; Shi, T.; He, W.S.; Jia, C. A novel phytosterols delivery system based on sodium caseinate-pectin soluble complexes: Improving stability and bioaccessibility. Food Hydrocoll. 2022, 124, 1–11. [Google Scholar] [CrossRef]
- Ersus, S.; Yurdagel, U. Microencapsulation of anthocyanin pigments of black carrot (Daucuscarota L.) by spray drier. J. Food Eng. 2007, 80, 805–812. [Google Scholar] [CrossRef]
- Sasikumar, R.; Das, M.; Sahu, J.K.; Deka, S.C. Qualitative properties of spray-dried blood fruit (Haematocarpus validus) powder and its sorption isotherms. J. Food Process Eng. 2020, 43, 1–12. [Google Scholar] [CrossRef]
- Cid-Ortega, S.; Guerrero-Beltran, J.A.; de Matamoros, I. Lyophilized Powder of Hibiscus sabdariffa (Roselle) Extracts using Gum Arabic and Maltodextrin as Carrier Agents. J. Food Res. 2022, 11, 1–15. [Google Scholar] [CrossRef]
- Khalifa, I.; Li, M.; Mamet, T.; Li, C. Maltodextrin, or gum Arabic with whey proteins as wall-material blends increased the stability and physiochemical characteristics of mulberry microparticles. Food Biosci. 2019, 31, 1–12. [Google Scholar] [CrossRef]
- Navarro-Flores, M.J.; Ventura-Canseco, L.M.C.; Meza-Gordillo, R.; Ayora-Talavera, T.D.R.; Abud-Archila, M. Spray drying encapsulation of a native plant extract rich in phenolic compounds with combinations of maltodextrin and non-conventional wall materials. J. Food Sci. Technol. 2020, 57, 4111–4122. [Google Scholar] [CrossRef] [PubMed]
- Esmaeili, F.; Hashemiravan, M.; Eshaghi, M.R.; Gandomi, H. Encapsulation of Arctium lappa L. root extracts by spray-drying and freeze-drying using maltodextrin and Gum Arabic as coating agents and it’s application in synbiotic orange-carrot juice. J. Food Meas. Charact. 2022, 16, 1–14. [Google Scholar] [CrossRef]
- Sassi, C.B.; Marcet, I.; Rendueles, M.; Díaz, M.; Fattouch, S. Egg yolk protein as a novel wall material used together with gum Arabic to encapsulate polyphenols extracted from Phoenix dactylifera L pits. LWT-Food Sci. Technol. 2020, 131, 1–8. [Google Scholar]
- Araujo, H.C.S.; Jesus, M.S.; Leite Neta, M.T.S.; Gualberto, N.C.; Matos, C.M.S.; Rajan, M.; Rajkumar, G.; Nogueira, J.P.; Narain, N. Effect of maltodextrin and gum arabic on antioxidant activity and phytochemical profiles of spray-dried powders of sapota (Manilkara zapota) fruit juice. Dry. Technol. 2020, 39, 392–404. [Google Scholar] [CrossRef]
- Ribeiro, A.M.; Shahgol, M.; Estevinho, B.N.; Rocha, F. Microencapsulation of Vitamin A by spray-drying, using binary and ternary blends of gum arabic, starch and maltodextrin. Food Hydrocoll. 2020, 108, 1–13. [Google Scholar] [CrossRef]
- Domínguez-Rodríguez, G.; García, M.C.; Plaza, M.; Marina, M.L. Revalorization of Passiflora species peels as a sustainable source of antioxidant phenolic compounds. Sci. Total Environ. 2019, 696, 1–13. [Google Scholar] [CrossRef]
- Shi, M.; Ali, M.M.; He, Y.; Ma, S.; Rizwan, H.M.; Yang, Q.; Chen, F. Flavonoids accumulation in fruit peel and expression profiling of related genes in purple (Passiflora edulis f. edulis) and yellow (Passiflora edulis f. flavicarpa) passion fruits. Plants 2021, 10, 2240. [Google Scholar] [CrossRef]
- Xin, M.; LI, C.; Sun, Y.; Sheng, J.; Tang, Y.; Sun, J.; Ling, D. Variation Characteristics of Aroma Components and Related Enzyme Activities During Storage of Passion Fruit (Passiflora caerulea L.). Chin. J. Trop. Crops 2021, 42, 1472. [Google Scholar]
- El Khawand, T.; Courtois, A.; Valls, J.; Richard, T.; Krisa, S. A review of dietary stilbenes: Sources and bioavailability. Phytochem. Rev. 2018, 17, 1007–1029. [Google Scholar] [CrossRef]


| Carrier | MC (%) | Yield (%) | L* | a* | b* | h° | C* | ΔE |
|---|---|---|---|---|---|---|---|---|
| GA | 6.41 ± 0.35 a | 14.65 ± 1.35 b | 59.87 ± 0.85 a | 14.30 ± 0.17 c | 19.10 ± 0.12 c | 53.18 ± 0.33 a | 23.86 ± 0.10 c | 21.03 ± 1.62 ab |
| WS | 5.39 ± 0.14 b | 13.02 ± 1.34 c | 54.70 ± 0.47 b | 22.90 ± 0.49 a | 26.63 ± 0.02 a | 49.32 ± 0.50 b | 35.13 ± 0.44 a | 17.06 ± 0.33 b |
| MT | 6.10 ± 0.23 a | 15.40 ± 1.86 a | 61.67 ± 1.08 a | 16.47 ± 0.09 b | 22.20 ± 0.21 b | 53.43 ± 0.11 a | 27.64 ± 0.38 b | 22.29 ± 1.66 a |
| Carrier | Hygroscopicity (%) | WHC (%) | OHC (%) | Bulk Density (g/cm3) | Solubility (%) |
|---|---|---|---|---|---|
| GA | 2.13 ± 0.032 a | 0.003 ± 0.001 c | 1.42 ±0.11 a | 0.82 ± 0.002 a | 91.33 ± 3.53 a |
| WS | 2.05 ± 0.001 b | 5.340 ± 0.374 a | 3.19 ± 1.24 a | 0.77 ± 0.002 b | 30.67± 5.46 b |
| MT | 2.07 ± 0.009 ab | 1.938 ± 0.015 b | 1.39 ± 0.15 a | 0.81 ± 0.004 a | 76.00 ± 3.46 a |
| Phenolic Compound (µg/g) | Gum Arabic | Maltodextrin | Waxy Starch |
|---|---|---|---|
| Phenolic acids | |||
| Caffeic acid * | 56.56 ± 1.55 a | 55.36 ± 5.58 a | 57.55 ± 1.40 a |
| 1,3 di-Caffeoylquinic acid A | 29.40 ± 2.09 a | 26.96 ± 1.32 b | 26.44 ± 0.18 b |
| 3,4 di-Caffeoylquinic acid A | 20.15 ± 0.11 c | 22.62 ± 1.77 b | 27.51 ± 0.74 a |
| 3,5 di-Caffeoylquinic acid A | 19.23 ± 0.39 a | 18.64 ± 0.19 b | 18.49 ± 0.25 b |
| Coumaric acid derivative B | 241.97 ± 12.93 b | ND | 272.09 ± 22.47 a |
| Flavonoid | |||
| Quercetin * | 245.76 ± 3.03 c | 362.47 ± 29.34 b | 433.79 ± 5.52 a |
| (Epi)catechin-(Epi)catechin C | 76.82 ± 5.51 c | 123.26 ± 3.11 b | 200.63 ± 2.54 a |
Publisher’s Note: MDPI stays neutral with regard to jurisdictional claims in published maps and institutional affiliations. |
© 2022 by the authors. Licensee MDPI, Basel, Switzerland. This article is an open access article distributed under the terms and conditions of the Creative Commons Attribution (CC BY) license (https://creativecommons.org/licenses/by/4.0/).
Share and Cite
Kobo, G.K.; Kaseke, T.; Fawole, O.A. Micro-Encapsulation of Phytochemicals in Passion Fruit Peel Waste Generated on an Organic Farm: Effect of Carriers on the Quality of Encapsulated Powders and Potential for Value-Addition. Antioxidants 2022, 11, 1579. https://doi.org/10.3390/antiox11081579
Kobo GK, Kaseke T, Fawole OA. Micro-Encapsulation of Phytochemicals in Passion Fruit Peel Waste Generated on an Organic Farm: Effect of Carriers on the Quality of Encapsulated Powders and Potential for Value-Addition. Antioxidants. 2022; 11(8):1579. https://doi.org/10.3390/antiox11081579
Chicago/Turabian StyleKobo, Gift Kabelo, Tafadzwa Kaseke, and Olaniyi Amos Fawole. 2022. "Micro-Encapsulation of Phytochemicals in Passion Fruit Peel Waste Generated on an Organic Farm: Effect of Carriers on the Quality of Encapsulated Powders and Potential for Value-Addition" Antioxidants 11, no. 8: 1579. https://doi.org/10.3390/antiox11081579
APA StyleKobo, G. K., Kaseke, T., & Fawole, O. A. (2022). Micro-Encapsulation of Phytochemicals in Passion Fruit Peel Waste Generated on an Organic Farm: Effect of Carriers on the Quality of Encapsulated Powders and Potential for Value-Addition. Antioxidants, 11(8), 1579. https://doi.org/10.3390/antiox11081579