Abstract
The antioxidant, anti-inflammatory and antiproliferative properties of Passiflora alata Curtis are due to the presence of polyphenols in its composition. Our previous work showed that non-obese diabetic (NOD) mice undergoing treatment with aqueous leaf extract of P. alata present reduced insulitis in the pancreas, possibly due to its anti-inflammatory properties. However, depending on the concentration and their ability to interact with other molecules, these phenolic compounds may promote oxidation reactions in some cellular components, such as proteins and lipids, thus presenting a pro-oxidant effect. The present work aimed to evaluate the in vitro effects of aqueous leaf extract of P. alata and its polyphenols (vitexin, isoorientin, rutin and catechin) on lymphocyte proliferation and viability, the cell cycle and oxidative stress. Our results showed that T lymphocytes stimulated with concanavalin A mitogen (ConA) and in the presence of IC50 concentrations of P. alata extract and polyphenols undergo cell injury via inhibition of proliferation, with these effects being more pronounced concerning CD4+ T cells (P. alata, 3.54 ± 0.34%; isoorientin, 57.07 ± 6.4%; vitexin, 16.95 ± 1.11%; catechin, 37.9 ± 4.2% and rutin, 40.14 ± 4.5%), compared to the non-treated group (77.17 ± 6.29) (p < 0.0001 for all comparisons). This process includes late apoptosis/necrosis induction (P. alata, 77.5 ± 0.7%; vitexin, 83 ± 3.3%; isoorientin, 83.8 ± 1.4%; catechin, 83 ± 1.9% and rutin, 74.9 ± 3.2, while the control presented 53.6% ± 3.1 (p < 0.0001 for all comparisons)) and mitochondrial depolarization leading to cell-death induction. Furthermore, an in vitro model of a mixed culture of NOD mice T cells with a mouse pancreatic beta-cell line (MIN6) showed increased intracellular nitric oxide and lipid peroxidation in NOD T cells submitted to P. alata extract (46.41 ± 3.08) compared to the untreated control group (33.57 ± 1.99, p = 0.01315). These results suggest that aqueous leaf extract of P. alata and the polyphenols in these leaves represent a target for translational research showing the plant’s benefits for developing new drugs with immunomodulatory properties against inflammatory diseases such as diabetes mellitus.
1. Introduction
Polyphenols are secondary metabolites of plants [1] that can have anti-inflammatory, anticancer, vessel protective and anti-hepatotoxic properties, amongst other effects. Due to their anti-inflammatory properties, they have possible uses for treating different inflammatory diseases [2,3]. The effect of flavonoids, an important group of plant-derived polyphenols, has been studied in inflammatory and cancer cells [4]. The antiproliferative properties of polyphenols include inhibition cell proliferation and triggering cell cycle arrest [5], induction of apoptosis [6] and mitochondrial depolarization [7].
The genus Passiflora has about 500 known species, and Passiflora alata Curtis stands out due to the benefits of the phytotherapeutic compounds present in its leaves [8], which is mainly attributed to the high content of flavonoids in this plant structure. These compounds are associated with beneficial effects in controlling diseases initiated by oxidative stress by their antioxidant properties. The major flavonoid compounds of P. alata that present antioxidative activity include isoorientin, isovitexin, vitexin [9], rutin, catechin, epicatechin [10], apigenin and orientin [11].
However, the literature suggests that in addition to antioxidant effects, flavonoids also have a significant pro-oxidant impact under certain circumstances, such as certain concentrations and having the ability to interact with other molecules [12,13]. In their review, Lambert and Elias, 2010 [14] pointed out the pro-oxidant effect of green tea polyphenols in their capacity to increase reactive oxygen species generation, such as H2O2, in cell culture models. This could be attributed to the instability of these compounds in cell cultures, which can undergo autoxidative reactions resulting in the production of R.O.S. These authors also suggest that the pro-oxidant effects in animal models could be due to potential toxic effects generated by high dosages, which can generate pro-oxidant metabolites such as epigallocatechin quinone intermediates.
Reactive nitrogen species (R.N.S.) synthesis and its intermediate products are involved in pathophysiological mechanisms and complications in inflammatory diseases such as diabetes [15,16]. These molecules can initiate the oxidative stress process, which can induce D.N.A. damage and lipid peroxidation in cell membranes [15,16,17]. Although the causes of NO generation during adaptative immunity and inflammatory responses exerted by T lymphocytes are not fully understood, it is believed that NO is associated with tissue destruction through cytokine release induction and apoptotic stimulus activation [18,19]. On the other hand, under short-term exposure and low concentrations of R.N.S., immunoregulatory mechanisms such as inhibition of T cell proliferation [20,21] and platelet and neutrophil activation can occur [22], indicating a dual role of these molecules in inflammation.
A complex interaction among several types of cells, including T lymphocytes, occurs via biochemical events during the inflammatory process [23,24,25]. Among the proinflammatory cells that contribute to pancreatic insulitis, CD4+ and CD8+ T lymphocytes play a crucial role in insulin-producing beta cell injury, promoting hyperglycemia due to autoimmune type 1 diabetes mellitus (T1D) [26]. Non-obese diabetic mice (NOD mice) as one of the most fundamental experimental models of spontaneous T1D. Diabetes onset occurs from the 12th to the 24th week of life, with prevalence between 60–90% in females and 5–20% in males. In the 4th week of life, a few infiltrative mononuclear cells in the islets progressively invade the pancreatic islets [27], with the prevalence being CD4+ and CD8+ T cells. However, N.K. cells, B lymphocytes, macrophages and dendritic cells may also be found [28,29].
In our previous study, NOD mice treated with aqueous leaf extract of P. alata presented a decrease in proinflammatory infiltrative CD4+ and CD8+ lymphocytes (insulitis) and oxidative stress in the pancreatic islets [9], contributing to the survival of insulin-producing beta cells in the pancreas islets [10]. This study aimed to contribute knowledge of phenolic compounds’ in vivo anti-inflammatory effects via in vitro analyses. Aqueous leaf extract of P. alata and the polyphenols isoorientin, vitexin, catechin and rutin were analyzed, looking for their effects on cell proliferation, the cell cycle, apoptosis and apoptosis oxidative stress mechanisms in activated T lymphocytes from NOD mice mitogenic stimulus (Concanavalin A) or using the stressed insulinoma MIN6 as a source of β-cell antigen stimulus [30].
2. Materials and Methods
2.1. Lyophilized Passiflora alata Extract and Isolated Polyphenols
P. alata leaves (CNPq Patgen—010887/2014-8) were dried in a circulating air oven at 50 °C/48 h, ground and stored under refrigeration (8 °C). Subsequently, the aqueous leaf extract was filtrated in a 0.22 µm pore membrane, lyophilized and prepared to 0.1 g of leaves/mL water according to a previously described protocol [9]. The leaves lyophilization process was first diluted in phosphate-buffered saline (PBS), 0.1 M (pH 7.4) at 5 mg/mL concentration. The solutions of isoorientin, vitexin, catechin and rutin were prepared according to the manufacturer’s instructions (Sigma, St. Louis, MO, USA.), followed by dilution in PBS 0.1 M (pH 7.4). The specific dilution for the final concentration of P. alata extract and each polyphenol was then prepared in a culture medium for further cell treatment and filtered in a 0.22 µm pore membrane.
2.2. Mice
Female NOD ShiLt/J mice (n = 18) were obtained from the University of Campinas, Multidisciplinary Center for Biological Investigation on Laboratory Animal Science (C.E.M.I.B.), and maintained under temperature-, humidity- and light-controlled specific pathogen-free (SPF) facilities. The ShiLt/J non-obese diabetic (NOD) mice are an experimental animal model predisposed to spontaneous autoimmune diabetes and are widely used to study the immunopathology of type 1 diabetes, with close similarity to the human disease. Diabetes incidence in this lineage is 80–90% in females and 5–20% in males [31]. Thus, female NOD mice were grouped into six animals per experiment with triplicate cell analysis. NOD mice (30 weeks of life) were sacrificed by heart puncture under anesthesia (100–200 mg/kg ketamine hydrochloride and 5–16 mg/kg of xylazine hydrochloride (Dopalen, Vetbrands, Paulínia, Brazil).
2.3. Lymphocyte Proliferation Assay
The NOD mice spleens were aseptically removed, and the cell suspension was used to separate T lymphocytes. Briefly, spleen cells from three NOD mice were enriched for T lymphocytes through an adhesion protocol on nylon wool columns according to a previously described protocol [32] and stained with 1.25 µM carboxyfluorescein succinimidyl ester (C.F.S.E.) fluorescent probe (Thermo Fisher Scientific, Waltham MA, USA.) for 0.5 − 1 × 10⁶ cells. The lymphocytes were cultured in 96-well plates (Techno Plastic Products, Zellkultur, Trazadingen, Switzerland) at a concentration of 2.5 × 10⁵/well in RPMI 1640 culture medium (Gibco, Invitrogen Corporation, Grand Island, NY, USA) and supplemented with 10 U/mL penicillin (Gibco, Invitrogen Corporation, Grand Island, NY, USA), 5 μg/mL of Amphotericin B (Cristália L.T.D.A., Itapira, Brazil), 10 μg/mL streptomycin (Gibco, Invitrogen Corporation, Grand Island, NY, USA), 20 mM HEPES (Gibco, Invitrogen Corporation, Grand Island, NY, USA) and 10% fetal bovine serum (F.B.S.) (Thermo Fisher Scientific). T cells were submitted to a proliferation assay with the addition of 5 μg/mL of Concanavalin A (ConA) (Sigma Co, St Louis, MO, USA) in the cell cultures, as described previously [10]. To establish the IC50 inhibitory concentrations of P. alata extract and from polyphenols, different concentrations were established for P. alata (100, 300, 400 and 500 μg/mL) and polyphenols: isoorientin (Sigma) (25, 40, 80 and 100 μM), vitexin (Sigma) (50, 100, 200 and 300 μM), catechin (Sigma Co, St Louis, MO, USA) (10, 75, 100 and 500 μM) and rutin (Sigma) (100, 200, 300 and 500 μM). The treated lymphocytes and the control groups were incubated for 96 h at 37 °C in a humidified incubator in a 5% CO2 atmosphere (Lab Line Instruments Inc., Melrose Park, IL, USA). The effects of IC50 doses of P. alata extract and polyphenols were analyzed by CD4 and CD8 T cell subset proliferation assays. After washing procedures, the cells, previously stained with fluorochrome-conjugated monoclonal antibodies, were fixed with PBS 1% formaldehyde (Merck KGaA, Darmstadt, Germany) for acquisition in the flow cytometer as described below. The proliferating CFSElow cells in the histograms presented in Figure S1 show the results as the frequency of proliferating cells.
2.4. Lymphocyte Mixed Cultures with Mouse Pancreatic Beta-Cell Line (MIN6) Cells
The mouse insulinoma cells (MIN-6) [33,34] at passages 22–30 were used as a source of pancreatic β cell antigens as described in previous work [30]. This cell lineage was kindly provided by Prof. Dr Antonio Carlos Boschero from the Department of Anatomy, Cell Biology, Physiology and Biophysics of the Biology Institute of Unicamp and maintained in a humidified incubator at a 5% CO2 atmosphere (Lab Line Instruments Inc, Dubuque, Iowa, USA) in a high-glucose D.M.E.M. culture medium (Gibco, Invitrogen Corporation, Grand Island, NY, USA) supplemented with 10% F.B.S., 200 U/mL of penicillin (Gibco), 200 μg/mL of streptomycin (Gibco, Invitrogen Corporation, Grand Island, NY, USA) and 5 μg/mL of amphotericin B (Cristália L.T.D.A., Itapira, Brazil). The medium was changed every 48 h, and the monolayers were passaged and used for experiments when 70% confluent.
MIN6 cells were transferred to 24-well culture plates at 8 × 10⁴/well and maintained for 18 h in D.M.E.N. at a final concentration of 100 mM glucose supplemented with 10% F.B.S. After that, 2.5 × 10⁵/well lymphocytes were obtained as described previously and were added to an RPMI 1640 medium at a final concentration of 11 mM glucose (stressing MIN6, the source of antigens to the culture medium) supplemented with 10% F.B.S. and 10 ng/mL of mouse recombinant (mr) IL-2 (PeproTech, Rocky Hill, NJ, USA) in each well. The mixed cultures were divided into the following groups: Untreated control group (C neg/control)—corresponds to a mixed culture of lymphocytes and MIN6 cells without any treatment; Treated group—corresponds to a mixed culture of lymphocytes and stressed MIN6 cells treated with the IC50 concentration of P. alata extract. After adding the lymphocytes and stimuli, the mixed cultures were incubated in a 5% CO2 atmosphere in a humidified incubator for 96 h. (30)
2.5. Cell Cycle Analysis
Enriched T lymphocyte cultures stimulated with ConA and treated with the IC50 dose of P. alata extract and polyphenols for 96 h were used to evaluate the frequency of cells in the G0/G1, S and G2/M phases of the cell cycle. To this end, a Guava® Cell Cycle Reagent Kit (MerkMillipore, Burlington, MA, USA) was used to measure the D.N.A. content by propidium iodide (P.I.) staining in flow cytometry assays according to the manufacturer’s instructions. Briefly, cells were washed with 0.1 M PBS (pH 7.4), seeded at 2 × 10⁵ cells per well in 96-round-bottom-well plates (Techno Plastic Products, Zellkultur, Trazadingen, Switzerland), centrifuged at 400× g for 5 min, washed with PBS again, centrifuged and fixed with ice-cold 70% ethanol for 12 h at 4 °C. After this period, the cells were incubated with 200 μL of Guava® Cell Cycle Reagent (MerkMillipore, Burlington, MA, USA) for 30 min at room temperature in the dark. The acquired samples were analyzed in flow cytometry, as detailed below. Figure S2 presents the representative histograms of cell cycle analysis showing P.I. fluorescence intensity and the markers that defined G0/G1, S and G2/M cell cycle phases.
2.6. Cell Death Assay
Enriched T lymphocyte cultures stimulated with ConA and treated with the IC50 dose of P. alata extract and polyphenols for 96 h were used to evaluate the frequency of cell death by apoptosis/necrosis. After culturing, the lymphocytes were washed with PBS 0.1 M (pH 7.4), centrifuged at 400× g for 5 min and stained with anti-CD4 and CD8 fluorochrome-conjugated monoclonal antibodies as described below. The cells were then washed with PBS 0.1 M (pH 7.4), centrifuged at 400× g for 5 min and stained with annexin-V and 7-Amino Actinomycin D (7-AAD) using an F.I.T.C. Annexin V apoptosis detection Kit with 7-AAD (Biolegend, San Diego, CA, USA) at the concentrations and with the procedures recommended by the manufacturer. Finally, 400 µL of Annexin V binding buffer was added to each tube, which was analyzed immediately via flow cytometry. We express the results as the percentages of viable, early apoptotic and late apoptotic/necrotic T cells. Figure S3 shows the representative dot plots demonstrating the quadrants that define the cell viability subsets.
2.7. Lipid Peroxidation Assays
Lipid peroxidation was evaluated in the MIN-6/T lymphocyte mixed cultures, treated or not treated with the P. alata IC50 dose, using Alexa Fluor™ 488 fluorescent probe linked to alkyne-modified linoleic acid. This compound suffers lipid peroxidation using copper-catalyzed click chemistry. To this was added, at the beginning of the culture period, the Click-iT® Linoleamide Alkyne reagent (L.A.A.) (Thermo Fisher Scientific, Waltham MA, USA) at a concentration of 50 μM. After 96 h, the cells were washed with PBS and centrifuged for 5 min at 400× g. We used cell cumene hydroperoxide for positive control at 600 μM for 2 h at room temperature and protected from light. After washing with PBS, the cells were fixed, permeabilized and incubated with a reaction cocktail containing Alexa Fluor® 488 azide (Thermo Fisher Scientific, Waltham MA, USA) for 30 min at room temperature and protected from light according to the manufacturer’s instructions. The washed samples were submitted for flow cytometry, and the results are expressed as the median of the fluorescence intensity of the Alexa Fluor™ 488 probe (Figure S4).
2.8. Nitrogen Reactive Species Detection
The viable CD4 and CD8 T cell subsets that present R.N.S. in the MIN-6/T lymphocyte mixed cultures, treated or not treated with P. alata IC50 dose, were assessed by flow cytometry using the fluorescent probe 4-amino-5-methylamino-2′, 7′-dichlorofluorescein diacetate (D.A.F.) (Thermo Fisher Scientific, Waltham MA, USA). After culturing, the cells were washed with PBS 0.1 M (pH 7.4), centrifuged at 400× g for 5 min and stained with anti-CD4 and CD8 fluorochrome-conjugated monoclonal antibodies as described below. After that, cells were labelled with 5 μM of D.A.F. for 40 min at 37 °C and protected from light. After washing procedures, the cells were fixed with PBS 1% formaldehyde. For positive control, mixed culture cells were incubated with sodium nitroprusside (SNP) (Sigma-Aldrich, St. Louis, MO, USA) at 0.2 μM for 30 min at 37 °C. The samples were analyzed via flow cytometry as described below. The results are expressed as the frequency of DAF+ cells in the CD4 and CD8 T cell subsets. Figure S5 presents the representative dot plots showing the quadrants used to define DAF+ cells in CD4 and CD8 T cell subsets.
2.9. Mitochondrial Depolarization Detection Assay
The mitochondrial membrane potential assay can be used to evaluate cell function and health; thus, cationic carbocyanine dye (JC-1) staining cells were used [35]. Thus, ConA-stimulated T lymphocytes exposed to IC50 doses of P. alata extract and polyphenols were washed with PBS 0.1 M (pH 7.4). After centrifuging at 300× g for 5 min at room temperature, the cells were labelled with 1 µg of JC-1 dye (Santa Cruz Biotechnology, Dallas, TX, USA), diluted in 100 µL of PBS and incubated at 37 °C for 30 min. The cells were then washed with PBS, centrifuged for 5 min at 300× g and analyzed immediately by flow cytometry. T cells were submitted to valinomycin (Cayman Chemical, Ann Arbor, MI, USA) as a positive assay control at 100 µM. The results are expressed as the percentage of depolarized (green fluorescent) and polarized (orange–red fluorescent) T lymphocyte mitochondrial membrane potential.
2.10. Oxigen Reactive Species Detection
Detection of the CD4 and CD8 T cell subsets that presented oxidative stress (ROS+), or mitochondrial superoxide activity (MitoSOX+) in live cells was by flow cytometry using the fluorescent probes CellROX® green and MitoSOX™ red (Thermo Fisher Scientific, Waltham, MA, USA), respectively. ConA-stimulated T lymphocytes, after culturing with the IC50 doses of P. alata extract and polyphenols, were washed with PBS 0.1 M (pH 7.4), centrifuged for 5 min at 300× g and first stained with fluorochrome-conjugated antibodies as described below. The cells were then washed with PBS, centrifuged for 5 min at 300× g and stained with 5 µM CellROX® green or MitoSOX™ red in 100 µL of PBS for 30 min at 36 °C in the dark. Immediately after staining, they were analyzed via flow cytometer. The results are expressed as the percentage of CD4 or CD8 subsets positive to R.O.S. or MitoSOX probes.
2.11. Flow Cytometry
To phenotype the CD4 and CD8 T cell subsets in the proliferation, cell death and reactive oxygen species-detection assays, the cell samples were stained with 0.25 μg/105 cells with PerCP conjugated anti-mouse CD4 and CD8 monoclonal antibodies (Biolegend, San Diego, CA, USA) according to manufacturer’s recommendations. The acquisition of samples was performed on a Guava easyCyte flow cytometer (MerkMillipore, Burlington, MA, USA), and the data were analyzed using InCyte Software (MerkMillipore, Burlington, MA, USA) and the Guava cell cycle software package version 3.1.1 (Millipore) for cycle cells.
In the R.N.S. detection experiments, cells were labelled with anti-CD4 PerCP-Cy5.5 (Biolegend, San Diego, CA, USA) and anti-CD8 P.E. monoclonal antibodies (B.D. Biosciences, San Jose, CA, USA) at a concentration of 0.25 μg/2.5 × 105 cells according to manufacturer’s recommendations. The viable population assessed by previous labelling with the Zombie NIR ™ viability probe (Biolegend, San Diego, CA, USA) was submitted to a FACSVerse™ flow cytometer (B.D. Biosciences, San Jose, CA, USA), followed by analysis on F.C.S. Express v6 software (De Novo Software, Glendale, CA, USA).
2.12. Statistical Analyses
Absolute IC50 was calculated using non-linear regression fit modelling in dose–response curves performed in the statistical package from GraphPad® Prism v6 (La Jolla, CA, USA). We used one-way ANOVA Dunn’s multiple comparisons and two-way ANOVA Dunnett’s multiple comparisons for grouped analysis for statistical data analysis. The results are expressed by mean ± standard error and p < 0.05.
3. Results
3.1. IC50 Concentrations of P. alata Extract and Polyphenols
According to our previous study [10], the extract of P. alata reduced the proliferation of activated T cells in a dose-dependent manner. Using dose–response curves in T cell proliferation assays, we show in Figure 1 that P. alata (a) and the polyphenols: isoorientin (b), vitexin (c), catechin (d) and rutin (e) present in P. alata leaves reduced ConA-activated T cell proliferation. To optimize the experimental procedures, we established for subsequent analyses the concentrations closest to the absolute IC50 for P. alata and polyphenols: P. alata, 500 µg/mL; isoorientin, 40 µM; vitexin, 200 µM; catechin, 75 µM; and rutin, 300 µM.
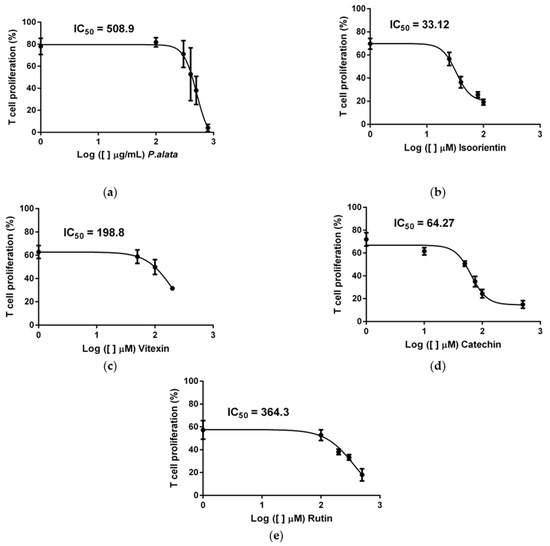
Figure 1.
Effect of P. alata extract and polyphenols in Concanavalin A (ConA) proliferation-stimulated T lymphocytes. The dose–response curves of P. alata extract (a) and polyphenols: isoorientin (b), vitexin (c), catechin (d) and rutin (e) represent the IC50 of each respective compound calculated by non-linear regression fit modelling as described in the Material and Methods Section; n = 6 with triplicate cell assays.
3.2. Cell Cycle Modulation of Lymphocytes at the IC50 of P. alata Aqueous Extract and Polyphenols
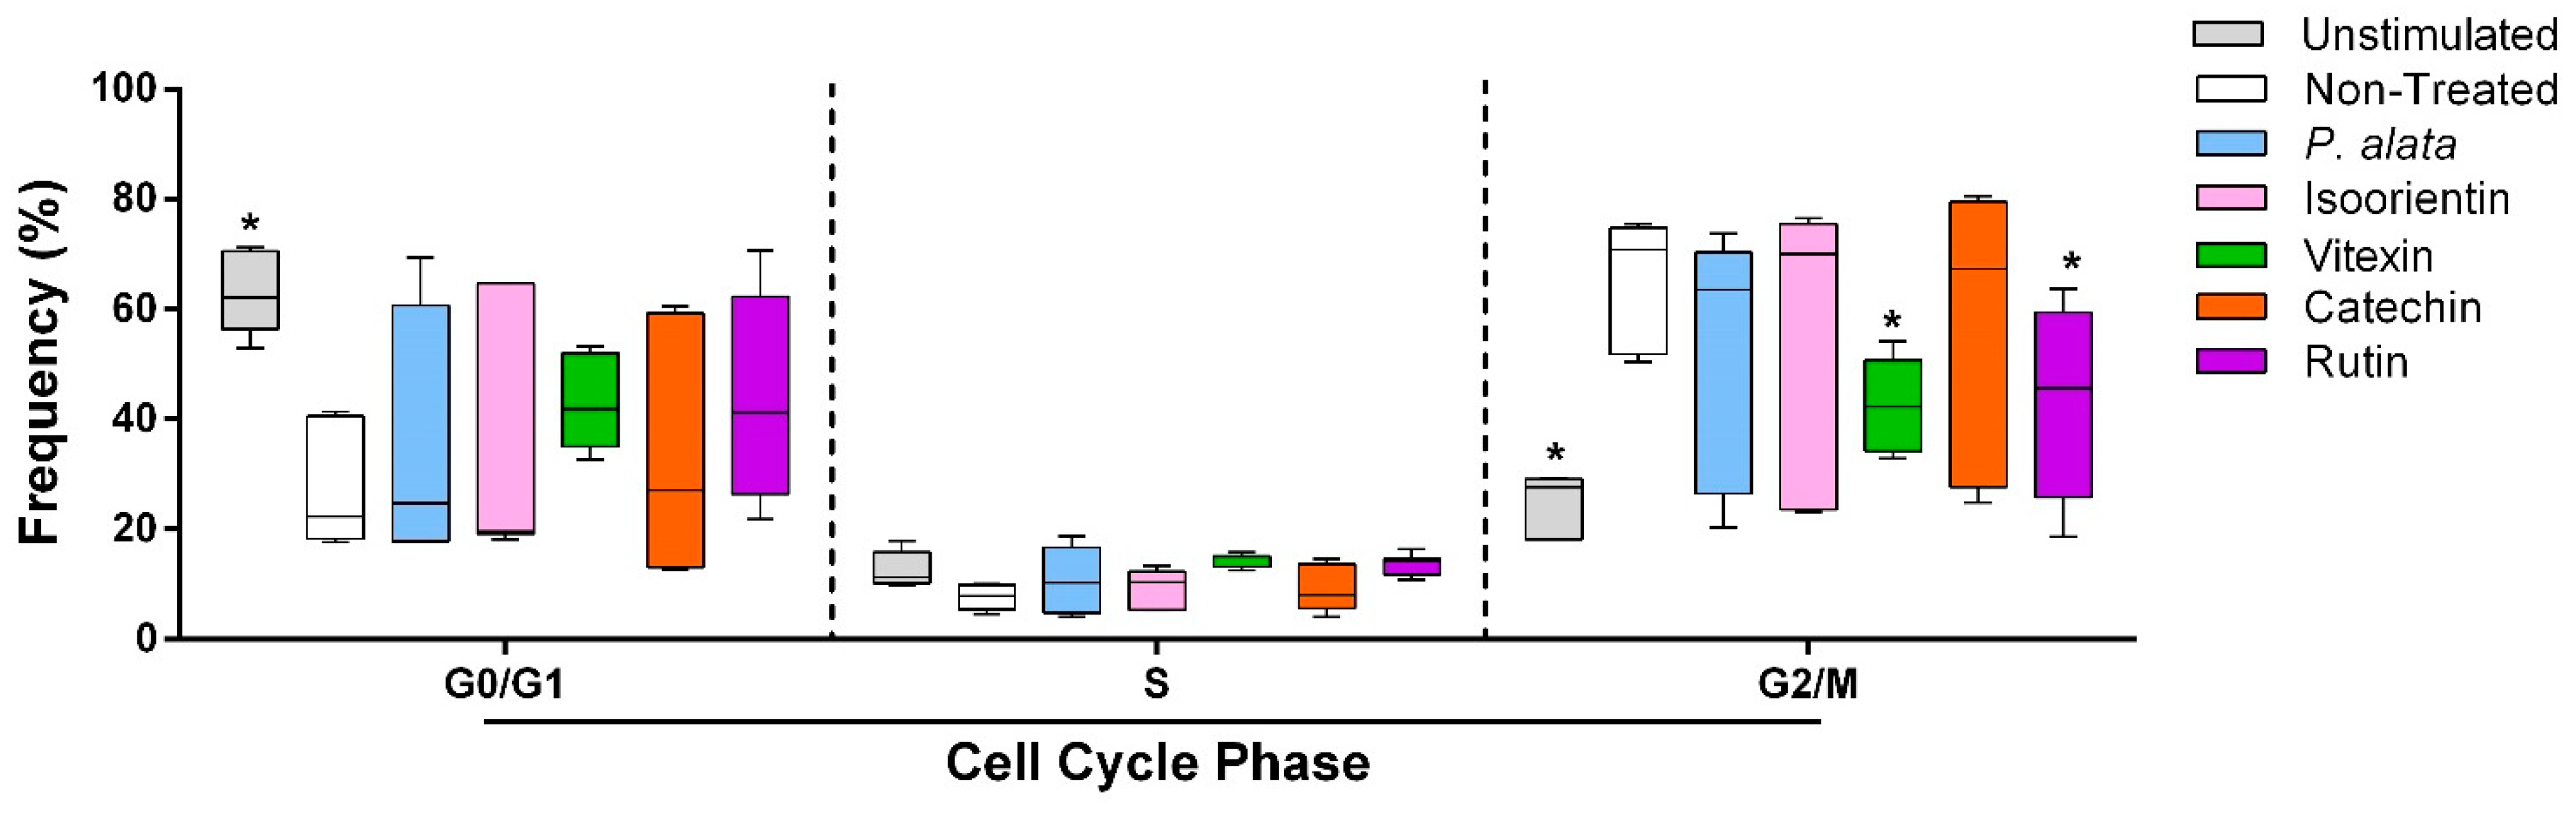
The effects of P. alata and the polyphenols studied at their IC50 were investigated for cell cycle modulation by evaluating the frequency of lymphocytes in different cell cycle phases (G0/G1, S and G2/M). Cells treated with vitexin (42.3 ± 3%; p = 0.0261) and rutin (42.3 ± 6.3%; p = 0.0256) decreased the proportion of lymphocytes in G2/M compared to the non-treated group (65.8 ± 4.7%), with a tendency towards an increase in cells in the G0/G1 phase after these treatments (Figure 2).
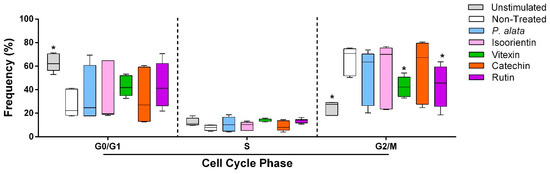
Figure 2.
Effect of P. alata extract and polyphenols in the cell cycle of Concanavalin A (ConA)-stimulated T lymphocytes. The boxplots in panel represent the frequency of T cells in the G0/G1, S and G2/M phases of the cell cycle assay in the cell cultures stimulated with ConA and in the presence of IC50 concentrations of P. alata (blue) and polyphenols: isoorientin (pink), vitexin (green), catechin (orange) and rutin (purple). Gray boxplots represent T cells not stimulated with ConA, and white boxplots are the non-treated cells stimulated with ConA: * p < 0.05; n = 6 with triplicate cell assays.
3.3. Effect of Aqueous Leaf Extract of P. alata and Polyphenols on CD4+ and CD8+ T Lymphocyte Proliferation
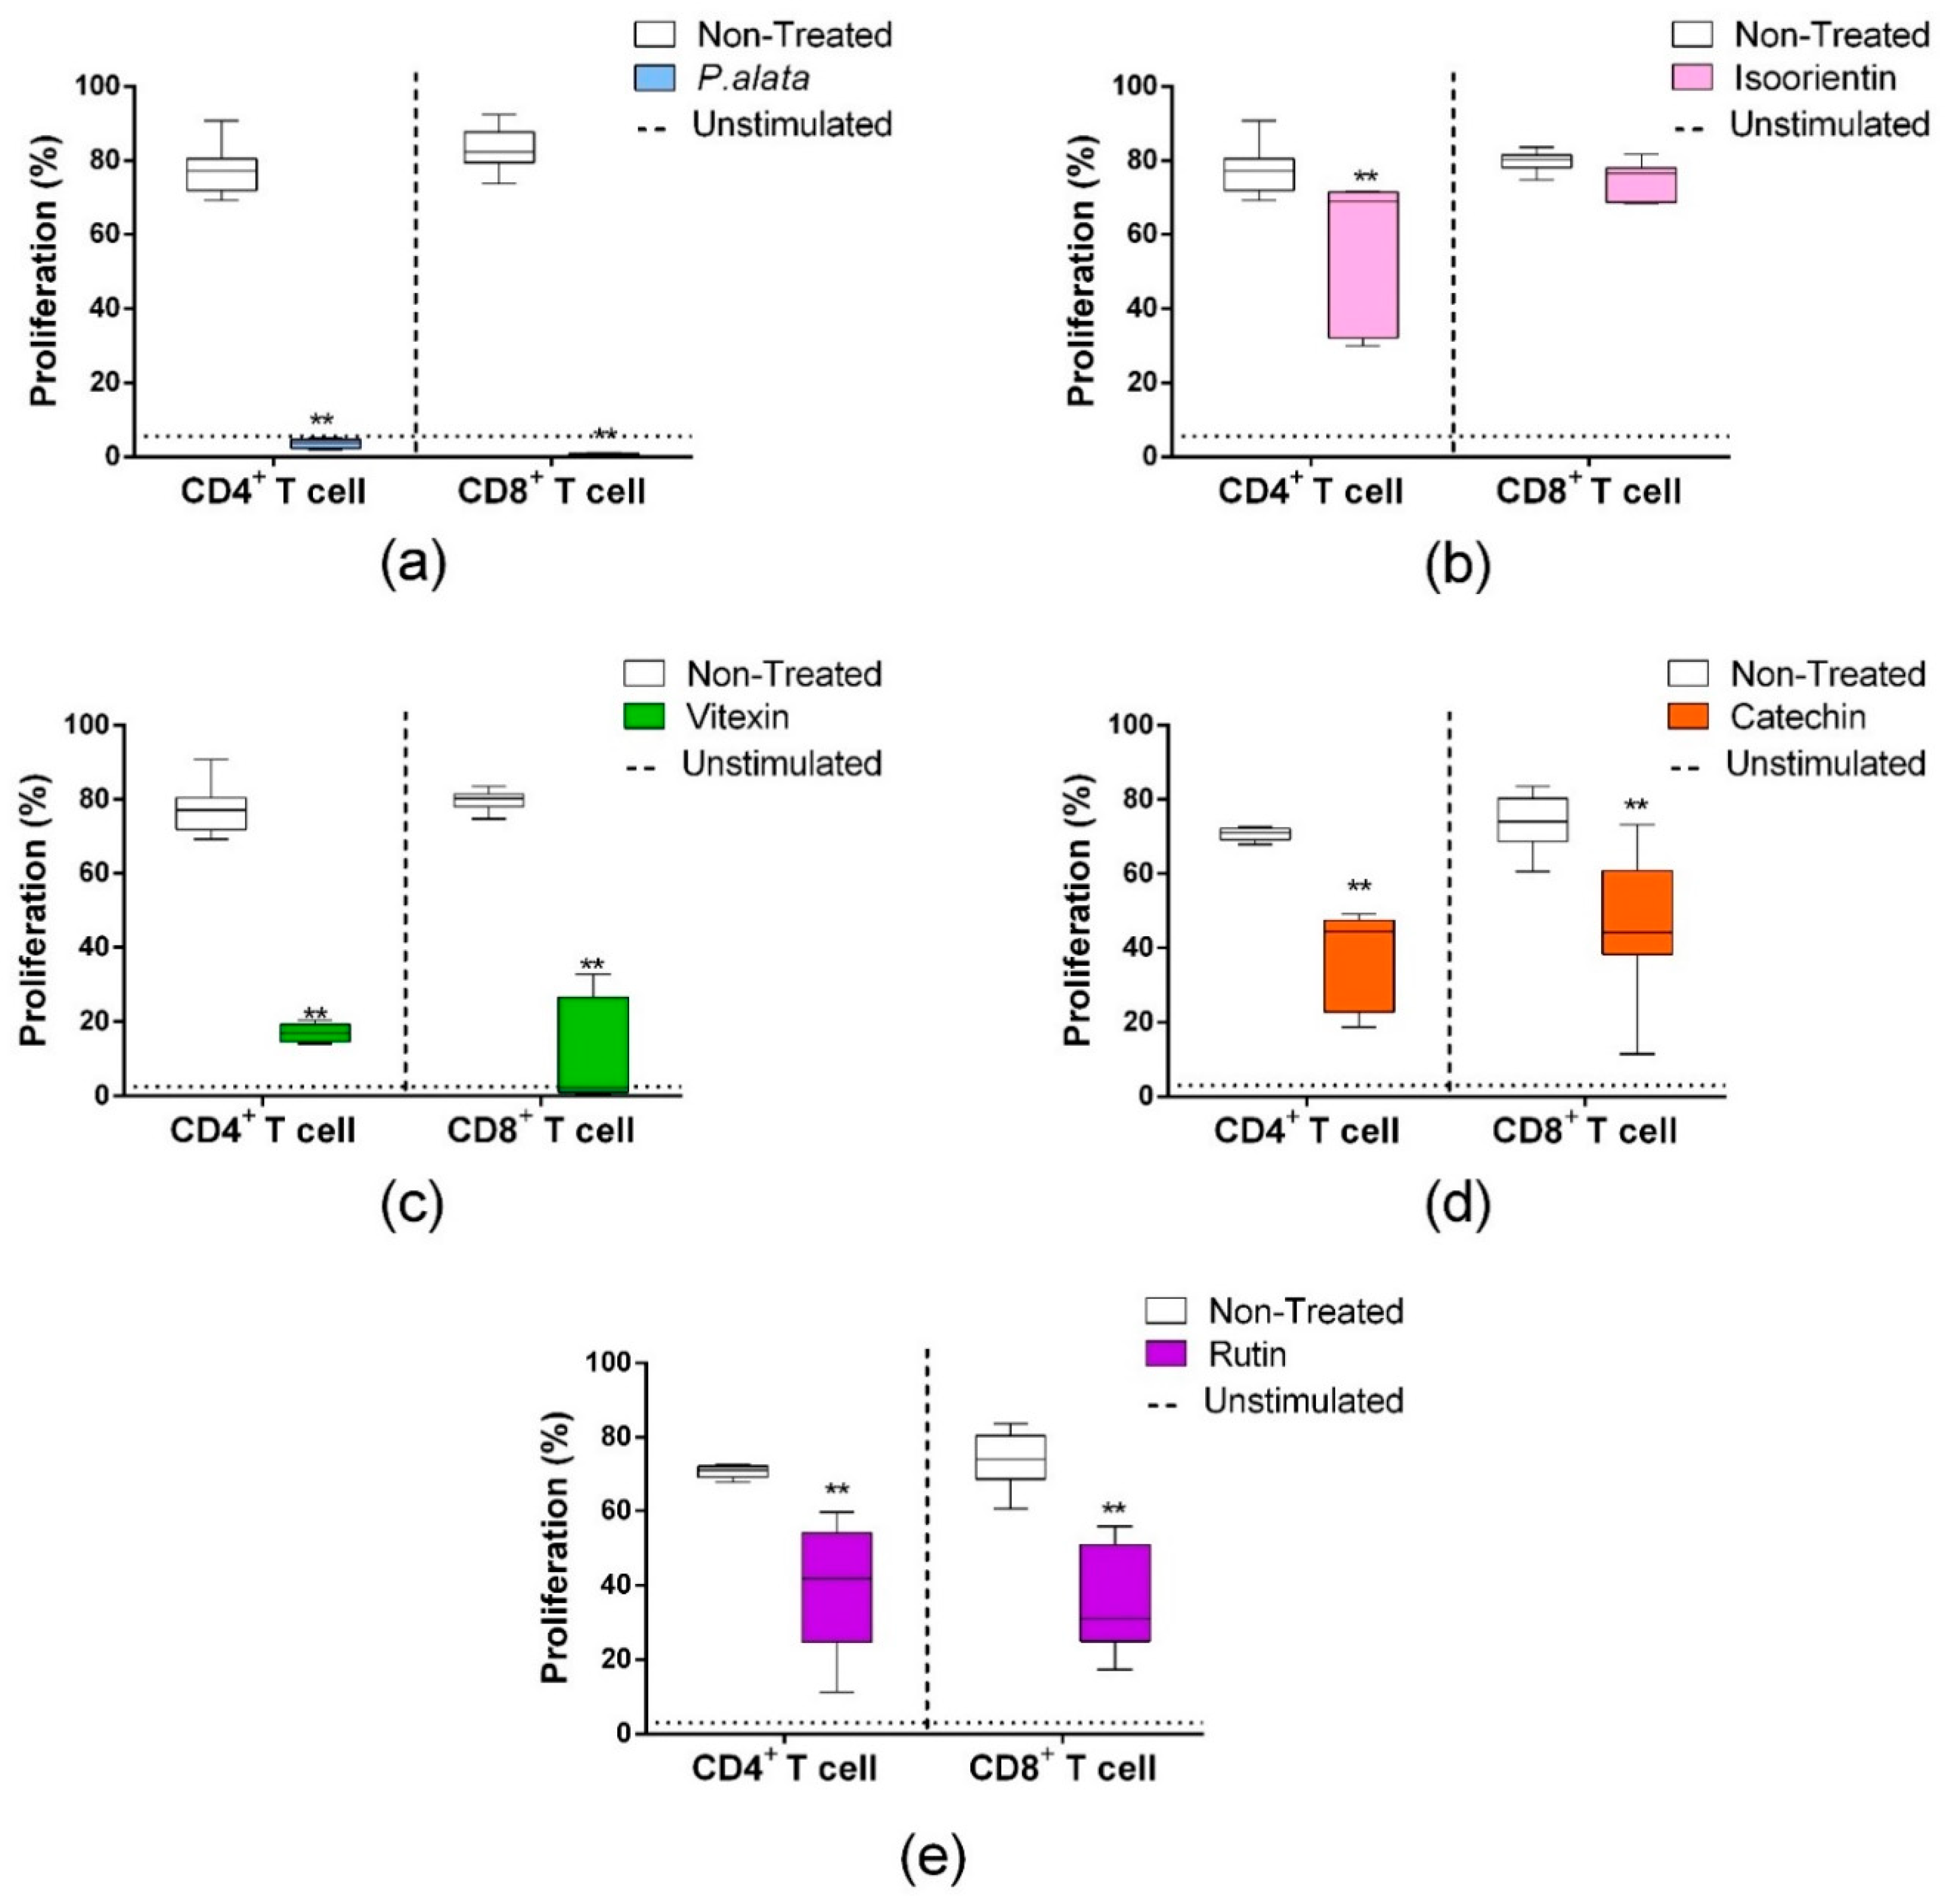
CD4+ T lymphocytes (Figure 3, left boxplots) treated with IC50 P. alata (a), isoorientin (b), vitexin (c), catechin (d) and rutin (e) showed reduced proliferations of 3.54 ± 0.34%, 57.07 ± 6.4%, 16.95 ± 1.11%, 37.9 ± 4.2% and 40.14 ± 4.5%, respectively, compared to the non-treated group (77.17 ± 6.29) (p < 0.0001 for all comparisons). Similar results in the CD8 subset (Figure 3, right boxplots) were found for the treatments with P. alata (0.56 ± 0.11%), vitexin (c) (11.11 ± 4.49%), catechin (d) (44.9 ± 5.1%) and rutin (e) (36.9 ± 3.6%) in comparison to the control group (83.01 ± 6.14) (p < 0.0001 for all comparisons). The only exception found was isoorientin (b), which presented no differences in cell proliferation compared to the non-treated group.
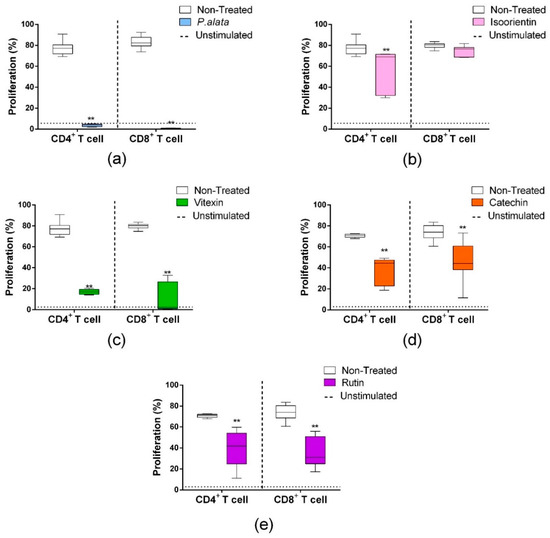
Figure 3.
Effects of P. alata extract and polyphenols in the proliferation of CD4+ and CD8+ lymphocyte subsets. The boxplots represent the frequency of CD4+ (left) and CD8+ (right) proliferating T cells (CFSElow population) treated (colored) or non-treated (white) with IC50 of P. alata extract (a) and polyphenols: isoorientin (b), vitexin (c), catechin (d) and rutin (e). Dotted lines represent the frequency of proliferating cells of non-stimulated lymphocytes: ** p < 0.0001, compared to the non-treated group; n = 6 with triplicate cell assays.
3.4. Effects of P. alata Aqueous Extract and Polyphenols on the Viability of CD4 and CD8 T Cells
ConA-activated CD4+ lymphocytes (Figure 4a) treated with IC50 of P. alata, isoorientin, vitexin, catechin, and rutin presented a significant decrease in cell viability (left boxplots) and increases in the proportion of lymphocytes in late apoptosis/necrosis (right boxplots). IC50 treatments increased the percentages of CD4+ cells in late apoptosis/necrosis, where values were: P. alata, 77.5 ± 0.7%; vitexin, 83 ± 3.3%; isoorientin, 83.8 ±1.4%; catechin, 83 ± 1.9%; and rutin, 74.9 ± 3.2%, while the control presented 53.6 ± 3.1 (p < 0.0001 for all comparisons). Concerning early apoptotic events, only the cultures treated with P. alata extract (18.25 ± 1.41%) present a difference (p < 0.0008) in comparison with the non-treated group (6.25 ± 1.32). P. alata extract and polyphenols had a similar effect on CD8+ T cells, decreasing the cell viability and increasing late apoptosis/necrosis. The percentages of late apoptotic/necrotic cells were: P. alata, 79.7 ± 1.1%; vitexin, 81 ± 1.2%; isoorientin, 77.5 ± 2.7%; catechin, 77 ± 0.5%; and rutin, 75.1 ± 1.9% and are statistically significant (p < 0.0001) in comparison with the non-treated group (54 ± 2.6%).
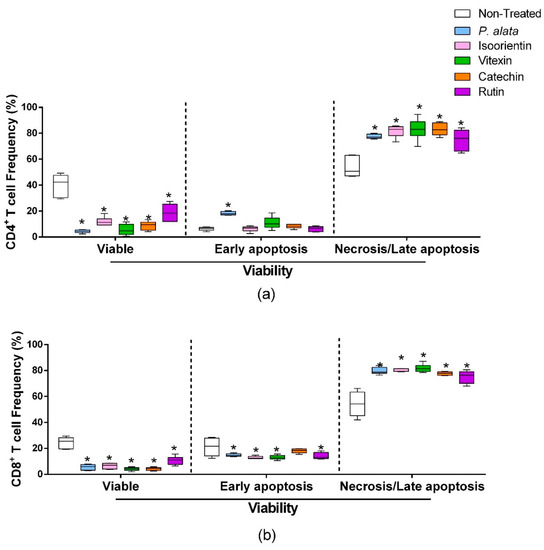
Figure 4.
Effect of P. alata extract and polyphenols on viability and mitochondrial membrane potential. The boxplots represent the frequency of viable (left), early apoptosis (middle) and necrosis or late apoptosis (right) of CD4+ (a) and CD8+ (b) T cells stimulated with ConA and cultured in the presence of IC50 doses of P. alata extract, isoorientin, vitexin, catechin and rutin (colored boxplot). The cultures were treated with PBS only (non-treated, white boxplot) as a control: * p ≤ 0.05 compared to the non-treated group; n = 6 with triplicate cell assays.
3.5. Effects of P. alata Extract on Membrane Lipid Peroxidation and Nitrogen Reactive Species (R.N.S.) Production in T Cells Co-Cultured with Pancreatic Beta-Cell Lineage (MIN-6)
In the mixed culture of MIN6 cells and T cells, the total T lymphocyte population labelled by the Click-iT® Linoleamide Alkyne (L.A.A.) kit using copper-catalyzed click chemistry linked to detect, after conjugation with Alexa fluor 488 fluorescent probes, alkyne-modified linoleic acid that suffered lipid peroxidation. In the IC50 P. alata-treated group, there was a significant increase (p = 0.01315) in the fluorescence intensity of Alexa fluor 488 (46.41 ± 3.08%), indicating an increase in lipid peroxidation in this group compared to the untreated control group (33.57 ± 1.99%) (Figure 5a). In agreement with this, there was a significant rise of R.N.S. (p < 0.0001) in CD4+ (71.77 ± 4.24%—DAF+ cells) and CD8+ (41.19 ± 4.49%—DAF+ cells) T cell subsets treated with an IC50 dose of P. alata extract in comparison with the non-treated group (19.10 ± 4.09% and 3.13 ± 0.53%, respectively) (Figure 5b,c).
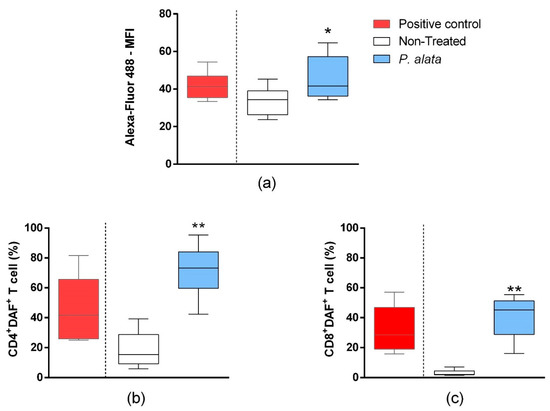
Figure 5.
Effect of P. alata extracts on membrane lipid peroxidation and nitrogen reactive species production in T cells co-cultured with pancreatic beta-cell lineage (MIN-6). The boxplots (a) represent the median fluorescence intensity (M.F.I) of Alexa Fluor™ 488 fluorescent probe linked to alkyne-modified linoleic acid, which suffered lipid peroxidation using copper-catalyzed click chemistry (Click-iT Lipid peroxidation Imaging Kit—Thermo Scientific) in T cells treated (grey boxplots) or non-treated (white boxplots) with IC50 doses of P. alata extract. As a positive control of the assay, the culture was stimulated with the oxidizing agent cumene hydroperoxide at a concentration of 600 mM (black boxplots). The boxplots in panels (b,c) represent, respectively, the frequency (%) of CD4+ and CD8+ T cells presenting the 4-amino-5-methylamino-2′,7′-dichlorofluorescein diacetate probe (DAF+), which specifically detects nitric oxide inside the cells. Thus, as a positive assay control, the culture was submitted to nitric oxide donor sodium nitroprusside (SNP) at 0.2 mM (black): * p < 0.05; ** p < 0.0001; n = 6 with triplicate cell assays.
3.6. Effect of P. alata Extract and Polyphenols in Mitochondrial Polarization of T Cells and Oxidative Stress in CD4+ and CD8+ T Cells Subsets
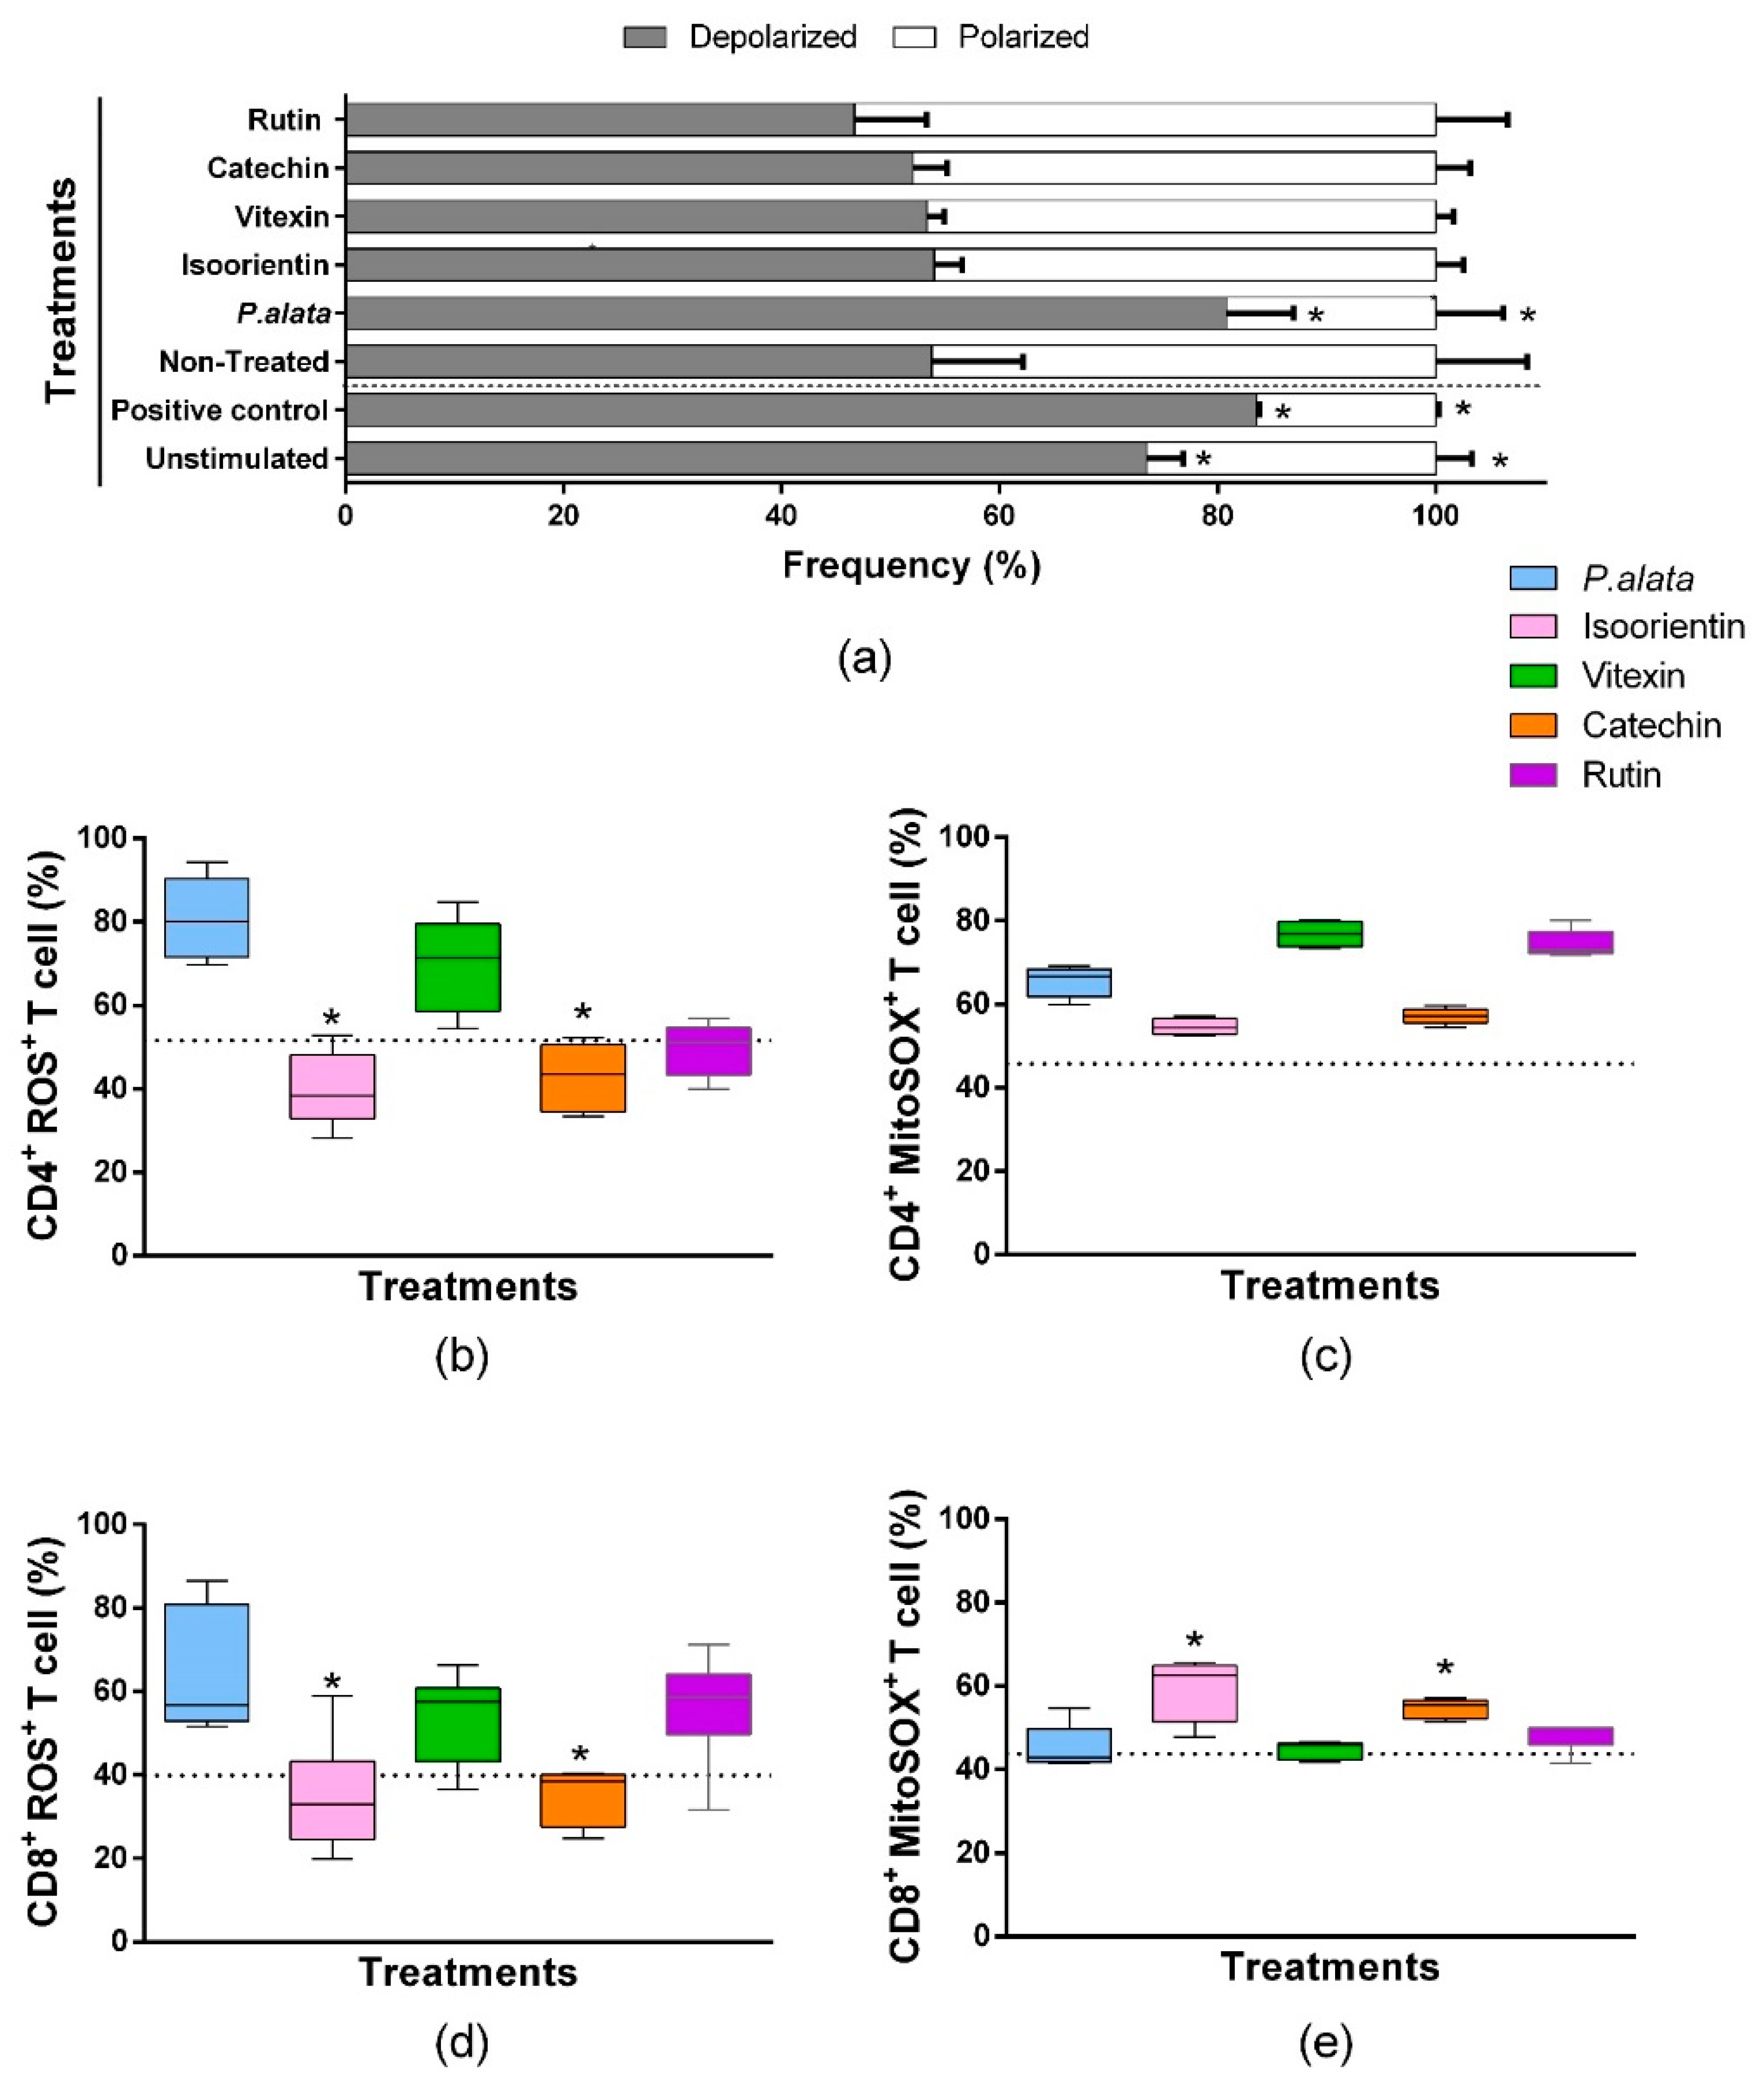
We assessed mitochondrial depolarization to evaluate cell death using a JC-1 fluorescent probe [35]. ConA-stimulated T lymphocytes treated with IC50 of P. alata presented mitochondrial depolarization in 80.7 ± 6.13% of the cells, significantly higher (p = 0.001) than the non-treated group (53.80 ± 8.35). The valinomycin-treated cultures (83.53 ± 0.275%) and non-stimulated cultures (73.49 ± 3.29%) show a significant increase (p = 0.0084) in the polarized population as well. However, the cell cultures treated with polyphenols presented no differences in mitochondrial depolarization values compared with the non-treated group. (Figure 6a).

Figure 6.
Oxidative stress analysis of CD4+ and CD8+ T lymphocyte subsets and mitochondrial depolarization in T cells stimulated with ConA and treated with IC50 doses of P. alata extract and polyphenols. The bars shown in panel graphic (a) represent the mean ± S.E.M. percentage of polarized (white bars) and depolarized (grey bars) mitochondrial membrane of cells treated with IC50 of P. alata extract, isoorientin, vitexin, catechin and rutin. Valinomycin at 100 µM was used as a positive control of mitochondrial depolarization. The non-treated cells were stimulated with 5 µg/mL of ConA, and T cells without proliferation stimulus or treatment (non-stimulated) are represented in the first pair of bars. The boxplots in panels (b,d) represent, respectively, the frequency (%) of CD4+ and CD8+ T cells presenting reactive oxygen species inside the cells generated exclusively by mitochondrial superoxide and detected with the MitoSOX™ fluorescent probe (MitoSOX+). The boxplots in panels (c,e) represent, respectively, the frequency (%) of CD4+ and CD8+ T cells presenting reactive oxygen species inside the cells detected with the CellROX™ fluorescent probe (ROS+). The cell cultures were stimulated with ConA and treated with IC50 doses of P. alata extract, isoorientin, vitexin, catechin and rutin (coloured boxplots). The results of non-treated cultures are represented as dotted lines in the graphs: * p < 0.05 compared to P. alata-treated group; group n = 6 with triplicate cell assays.
A comparison of the effects of IC50 polyphenol treatments and P. alata extract treatment on oxygen reactive species (R.O.S.) production was assessed by the fluorescent probe CellROX® green in flow cytometry assays. As demonstrated in Figure 6b, CD4+ lymphocytes treated with an IC50 dose of isoorientin and catechin presented lower values (40.04 ± 9.05% and 42.9 ± 8.31%, p = 0.0024 and p = 0.0032, respectively) in the frequency of ROS+ cells compared to P. alata-treated group (80.79 ± 9.93%). Similar results were observed for CD8+ lymphocytes compared to CD4+ lymphocytes (Figure 6d), where isoorientin (34.84 ± 13.54%; p = 0.0222) and catechin (35.09 ± 6.75%; p = 0.0281) showed a lower frequency of ROS+ cells in comparison with P. alata-treated group (63.97 ± 15.0%).
Mitochondrial superoxide is the principal reactive oxygen species that lead to oxidative stress and cell death. A Comparison of the effects among IC50 polyphenol treatments and P. alata extract treatment in superoxide (SOX) production was assessed by the fluorescent probe MitoSOX in flow cytometry assays. There were no differences in the frequency of CD4+ lymphocytes producing superoxide when comparing polyphenol-treated cultures with P. alata. However, P. alata (65.52 ± 3.61%; p = 0.041), vitexin (76.79 ± 2.90%; p < 0.001) and rutin (74.47 ± 3.26%; p = 0.0007) had higher superoxide production, which was significantly different from non-treated cells (45.67 ± 0.97%). Compared to the other treatments, P. alata, vitexin and rutin promoted higher concentrations of superoxide in CD4+ lymphocytes. CD8+ lymphocytes treated with isoorientin (59.38 ± 7.32%; p = 0.117) and catechin (54.74 ± 2.14%; p = 0.0246) showed higher expression of mitochondrial superoxide compared to treatment with P. alata (45.37 ± 5.19%).
4. Discussion
The hallmark of type 1 diabetes in NOD mice is the destruction of beta cells in the pancreatic islets by the immune system (mainly by T lymphocytes). This mechanism plays a crucial role in the insulitis process [36,37]. Thus, downregulation of T lymphocyte activation could be an excellent strategy to decrease inflammation, preserving beta-cell integrity [38,39].
In recent years, medicinal products from plants have been intensely investigated, mainly for their antioxidant and antiproliferative activities [40,41]. These plant properties may aid in treating inflammatory diseases such as diabetes mellitus and reducing oxidative stress, as demonstrated by the treatment of NOD mice with aqueous leaf extract from P. alata [9].
In the present study, the chosen IC50 inhibits 50% of lymphocyte proliferation. This process is the standard definition of a specific dose, as observed in some studies ([42] and [43]). Thus, we used this concentration to investigate: cell cycle, mitochondrial depolarization, oxygen and nitrogen reactive species, and mitochondrial superoxide enzyme activity.
Here, we show the dose-dependent effects of P. alata and polyphenols on T lymphocyte proliferation (Figure 1). Moreover, the efficiency of IC50 doses in inhibiting CD4+ and CD8+ lymphocyte subset proliferation (Figure 3) corroborates our previously published work, showing that treatment with aqueous leaf extract of P. alata inhibits lymphocyte proliferation [10]. The antiproliferative effect of P. alata leaves may be associated with effects due to the polyphenols present in the aqueous extract, such as isoorientin, vitexin, isovitexin, catechin, epicatechin and rutin, which may contribute to the anti-inflammatory effects in diabetic mice by decreasing inflammatory cells in the pancreatic islets [9,10].
In our previous work, the aqueous leaf extract of P. alata showed higher inhibition of T lymphocyte proliferation (BALB/c mice) than the treatments from another species of Passiflora [44]. The anti-inflammatory effects of P. alata leaves were also demonstrated by [45], showing reduced neutrophil and leukocyte migration after carrageenan-induced pleurisy in mice. Moreover, polyphenols found in P. alata leaves [9,10] have demonstrated in the literature anti-diabetic [46], antioxidant [47], anti-inflammatory [48] and antiproliferative effects [49].
Cell proliferation starts when cells enter the G1 phase, which allows the cell cycle to progress [50]. However, polyphenols can modulate the activity of some enzymes that induce T cell proliferation, such as tyrosine and serine-threonine protein kinases [51]. Our data show decreases in cells in G2/M after vitexin and rutin IC50 treatments and a trend towards an increased number of cells in G0/G1, suggesting modulation of these specific polyphenols on the cell cycle (Figure 2). Some polyphenols can affect the G1 phase, promoting arrest of the cell cycle. Epigallocatechin-3-gallate, a polyphenol belonging to the catechin family, induces G1 cell cycle arrest by downregulation of some cyclins, such as D and E, and the kinases CDK1, CDK2 and CDK4, and upregulation of p21 expression, a CDKI (cyclin-dependent kinase inhibitor) [52]. However, most studies considering the antiproliferative effects of polyphenols focus on cancer cells.
Studies demonstrate modulation of the cell cycle by the arrest of G2/M in cancer cells after treatment with vitexin [53] and rutin [54]. In addition, the IC50 of vitexin inhibits proliferation in cancer cell lineages such as mouse brain tumor (C6), human colon (HT29) and human cervical (HeLa) carcinomas [55]. The use of extract of Clinacanthus nutans, which has high concentrations of vitexin, suppressed the growth of A549 cells, a lung cancer line, demonstrating its chemopreventive action [56].
Our findings suggest that cell death mechanisms may affect the antiproliferative effect caused by P. alata and polyphenols in lymphocytes. The higher percentage of cells in late apoptosis/necrosis after treatment suggests that even with mitogen stimulus, the IC50 dose of P. alata and polyphenols can promote apoptosis in activated T lymphocytes (CD4+ and CD8+) (Figure 4). Indeed, both P. alata aqueous leaf extract and polyphenols induced a cell death mechanism in a dose-dependent manner (data not shown). Moreover, the antiproliferative effects of polyphenols in some cells may be due to apoptosis mediated by different pathways, such as cell membrane lipid peroxidation, mitochondrial depolarization, oxidative stress and production of mitochondrial superoxide.
Regarding lipid peroxidation in the lymphocyte cell membranes, our results showed in an in vitro cell co-culture model of the pancreatic beta-cell lineage (MIN-6) and NOD T lymphocytes that the IC50 dose of P. alata significantly increased this process in T cells (Figure 5a). Moreover, we found in both CD4+ and CD8+ lymphocyte subsets that treatment with the IC50 dose of P. alata induced a significant increase in nitric oxide in the active form in viable lymphocytes compared with control (Figure 5b,c). These data suggest a possible association between P. alata treatment and the induction of oxidative damage to CD4+ and CD8+ lymphocyte subsets, promoted by the increase in NO, and a consequent increase in lipid peroxidation. These facts present a plausible hypothesis since free radicals such as NO can inhibit or promote lipid peroxidation. As an inhibitor, NO acts by sequestering lipid radicals (peroxyl) and inhibiting enzymes initiating peroxidases. As an inducing agent, it promotes the formation of O.N.O.O., an important radical that initiates lipid peroxidation chain reactions [57].
Intrinsic apoptosis pathways may trigger mitochondrial depolarization due to the absence of growth factors and toxin-free radicals [58]. The polarized mitochondria are crucial for the transition as lymphocytes switch from quiescence to the proliferative state, and depolarization can occur due to the cytotoxic response, which leads to early apoptosis or necrosis [35] due to the membrane potential change (Δψ) [59].
Here we showed that after IC50 P. alata treatment there was a significant increase in mitochondrial depolarization (Figure 6a). Previous studies also demonstrated the effect of polyphenols in this pathway; Yuan, L. and coworkers [60] showed mitochondrial dysfunction induced in HepG2 cells (human liver cancer cell line) after isoorientin treatment. Moreover, studies with rutin also demonstrated apoptosis induction in proliferative cells [61]. At the same time, catechin obtained from Ligaria cuneifolia has antiproliferative properties, inducing apoptosis by mitochondrial depolarization and modulation of antiapoptotic proteins [6]. Mitochondrial depolarization can be activated by oxidants inducing R.O.S. (reactive oxygen species) overproduction and consequently initiating oxidative stress [62,63].
Concerning P. alata and polyphenols’ effect on R.O.S. generation in CD4 and CD8 lymphocytes, we observe differential behavior of the polyphenols when compared with P. alata extract. In both CD4 (Figure 6b) and CD8 (Figure 6d) subsets, isoorientin and catechin presented more reduced activation of R.O.S. production compared with P. alata treatment. Interestingly, in the CD8 subset (Figure 6e), we observed that these compounds induced higher mitochondrial superoxide activity when compared to the P. alata-treated group, which could indicate, beyond the differential properties of polyphenols, different action mechanisms of the same compound depending on the cell compartment. In this sense, other polyphenols in P. alata extract can contribute synergistically or by opposite effects, activating or inhibiting oxidative process, which could explain their dual role as pro- or antioxidant molecules depending on the circumstances and factors such as concentration and mechanism of interaction with other molecules [12,64].
Previous reports corroborating our findings have shown that treatment of mouse embryo fibroblast cells (M.E.F.) and mouse colon cancer cells (C-26) with the polyphenol quercetin causes necrotic death in cell cultures by a pro-oxidant effect due to generation of superoxide anion in the mitochondria [65]. In another study, epigallocatechin-3-gallate led to the production of mitochondrial R.O.S., preceded by the induction of both early–late apoptosis or a significant loss of mitochondrial membrane potential in human oral squamous cell carcinoma cells [66].
Therefore, our results suggest that P. alata extract and the phenolic compounds studied significantly affect lymphocytes. These effects include inhibiting proliferation, inducing pro-apoptotic pathways and modulating oxidative stress mechanisms such as R.O.S. and N.O.S. production, mitochondrial superoxide activity and cell membrane lipid peroxidation in CD4+ and CD8+ T cells. Previously, we showed that vitexin was the major component of aqueous leaf extract rather than isoorientin or isovitexin [9]. However, the effects observed by P. alata leaves may be related to several polyphenols exerting synergic/antagonist effects in regulatory pathways, as demonstrated by the differential behavior of the polyphenols investigated here.
Nevertheless, the chemical structure of most polyphenols contributes to their low bioavailability. Thus, because of poor absorption, they are retained in the intestine and gut barrier (a critical system for immunoregulation), affecting the intestinal microbiota [67]. We are finishing a manuscript concerning the effects of polyphenols on Tγδ intraepithelial lymphocytes and their properties in these cells. Therefore, polyphenols’ anti-inflammatory properties could mainly modulate the microbiota and the intraepithelial barrier cells [67,68].
Thus, these compounds must be studied more detail to understand and develop new drugs to treat chronic inflammatory diseases such as type 1 diabetes mellitus.
5. Conclusions
The aqueous leaf extract of Passiflora alata Curtis and its major polyphenols isoorientin, vitexin, catechin and rutin have antiproliferative properties that can contribute to the treatment of chronic inflammatory diseases. IC50 of P. alata extract and polyphenols, determined by lymphocyte proliferation analysis, can induce mitochondrial depolarization, thereby increasing oxidative stress by N.O.S., R.O.S. and mitochondrial superoxide, causing cell membrane lipid peroxidation and cell death in T lymphocytes. In addition, rutin and vitexin showed cell cycle modulation, demonstrating promising results for further investigating natural products that inhibit the upregulation of lymphocyte proliferation during the inflammatory process. These results suggest that aqueous leaf extract of P. alata and the polyphenols in these leaves could represent a target for translational research, showing the plant’s benefits for developing new drugs with immunomodulatory properties on inflammatory diseases such as diabetes mellitus.
Supplementary Materials
The following supporting information can be downloaded at: https://www.mdpi.com/article/10.3390/antiox11081503/s1. Datasheet S1: Original dataset sheets.
Author Contributions
Conducted most of the experiments, T.C.C., D.d.F. and P.d.M.d.S.; advised and led each stage of the research, R.d.L.Z. and L.G.R.F.; wrote the first draft of the manuscript, T.C.C., D.d.F. and P.d.M.d.S.; conducted the final revision of the manuscript, R.d.L.Z. and L.G.R.F. All authors have read and agreed to the published version of the manuscript.
Funding
T.C.C. was supported by an Improvement for Higher Education Personnel (Capes) doctorate fellowship (01P-3370-2017), and D.F. received support from The National Council for Scientific and Technological Development (CNPq) doctorate fellowship (141087-2014/5). This work was supported by F.A.P.E.S.P. (2013-25256-8), CNPq (010887/2014-8) and F.A.E.P.E.X. (Support to Teaching Research and Extension). R.L.Z. received a research fellowship from CNPq.
Institutional Review Board Statement
Animal procedures were carried out following the ‘Guide for the Care and Use of Laboratory Animals, as promoted by the Brazilian College of Animal Experimentation (C.O.B.E.A.), and were approved by the Ethics Committee for Animal Experimentation of the University of Campinas (CEUA/UNICAMP. Protocol #3225-1/3226-1).
Informed Consent Statement
Not applicable.
Data Availability Statement
Data is contained within the article and supplementary material.
Acknowledgments
Antonio Carlos Boschero from the Department of Anatomy, Cell Biology, Physiology and Biophysics from the Biology Institute of Unicamp kindly provided mouse insulinoma cells (MIN-6). The authors thank Patricia Janino for helping with animal care.
Conflicts of Interest
The authors declare no conflict of interest.
References
- Beer, D.; Joubert, E.; Gelderblom, W.C.A.; Manley, M. Phenolic Compounds: A Review of Their Possible Role as In Vivo Antioxidants of Wine. S. Afr. J. Enol. Vitic. 2002, 23, 48–61. [Google Scholar]
- Thitimuta, S.; Pithayanukul, P.; Nithitanakool, S.; Bavovada, R.; Leanpolchareanchai, J.; Saparpakorn, P. Camellia sinensis L. Extract and its potential beneficial effects in antioxidant, anti-inflammatory, anti-hepatotoxic, and anti-tyrosinase activities. Molecules 2017, 22, 401. [Google Scholar] [CrossRef] [PubMed]
- Zhang, H.; Tsao, R. Dietary polyphenols, oxidative stress and antioxidant and anti-inflammatory effects. Curr. Opin. Food Sci. 2016, 8, 33–42. [Google Scholar] [CrossRef]
- Middleton, E.; Kandaswami, C.; Theoharides, T.C. The effects of plant flavonoids on mammalian cells: Implications for inflammation, heart disease, and cancer. Pharmacol. Rev. 2000, 52, 673–751. [Google Scholar]
- Thangapazham, R.L.; Singh, A.K.; Sharma, A.; Warren, J.; Gaddipati, J.P.; Maheshwari, R.K. Green tea polyphenols and its constituent epigallocatechin gallate inhibits proliferation of human breast cancer cells in vitro and in vivo. Cancer Lett. 2007, 245, 232–241. [Google Scholar] [CrossRef]
- Papademetrio, D.L.; Trabucchi, A.; Cavaliere, V.; Ricco, R.; Costantino, S.; Wagner, M.L.; Álvarez, E. The catechin flavonoid reduces proliferation and induces apoptosis of murine lymphoma cells LB02 through modulation of antiapoptotic proteins. Rev. Bras. Farmacogn. 2013, 23, 455–463. [Google Scholar] [CrossRef]
- Qanungo, S.; Das, M.; Haldar, S.; Basu, A. Epigallocatechin-3-gallate induces mitochondrial membrane depolarization and caspase-dependent apoptosis in pancreatic cancer cells. Carcinogenesis 2005, 26, 958–967. [Google Scholar] [CrossRef] [PubMed]
- Ramaiya, S.D.; Bujang, J.S.; Zakaria, M.H. Genetic diversity in passiflora species assessed by morphological and ITS sequence analysis. Sci. World J. 2014, 2014, 598313. [Google Scholar] [CrossRef] [PubMed]
- Colomeu, T.C.; Figueiredo, D.; Cazarin, C.B.B.; Schumacher, N.S.G.; Maróstica, M.R.; Meletti, L.M.M.; Zollner, R.L. Antioxidant and anti-diabetic potential of Passiflora alata Curtis aqueous leaves extract in type 1 diabetes mellitus (NOD-mice). Int. Immunopharmacol. 2014, 18, 106–115. [Google Scholar] [CrossRef]
- Figueiredo, D.; Colomeu, T.C.; Schumacher, N.S.G.; Stivanin-Silva, L.G.; Cazarin, C.B.B.; Meletti, L.M.M.; Fernandes, L.G.R.; Prado, M.A.; Zollner, R.L. Aqueous leaf extract of Passiflora alata Curtis promotes antioxidant and anti-inflammatory effects and consequently preservation of NOD mice beta cells (non-obese diabetic). Int. Immunopharmacol. 2016, 35, 127–136. [Google Scholar] [CrossRef]
- Noriega, P.; Mafud, D.D.F.; Strasser, M.; Kato, E.T.M.; Bacchi, E.M. Passiflora alata curtis: A brazilian medicinal plant. Boletín Latinoam. Y Caribe Plantas Med. Y Aromáticas 2011, 10, 398–413. [Google Scholar]
- Li, G.X.; Chen, Y.K.; Hou, Z.; Xiao, H.; Jin, H.; Lu, G.; Lee, M.J.; Liu, B.; Guan, F.; Yang, Z.; et al. Pro-oxidative activities and dose–response relationship of (−)-epigallocatechin-3-gallate in the inhibition of lung cancer cell growth: A comparative study in vivo and in vitro. Carcinogenesis 2010, 31, 902. [Google Scholar] [CrossRef]
- Maritim, A.C.; Sanders, R.A.; Watkins, J.B. Diabetes, oxidative stress, and antioxidants: A review. J. Biochem. Mol. Toxicol. 2003, 17, 24–38. [Google Scholar] [CrossRef]
- Lambert, J.D.; Elias, R.J. The antioxidant and pro-oxidant activities of green tea polyphenols: A role in cancer prevention. Arch. Biochem. Biophys. 2010, 501, 65–72. [Google Scholar] [CrossRef]
- Gardner, C.D.; Eguchi, S.; Reynolds, C.M.; Eguchi, K.; Frank, G.D.; Motley, E.D. Hydrogen peroxide inhibits insulin signaling in vascular smooth muscle cells. Exp. Biol. Med. 2003, 228, 836–842. [Google Scholar] [CrossRef]
- Afanas’Ev, I. Signaling of Reactive Oxygen and Nitrogen Species in Diabetes Mellitus. Oxid. Med. Cell. Longev. 2010, 3, 361. [Google Scholar] [CrossRef]
- Fukuto, J.M.; Ignarro, L.J. In Vivo Aspects of Nitric Oxide (NO) Chemistry: Does Peroxynitrite (-O.O.N.O.) Play a Major Role in Cytotoxicity? Acc. Chem. Res. 1997, 30, 149–152. [Google Scholar] [CrossRef]
- Vladutiu, A.O. Role of nitric oxide in autoimmunity. Clin. Immunol. Immunopathol. 1995, 76, 1–11. [Google Scholar] [CrossRef]
- Kröncke, K.D.; Fehsel, K.; Suschek, C.; Kolb-Bachofen, V. Inducible nitric oxide synthase-derived nitric oxide in gene regulation, cell death and cell survival. Int. Immunopharmacol. 2001, 1, 1407–1420. [Google Scholar] [CrossRef]
- Stein, C.S.; Strejan, G.H. Rat splenocytes inhibit antigen-specific lymphocyte proliferation through a reactive nitrogen intermediate (R.N.I.)-dependent mechanism and exhibit increased R.N.I. production in response to ifn-γ. Cell. Immunol. 1993, 150, 281–297. [Google Scholar] [CrossRef]
- Hoffman, R.A.; Langrehr, J.M.; Billiar, T.R.; Curran, R.D.; Simmons, R.L. Alloantigen-induced activation of rat splenocytes is regulated by the oxidative metabolism of L-arginine. J. Immunol. 1990, 145, 2220–2226. [Google Scholar]
- Guzik, T.J.; Korbut, R.; Adamek-Guzik, T. Nitric oxide and superoxide in inflammation and immune regulation. J. Physiol. Pharmacol. 2003, 54, 469–487. [Google Scholar]
- Jörns, A.; Arndt, T.; Zu Vilsendorf, A.M.; Klempnauer, J.; Wedekind, D.; Hedrich, H.J.; Marselli, L.; Marchetti, P.; Harada, N.; Nakaya, Y.; et al. Islet infiltration, cytokine expression and beta cell death in the NOD mouse, BB rat, Komeda rat, LEW.1AR1-iddm rat and humans with type 1 diabetes. Diabetologia 2014, 57, 512–521. [Google Scholar] [CrossRef]
- Roep, B.O.; Tree, T.I.M. Immune modulation in humans: Implications for type 1 diabetes mellitus. Nat. Rev. Endocrinol. 2014, 10, 229–242. [Google Scholar] [CrossRef]
- Calder, P.C. Marine omega-3 fatty acids and inflammatory processes: Effects, mechanisms and clinical relevance. Biochim. Biophys. Acta Mol. Cell Biol. Lipids 2015, 1851, 469–484. [Google Scholar] [CrossRef]
- Wong, F.S.; Janeway, C.A. The role of CD4 and CD8 T cells in type I diabetes in the NOD mouse. Res. Immunol. 1997, 148, 327–332. [Google Scholar] [CrossRef]
- Anderson, M.S.; Bluestone, J.A. The NOD mouse: A model of immune dysregulation. Annu. Rev. Immunol. 2005, 23, 447. [Google Scholar] [CrossRef]
- Bach, J.F. Immunotherapy of type 1 diabetes: Lessons for other autoimmune diseases. Arthritis Res. 2002, 4, 1–13. [Google Scholar] [CrossRef] [PubMed]
- Kikutani, H.; Makino, S. The murine autoimmune diabetes model: NOD and related strains. Adv. Immunol. 1992, 51, 285–322. [Google Scholar]
- Schumacher, N.S.G.; Fernandes, L.G.R.; de Lima Zollner, R. Aqueous extract of Passiflora alata leaves modulates in vitro the indoleamine 2,3-dioxygenase (I.D.O.) and CD86 expression in bone marrow-derived professional antigen-presenting cells polarizing NOD mice T cells to a Treg profile. Cytokine 2022, 152, 155832. [Google Scholar] [CrossRef]
- Diabetes Onset in NOD/ShiLtJ. Available online: https://www.jax.org/jax-mice-and-services/strain-data-sheet-pages/diabetes-chart-001976 (accessed on 15 July 2022).
- Henry, C.; Chen, Y.U.; Stout, R.; Swain, S.L. Cell separation: Nylon wool. In Selected Methods in Cellular Immunology; W H Freeman & Co: San Francisco, CA, USA, 1980; pp. 182–185. [Google Scholar]
- Miyazaki, J.I.; Araki, K.; Yamato, E.; Ikegami, H.; Asano, T.; Shibasaki, Y.; Oka, Y.; Yamamura, K.I.; Miyazaki, J.I. Establishment of a Pancreatic β Cell Line That Retains Glucose-Inducible Insulin Secretion: Special Reference to Expression of Glucose Transporters Isoforms. Endocrinology 1990, 127, 126–132. [Google Scholar] [CrossRef] [PubMed]
- Nakashima, K.; Kanda, Y.; Hirokawa, Y.; Kawasaki, F.; Matsuki, M.; Kaku, K. MIN6 Is Not a Pure Beta Cell Line but a Mixed Cell Line with Other Pancreatic Endocrine Hormones. Endocr. J. 2009, 56, 45–53. [Google Scholar] [CrossRef] [PubMed]
- Perelman, A.; Wachtel, C.; Cohen, M.; Haupt, S.; Shapiro, H.; Tzur, A. JC-1: Alternative excitation wavelengths facilitate mitochondrial membrane potential cytometry. Cell Death Dis. 2012, 3, e430. [Google Scholar] [CrossRef] [PubMed]
- Bach, J.F. Insulin-Dependent Diabetes Mellitus as an Autoimmune Disease. Endocr. Rev. 1994, 15, 516–542. [Google Scholar] [CrossRef]
- Atkinson, M.A.; Leiter, E.H. The NOD mouse model of type 1 diabetes: As good as it gets? Nat. Med. 1999, 5, 601–604. [Google Scholar] [CrossRef] [PubMed]
- Sarikonda, G.; Pettus, J.; Phatak, S.; Sachithanantham, S.; Miller, J.F.; Wesley, J.D.; Cadag, E.; Chae, J.; Ganesan, L.; Mallios, R.; et al. CD8 T-cell reactivity to islet antigens is unique to type 1 while CD4 T-cell reactivity exists in both type 1 and type 2 diabetes. J. Autoimmun. 2014, 50, 77–82. [Google Scholar] [CrossRef] [PubMed]
- Szablewski, L. Role of the immune system in type 1 diabetes mellitus pathogenesis. Int. Immunopharmacol. 2014, 22, 182–191. [Google Scholar] [CrossRef] [PubMed]
- Abdali, D.; Samson, S.E.; Grover, A.K. How effective are antioxidant supplements in obesity and diabetes? Med. Princ. Pract. 2015, 24, 201–215. [Google Scholar] [CrossRef]
- Osma, J.A.; Maldonado, M.E.; Chamorro, N.L.; Varela, S.S.A.; Landázuri, P. Antioxidant and antiproliferative activity of ethanolic and aqueous extracts from leaves and fruits juice Passiflora edulis. Perspect. EN Nutr. Hum. 2013, 15, 13–25. [Google Scholar]
- Eatemadi, A.; Darabi, M.; Afraidooni, L.; Zarghami, N.; Daraee, H.; Eskandari, L.; Mellatyar, H.; Akbarzadeh, A. Comparison, synthesis and evaluation of anticancer drug-loaded polymeric nanoparticles on breast cancer cell lines. Artif. Cells Nanomed. Biotechnol. 2016, 44, 1008–1017. [Google Scholar] [CrossRef]
- Matula, K.; Collie-Duguid, E.; Murray, G.; Parikh, K.; Grabsch, H.; Tan, P.; Lalwani, S.; Garau, R.; Ong, Y.; Bain, G.; et al. Regulation of cellular sphingosine-1-phosphate by sphingosine kinase 1 and sphingosine-1-phopshate lyase determines chemotherapy resistance in gastroesophageal cancer. BMC Cancer 2015, 15, 762. [Google Scholar] [CrossRef] [PubMed]
- Colomeu, T.C.; Figueiredo, D.D.; Zollner, R.D.L.; Maria, L.; Meletti, M. Comparison of Antioxidant and Ant proliferative Effect among Four Passiflora spp. J. Agric. Life Sci. 2017, 4, 1–8. [Google Scholar]
- Vargas, A.J.; Geremias, D.S.; Provensi, G.; Fornari, P.E.; Reginatto, F.H.; Gosmann, G.; Schenkel, E.P.; Fröde, T.S. Passiflora alata and Passiflora edulis spray-dried aqueous extracts inhibit inflammation in mouse model of pleurisy. Fitoterapia 2007, 78, 112–119. [Google Scholar] [CrossRef]
- Samarghandian, S.; Azimi-Nezhad, M.; Farkhondeh, T. Catechin treatment ameliorates diabetes and its complications in streptozotocin-induced diabetic rats. Dose-Response 2017, 15, 1158. [Google Scholar] [CrossRef]
- Peng, X.; Zheng, Z.; Cheng, K.W.; Shan, F.; Ren, G.X.; Chen, F.; Wang, M. Inhibitory effect of mung bean extract and its constituents vitexin and isovitexin on the formation of advanced glycation endproducts. Food Chem. 2008, 106, 475–481. [Google Scholar] [CrossRef]
- Küpeli, E.; Asian, M.; Gürbüz, I.; Yesilada, E. Evaluation of in vivo biological activity profile of isoorientin. Zeitschrift Naturforsch. Sect. C J. Biosci. 2004, 59, 787–790. [Google Scholar] [CrossRef]
- Sghaier, M.B.; Pagano, A.; Mousslim, M.; Ammari, Y.; Kovacic, H.; Luis, J. Rutin inhibits proliferation, attenuates superoxide production and decreases adhesion and migration of human cancerous cells. Biomed. Pharmacother. 2016, 84, 1972–1978. [Google Scholar] [CrossRef] [PubMed]
- Lea, N.C.; Orr, S.J.; Stoeber, K.; Williams, G.H.; Lam, E.W.-F.; Ibrahim, M.A.A.; Mufti, G.J.; Thomas, N.S.B. Commitment Point during G0→G1 That Controls Entry into the Cell Cycle. Mol. Cell. Biol. 2003, 23, 2351. [Google Scholar] [CrossRef]
- Hussain, T.; Tan, B.; Yin, Y.; Blachier, F.; Tossou, M.C.B.; Rahu, N. Oxidative Stress and Inflammation: What Polyphenols Can Do for Us? Oxid. Med. Cell. Longev. 2016, 2016, 7432797. [Google Scholar] [CrossRef]
- Shin, S.Y.; Yoon, H.; Ahn, S.; Kim, D.W.; Bae, D.H.; Koh, D.; Lee, Y.H.; Lim, Y. Structural properties of polyphenols causing cell cycle arrest at G1 phase in HCT116 human colorectal cancer cell lines. Int. J. Mol. Sci. 2013, 14, 16970–16985. [Google Scholar] [CrossRef] [PubMed]
- Zhang, G.; Li, D.; Chen, H.; Zhang, J.; Jin, X. Vitexin induces G2/M-phase arrest and apoptosis via Akt/mTOR signaling pathway in human glioblastoma cells. Mol. Med. Rep. 2018, 17, 4599–4604. [Google Scholar] [CrossRef]
- Chen, H.; Miao, Q.; Geng, M.; Liu, J.; Hu, Y.; Tian, L.; Pan, J.; Yang, Y. Anti-tumor effect of rutin on human neuroblastoma cell lines through inducing G2/M cell cycle arrest and promoting apoptosis. Sci. World J. 2013, 2013, 269165. [Google Scholar] [CrossRef] [PubMed]
- Erenler, R.; Meral, B.; Sen, O.; Elmastas, M.; Aydin, A.; Eminagaoglu, O.; Topcu, G. Bioassay-guided isolation, identification of compounds from Origanum rotundifolium and investigation of their antiproliferative and antioxidant activities. Pharm. Biol. 2017, 55, 1646–1653. [Google Scholar] [CrossRef] [PubMed]
- Fazil, F.N.M.; Azzimi, N.S.M.; Yahaya, B.H.; Kamalaldin, N.A.; Zubairi, S.I. Kinetics Extraction Modelling and Antiproliferative Activity of Clinacanthus nutans Water Extract. Sci. World J. 2016, 2016, 7370536. [Google Scholar] [CrossRef] [PubMed]
- Hogg, N.; Kalyanaraman, B. Nitric oxide and lipid peroxidation. Biochim. Biophys. Acta Bioenerg. 1999, 1411, 378–384. [Google Scholar] [CrossRef]
- Elmore, S. Apoptosis: A Review of Programmed Cell Death. Toxicol. Pathol. 2007, 35, 495. [Google Scholar] [CrossRef]
- Green, D.R.; Levine, B. To be or not to be? How selective autophagy and cell death govern cell fate. Cell 2014, 157, 65–75. [Google Scholar] [CrossRef]
- Yuan, L.; Wang, J.; Xiao, H.; Xiao, C.; Wang, Y.; Liu, X. Isoorientin induces apoptosis through mitochondrial dysfunction and inhibition of PI3K/Akt signaling pathway in HepG2 cancer cells. Toxicol. Appl. Pharmacol. 2012, 265, 83–92. [Google Scholar] [CrossRef]
- Santos, B.L.; Silva, A.R.; Pitanga, B.P.S.; Sousa, C.S.; Grangeiro, M.S.; Fragomeni, B.O.; Coelho, P.L.C.; Oliveira, M.N.; Menezes-Filho, N.J.; Costa, M.F.D.; et al. Antiproliferative, proapoptotic and morphogenic effects of the flavonoid rutin on human glioblastoma cells. Food Chem. 2011, 127, 404–411. [Google Scholar] [CrossRef]
- D’Archivio, M.; Santangelo, C.; Scazzocchio, B.; Varì, R.; Filesi, C.; Masella, R.; Giovannini, C. Modulatory effects of polyphenols on apoptosis induction: Relevance for cancer prevention. Int. J. Mol. Sci. 2008, 9, 213–228. [Google Scholar] [CrossRef]
- Choi, K.; Kim, J.; Kim, G.; Choi, C. Oxidative stress-induced necrotic cell death via mitochondira-dependent burst of reactive oxygen species. Curr. Neurovasc. Res. 2009, 6, 213–222. [Google Scholar] [CrossRef]
- León-González, A.J.; Auger, C.; Schini-Kerth, V.B. Pro-oxidant activity of polyphenols and its implication on cancer chemoprevention and chemotherapy. Biochem. Pharmacol. 2015, 98, 371–380. [Google Scholar] [CrossRef]
- Sassi, N.; Biasutto, L.; Mattarei, A.; Carraro, M.; Giorgio, V.; Citta, A.; Bernardi, P.; Garbisa, S.; Szabò, I.; Paradisi, C.; et al. Cytotoxicity of a mitochondriotropic quercetin derivative: Mechanisms. Biochim. Biophys. Acta 2012, 1817, 1095–1106. [Google Scholar] [CrossRef] [PubMed]
- Tao, L.; Forester, S.C.; Lambert, J.D. The role of the mitochondrial oxidative stress in the cytotoxic effects of the green tea catechin, (-)-epigallocatechin-3-gallate, in oral cells. Mol. Nutr. Food Res. 2014, 58, 665–676. [Google Scholar] [CrossRef] [PubMed]
- Singh, A.K.; Cabral, C.; Kumar, R.; Ganguly, R.; Rana, H.K.; Gupta, A.; Lauro, M.R.; Carbone, C.; Reis, F.; Pandey, A.K. Beneficial Effects of Dietary Polyphenols on Gut Microbiota and Strategies to Improve Delivery Efficiency. Nutrients 2019, 11, 2216. [Google Scholar] [CrossRef] [PubMed]
- Wang, X.; Qi, Y.; Zheng, H.; Wang, X.; Qi, Y.; Zheng, H. Dietary Polyphenol, Gut Microbiota, and Health Benefits. Antioxidants 2022, 11, 1212. [Google Scholar] [CrossRef] [PubMed]


Publisher’s Note: MDPI stays neutral with regard to jurisdictional claims in published maps and institutional affiliations. |
© 2022 by the authors. Licensee MDPI, Basel, Switzerland. This article is an open access article distributed under the terms and conditions of the Creative Commons Attribution (CC BY) license (https://creativecommons.org/licenses/by/4.0/).