Article

Antioxidative Self-Assembling Nanoparticles Attenuate the Development of Steatohepatitis and Inhibit Hepatocarcinogenesis in Mice

1
Department of Gastroenterology, Faculty of Medicine, University of Tsukuba, 1-1-1 Tennodai, Tsukuba 305-8575, Japan
2
Doctoral Program in Clinical Sciences, Graduate School of Comprehensive Human Sciences, University of Tsukuba, 1-1-1 Tennodai, Tsukuba 305-8575, Japan
3
Division of Medical Sciences, Faculty of Medicine, University of Tsukuba, 1-1-1 Tennodai, Tsukuba 305-8575, Japan
4
Doctoral Program in Sports Medicine, Graduate School of Comprehensive Human Sciences, University of Tsukuba, 1-1-1 Tennodai, Tsukuba 305-8575, Japan
5
Doctoral Program in Medical Sciences, Graduate School of Comprehensive Human Sciences, University of Tsukuba, 1-1-1 Tennodai, Tsukuba 305-8575, Japan
6
Department of Food Science and Technology, Tokyo University of Marine Science and Technology, 4-5-7 Konan, Minato-ku, Tokyo 108-8477, Japan
7
Division of Biomedical Sciences, Faculty of Medicine, University of Tsukuba, 1-1-1 Tennodai, Tsukuba 305-8575, Japan
8
Department of Oral and Maxillofacial Surgery, Institute of Clinical Medicine, Faculty of Medicine, University of Tsukuba 1-1-1 Tennodai, Tsukuba 305-8575, Japan
9
Department of Surgery, Institute of Gastroenterology, Tokyo Women’s Medical University, 8-1 Kawada-cho, Shinjuku-ku, Tokyo 162-8666, Japan
10
Faculty of Pure and Applied Sciences, University of Tsukuba, 1-1-1 Tennodai, Tsukuba 305-8573, Japan
*
Authors to whom correspondence should be addressed.
These authors contributed equally to this work.
Antioxidants 2022, 11(10), 1939; https://doi.org/10.3390/antiox11101939
Submission received: 26 August 2022 / Revised: 23 September 2022 / Accepted: 23 September 2022 / Published: 28 September 2022

Abstract

:
Oxidative stress (OS) contributes to nonalcoholic steatohepatitis (NASH) and hepatocarcinogenesis. We investigated whether antioxidative self-assembling nanoparticles (SMAPoTN) could reduce the development of NASH and hepatocellular carcinoma (HCC) in p62/Sqstm1 and Nrf2 double knockout (DKO) mice and studied protective mechanisms. We measured disease development in male DKO mice fed a normal chow (NASH model) or a 60% high-fat diet (HFD; HCC model) with or without SMAPoTN administration for 26 weeks. SMAPoTN inhibited liver fibrosis in both groups and prevented HCC development (0% vs. 33%, p < 0.05) in the HFD group. SMAPoTN reduced OS, inflammatory cytokine signaling, and liver fibrosis. RNA-sequencing revealed that SMAPoTN decreased endoplasmic reticulum stress signaling genes in both groups, HCC driver genes, and cancer pathway genes, especially PI3K-AKT in the HFD groups. In the SMAPoTN treatment HFD group, serum lipopolysaccharide levels and liver lipopolysaccharide-binding protein expression were significantly lower compared with those in the nontreatment group. SMAPoTN improved the α-diversity of gut microbiota, and changed the microbiota composition. Oral SMAPoTN administration attenuated NASH development and suppressed hepatocarcinogenesis in DKO mice by improving endoplasmic reticulum stress in the liver and intestinal microbiota. SMAPoTN may be a new therapeutic option for NASH subjects and those with a high HCC risk.

1. Introduction

Obesity causes numerous metabolic disorders and complications, including cardiovascular disease, diabetes mellitus type 2, and nonalcoholic fatty liver disease (NAFLD) [1,2]. Nonalcoholic steatohepatitis (NASH) is a progressive liver disease characterized by steatosis, inflammation, and fibrosis, leading to liver cirrhosis and hepatocellular carcinoma (HCC) [2,3]. The development of NASH and HCC is associated with multiple parallel factors, and this theory is called the “multiple parallel hits theory” [4]. Oxidative stress (OS) [5,6], endoplasmic reticulum (ER) stress [7], lipopolysaccharide (LPS) derived from the intestines [8,9], and insulin resistance [3] have been reported to be associated with hepatocarcinogenesis through changes in several cancer driver genes and cancer pathway genes [10,11]. However, the molecular mechanisms remain unclear. In addition, several pharmacological strategies that have been tested for the treatment of NASH-based fibrosis are not yet ready for clinical use [12,13], and no preventive therapy has been developed.
In NASH, the accumulation of certain lipid species injures hepatocytes via lipotoxicity [14], which generates reactive oxygen species (ROS) and induces hepatocyte cell death, liver inflammation, and liver fibrosis, thereby contributing to hepatocarcinogenesis [15,16]. Given the importance of OS in NASH development, antioxidant interventions have been tested in humans with mixed results [17,18]. Moreover, because NASH is often triggered by the disruption of the gut–liver axis, including intestinal dysbiosis and intestinal barrier dysfunction [19], the pharmacological treatment of NASH requires strategies based on the gut–liver axis.
In recent years, patients with NASH have increased in several countries, such as European countries, the United States, China, and Japan, and the number of NASH subjects with advanced fibrosis (F3 and F4 stages) who are likely to develop HCC is predicted to increase to approximately one million in Japan by 2030 [20].
In addition, the proportion of HCC patients with nonviral etiologies has remarkably increased from 10.0% in 1991 to 32.5% in 2015 in Japan [21]. NAFLD, including NASH, accounts for 15.1% of non-B and non-C HCC background liver disease. Moreover, in recent years, the proportion of patients with diabetes mellitus, obesity, dyslipidemia, hypertension, and fatty liver has been increasing in Japan. Therefore, NASH-related HCC is predicted to further increase in the future [21]. Accordingly, developing new therapeutic options for NASH and NASH-related HCC is an urgent issue.
Oxidative stress and lipid peroxidation, which are caused by an increased production of reactive oxygen species (ROS), induce NASH with gut-derived endotoxins and/or any number of cytokines such as tumor necrosis factor-α (TNFα) and adipocytokines [22]. The action of these factors results in liver injury and subsequent progression towards hepatic fibrosis [23]. Antioxidants are one of the potential candidates for the amelioration of OS in NAFLD, NASH, and HCC. However, most of the conventional antioxidants with a low molecular weight, such as 4-hydroxy-2, 2, 6, and 6-tetramethylpiperidine-l-oxyl (TEMPOL), do not exert suitable effects [24]. TEMPOL degrades superoxides and peroxides directly in vitro [25]. These conventional antioxidants spread throughout the whole body and are eliminated rapidly [26]. Additionally, these antioxidants disrupt the normal redox reaction in normal cells, including the electron transport chain, leading to mitochondrial dysfunction and apoptosis [27,28]. Therefore, these antioxidants have a very small or no “therapeutic window”. One of the authors and his colleagues have recently started developing nanoparticle-type self-assembling antioxidants, which stay for an extended period of time in the intestinal mucosa after oral administration. Since the size of several tens of nanometers suppresses internalization in normal cells to avoid the dysfunction of intracellular redox reactions and decreases the unwanted adverse effects, as a result, these nanoparticle-type antioxidants expand their therapeutic window significantly. For example, one of these nanoparticle-type antioxidants, RNPO, which does not disintegrate regardless of environmental pH changes, has been shown to inhibit the increase in commensal bacteria in the colonic mucosa of a colitis mouse model by scavenging ROS and suppressing inflammation [29]. Another type of antioxidant nanoparticle, RNPN, which disintegrates under acidic environments, is absorbed from the intestinal tract, remains in the liver, and exerts anti-inflammatory and antifibrosis activity with anti-OS effects in mild NASH induced by choline-deficient l-amino-acid-defined feeding [30]. However, whether SMAPoTN prevents NASH-related HCC has not been tested.
In previous studies, genetically modified mice and/or carcinogen-induced models, such as phosphatase and tensin homolog-deficient mice [31] and mice with HCC induced through diethylnitrosamine [32], were examined as HCC models. We developed p62/sequestosome 1 (p62) and nuclear-factor-erythroid-2-related factor 2 (Nrf2) double knockout mice (DKO); male DKO mice spontaneously developed adult-onset NASH and its associated hepatocarcinogenesis following normal chow (NC) feeding [33], exhibiting a phenotype similar to human NASH [33]. Because of the phenotypic similarities to the clinical features of human NASH, such as obesity (visceral fat accumulation) coupled with metabolic syndrome, insulin resistance, and adipokine imbalance, this DKO mouse represents a unique animal model for exploring novel therapeutic approaches for the prevention and/or treatment of NASH. More importantly, the DKO mice show dysbiosis associated with an increased proportion of Gram-negative bacteria species and elevated LPS levels in feces. Collectively, in the DKO mice, the activation of innate immune responses through excessive LPS flux from the intestines, occurring both within and outside the liver, is central to the development of hepatic damage in the form of NASH. The DKO mice are a suitable model for investigating the therapeutic effect of antioxidative nanoparticle on NASH and NASH-related HCC.
The aim of the present study was to elucidate whether SMAPoTN exerts preventive effects against the development of NASH and its associated hepatocarcinogenesis and clarify the protective mechanisms by which the oral administration of SMAPoTN attenuates NASH development and suppresses hepatocarcinogenesis through the gut–liver axis in DKO mice.

2. Materials and Methods

2.1. Animals

p62 and Nrf2 DKO mice were produced by crossing p62-KO and Nrf2-KO mice and regenotyping [33]. All mice were maintained under specific pathogen-free conditions in an environmentally controlled clean room at the Laboratory Animal Resource Center, University of Tsukuba. Mice were housed at an ambient temperature of 23 ± 2.5 °C with a daily light/dark cycle from 05:00 to 19:00. All experiments were performed under protocols approved by the Institutional Animal Care and Use Committees of the University of Tsukuba. Male mice were used in all experiments.
The mice were fed a normal chow (NC: 5.1% fat, 23.1% protein, 360 kcal/100 g from Oriental Yeast, Tokyo, Japan) or a 60% high-fat diet (HFD: 60% fat, 24.5% protein, 640 kcal/100 g from Oriental Yeast, Tokyo, Japan) for 26 weeks from 6 to 32 weeks of age. During the same period with HFD feeding, the mice had free access to drinking water with SMAPoTN (10 mg/day) or without SMAPoTN.

2.2. Preparation and Pharmacokinetics of SMAPoTN

A poly (styrene-co-maleic acid) copolymer (PSMA, molecular weight (MW) = 7500, styrene:maleic anhydride unit ratio = 2:1) was dissolved in anhydrous tetrahydrofuran (THF). An alpha-methoxy-omega-hydroxy poly (ethylene glycol) (5000 MW, MeO-PEG-OH) was dissolved in dry THF, and a stoichiometric amount of butyllithium (1.6 M hexane solution) was added to convert the PEG end to an alcoholate. This solution was added to a separately prepared THF solution of PSMA and stirred for 1 h. The reaction solution was poured into isopropyl alcohol to obtain a precipitate. The precipitate was dispersed in hexane, purified through filtration, and dried in vacuo (SMAPo). The synthesized SMAPO was dissolved in anhydrous THF. The excess molar amount of NH2-TEMPO versus maleic anhydride repeating units in SMAPo was dissolved in anhydrous THF, added to the above solution, poured into ether, and the precipitate was collected to obtain SMAPOTN. In this work, one PEG chain was introduced to the PSMA backbone via ester-linkage, and NH2-TEMPO was introduced to the remaining maleic anhydride ring (18-TEMPO molecules per PSMA backbone). The pharmacokinetics of SMAPoTN in mice after oral administration were determined using fluorescent rhodamine-labeled SMAPoTN. The rhodamine-labeled SMAPoTN was administered orally using a sonde. After oral administration from 1.5 h to 48 h, the labeled SMAPoTN was observed with an Intelligent Visual Information System (IVIS; Perkin Elmer, Waltham, MA, USA). Mice were anesthetized through the inhalation of isoflurane (Perkin Elmer, MA, USA) and subjected to abdominal incisions. All IVIS images were acquired at excitation/emission wavelength 535/580 nm with an exposure time of 1 s. Acquired IVIS images were adjusted to the same minimum and maximum values of the color scale with Living Image Software (Perkin Elmer, MA, USA). The color scale indicated the radiant efficiency of the rhodamine-labeled SMAPoTN with the IVIS (p/s/cm2/sr/µW/cm2).

2.3. Biochemical Analysis

Serum concentrations of aspartate aminotransferase (AST), alanine aminotransferase (ALT), triglycerides (TGs), high-density lipoprotein cholesterol (HDL-CHO), low-density lipoprotein cholesterol (LDL-CHO), and free fatty acids (FFAs) were measured with Oriental Yeast (Tokyo, Japan) using a Hitachi 7180 Auto Analyzer. AST and ALT were measured with the JSCC transferable method using L type Wako AST or ALT-J2 kit (FUJIFILM, Tokyo, Japan). TGs and FFAs were measured with enzymatic methods using L-type Wako TG-M or NEFA HF (FUJIFILM, Tokyo, Japan). HDL-CHO and LDL-CHO were measured with direct methods using CHOLESTEST N LDL or HDL (SEKISUI MEDICAL, Tokyo, Japan). Glutathione (GSH and GSSG) concentrations and superoxide dismutase (SOD) activity in the liver tissue specimens were measured using a GSSG/GSH Quantification Kit (FUJIFILM, Tokyo, Japan) and SOD Assay kit-WST (FUJIFILM, Tokyo, Japan). Malondialdehyde (MDA) concentrations in liver tissue specimens were measured using a TBARS assay kit (Cayman, Chemical, Ann Arbor, MI, USA).

2.4. Histological Analysis

Liver tissues were fixed in 4% paraformaldehyde, embedded in paraffin, and stained with hematoxylin–eosin and Sirius Red solution. To evaluate the histopathological severity of steatohepatitis, the steatosis, activity, and fibrosis (SAF) scores were assessed for the grade of steatosis (0–3), activity (0–4), and stage of fibrosis (0–4) [34]. The percentage of atypical cells with large nuclei was quantified by counting 1300–1600 cells in the six or seven fields of view at ×100 magnification. HCCs were analyzed with the gross examination of whole livers and histologically diagnosed using sections from liver nodules. In the HFD group, liver tissues without tumors (nontumor areas) were analyzed. Histological analyses were performed under a BX43 microscope (Olympus, Tokyo, Japan). All images were captured with a DP21 digital camera (Olympus). The eyepiece lens was set to ×10 magnification and the objective lens was set to ×10 magnification to acquire images.

2.5. Immunoblot Analysis

Total liver homogenates were prepared as previously described [35]. Protein samples were subjected to SDS/PAGE and transferred to a PVDF membrane (Bio-Rad, Hercules, CA, USA). The corresponding primary and secondary antibodies were incubated with the membranes to visualize the protein. An antibody to hexanoyl-lysine (HEL) was obtained from JaICA (MHL-021P), and an antibody to LPS-binding protein (LBP) was obtained from Proteintech (23559-1-AP). An antibody to β-Actin was used as described previously [33]. Immunoreactive bands were densitometrically quantified and normalized to the amounts of actin present in each specimen and then averaged.

2.6. Real-Time Quantitative Polymerase Chain Reaction (qPCR)

Steady-state mRNA levels in the livers were determined with qPCR. Total RNA was extracted from liver specimens, followed by cDNA synthesis. qPCR was performed with Fast SYBR Green Master Mix (Thermo Fisher Scientific, Waltham, MA, USA). Primers used for this study were described previously [33]. Data were normalized to the average amounts of glyceraldehyde 3-phosphate dehydrogenase (GAPDH) and cyclophilin present in each sample and then averaged.

2.7. RNA Sequencing (RNA-Seq) Analysis

Total RNA was extracted from the liver using the NucleoSpin RNA XS kit (Macherey-Nagel, Duren, Deutschland). Sequencing was performed by Takara Bio Inc (Kusatsu, Japan) using a Smart-Seq Stranded Kit. Nucleic acid quantification was performed with electrophoresis using TapeStation or BioAnalyzer (Agilent Technologies, Santa Clara, CA, USA). Based on the position information obtained with mapping and the gene definition file, the expression levels of gene units and transcript units were calculated. The gene ontology analysis and Kyoto Encyclopedia of Genes and Genomes (KEGG) pathway analysis were performed using DAVID (The Database for Annotation, Visualization and Integrated Discovery) software. Heatmaps were constructed using ClustVis (https://biit.cs.ut.ee/clustvis/ (accessed on 10 June 2021)). The RNA-seq analysis was performed using eight mice in each group.

2.8. TG and FFA Concentrations and FA Composition in Liver Tissues

TG and FFA concentrations in liver tissue specimens were measured using reagent kits (FUJIFILM Wako Chemicals, Osaka, Japan). The FA composition of liver tissues was determined using a gas chromatography system. The extraction of lipids contained in the livers and the analysis of the FA composition were described previously [36].

2.9. Measurement of Serum and Fecal LPS Levels

LPS concentrations in serum and feces were measured with the ToxinSensor chromogenic LAL endotoxin assay kit (Genscript, Piscataway, NJ, USA), in accordance with the manufacturer’s instructions. LPS levels were expressed as endotoxin units.

2.10. Microbiome Analysis

The 16S rRNA gene sequencing of mice feces was performed by Takara Bio Inc (Kusatsu, Shiga, Japan). The raw sequence data from the Illumina platform were converted into forward- and reverse-read files using the FASTQ processor, and then imported into Quantitative Insights Into Microbial Ecology (QIIME), an open-source microbiome analysis platform, for further analysis. The paired-end sequences were demultiplexed, denoised, dereplicated, and merged with the Cluster Database at High Identity with Tolerance Operational Taxonomic Unit (CD-HITOTU) quality control package in QIIME. Sequence data processing, operational taxonomic unit (OTU) definition, and taxonomic assignment were performed using QIIME with a naive Bayes classifier. The differential abundance of OTUs at the different taxonomic levels, including phylum, class, family, order, genus, and species, was analyzed using the analysis of the composition of microbiomes (ANCOM). α-diversity (observed species) was determined and analyzed using Wilcoxon’s rank-sum test.

2.11. Statistics

Statistical analysis was conducted using IBM SPSS Statistics 26.0 (IBM, Armonk, NY, USA). Values were given as means ± standard error of the mean. When two groups were compared and an unpaired t-test was used for the data analysis. The chi-squared test was used to assess differences between groups for HCC incidence. A p value of < 0.05 was defined as statistically significant. In the HFD feeding group, the comparison was performed between the SMAPoTN treatment group (tumor negative group) and nontreatment group with HCCs (tumor-positive group) to clarify the effects of SMAPoTN on hepatocarcinogenesis.
The statistical analysis of α-diversity was performed with the Monte Carlo two-sample t-test between two unpaired groups using the α-diversity index (observed species). The diversity index used for testing was the maximum number of reads for which the diversity index could be calculated for all samples. p-values were corrected with the FDR method. In this analysis, because there were more than two groups, the test was performed on all two-group combinations. A p-value of 0.05 or less after adjustment was considered to indicate a significant difference in the diversity of the comparison groups.

3. Results

3.1. SMAPoTN Is Derived and Accumulated in the Livers through the Digestive Tract without Any Side Effects

In the IVIS analysis, rhodamine-labeled SMAPoTN was located in the GI tract at 1.5 h after oral administration, followed by distribution to the whole body, indicating the internalization of SMAPoTN into the bloodstream even via oral administration. Rhodamine-labeled SMAPoTN remained in the liver after 48 h, whereas the compound had almost cleared in other organs, indicating the SMAPoTN was internalized into blood from the GI tract and mainly accumulated in the liver via the portal vein, followed by gradual spreading and excretion in other organs for 1–2 days after administration (Figure 1A).
The body weights of DKO mice fed NC or the HFD with or without SMAPoTN treatment were monitored from 6 to 32 weeks of age. All mice had similar body weights at birth. After 10 weeks of age, the DKO mice fed the HFD gained weight faster and exhibited more severe obesity than DKO mice fed NC, but no differences were observed between the with or without SMAPoTN groups (44.1 ± 0.9 g for DKO mice fed NC without SMAPoTN, 46.4 ± 0.4 g for DKO mice fed NC with SMAPoTN, 54.7 ± 0.4 g for DKO mice fed the HFD without SMAPoTN, and 52.9 ± 2.2 g for DKO mice fed the HFD with SMAPoTN at 32 weeks of age; Figure 1B). The HFD feeding significantly increased liver weights and liver/body weight ratios compared with NC feeding; however, SMAPoTN did not affect liver weights and liver/body weight ratios (Figure 1B).

3.2. SMAPoTN Inhibits the Development of Liver Fibrosis and HCC

The changes in liver histology induced with the SMAPoTN treatment for DKO mice fed NC or the HFD are shown in Figure 1C. To determine the histopathological severity of steatohepatitis, the SAF score was assessed (Figure 1D). In the NC feeding group, histological steatosis and the SAF score of DKO mice with SMAPoTN treatment were more severe compared with those of DKO mice without the SMAPoTN treatment, whereas fibrosis in DKO mice with the SMAPoTN treatment was milder compared with that in DKO mice without the SMAPoTN treatment. DKO mice fed the HFD showed more severe steatosis, inflammation, and fibrosis than DKO mice fed NC; however, the SMAPoTN treatment suppressed steatosis and fibrosis in the livers compared with the nontreatment group (Figure 1C,D). Atypical cells with large nuclei in the nontumor area were observed in DKO mice (Figure 1E, left panel). No atypical cells were found in DKO mice fed the NC. However, the percentage of atypical cells in DKO mice fed the HFD without the SMAPoTN treatment was decreased significantly due to the SMAPoTN treatment (Figure 1E, right panel). As shown in Figure 1F, DKO mice often developed well-differentiated HCCs, which included atypical cells with larger nuclei (Figure 1F, blue arrows) and fat after HFD feeding for 26 weeks.
Sixteen DKO mice of forty-five fed the HFD without the SMAPoTN treatment developed HCC. Conversely, no DKO mice among 10 treated with SMAPoTN developed HCC (16/45, 33% vs. 0/10, 0%; p = 0.035, Figure 1G). Taken together with these results, the SMAPoTN treatment could inhibit hepatocarcinogenesis in DKO mice. Comparing blood biochemistry analyses between DKO mice with or without the SMAPoTN treatment, the HFD feeding increased AST and ALT levels compared with NC feeding in both the SMAPoTN treatment and nontreatment groups, but there was no difference between these two groups (Figure 1G, left panel). The serum lipid profiles, such as TG, HDL-CHO, and LDL-CHO, were higher in DKO mice fed NC with the SMAPoTN treatment than in DKO mice without the SMAPoTN treatment; however, these changes were not observed in the HFD feeding groups (Figure 1H, right panel).

3.3. SMAPoTN Treatment Reduces OS, Inflammatory Signaling, and Fibrosis-Related Factors in the Liver

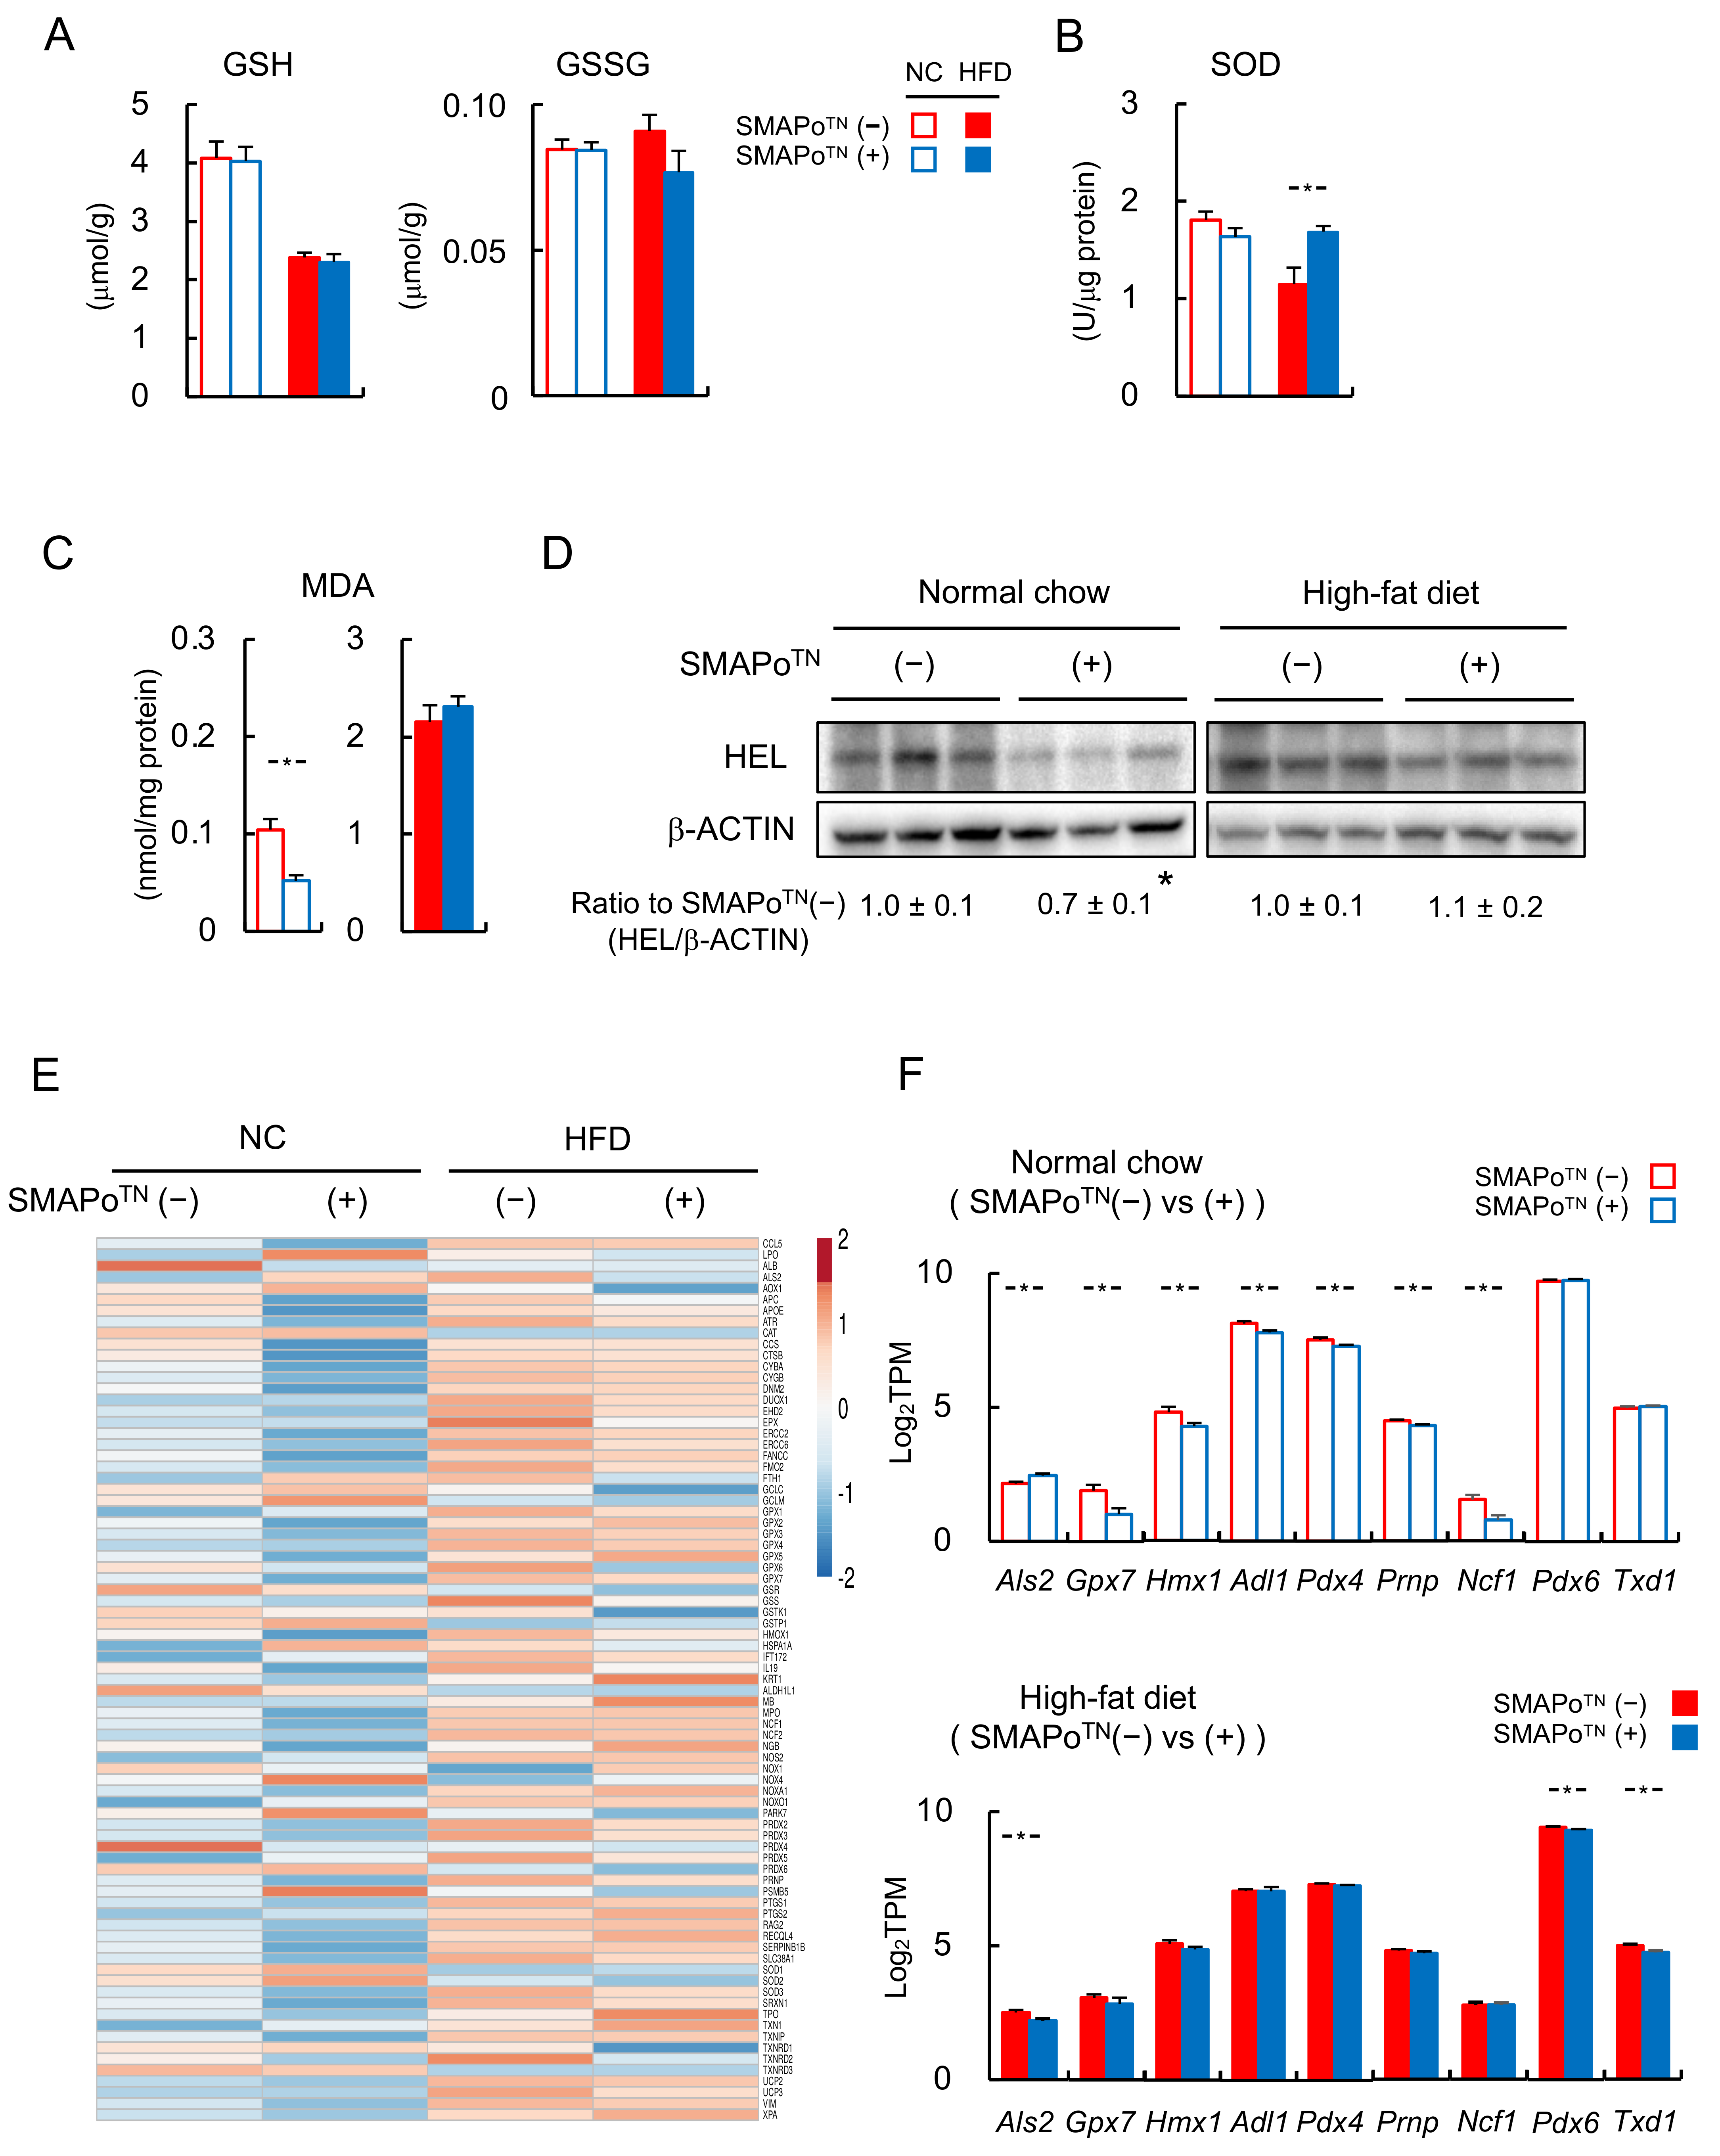
Next, we investigated the effectiveness of the SMAPoTN treatment in reducing OS. As shown in Figure 2A, the HFD feeding decreased GSH levels compared with NC feeding in both the SMAPoTN treatment and nontreatment groups, but there was no difference between these two groups. GSSG levels did not differ between the NC and HFD groups, and the levels were higher in DKO mice fed the HFD without the SMAPoTN treatment than in DKO mice treated with SMAPoTN. However, there was no significant change. SOD activity did not differ in DKO mice fed NC with or without the SMAPoTN treatment. The HFD feeding significantly decreased SOD activity. However, the SMAPoTN treatment significantly increased SOD activity (Figure 2B). The SMAPoTN treatment significantly decreased the MDA levels and HEL expression in the livers of DKO mice fed NC; however, the levels did not differ in DKO mice fed the HFD (Figure 2C,D). These results suggested that SMAPoTN reduced OS in the livers. Moreover, we evaluated the mRNA levels of oxidative stress-signaling genes in livers with RNA-seq analyses. A heatmap showed that the SMAPoTN treatment downregulated hepatic antioxidative stress genes in both the NC and HFD feeding groups (Figure 2E). Als2, Gpx7, Hmx1, Adl1, Pdx4, Prnp, Ncf1, Pdx6, and Txd1, which are oxidative stress-signaling genes, were significantly suppressed with the SMAPoTN treatment, mainly in the NC group (Figure 2F).
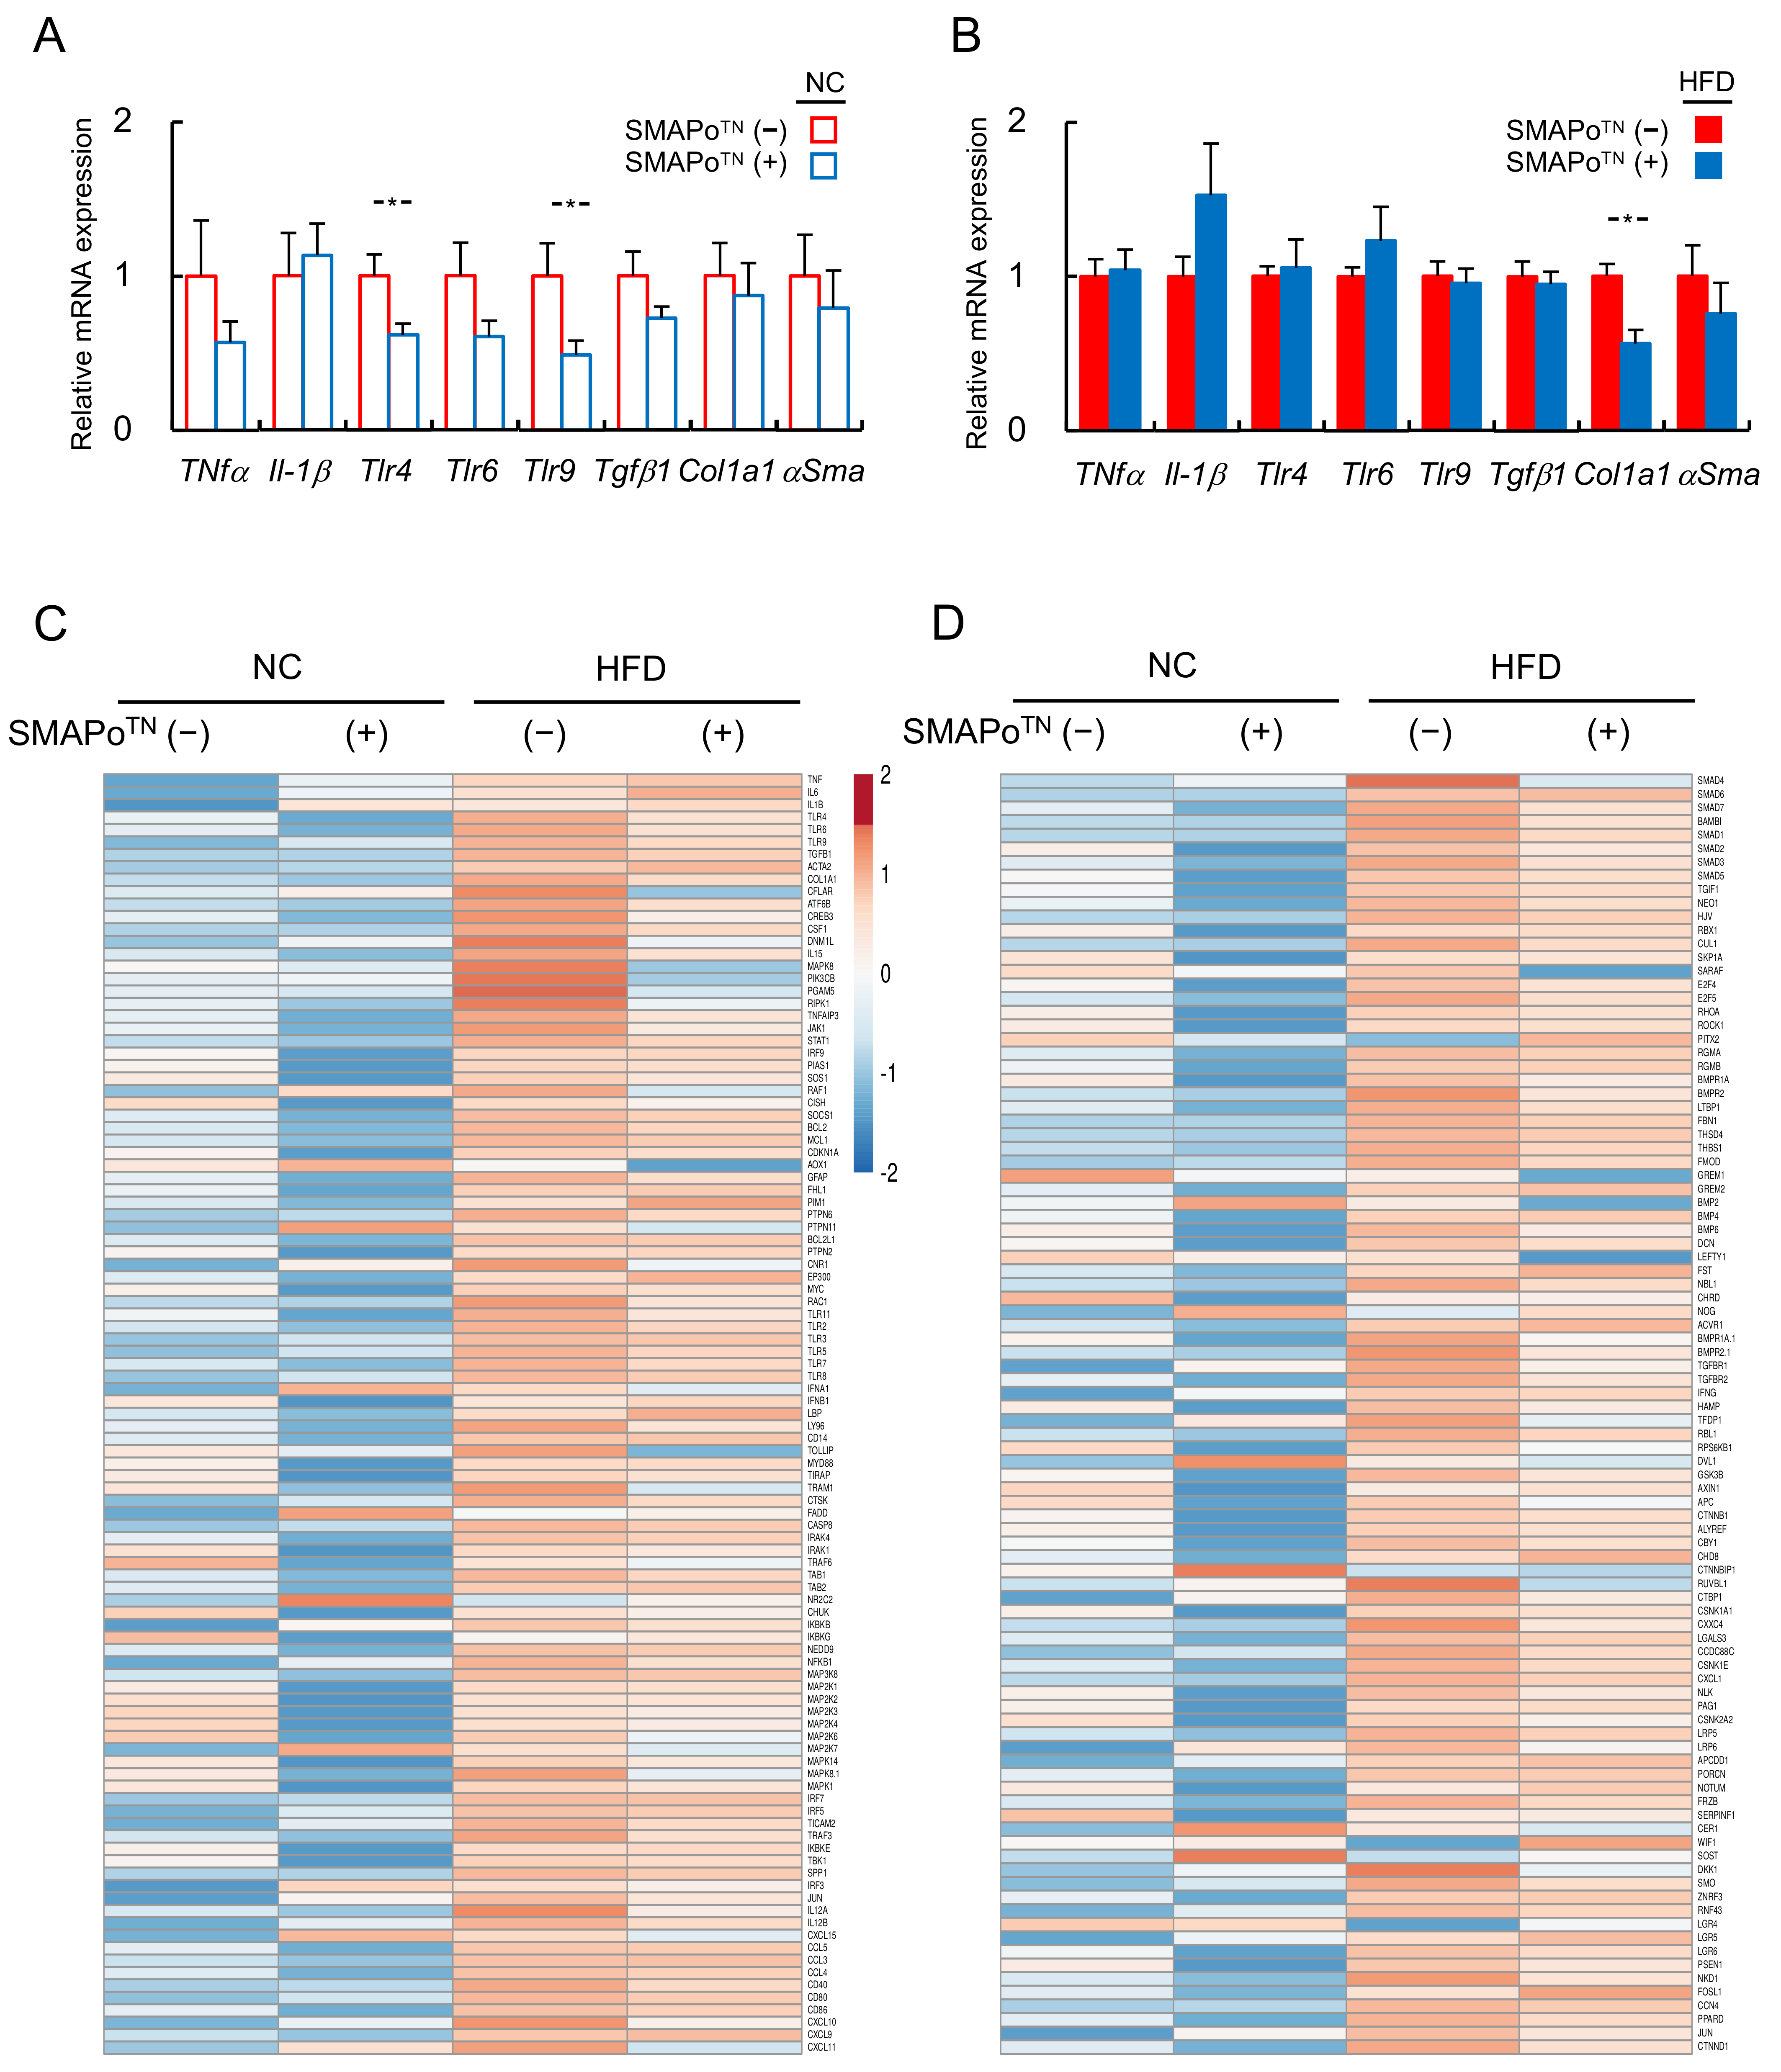
Hepatic mRNA expression levels of inflammatory cytokines (Tnf-α and Il-1β), Toll-like receptors (Tlr) 4, 6, and 9, and fibrosis-related genes (Tgf-β1, Col1a1, and αSma) were examined with qPCR (NC group in Figure 3A and the HFD group in Figure 3B). The mRNA levels of inflammatory cytokines and fibrosis-related genes tended to decrease, and Tlr 4 and 9 were significantly suppressed by the SMAPoTN treatment in the NC group (Figure 3A). In the HFD group, the mRNA of Col1a1 was significantly suppressed by the SMAPoTN treatment (Figure 3B).
We also evaluated the RNA levels of hepatic inflammatory- and fibrosis-related genes in the livers using RNA-seq analyses. The heatmap showed that the SMAPoTN treatment downregulated hepatic inflammatory-related signaling genes (Figure 3C) and fibrosis-related signaling genes (Figure 3D) in both the NC and HFD feeding groups. These results suggested that SMAPoTN inhibited hepatic inflammation and fibrosis by reducing OS at an early stage prior to the development of NASH and hepatocarcinogenesis.

3.4. TG and FAs in the Livers of Mice with Steatohepatitis

The changes in lipid content and FA composition of liver tissues after the SMAPoTN treatment are shown in Table 1. Consistent with liver histology (Figure 1C,D), in the NC feeding group, the TG content in the livers with the SMAPoTN treatment tended to increase compared with that in the nontreatment group. In the HFD group, the TG content in the livers with the SMAPoTN treatment tended to decrease compared with that in the nontreatment group, but there was no significant difference (upper part of Table 1). The FFA content in the livers did not differ between the SMAPoTN treatment and nontreatment in both the NC and HFD feeding groups (upper part of Table 1). Furthermore, we measured the FFA composition in the livers (lower part of Table 1). Arachidic acid (C20:0) was slightly but significantly increased by the SMAPoTN treatment in the HFD feeding group. Eicosadienoic acid (C20:2) was slightly but significantly decreased by the SMAPOTN treatment in the HFD feeding group. However, the composition of almost all other FAs was unchanged following the SMAPoTN treatment in both the NC and HFD feeding groups.

3.5. RNA-Seq Analyses of the Livers to Evaluate the Efficacy of SMAPoTN against the Development of NASH and HCC

We examined the mechanisms underlying the changes in gene expression induced by the SMAPoTN treatment by conducting RNA-seq analyses. With a mean transcripts per million (TPM) value ≥1 as the selection criterion, we selected 11,529 genes in the NC groups and 13,072 genes in the HFD groups (Table 2, upper panel). Differentially expressed genes in nontreatment mice vs. SMAPoTN treatment mice were evaluated, and 10.3% of genes in the NC group and 8.2% of genes in the HFD group were altered in the livers (Table 2A). Subsequently, to further confirm the potential effects of the SMAPoTN treatment on NASH and hepatocarcinogenesis, KEGG pathway analyses were performed. The top three significantly differentially expressed signaling pathways are shown in Table 2B. The metabolic (138 genes, 11.6%), biosynthesis (35 genes, 3.0%), and ER stress pathways (33 genes, 2.8%) were extracted in the NC group, and ER stress (41 genes, 3.8%), spliceosome (33 genes, 3.1%), and cancer pathways (32 genes, 3.0%) were extracted in the HFD group (Table 2B). Interestingly, the ER stress pathway was detected as a common pathway changed by the SMAPoTN treatment in both the NC and HFD groups.

3.6. SMAPoTN Treatment Downregulates ER Stress Pathway Genes

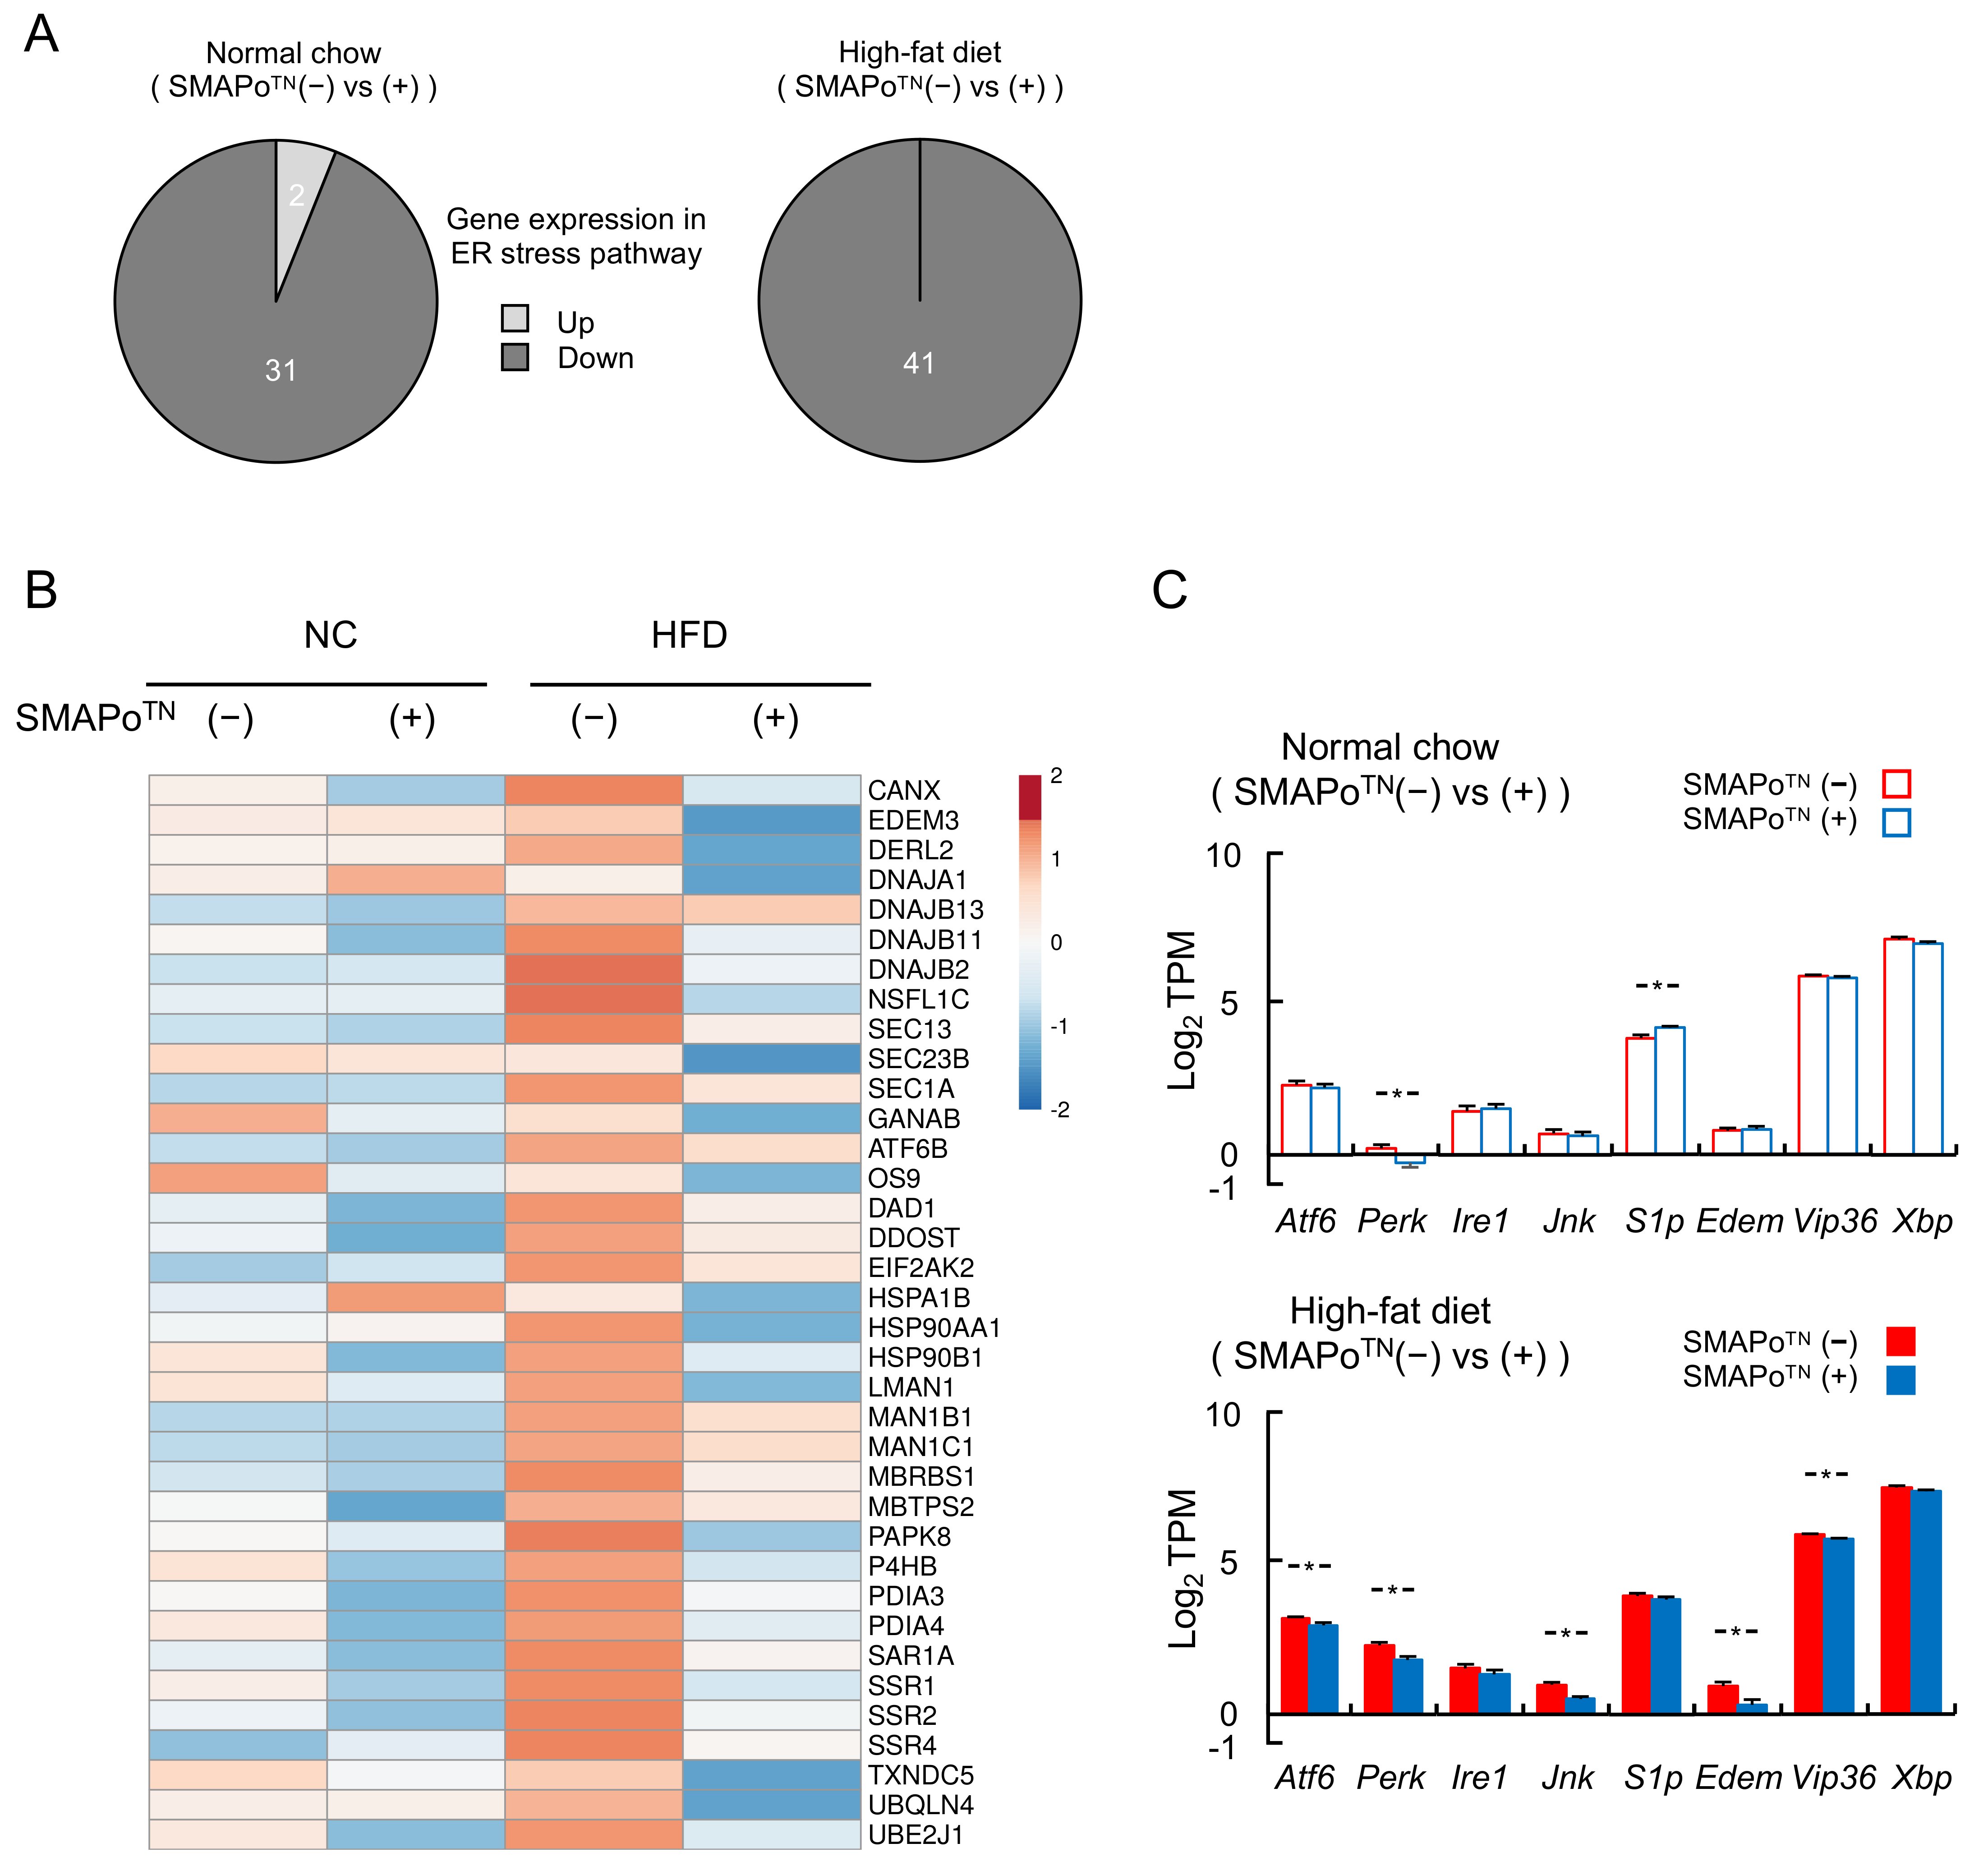
Figure 4 shows the ER stress pathway genes altered by the SMAPoTN treatment in RNA-seq analyses. The SMAPoTN treatment downregulated almost all ER stress pathway genes in both the NC and HFD groups (Figure 4A), and the heatmap of the ER stress pathway also showed that the SMAPoTN treatment decreased RNA expression (Figure 4B). Moreover, Atf6, Perk, Jnk, Edem, and Vip36, which are ER stress sensors and ER stress-related genes, were significantly suppressed by the SMAPoTN treatment, mainly in the HFD group (Figure 4C). In contrast, the content of TG and nonesterified FA in the livers did not differ between the NC and HFD groups with or without the SMAPoTN treatment (upper part of Table 1), and the FA composition in the livers was not changed by the SMAPoTN treatment (lower part of Table 1). These results suggested that SMAPoTN has protective effects against NASH by reducing not only OS, but also ER stress without significant changes in FA and TG accumulation in the livers.

3.7. SMAPoTN Treatment Downregulates Cancer Driver Genes and Cancer Pathway Genes

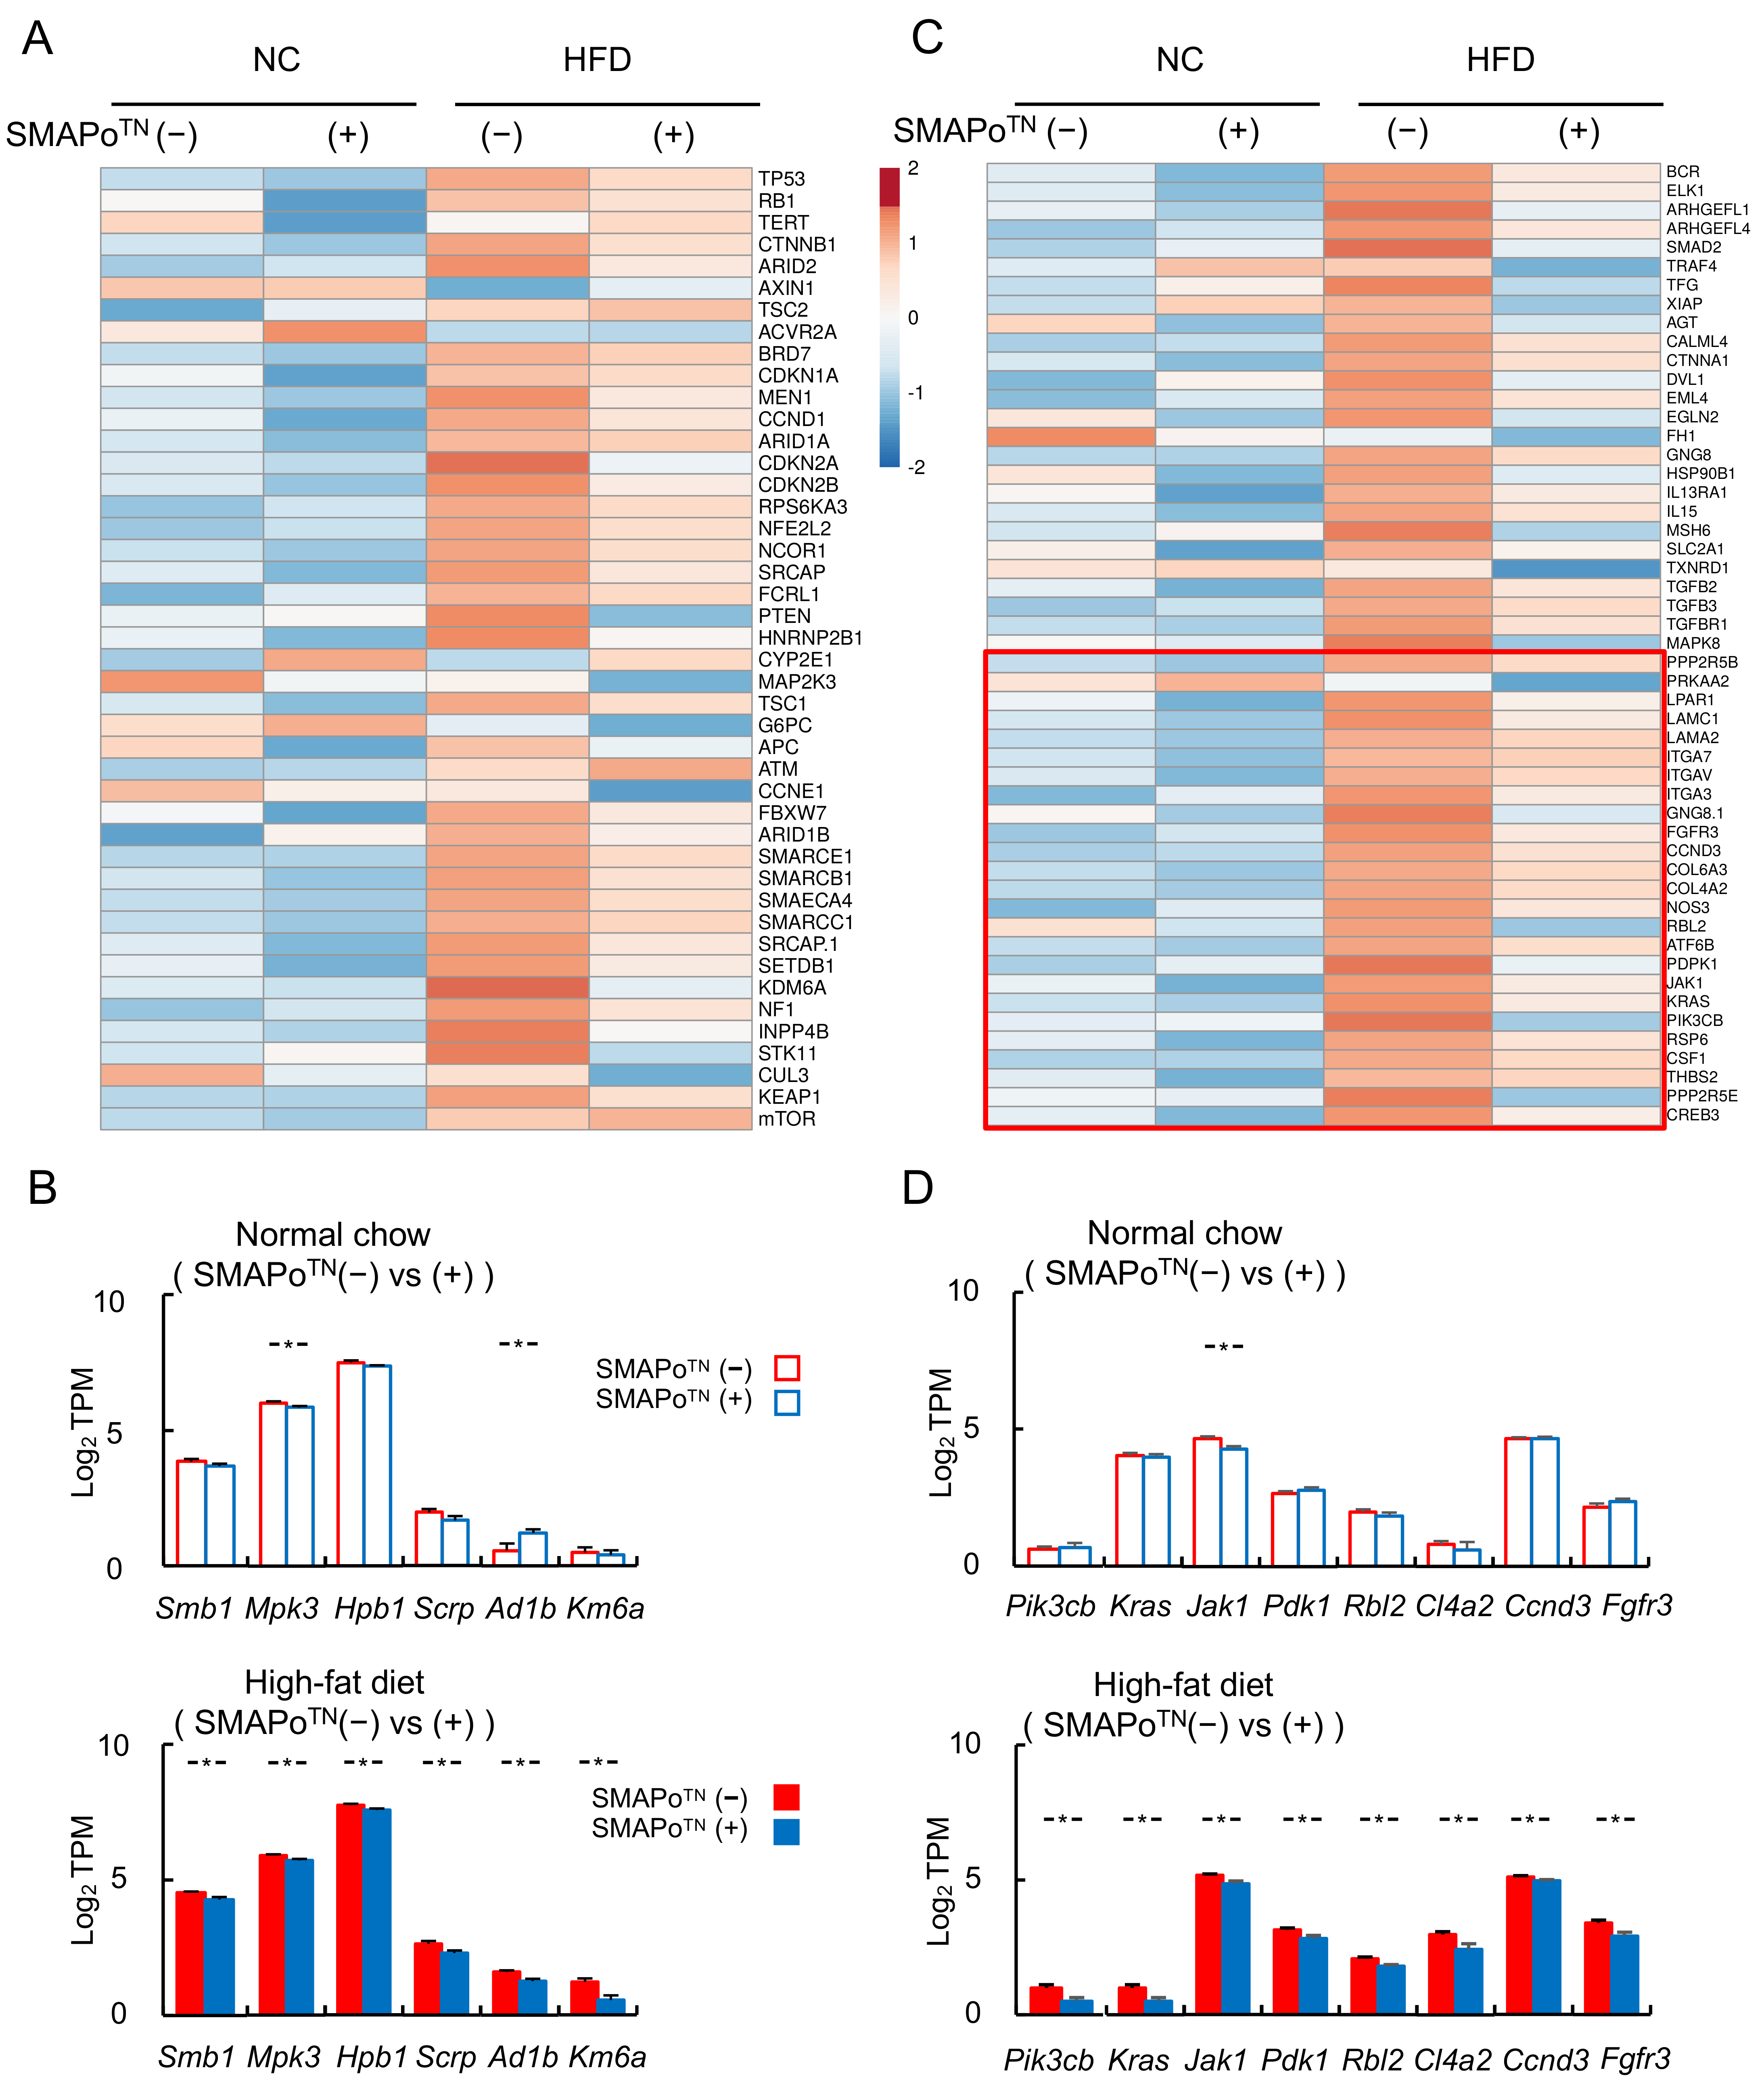
Hepatocarcinogenesis and HCC development from NASH are associated with changes in cancer driver genes and cancer pathway genes [10,11]. Figure 5A shows the heatmap of cancer driver genes changed by the SMAPoTN treatment in RNA-seq analyses. The SMAPoTN treatment downregulated HCC driver genes in the HFD group. Moreover, cancer driver genes, such as Smb1, Mpk3, Hpb1, Scrp, Ad1b, and Km6a, were significantly suppressed by the SMAPoTN treatment, mainly in the HFD group, but not in the NC group (Figure 5B). In addition, the cancer pathway genes in the KEGG analyses were downregulated by the SMAPoTN treatment in the HFD group (Figure 5C and Table 1), and the downregulated genes included the PI3K-Akt signaling genes (Figure 5C, lower red column). PI3K-Akt signaling genes, such as Pik3cb, Kras, Jak1, Pdk1, Rbl2, Cl4a2, Ccnd3, and Fgfr3, were significantly decreased by the SMAPOTN treatment in the HFD group (Figure 5D, lower panel).

3.8. SMAPoTN Treatment Decreases LPS by Improving Diversity and Changing the Microbiota Composition

LPS can affect the development of NASH and hepatocarcinogenesis in humans and DKO mice [8,9,33]. Thus, the levels of serum and fecal LPS were determined and are shown in Figure 6A. The SMAPoTN treatment tended to decrease both serum and fecal LPS levels in the NC group. In the HFD group, both serum and fecal LPS levels were increased compared with those in the NC group. Moreover, the SMAPoTN treatment significantly suppressed the LPS levels compared with those in the nontreatment group (Figure 6A). The protein expression levels of LBP in the livers did not differ between the NC group with or without the SMAPoTN treatment, but were decreased by the SMAPoTN treatment in the HFD group (Figure 6B).
To explore the effect of the SMAPoTN treatment on LPS production, fecal microbiota composition was determined. The α-diversity of the fecal microbiota was decreased by the HFD feeding; however, the SMAPoTN treatment significantly improved the alpha diversity in the HFD group (Figure 6C). At the phylum level, the SMAPoTN treatment tended to increase the percentage of Bacteroidetes and Firmicutes in both the NC and HFD groups (Figure 6D, left panel). At the family level, the percentage of LPS-producing bacteria, such as Ruminococcaceae, Porphyromonadaceae, and Desulfovibrionaceae, was increased by the HFD feeding. Conversely, the HFD feeding tended to decrease Paraprevotallaceae in SMAPOTN (+). Among probiotic-related bacteria, the percentage of Lachnospiraceae was increased, and the percentage of Lactobacillaceae was decreased by the HFD feeding (Figure 6D, right panel). The percentages of Enterobacteriaceae, which are LPS-producing bacteria, and Streptococcaceae, which are probiotic-related bacteria, were low (Figure 6D, right panel).
Figure 5E shows the populations of microbiota at the family level that were changed by the SMAPoTN treatment compared with those in the nontreatment group. In the NC group, the populations of LPS-producing bacteria and probiotic-related bacteria did not differ between the SMAPoTN treatment and nontreatment groups. In the HFD group, the SMAPoTN treatment tended to decrease the populations of Paraprevotellaceae (−46.8%, p = 0.089), Ruminococcaceae (−6.0%, p = 0.781), and Enterobacteriaceae (−67.2%, p = 0.194), which are LPS-producing bacteria (Figure 6E, left panel), but these changes were not significant. In contrast, the SMAPoTN treatment tended to increase the populations of Lactobacillaceae (+61.6%, p = 0.226), Lachnospiraceae (+9.6%, p = 0.586), and Lactobacillus (+61.5%, p = 0.230), which are probiotic-related bacteria (Figure 5E, right panel). These results indicated that SMAPoTN might alter microbiota, such as LPS-producing and probiotic-related bacteria, reduce LPS production in feces, decrease the LPS flux into the liver, and suppress the development of NASH and hepatocarcinogenesis.

4. Discussion

In this study, we demonstrated that the SMAPoTN treatment attenuated NASH in DKO mice fed NC (NASH model) and prevented the development of HCC in DKO mice fed a HFD (HCC model). SMAPoTN, which was developed using redox polymers containing antioxidant nitroxide radicals, inhibited inflammation and fibrosis in the livers through a mechanism associated with the reduction in ROS. Furthermore, we demonstrated that the SMAPoTN treatment decreased ER stress-related genes, HCC driver genes, and cancer pathway genes.
A key point was that the mouse model used in this study had a metabolic profile highly relevant to human metabolic obesity, NASH, and HCC, consistent with the multiple parallel hits theory [4]. In the present work, male DKO mice spontaneously developed NASH and 10% of DKO mice developed HCCs by 50 weeks of age following NC feeding [26]. Moreover, DKO mice developed severe NASH and 33% of DKO mice developed well-differentiated HCC with severe obesity after the HFD feeding (Figure 1). DKO mice exhibited a phenotype more similar to human NASH than previous NASH models.
Several antioxidants, such as vitamin C, vitamin E, and glutathione, have not shown therapeutic effects on the development of NASH, especially in terms of clinical liver inflammation and fibrosis [17,18]. Similarly, several previously tested low-molecular-weight antioxidant compounds integrated before reaching target organs (the livers in NASH) and could not achieve the desired effects. Since SMAPoTN possesses a carboxylic acid in each repeating unit, it is ionized under high pH areas, such as the small intestine, to result in internalization in the blood stream after disintegration and, finally, it accumulates in the liver for an extended period of time, as stated above.
In a previous study, another type of antioxidant nanoparticle treatment, RNPN, improved liver inflammation and fibrosis in a NASH model fed a choline-deficient amino acid-defined diet without obesity and HCC [30]. In the present study, we demonstrated the protective effect of the SMAPoTN treatment against inflammation and fibrosis in a model with a profile similar to human NASH. Moreover, the ER stress pathway was detected as a new mechanism underlying the SMAPoTN treatment effects on the development of not only NASH, but also HCC. Recent studies have shown that the three branches of the unfolded protein response in ER stress, including PERK, IRE1α, and ATF6, cross-talk with the transcription factor NF-κB, activate inflammatory signaling pathways (e.g., TNFα), and further recruit JNK to activate cell apoptosis [37], with ER stress influencing hepatocarcinogenesis [7]. In this study, the SMAPoTN treatment decreased Perk in the NC group and Atf6, Perk, Jnk, Edem, and Vip36 in the HFD feeding group. These results indicated that the SMAPoTN treatment suppressed ER stress and OS and prevented the development of NASH and HCC.
HCC is induced by hepatic inflammation and fibrosis in NASH [3], and several cancer driver genes and cancer pathway genes are associated with hepatocarcinogenesis [10,11]. In the present study, a critical new finding was that SMAPoTN decreased multiple HCC driver genes and cancer pathway genes (Figure 5). Due to these decreases being mainly observed in the HFD group, SMAPoTN could indirectly suppress HCC by reducing inflammation and fibrosis in the liver. Nevertheless, our observation that SMAPoTN as antioxidants could suppress the development of HCC was not only of scientific interest, but also of potential clinical relevance, because there is currently no treatment for the prevention of HCCs.
In addition, PI3K-Akt-mTOR signaling genes in cancer pathways were significantly decreased by the SMAPoTN treatment in the HFD group. β-catenin, p53-Rb, and PI3K-Akt-mTOR pathways are major signaling pathways involved in genetic alterations in HCC [10,38]. PI3K activates the Akt signaling cascade, and Akt signaling plays a critical role in regulating diverse cellular functions, including metabolism, growth, proliferation, transcription, and protein synthesis, in both cancer cells and healthy cells [39]. The significant influence of SMAPoTN on PI3K-Akt-mTOR signaling observed in the HFD group indicated that the SMAPoTN treatment might not directly affect PI3K signaling, but suppress the development of HCC induced by NASH by improving metabolic pathways, including insulin signaling associated with PI3K-Akt.
In the present study, we demonstrated that the SMAPoTN treatment decreased LPS levels and LPS flux into the liver of mice in the HFD group (Figure 6A,B). LPS from microbiota accelerates the development of NASH and HCC [4,6,8], and the inhibition of LPS suppresses the development of NASH [40]. Because some LPS-producing bacteria tended to decrease after the SMAPoTN treatment, it is possible that blood LPS and fecal LPS levels subsequently decreased, leading to a protective effect on the liver. Dysbiosis contributes to liver fibrogenesis by decreasing the diversity of microbiota and increasing the LPS flux from the intestines [41]. The SMAPoTN treatment improved the α-diversity and changed the composition of microbiota, including LPS-producing and probiotic-related bacteria (Figure 6C,D). In a previous study, a pH-insensitive RNPO treatment inhibited the increase in commensal bacteria by scavenging ROS [29]. We also found that the SMAPoTN treatment might increase some probiotic-related bacteria, such as lactate-producing Lactobacillaceae, which are known to protect intestinal barrier function [42]. Previous studies have reported that probiotic-related bacteria, including Lactobacillus and Bifidobacterium, increased the diversity of gut microbiota and decreased LPS, thereby reducing liver inflammation [43,44]. The results of the current study indicated that the SMAPoTN treatment had protective effects against not only NASH, but also HCC through the gut–liver axis by improving the gut microbiota diversity and decreasing the LPS flux from the intestines.

5. Conclusions

The oral administration of SMAPoTN attenuated NASH development and inhibited hepatocarcinogenesis in DKO mice. These benefits were attributed to the dual effects of SMAPoTN on the improvements in ER stress in the liver and microbiota in the intestine. SMAPoTN may be a new therapeutic option for not only NASH subjects, but also those with a high risk of HCC.

Author Contributions

Conceptualization, K.O., Y.N. and J.S.; methodology, K.O., Y.N. and J.S.; formal analysis, T.W., K.O., N.G. and H.S.; resources, Y.N.; data curation, T.W., K.O., I.M., K.T. (Keii To), S.T., E.W., N.G. and H.S.; writing—original draft preparation, T.W. and K.O.; writing—review and editing, T.W., K.O., I.M., K.T. (Keii To), S.T., E.W., N.K., K.Y., N.G., H.S., S.A., K.T. (Kiichiro Tsuchiya), Y.N. and J.S.; funding acquisition, H.S. and J.S. All authors have read and agreed to the published version of the manuscript.

Funding

This work was supported in part by JSPS KAKENHI (grant numbers JP21K07933, JP20K08275,} JP22K08072, JP21H03372, JP21K11668, JP21K07860 and 19H05458) and the Japanese Society of Gastroenterology (JSGE) Grant.

Institutional Review Board Statement

The animal study protocol was approved by the Institutional Review Board of the Institutional Animal Care and Use Committees of the University of Tsukuba (protocol code: 190097; date of approval: 25 July 2019).

Informed Consent Statement

Not applicable.

Data Availability Statement

Not applicable.

Acknowledgments

We thank Melissa Crawford from Edanz (https://jp.edanz.com/ac (accessed on 1 August 2022)) for editing a draft of this manuscript.

Conflicts of Interest

The authors declare that they have no conflicts of interest.

References

  1. Malecka-Tendera, E.; Mazur, A. Childhood obesity: A pandemic of the twenty-first century. Int. J. Obes. 2006, 30, S1–S3. [Google Scholar] [CrossRef] [PubMed]
  2. Farrell, G.C.; Larter, C.Z. Nonalcoholic fatty liver disease: From steatosis to cirrhosis. Hepatology 2006, 43, 99–112. [Google Scholar] [CrossRef] [PubMed]
  3. Bugianesi, E.; Leone, N. Expanding the natural history of nonalcoholic steatohepatitis: From cryptogenic cirrhosis to hepatocellular carcinoma. Gastroenterology 2002, 123, 134–140. [Google Scholar] [CrossRef] [PubMed]
  4. Tilg, H.; Moschen, A.R. Evolution of inflammation in nonalcoholic fatty liver disease: The multiple parallel hits hypothesis. Hepatology 2010, 52, 1836–1846. [Google Scholar] [CrossRef] [PubMed]
  5. Brahma, M.K.; Gilglioni, E.H. Oxidative stress in obesity-associated hepatocellular carcinoma: Sources, signaling and therapeutic challenges. Oncogene 2021, 40, 5155–5167. [Google Scholar] [CrossRef] [PubMed]
  6. Borrelli, A.; Bonelli, P. Role of gut microbiota and oxidative stress in the progression of non-alcoholic fatty liver disease to hepatocarcinoma: Current and innovative therapeutic approaches. Redox Biol. 2018, 15, 467–479. [Google Scholar] [CrossRef]
  7. Lebeaupin, C.; Vallee, D. Endoplasmic reticulum stress signaling and the pathogenesis of non-alcoholic fatty liver disease. J. Hepatol. 2018, 69, 927–947. [Google Scholar] [CrossRef]
  8. Dapito, H.; Mencin, A. Promotion of Hepatocellular Carcinoma by the Intestinal Microbiota and TLR4. Cancer Cell 2012, 21, 504–516. [Google Scholar] [CrossRef]
  9. Zhou, A.; Tang, L. Gut microbiota: A new piece in understanding hepatocarcinogenesis. Cancer Lett. 2020, 474, 15–22. [Google Scholar] [CrossRef]
  10. Totoki, Y.; Tatsuno, K. Trans-ancestry mutational landscape of hepatocellular carcinoma genomes. Nat. Genmetics. 2014, 46, 1267–1276. [Google Scholar] [CrossRef]
  11. Schulze, K.; Imbeaud, S. Exome sequencing of hepatocellular carcinoma identifies new mutational signatures and potential therapeutic targets. Nat. Genetics. 2015, 47, 505–511. [Google Scholar] [CrossRef]
  12. Defour, J.E.; Caussy, C. Combibation Therapy for Non-Alcoholic Steathepatitis: Rationale, Opportunities and Challenges. Gut 2020, 69, 1877–1884. [Google Scholar] [CrossRef]
  13. Cardoso, A.C.; Sanyal, A.J. New Drugs for Non-Alcoholic Steatohepatitis. Liver Int. 2020, 40, 96–101. [Google Scholar] [CrossRef]
  14. Cusi, K. Role of obesity and lipotoxicity in the development of nonalcoholic steatohepatitis: Pathophysiology and clinical implications. Gastroenterology 2012, 142, 711–725. [Google Scholar] [CrossRef] [PubMed]
  15. Margini, C.; Dufour, J.F. The story of HCC in NAFLD: From epidemiology, across pathogenesis, to prevention and treatment. Liver Int. 2016, 36, 317–324. [Google Scholar] [CrossRef] [PubMed]
  16. Farazi, P.A.; DePinho, R.A. Hepatocellular carcinoma pathogenesis: From genes to environment. Nat. Rev. Cancer 2006, 6, 674–687. [Google Scholar] [CrossRef] [PubMed]
  17. Sanyal, A.J.; Chalasani, N. Pioglitazone, vitamin E, or placebo for nonalcoholic steatohepatitis. N. Engl. J. Med. 2010, 362, 1675–1685. [Google Scholar] [CrossRef]
  18. Lavine, J.E.; Schwimmer, J.B. Effect of vitamin E or metformin for treatment of nonalcoholic fatty liver disease in children and adolescents: The TONIC randomized controlled trial. JAMA 2011, 305, 1659–1668. [Google Scholar] [CrossRef]
  19. Italian Association for the Study of the Liver (AISF). AISF Position Paper on Nonalcoholic Fatty Liver Disease (NAFLD): Updates and Future Directions. Dig. Liver Dis. 2017, 49, 471–483. [Google Scholar] [CrossRef]
  20. Estes, C.; Anstee, Q.M. Modeling NAFLD disease burden in China, France, Germany, Italy, Spain, United Kingdom, and United States for the period 2016–2030. J. Hepatol. 2013, 69, 896–904. [Google Scholar] [CrossRef]
  21. Tateishi, R.; Uchino, K. A Nationwide survey on non-B, non-C hepatocellular Carcinoma in Japan: 2011–1015 update. J. Gastroenterol. 2019, 54, 367–376. [Google Scholar] [CrossRef]
  22. Reddy, J.K.; Rao, M.S. Lipid metabolism and liver inflammation. II. Fatty liver diseases and fatty acid oxidation. Am. J. Physiol. Gastrointest. Liver Pysiol. 2006, 29, G852–G858. [Google Scholar] [CrossRef]
  23. Neuschwander-Tetri, B.A.; Caldwell, S.H. Nonalcoholic steatohepatitis: Summary of an AASLD Single Topic Conference. Hepatology 2003, 37, 1202–1219. [Google Scholar] [CrossRef]
  24. Yuksel, B.C.; Serdar, S.E.; Tuncel, A. Effect of tempol, a membrane-permeable radical scavenger, on mesenteric blood flow and organ injury in a murine cecal ligation and puncture model of septic shock. Eur. Surg. Res. 2009, 43, 219–227. [Google Scholar] [CrossRef]
  25. Soule, B.P.; Hyodo, F.; Matsumoto, K. The chemistry and biology of nitroxide compounds. Free Radic. Biol. Med. 2007, 42, 1632–1650. [Google Scholar] [CrossRef]
  26. Nagasaki, Y. Nitroxide radicals and nanoparticles: A partnership for nanomedicine radical delivery. Ther. Deliv. 2012, 3, 165–179. [Google Scholar] [CrossRef]
  27. Shimizu, M.; Yoshitomi, T.; Nagasaki, Y. The behavior of ROS-scavenging nanoparticles in blood. J. Clin. Biochem. Nutr. 2014, 54, 166–173. [Google Scholar] [CrossRef]
  28. Monti, E.; Supino, R.; Colleoni, M. Nitroxide TEMPOL impairs mitochondrial function and induces apoptosis in HL60 cells. J. Cell. Biochem. 2001, 82, 271–276. [Google Scholar] [CrossRef]
  29. Vong, L.B.; Nagasaki, Y. Oral nanotherapeutics: Effect of redox nanoparticle on. microflora in mice with dextran sodium sulfate-induced colitis. J. Gastroenterol. 2014, 49, 806–813. [Google Scholar] [CrossRef]
  30. Eguchi, A.; Ngasaki, Y. Redox nanoparticles as a novel treatment approach for inflammation and fibrosis associated with nonalcoholic steatohepatitis. Nanomedicine 2015, 10, 2697–2708. [Google Scholar] [CrossRef] [Green Version]
  31. Piguet, A.C.; Saran, U. Regular exercise decreases liver tumors development in hepatoicyte-specific PTEN-deficient mice independently of steatosis. J. Hepatol. 2015, 62, 1296–1303. [Google Scholar] [CrossRef]
  32. Arfianti, A.; Pok, S. Exercise retards hepatocarcinogenesis in obese mice independently of weight control. J. Hepatol. 2020, 73, 140–148. [Google Scholar] [CrossRef]
  33. Akiyama, K.; Warabi, E. Deletion of both p62 and Nrf2 spontaneously results in the development of nonalcoholic steatohepatitis. Exp. Anim. 2018, 67, 201–218. [Google Scholar] [CrossRef]
  34. Bedossa, P.; Poitou, C. Histopathological algorithm and scoring system for evaluation of liver lesions in morbidly obese patients. Hepatology 2012, 56, 1751–1759. [Google Scholar] [CrossRef]
  35. Okada, K.; Shoda, J. Nrf2 inhibits hepatic iron accumulation and counteracts oxidative stress-induced liver injury in nutritional steatohepatitis. J. Gastroenterol. 2012, 47, 924–935. [Google Scholar] [CrossRef]
  36. Gotoh, N.; Nagao, K. Effects of three different highly purified n-3 series highly unsaturated fatty acids on lipid metabolism in C57BL/KsJ-db/db mice. J. Agric. Food Chem. 2009, 57, 11047–11054. [Google Scholar] [CrossRef]
  37. Lin, Y.; Jiang, M. Cancer and ER stress: Mutual crosstalk between autophagy, oxidative stress and inflammatory response. Biomed. Pharmacother. 2019, 118, 109249. [Google Scholar] [CrossRef]
  38. Bidkhori, G.; Benfeitas, R. Metabolic network-based stratification of hepatocellular carcinoma reveals three distinct tumor subtypes. Proc. Natl. Acad. Sci. USA 2018, 115, 11874–11883. [Google Scholar] [CrossRef]
  39. Haddadi, N.; Lin, Y. PTEN/PTENP1: Regulating the regulator of RTK-dependent PI3K/Akt signaling, new targets for cancer therapy. Mol. Cancer 2018, 17, 37. [Google Scholar] [CrossRef]
  40. Tsuji, Y.; Yoshiji, H. Bile Acid Sequestrant, Sevelamer Ameliorates Hepatic Fibrosis with Reduced Overload of Endogenous Lipopolysaccharide in. Experimental Nonalcoholic Steatohepatitis. Microorganisms 2020, 8, 925. [Google Scholar] [CrossRef]
  41. Minicis, D.S.; Rychlicki, C. Dysbiosis Contributes to Fibrogenesis in Course of Chronic Liver Injury in Mice. Hepatology 2014, 59, 1738–1749. [Google Scholar] [CrossRef] [PubMed]
  42. Li, S.; Qi, C. Lactobacillus reuteri improves gut barrier function and affects diurnal variation of the gut microbiota in mice fed a high-fat diet. Food Funct. 2019, 10, 4705–4715. [Google Scholar] [CrossRef] [PubMed]
  43. Hutchinson, N.A.; Tingo, L. The Potentials Effects of Probiotics and ω-3 Fatty Acids on Chronic Low-Grade Inflammattion. Nutrients 2020, 12, 2402. [Google Scholar] [CrossRef] [PubMed]
  44. Rodes, L.; Khan, A. Effect of Probiotics Lactobacillus and Bifidobacterium on Gut-Derived Lipopolysaccharides and Inflammatory Cytokines: An In Vitro Study Using a Human Colonic Microbiota Model. J. Microbiol. Biotechnol. 2013, 23, 518–526. [Google Scholar] [CrossRef] [Green Version]
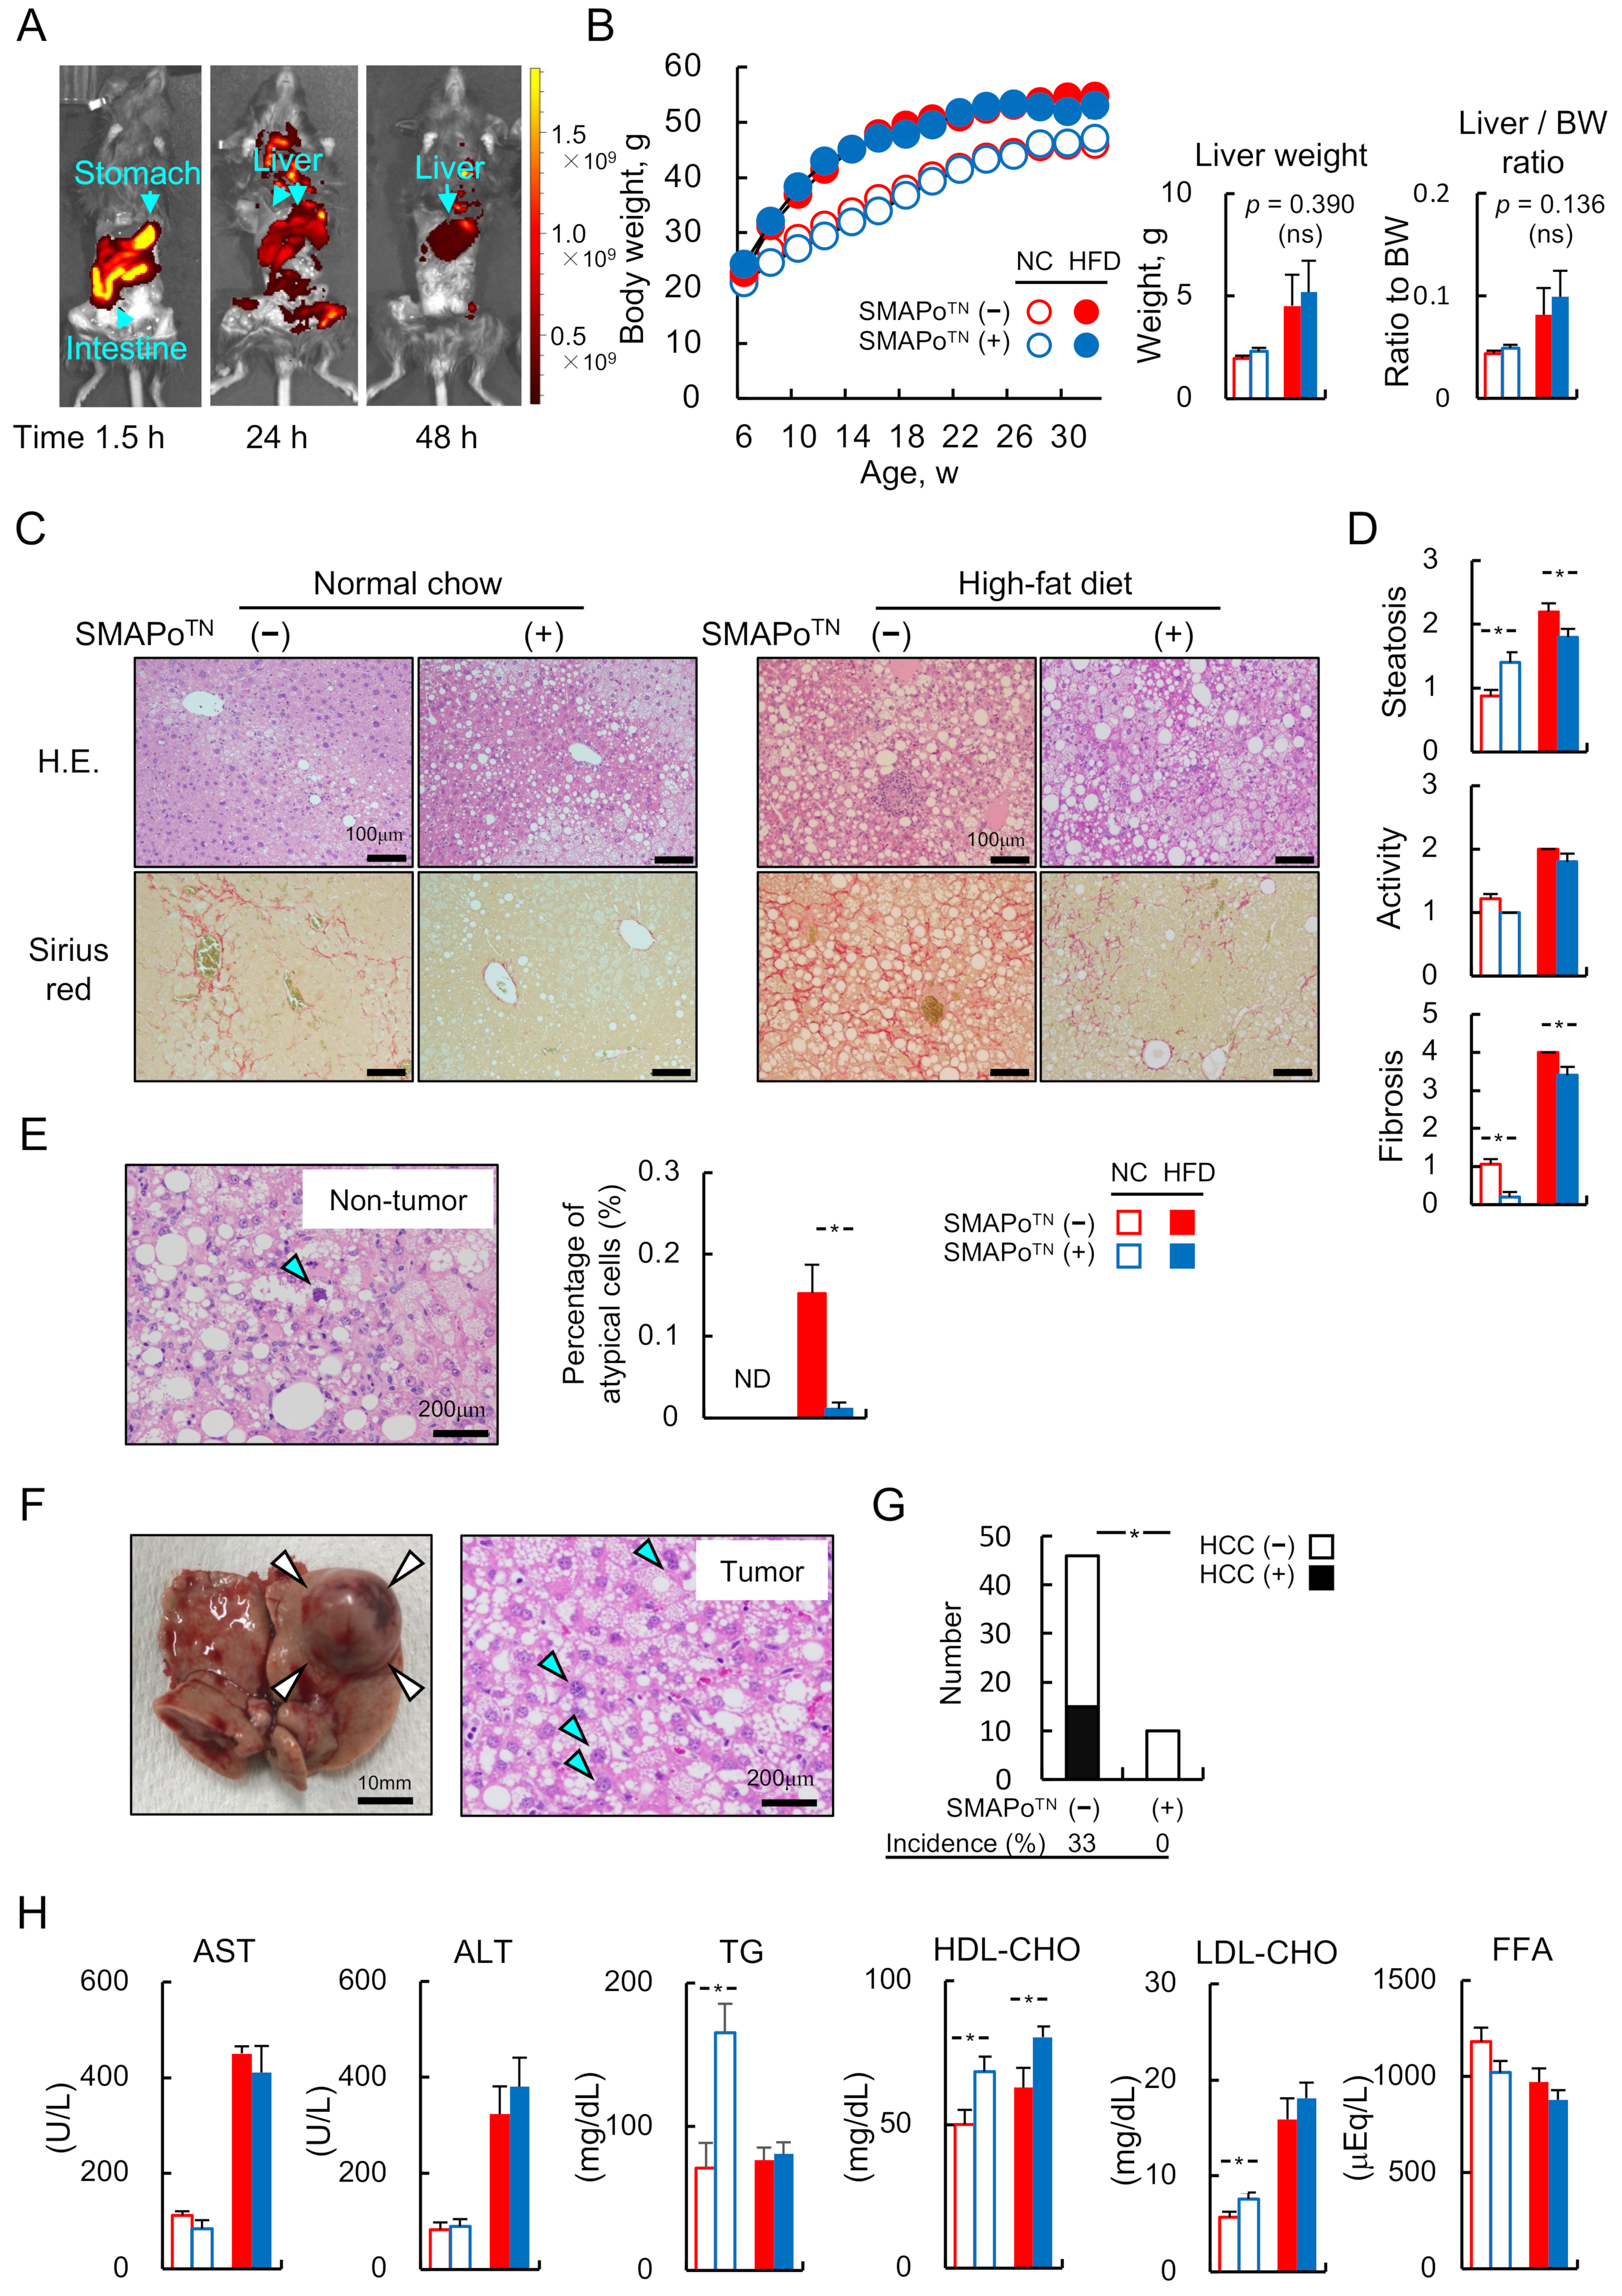
Figure 1. SMAPoTN treatment suppresses liver fibrosis and hepatocellular carcinoma without body weight changes and side effects. (A) Rhodamine-labeled SMAPoTN was detected using intelligent visual information system (IVIS) analysis from 1.5 h to 48 h after administration. The color scale indicates the radiant efficiency of rhodamine-labeled SMAPoTN with the IVIS (p/s/cm2/sr/µ/cm2). (B) Time course of changes in body weight during the experimental period from 6 weeks of age to 32 weeks of age (left panel) and liver weight (center panel) and liver/body ratio (right panel) at the end of the experiment in DKO mice fed NC or HFD with or without SMAPoTN treatment (n = 10–13/group). (C) Histopathology of steatohepatitis in DKO mice fed NC or HFD with or without SMAPoTN treatment. Hematoxylin and eosin (HE)-stained sections (upper panels) and Sirius-Red-stained sections (lower panels) of liver specimens at 32 weeks of age (scale bar, 100 µm). (D) The steatosis (left), activity (center), and fibrosis (right) (SAF) scores (n = 10–13/group). (E) HE-stained sections of atypical cells with large nuclei in the nontumor area in DKO mice fed the HFD without SMAPoTN treatment (left panel, blue arrow) and the percentage of atypical cells (right panel, n = 10–13/group). (F) A macroscopic view of hepatocellular carcinoma (HCC) in DKO mice fed HFD without SMAPoTN treatment (left panel, white arrows) and HE-stained section (right panel, blue arrows show cancer cells with larger nuclei). (G) Comparison of tumor numbers between SMAPoTN treatment and non-SMAPoTN groups. Sixteen DKO mice of forty-five fed the HFD without SMAPoTN treatment developed HCC. Conversely, no DKO mice among 10 treated with SMAPoTN developed HCC. (H) Analysis of blood biochemistry (aspartate aminotransferase (AST), alanine aminotransferase (ALT), triglyceride (TG), high-density lipoprotein cholesterol (HDL-CHO), low-density lipoprotein cholesterol (LDL-CHO), and free fatty acid (FFA)) in DKO mice fed NC or HFD with or without SMAPoTN treatment at 32 weeks of age (n = 10–13/group). Error bars represent SEM. ND; not determined; * p < 0.05 indicates a significant difference between DKO mice with or without SMAPoTN treatment.
Antioxidants 11 01939 g001
Figure 2. SMAPoTN treatment suppresses oxidative stress. (A) GSSG/GSH concentrations in the livers of DKO mice fed the NC or HFD with or without SMAPoTN treatment at 32 weeks of age (n = 10/group). (B) SOD activity in the livers of DKO mice fed the NC or HFD with or without SMAPoTN treatment at 32 weeks of age (n = 10/group). (C) Malondialdehyde (MDA) concentrations in the livers of DKO mice fed the NC or HFD with or without SMAPoTN treatment at 32 weeks of age (n = 10/group). (D) Immunoblot analysis of hexanoyl-lysine (HEL) in the livers of mice fed the NC or HFD with or without SMAPoTN treatment at 32 weeks of age. β-Actin was used as a loading control. The data below the band show the ratio of HEL/β-actin normalized to that of SMAPoTN in NC or HFD groups. (E) Heatmap of 80 genes involved in oxidative stress signaling in the livers of DKO mice fed the NC or HFD with or without SMAPoTN treatment analyzed with RNA-seq. (F) Histograms showing the expression of oxidative stress-related genes that were significantly downregulated with SMAPoTN treatment in NC or HFD groups (n = 8/group). Error bars represent SEM. * p < 0.05 indicates a significant difference between DKO mice with or without SMAPoTN treatment.
Antioxidants 11 01939 g002
Figure 3. SMAPoTN treatment suppresses activation of hepatic inflammatory and fibrotic signaling. qPCR analyses of inflammatory cytokines (Tnfα and Il1β), Toll-like receptor (Tlr) 4, 6, and 9, and fibrosis-related genes (Tgfβ1, Col1a1, and αSma) in the livers of mice fed NC (A) or HFD (B) (n = 10/group). A heatmap of 104 genes involved in inflammatory signaling (C) and a heatmap of 94 genes involved in fibrosis signaling (D) in the livers of DKO mice fed NC or HFD with or without SMAPoTN treatment analyzed with RNA-seq are shown (n = 8/group). Error bars represent SEM. * p < 0.05 indicates a significant difference between DKO mice with or without SMAPoTN treatment.
Antioxidants 11 01939 g003
Figure 4. SMAPoTN administration reduces the expression of ER stress-response-related genes. (A) The number of genes upregulated or downregulated by SMAPoTN treatment in the ER stress pathway analyzed with RNA-seq. (B) A heatmap of 36 genes involved in the ER stress pathway analyzed with RNA-seq. (C) Histograms of gene expression levels in the representative ER stress pathway of the liver analyzed with RNA-seq (n = 8/group). Gene expression levels were shown by the mean transcripts per million (TPM). Error bars represent SEM. * p < 0.05 indicates a significant difference between DKO mice with or without SMAPoTN treatment.
Antioxidants 11 01939 g004
Figure 5. SMAPoTN treatment reduces the expression of cancer driver genes and cancer pathway-related genes. (A) A heatmap of 44 cancer driver genes analyzed with RNA-seq. (B) Histograms showing the expression of cancer driver genes that were significantly downregulated by SMAPoTN treatment in HFD groups (n = 8/group). (C) A heatmap of 51 cancer pathway-related genes in KEGG. The lower red column shows PI3K-Akt signaling pathway-related genes. (D) Histograms showing the expression of cancer pathway-related genes that were significantly downregulated by SMAPoTN treatment in HFD groups (n = 8/group). Error bars represent SEM. * p < 0.05 indicates a significant difference between DKO mice with or without SMAPoTN treatment.
Antioxidants 11 01939 g005
Figure 6. Effects of SMAPoTN treatment on lipopolysaccharide (LPS) and gut microbiota in DKO mice. (A) Serum (left panel) and fecal (right) LPS concentrations in DKO mice fed NC or HFD with or without SMAPoTN treatment at 32 weeks of age (n = 10/group). (B) Immunoblot analysis of LPS-binding protein (LBP) in the livers of DKO mice fed NC or HFD with or without SMAPoTN treatment at 32 weeks of age. The β-actin bands were used as loading controls. The data below the band show the ratio of LBP/β-actin normalized by SMAPoTN in NC or HFD groups. (C) Changes in α-diversity in gut microbiota (n = 10/group). (D) Relative abundances of predominant bacteria at the phylum level (left panel) and the family level (right panel). (E) Comparative analysis of the taxonomic composition of the microbial community at the family and higher levels. The left panel shows LPS-producing bacteria and the right panel shows probiotic-related bacteria. Error bars represent SEM. * p < 0.05 indicates a significant difference between DKO mice with or without SMAPoTN treatment. p < 0.05 indicates a significant difference between DKO mice fed NC or HFD.
Antioxidants 11 01939 g006
Table 1. Lipid content and FFA composition in liver tissues.
Normal ChowHigh-Fat Diet
SMAPoTN (−)SMAPoTN (+)SMAPoTN (−)SMAPoTN (+)
(n = 8)(n = 8)(n = 8)(n = 8)
TG content94.93±18.31117.13±8.71137.57±7.39112.75±10.88
(μmol/g liver)
FFA content8.51±1.1610.60±1.1410.44±0.509.65±0.91
(μmol/g liver)
FFA composition (mg/g liver)
C6:0 ND ND ND ND
C8:0 ND ND ND ND
C10:0 ND ND ND ND
C11:0 ND ND ND ND
C12:0 ND ND 0.03±0.010.04±0.01
C13:0 ND ND ND ND
C14:00.64±0.140.73±0.110.64±0.070.74±0.10
C14:10.04±0.000.05±0.010.04±0.010.06±0.01
C15:00.1±0.00.1±0.00.1±0.00.1±0.02
C15:1 ND ND ND ND
C16:029.12±5.8430.23±3.9528.82±2.9525.65±3.90
C16:16.66±1.757.75±1.455.16±0.675.11±0.86
C17:01.43±1.340.10±0.010.11±0.020.14±0.02
C17:1 ND ND ND ND
C18:0 ND ND ND ND
C18:1n949.04±12.7545.02±13.0557.16±10.4629.43±10.22
C18:2n612.68±3.4317.69±2.446.54±0.557.92±0.87
C18:3n60.21±0.050.21±0.030.16±0.020.13±0.02
C18:3n30.53±0.100.53±0.060.25±0.020.27±0.04
C20:00.26±0.070.20±0.030.06±0.000.15±0.05 *
C20:1n91.41±0.261.34±0.212.00±0.251.80±0.28
C20:20.23±0.030.24±0.021.05±0.100.77±0.08 *
C20:3n60.46±0.090.45±0.060.41±0.040.40±0.03
C20:4n6 ND ND ND ND
C20:3n3 ND ND ND ND
C20:5n30.26±0.060.26±0.040.09±0.010.09±0.01
C21:01.45±0.121.40±0.111.80±0.172.04±0.08
C22:0 ND ND ND ND
C22:1n9 ND ND ND ND
C22:2 ND ND 0.35±0.040.24±0.03
C22:6n32.47±0.362.36±0.170.88±0.130.98±0.12
C23:0 ND ND ND ND
C24:0 ND ND ND ND
C24:1n9 ND ND ND ND
Values are presented as the group means ± SEM (n = 8). ND; not determined; * p < 0.05, between DKO mice with or without SMAPOTN treatment.
Table 2. Gene expression changes induced by SMAPoTN treatment in RNA-seq analysis. (A)Number of genes that had a mean TPM above 1 and were significantly upregulated or downregulated (p < 0.05) by SMAPoTN. (B) Treatment in NC or HFD groups (n = 8/group). Top 3 genes in KEGG pathway analysis.
A
GroupNormal ChowHigh-Fat Diet
Gene number (TPM ≥ 1)11,52913,072
Differentially expressedUpDownTotal%UpDownTotal%
SMAPOTN (−) vs. (+)1671019118610.340103710778.2
B
GroupNormal Chow
(SMAPOTN (−) vs. (+))
High-Fat Diet
(SMAPOTN (−) vs. (+))
Variable number of pathway42Variable number of pathway28
Pathway (KEGG, top three)Genes (n)%Pathway (KEGG, top three)Genes (n)%
Metabolic pathways13811.6Endoplasmic reticulum413.8
Biosynthesis353.0Splicesome333.1
Endoplasmic reticulum332.8Cancer pathway323.0
Publisher’s Note: MDPI stays neutral with regard to jurisdictional claims in published maps and institutional affiliations.