
Reactive Species from Two-Signal Activated Macrophages Interfere with Their Oxygen Consumption Measurements

 ,
,  and
and 
Abstract
:1. Introduction
2. Materials and Methods
2.1. Cell Cultures and Treatments
2.2. Nitric Oxide Measurements
2.3. Metabolic Assays
2.4. Statistics
3. Results
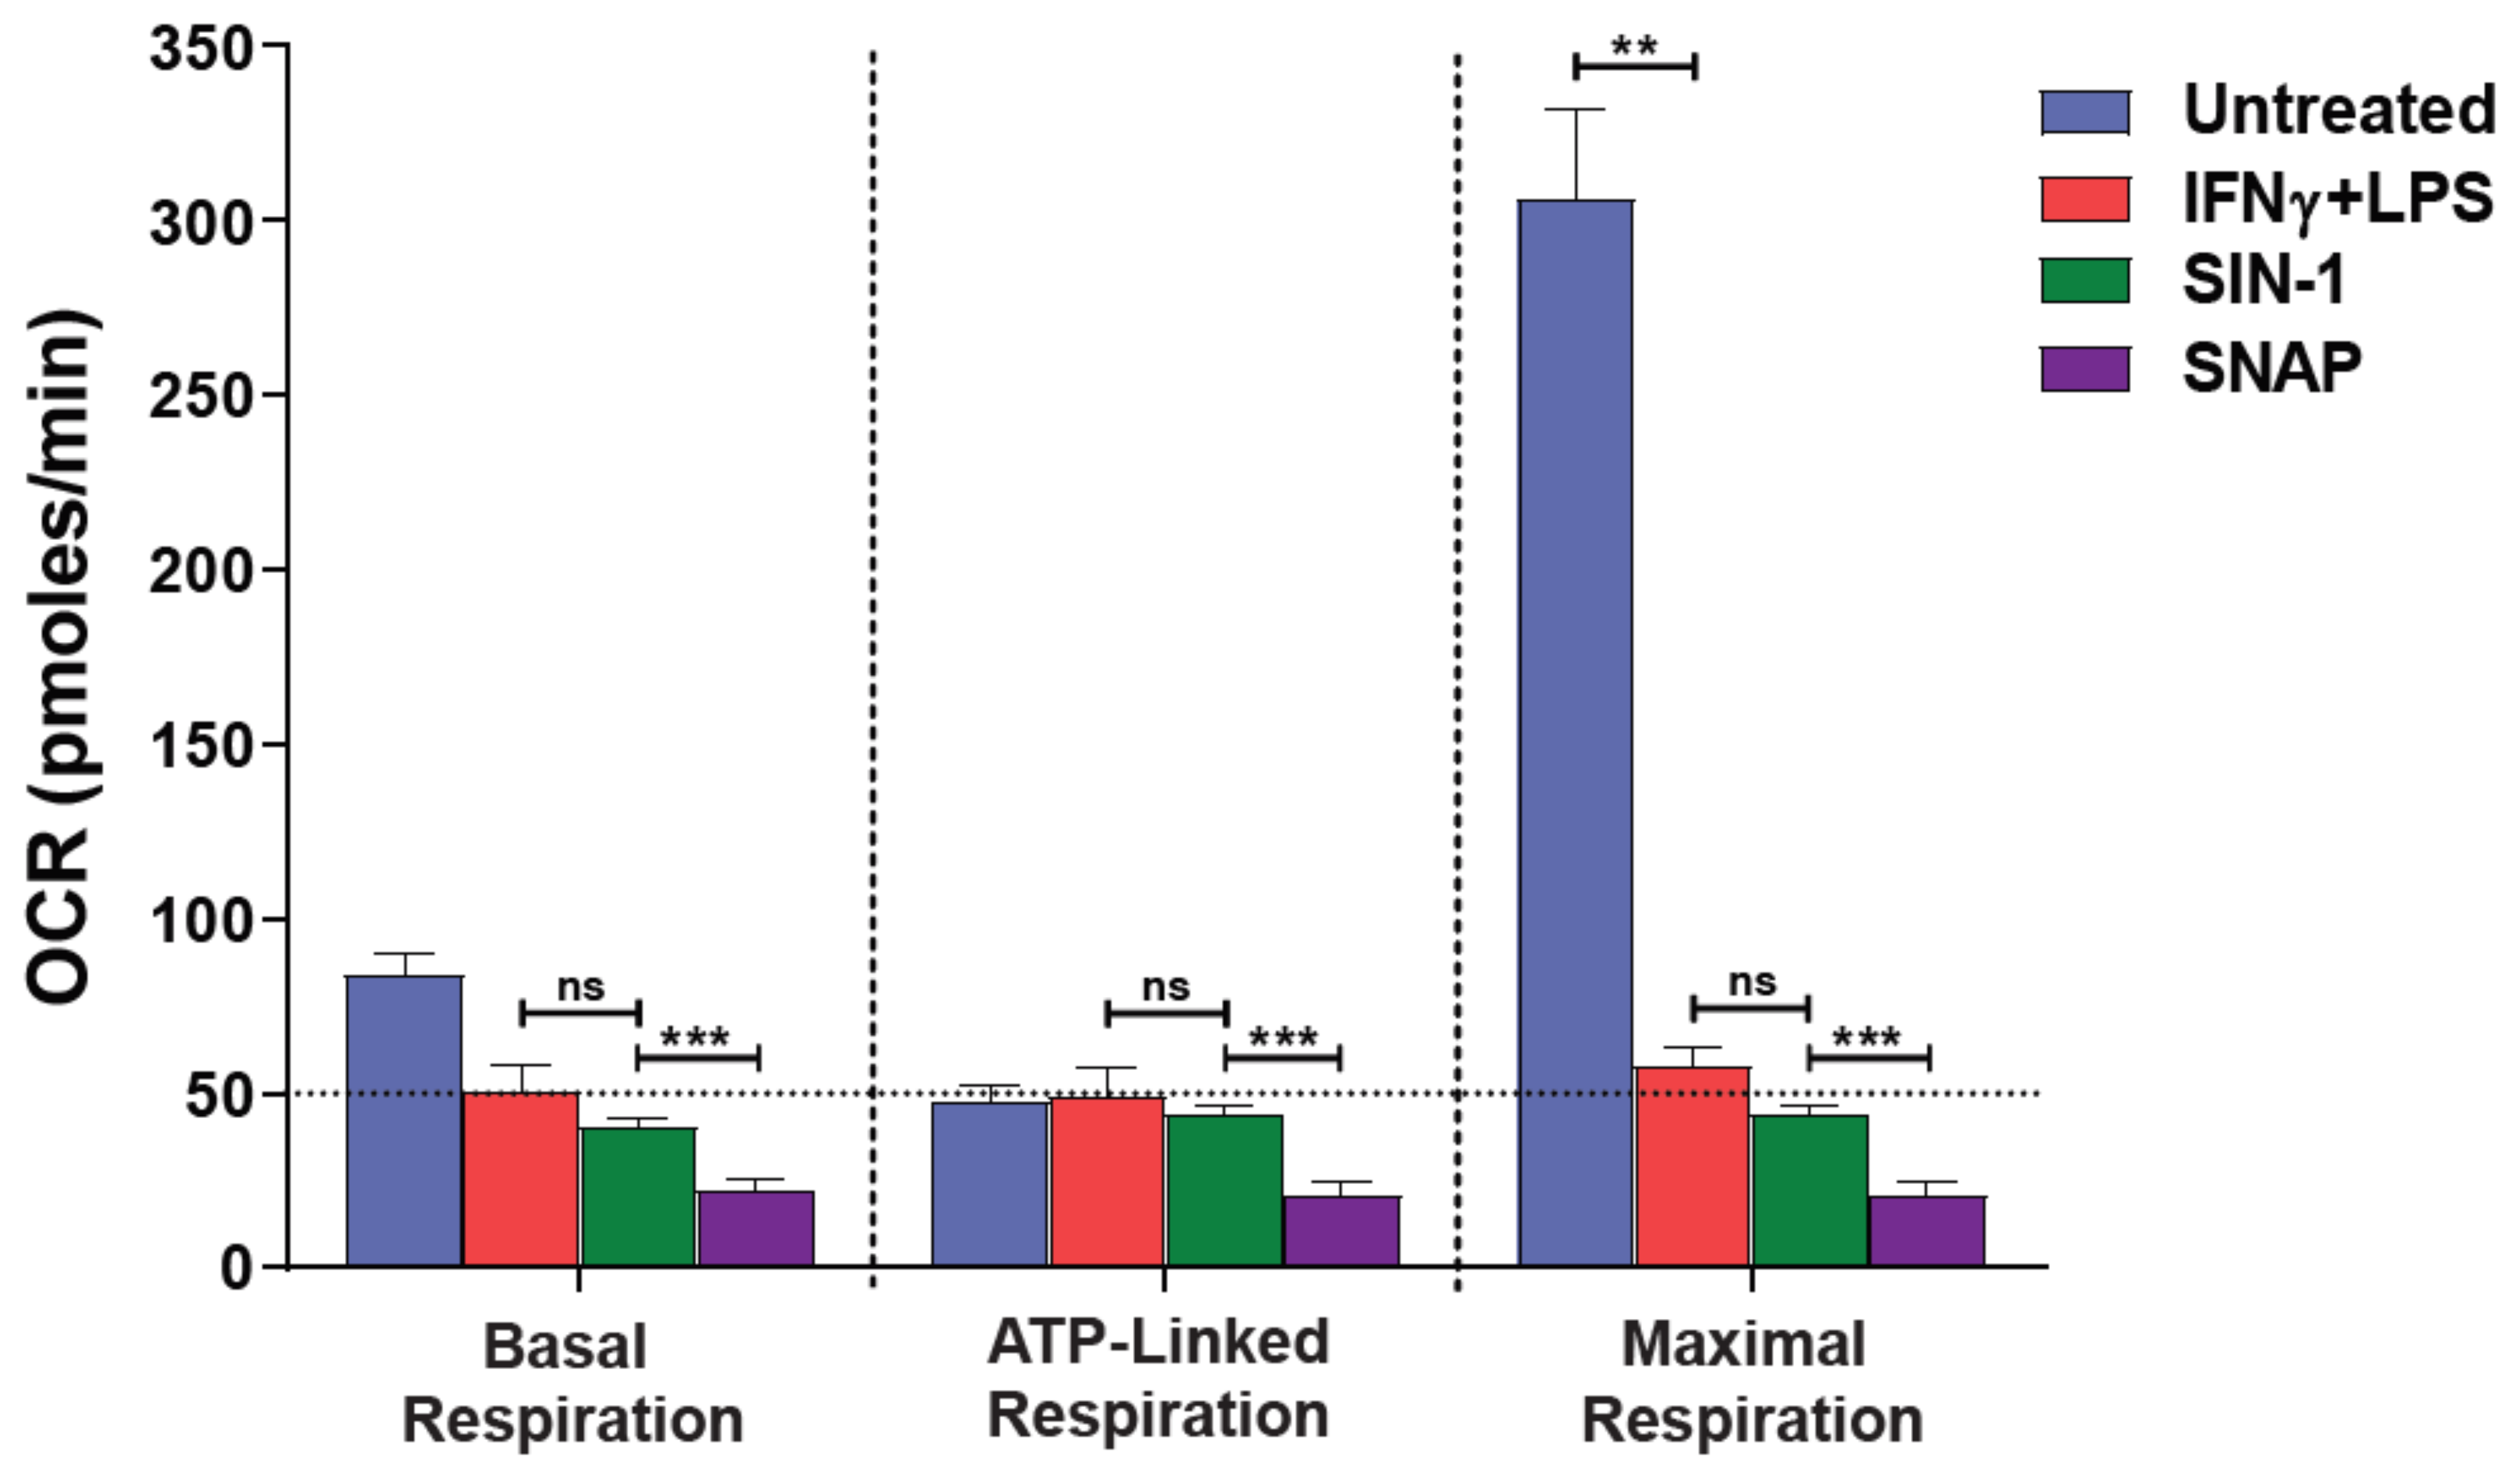
3.1. NO● and O2●− Donors Mimic the Oxygen Consumption Profile of 2-Signal Activated Macrophages
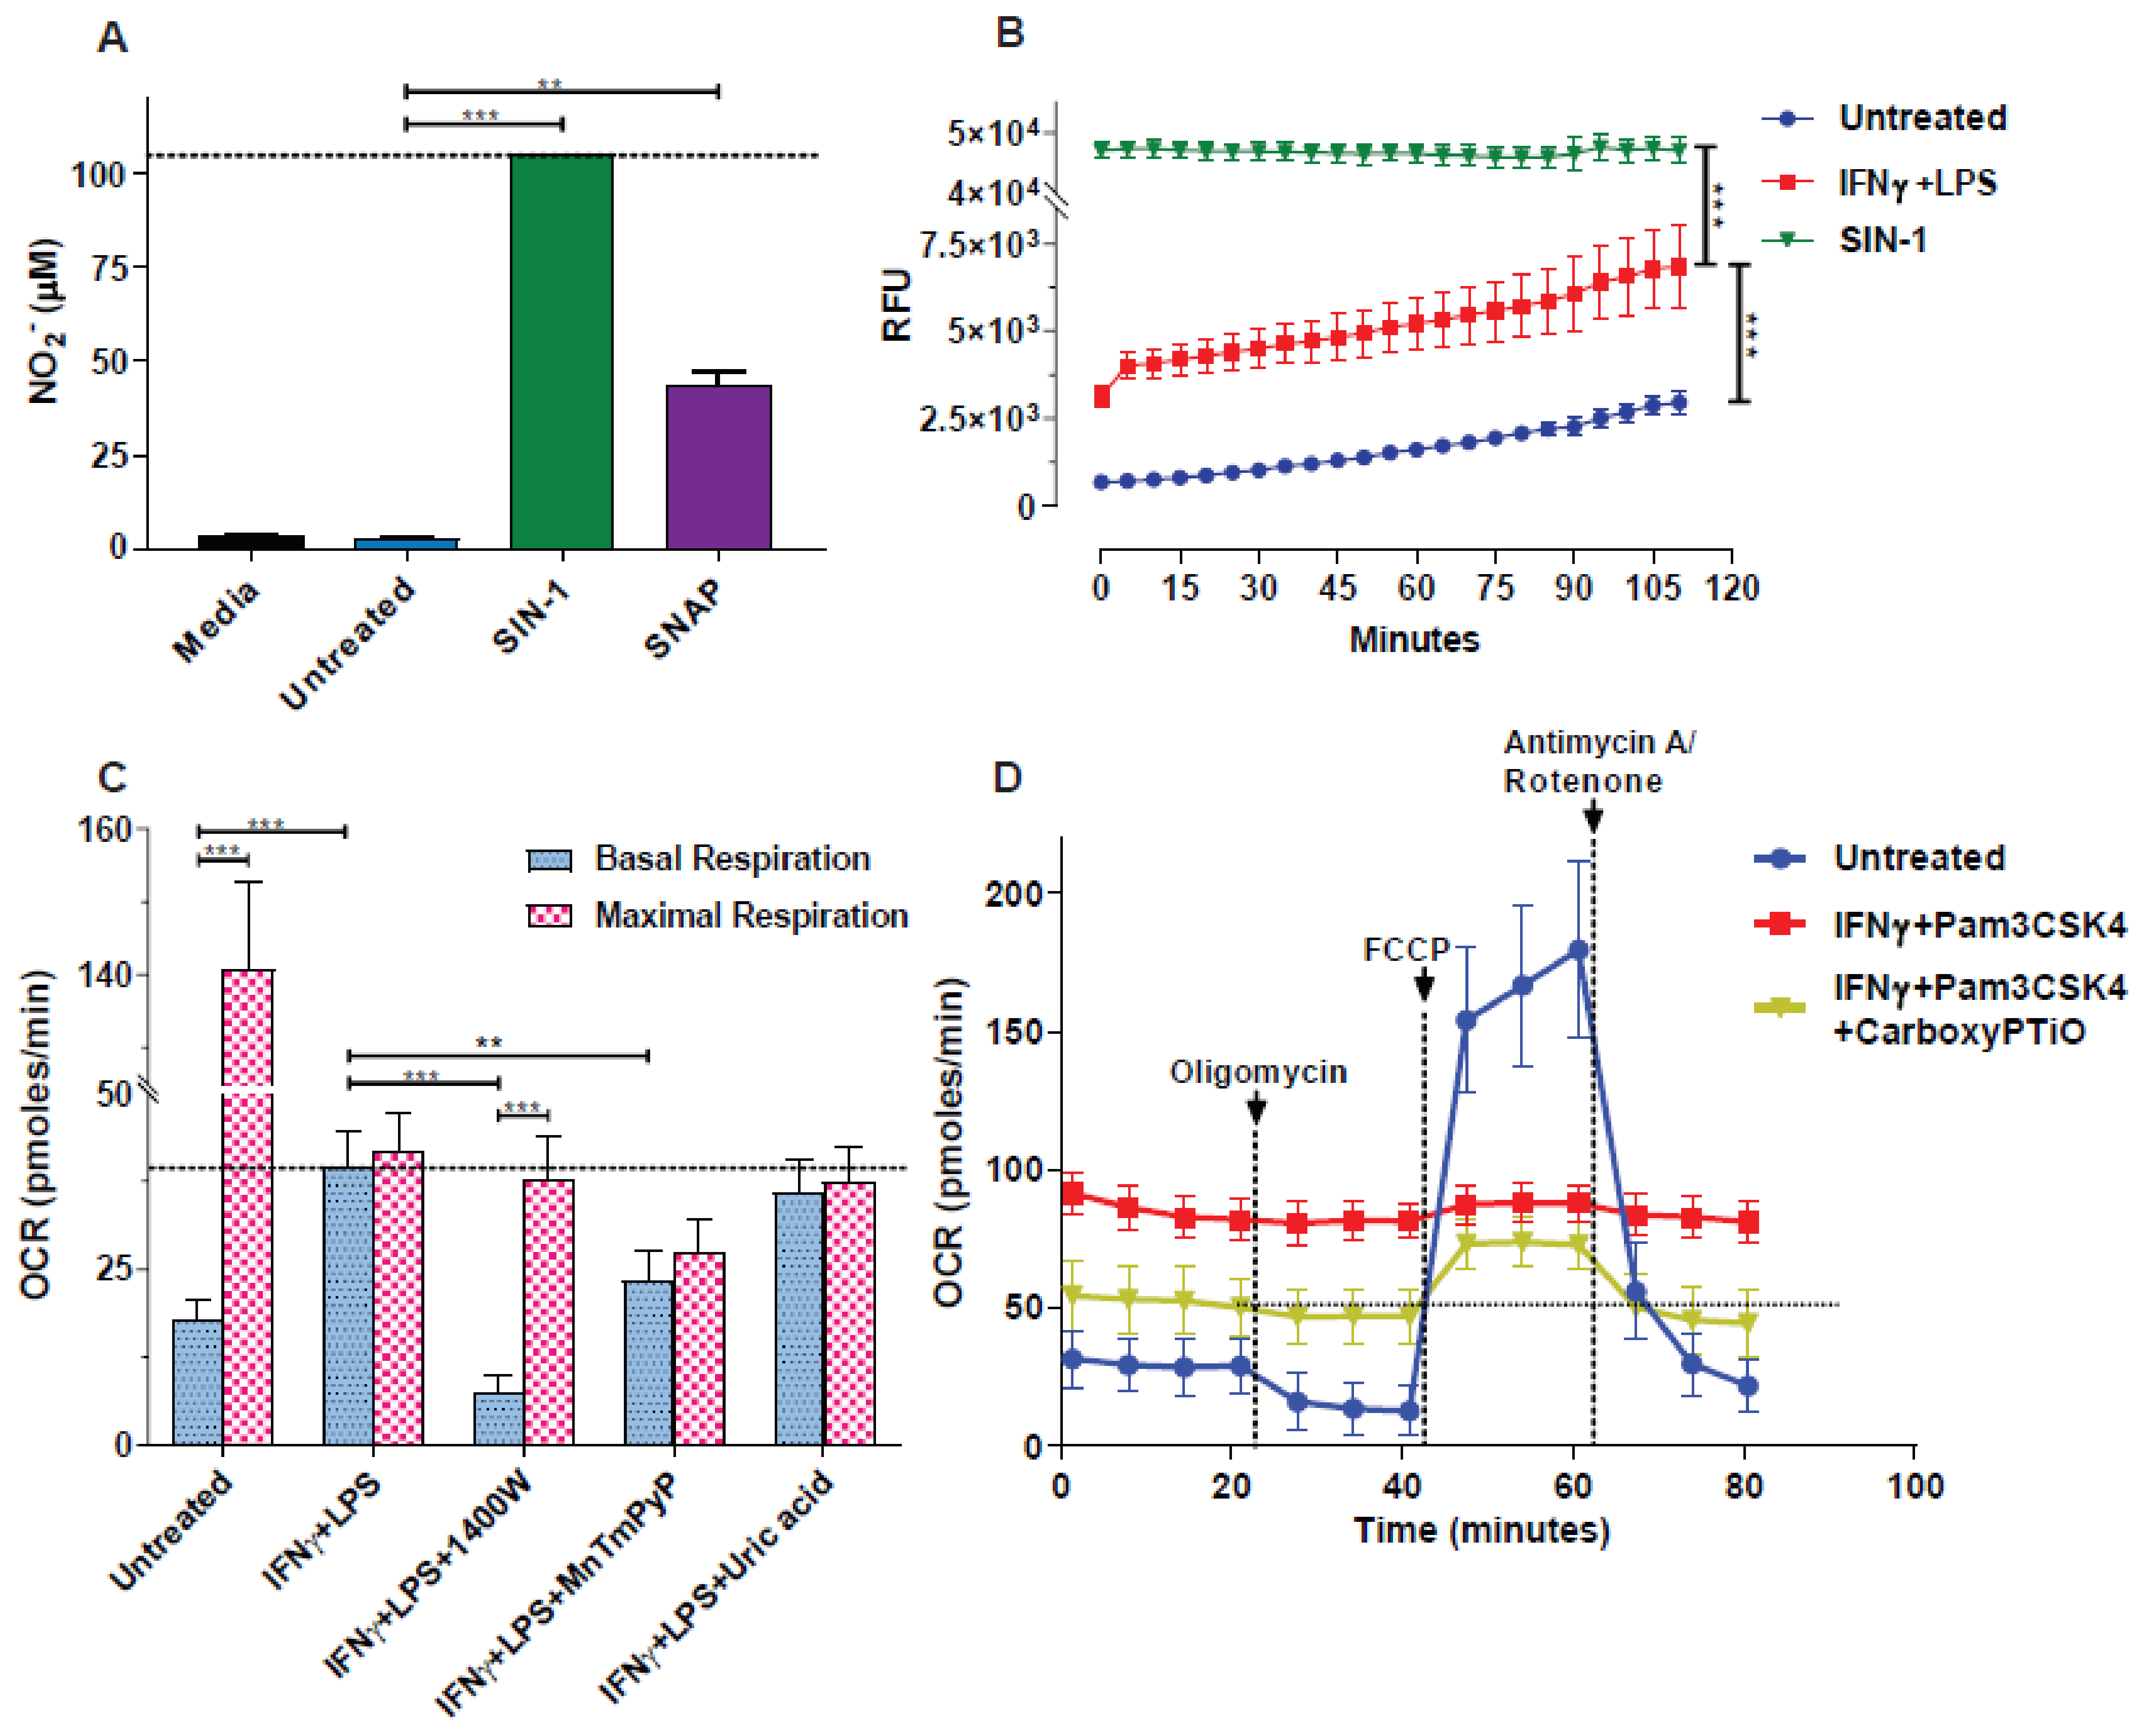
3.2. Blockade of NO● and O2●− Partly Rescues the Respiration of M(2-Signals)
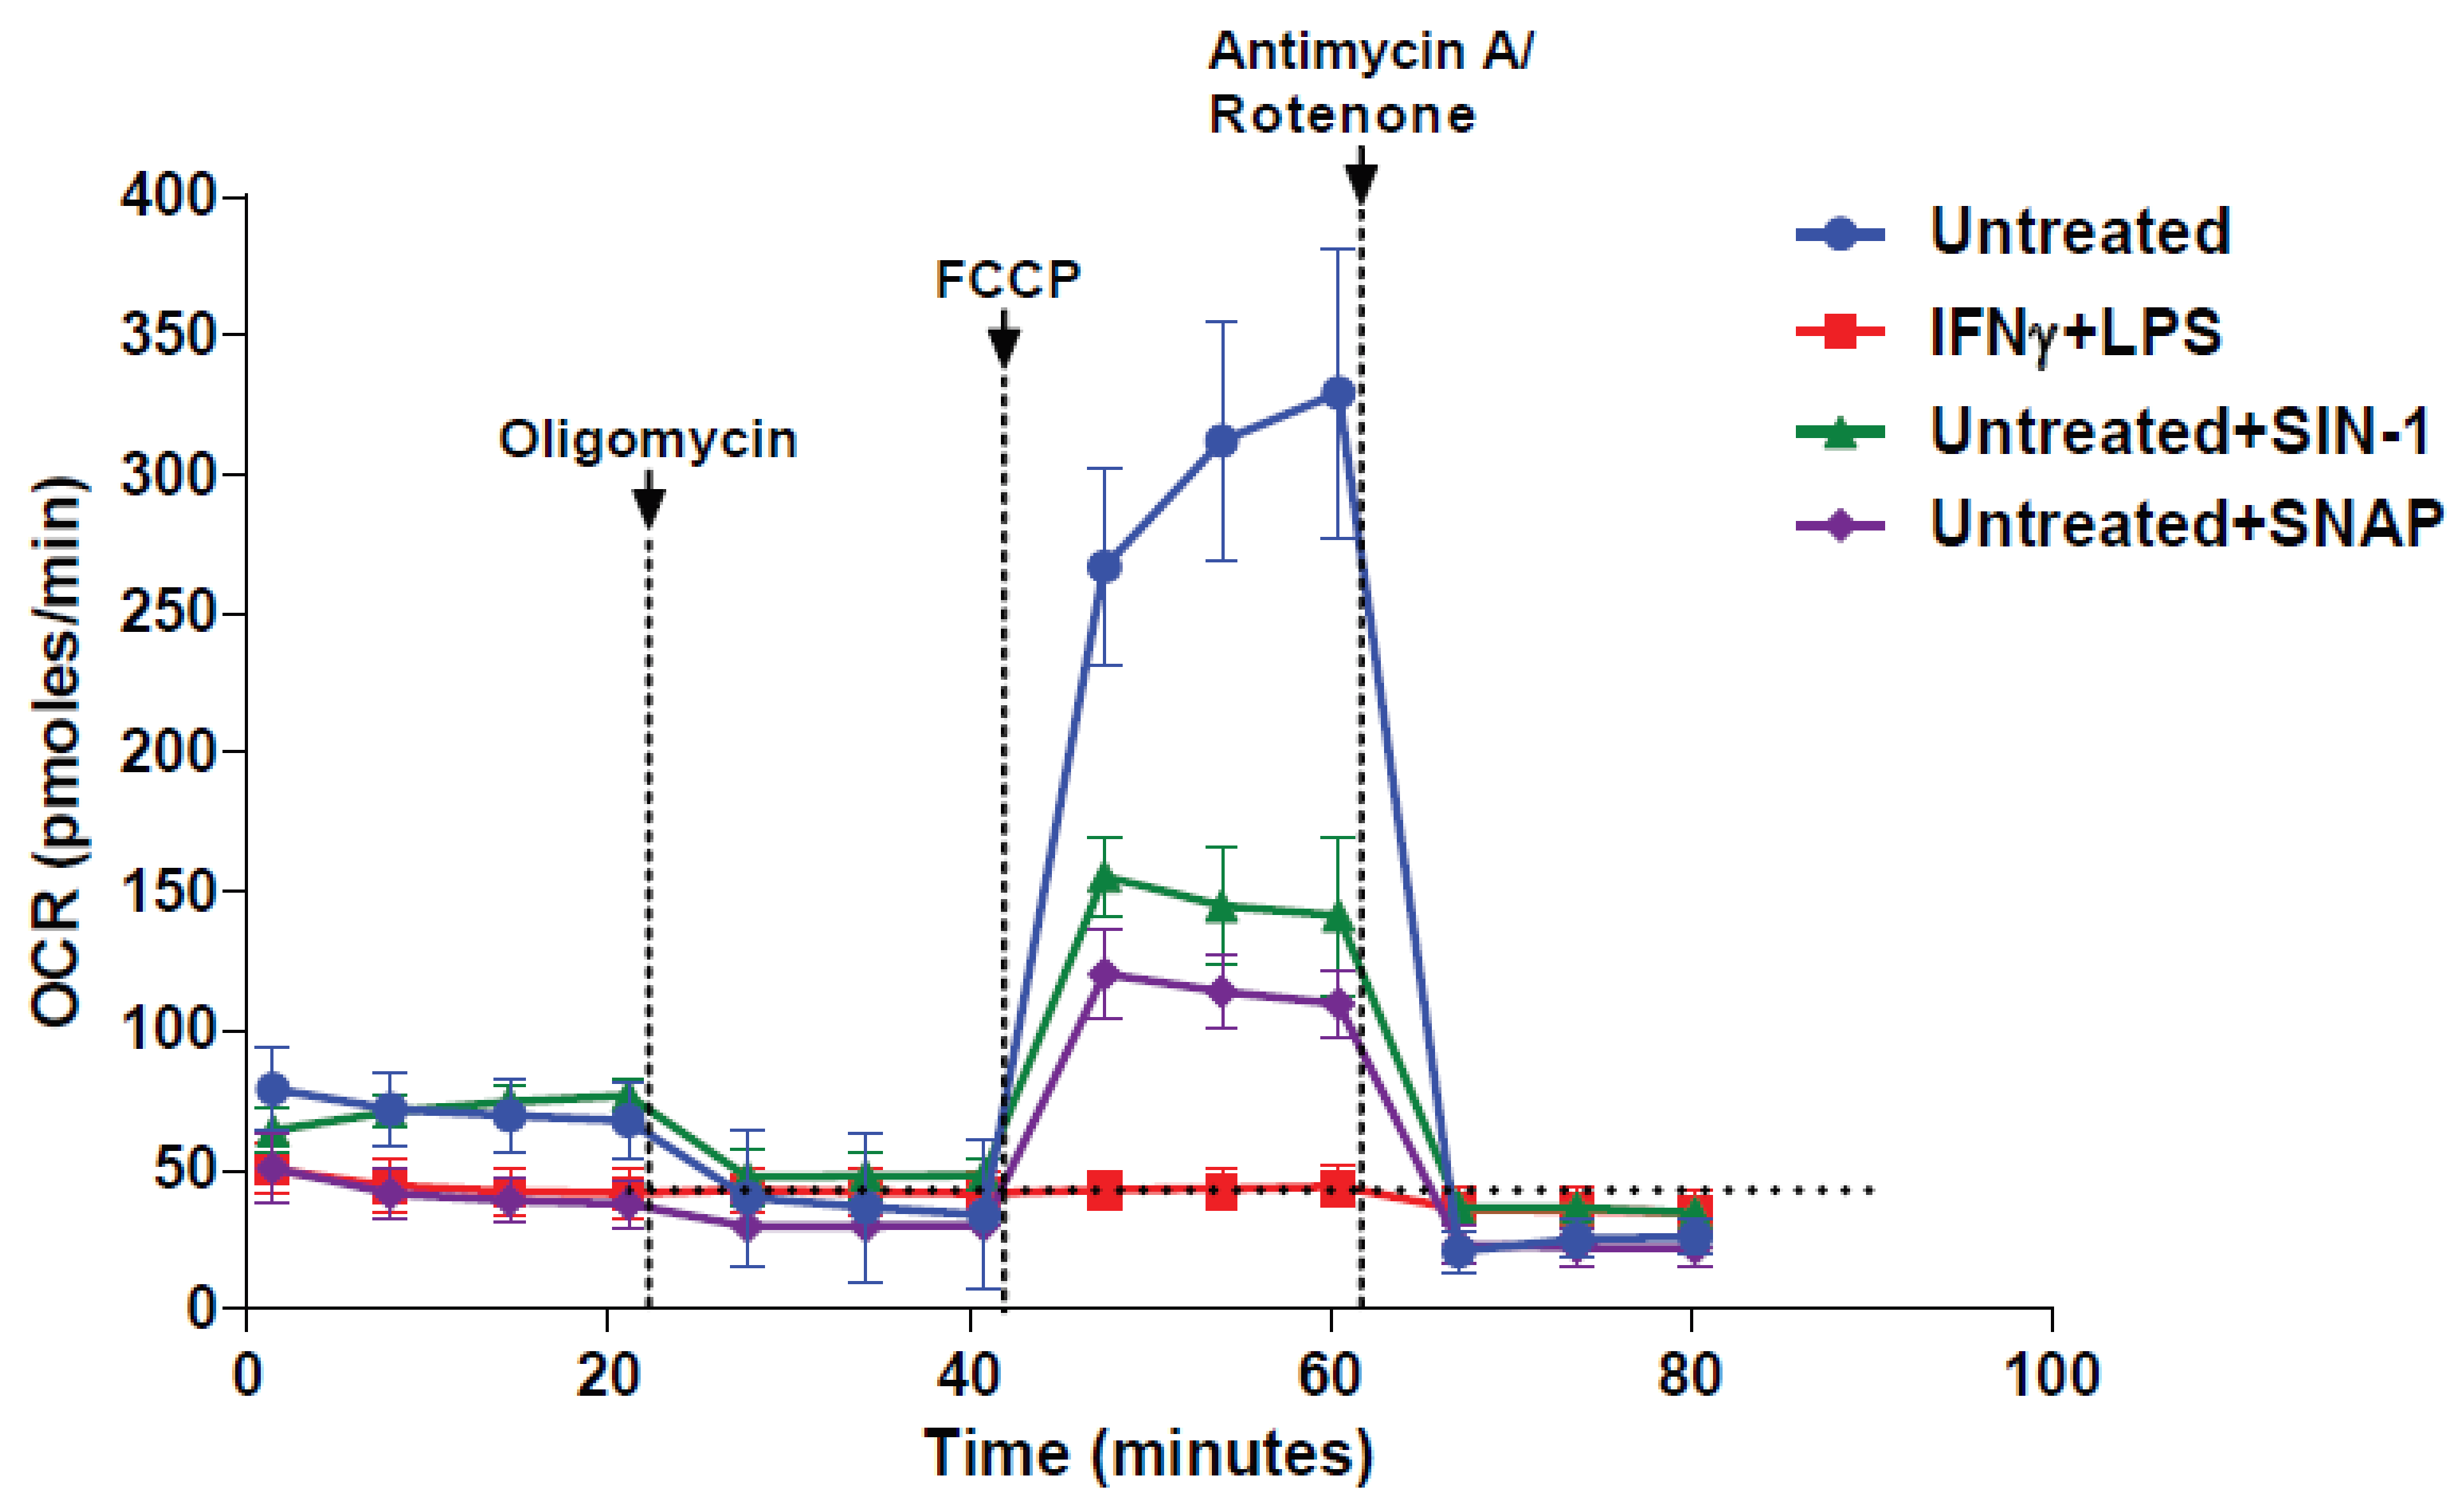
3.3. NO● and O2●− Donors Immediately Inhibit the Respiration of Naïve Macrophages
4. Discussion
5. Conclusions
Supplementary Materials
Author Contributions
Funding
Institutional Review Board Statement
Informed Consent Statement
Data availability statement
Conflicts of Interest
Abbreviations
| BMDM | bone marrow derived macrophages |
| DAF-FM | 4-Amino-5-methylamino-2′,7′-difluorescein |
| ECAR | extracellular acidification rate |
| FCCP | carbonyl cyanide-4-(trifluoromethoxy)phenylhydrazone |
| IFN | interferon |
| iNOS | inducible nitric oxide synthase |
| LPS | lipopolysaccharide |
| NO● | nitric oxide |
| OCR | oxygen consumption rate |
| OXPHOS | oxidative phosphorylation |
| RNS | reactive nitrogen species |
| ROS | reactive oxygen species |
| SIN-1 | 3-morpholinosydnonimine |
| SNAP | S-nitroso-N-acetyl-DL-penicillamine |
| SRC | spare respiratory capacity |
| 2-DG | 2-deoxy-d-glucose |
References
- Buck, M.; Sowell, R.T.; Kaech, S.M.; Pearce, E.L. Metabolic Instruction of Immunity. Cell 2017, 169, 570–586. [Google Scholar] [CrossRef]
- Galván-Peña, S.; O’Neill, L.A.J. Metabolic Reprograming in Macrophage Polarization. Front. Immunol. 2014, 5, 420. [Google Scholar] [CrossRef] [PubMed] [Green Version]
- Bossche, J.V.D.; Baardman, J.; de Winther, M.P. Metabolic Characterization of Polarized M1 and M2 Bone Marrow-derived Macrophages Using Real-time Extracellular Flux Analysis. J. Vis. Exp. 2015. [Google Scholar] [CrossRef] [Green Version]
- Zhu, L.; Zhao, Q.; Yang, T.; Ding, W.; Zhao, Y. Cellular Metabolism and Macrophage Functional Polarization. Int. Rev. Immunol. 2014, 34, 82–100. [Google Scholar] [CrossRef] [PubMed]
- Mills, C.D.; Kincaid, K.; Alt, J.M.; Heilman, M.J.; Hill, A.M. M-1/M-2 Macrophages and the Th1/Th2 Paradigm. J. Immunol. 2000, 164, 6166–6173. [Google Scholar] [CrossRef] [PubMed] [Green Version]
- Müller, E.; Christopoulos, P.F.; Halder, S.; Lunde, A.; Beraki, K.; Speth, M.; Øynebråten, I.; Corthay, A. Toll-Like Receptor Ligands and Interferon-γ Synergize for Induction of Antitumor M1 Macrophages. Front. Immunol. 2017, 8, 1383. [Google Scholar] [CrossRef]
- Alderton, W.; Cooper, C.; Knowles, R.G. Nitric oxide synthases: Structure, function and inhibition. Biochem. J. 2001, 357, 593–615. [Google Scholar] [CrossRef]
- Müller, E.; Speth, M.; Christopoulos, P.F.; Lunde, A.; Avdagic, A.; Øynebråten, I.; Corthay, A. Both Type I and Type II Interferons Can Activate Antitumor M1 Macrophages When Combined With TLR Stimulation. Front. Immunol. 2018, 9, 2520. [Google Scholar] [CrossRef]
- Garvey, E.P.; Oplinger, J.A.; Furfine, E.S.; Kiff, R.J.; Laszlo, F.; Whittle, B.J.R.; Knowles, R.G. 1400W Is a Slow, Tight Binding, and Highly Selective Inhibitor of Inducible Nitric-oxide Synthase in Vitro and in Vivo. J. Biol. Chem. 1997, 272, 4959–4963. [Google Scholar] [CrossRef] [Green Version]
- Turrens, J.F. Mitochondrial formation of reactive oxygen species. J. Physiol. 2003, 552, 335–344. [Google Scholar] [CrossRef]
- Han, D.; Williams, E.; Cadenas, E. Mitochondrial respiratory chain-dependent generation of superoxide anion and its release into the intermembrane space. Biochem. J. 2001, 353, 411–416. [Google Scholar] [CrossRef] [PubMed]
- Huie, R.E.; Padmaja, S. The Reaction of no with Superoxide. Free Radic. Res. Commun. 1993, 18, 195–199. [Google Scholar] [CrossRef] [PubMed]
- Moorcroft, M.J. Detection and determination of nitrate and nitrite: A review. Talanta 2001, 54, 785–803. [Google Scholar] [CrossRef]
- Bossche, J.V.D.; Baardman, J.; Otto, N.; van der Velden, S.; Neele, A.E.; Berg, S.M.V.D.; Luque-Martin, R.; Chen, H.-J.; Boshuizen, M.C.; Ahmed, M.; et al. Mitochondrial Dysfunction Prevents Repolarization of Inflammatory Macrophages. Cell Rep. 2016, 17, 684–696. [Google Scholar] [CrossRef] [PubMed] [Green Version]
- Gladwin, M.T.; Shiva, S. The Ligand Binding Battle at Cytochrome c Oxidase: How NO regulates oxygen gradients in tissue. Circ. Res. 2009, 104, 1136–1138. [Google Scholar] [CrossRef] [Green Version]
- Moncada, S.; Bolanos, J.P. Nitric oxide, cell bioenergetics and neurodegeneration. J. Neurochem. 2006, 97, 1676–1689. [Google Scholar] [CrossRef]
- Radi, R.; Peluffo, G.; Alvarez, M.N.; Naviliat, M.; Cayota, A. Unraveling peroxynitrite formation in biological systems. Free Radic. Biol. Med. 2001, 30, 463–488. [Google Scholar] [CrossRef]
- Zorov, D.B.; Juhaszova, M.; Sollott, S.J. Mitochondrial Reactive Oxygen Species (ROS) and ROS-Induced ROS Release. Physiol. Rev. 2014, 94, 909–950. [Google Scholar] [CrossRef] [Green Version]
- Turrens, J.F.; Alexandre, A.; Lehninger, A.L. Ubisemiquinone is the electron donor for superoxide formation by complex III of heart mitochondria. Arch. Biochem. Biophys. 1985, 237, 408–414. [Google Scholar] [CrossRef]
- Li, J.-M.; Shah, A.M. Endothelial cell superoxide generation: Regulation and relevance for cardiovascular pathophysiology. Am. J. Physiol. Integr. Comp. Physiol. 2004, 287, R1014–R1030. [Google Scholar] [CrossRef] [PubMed]
- Sipos, I.; Tretter, L.; Adam-Vizi, V. Quantitative relationship between inhibition of respiratory complexes and formation of reactive oxygen species in isolated nerve terminals. J. Neurochem. 2002, 84, 112–118. [Google Scholar] [CrossRef]
- Brand, M.D.; Nicholls, D.G. Assessing mitochondrial dysfunction in cells. Biochem. J. 2011, 435, 297–312. [Google Scholar] [CrossRef] [Green Version]
- Murray, J.; Taylor, S.W.; Zhang, B.; Ghosh, S.S.; Capaldi, R.A. Oxidative Damage to Mitochondrial Complex I Due to Peroxynitrite: Identification of reactive tyrosines by mass spectrometry. J. Biol. Chem. 2003, 278, 37223–37230. [Google Scholar] [CrossRef] [Green Version]
- Bolaños, J.P.; Heales, S.J.R. Persistent mitochondrial damage by nitric oxide and its derivatives: Neuropathological implications. Front. Neuroenergetics 2010, 2, 1. [Google Scholar] [CrossRef] [Green Version]
- Ballinger, S.W.; Patterson, C.; Yan, C.-N.; Doan, R.; Burow, D.L.; Young, C.G.; Yakes, F.M.; Van Houten, B.; Ballinger, C.A.; Freeman, B.A.; et al. Hydrogen Peroxide– and Peroxynitrite-Induced Mitochondrial DNA Damage and Dysfunction in Vascular Endothelial and Smooth Muscle Cells. Circ. Res. 2000, 86, 960–966. [Google Scholar] [CrossRef]
- Szábo, C.; Salzman, A. Endogenous Peroxynitrite Is Involved in the Inhibition of Mitochondrial Respiration in Immuno-Stimulated J774.2 Macrophages. Biochem. Biophys. Res. Commun. 1995, 209, 739–743. [Google Scholar] [CrossRef] [PubMed]
- Berridge, M.V.; Herst, P.M.; Tan, A.S. Tetrazolium dyes as tools in cell biology: New insights into their cellular reduction. Biotechnol. Annu. Rev. 2005, 11, 127–152. [Google Scholar] [CrossRef]
- Kowaltowski, A.J.; Vercesi, A.E. Mitochondrial damage induced by conditions of oxidative stress. Free Radic. Biol. Med. 1999, 26, 463–471. [Google Scholar] [CrossRef]
- Bolaños, J.P.; Delgado-Esteban, M.; Herrero-Mendez, A.; Fernandez-Fernandez, S.; Almeida, A. Regulation of glycolysis and pentose–phosphate pathway by nitric oxide: Impact on neuronal survival. Biochim. Biophys. Acta (BBA) Bioenerg. 2008, 1777, 789–793. [Google Scholar] [CrossRef] [PubMed] [Green Version]
- Yang, M.; Xu, Y.; Heisner, J.S.; Sun, J.; Stowe, D.F.; Kwok, W.-M.; Camara, A.K. Peroxynitrite nitrates adenine nucleotide translocase and voltage-dependent anion channel 1 and alters their interactions and association with hexokinase II in mitochondria. Mitochondrion 2019, 46, 380–392. [Google Scholar] [CrossRef]
- Souza, J.M.; Radi, R. Glyceraldehyde-3-Phosphate Dehydrogenase Inactivation by Peroxynitrite. Arch. Biochem. Biophys. 1998, 360, 187–194. [Google Scholar] [CrossRef] [PubMed]
- Stadtman, E.R.; Levine, R.L. Free radical-mediated oxidation of free amino acids and amino acid residues in proteins. Amino Acids 2003, 25, 207–218. [Google Scholar] [CrossRef] [PubMed]
- Guptasarma, P.; Balasubramanian, D.; Matsugo, S.; Saito, I. Hydroxyl radical mediated damage to proteins, with special reference to the crystallins. Biochemistry 1992, 31. [Google Scholar] [CrossRef] [PubMed]
- Mullarky, E.; Cantley, L.C. Diverting Glycolysis to Combat Oxidative Stress. In Innovative Medicine: Basic Research and Development; Nakao, K., Minato, N., Uemoto, S., Eds.; Springer: Tokyo, Japan, 2015. Available online: http://www.ncbi.nlm.nih.gov/books/NBK500351/ (accessed on 31 October 2020).


Publisher’s Note: MDPI stays neutral with regard to jurisdictional claims in published maps and institutional affiliations. |
© 2021 by the authors. Licensee MDPI, Basel, Switzerland. This article is an open access article distributed under the terms and conditions of the Creative Commons Attribution (CC BY) license (https://creativecommons.org/licenses/by/4.0/).
Share and Cite
Christopoulos, P.F.; Grigalavicius, M.; Corthay, A.; Berg, K.; Theodossiou, T.A. Reactive Species from Two-Signal Activated Macrophages Interfere with Their Oxygen Consumption Measurements. Antioxidants 2021, 10, 1149. https://doi.org/10.3390/antiox10071149
Christopoulos PF, Grigalavicius M, Corthay A, Berg K, Theodossiou TA. Reactive Species from Two-Signal Activated Macrophages Interfere with Their Oxygen Consumption Measurements. Antioxidants. 2021; 10(7):1149. https://doi.org/10.3390/antiox10071149
Chicago/Turabian StyleChristopoulos, Panagiotis F., Mantas Grigalavicius, Alexandre Corthay, Kristian Berg, and Theodossis A. Theodossiou. 2021. "Reactive Species from Two-Signal Activated Macrophages Interfere with Their Oxygen Consumption Measurements" Antioxidants 10, no. 7: 1149. https://doi.org/10.3390/antiox10071149
APA StyleChristopoulos, P. F., Grigalavicius, M., Corthay, A., Berg, K., & Theodossiou, T. A. (2021). Reactive Species from Two-Signal Activated Macrophages Interfere with Their Oxygen Consumption Measurements. Antioxidants, 10(7), 1149. https://doi.org/10.3390/antiox10071149