Abstract
This study provided a detailed profiling of the antioxidant and bioactive compounds occurring in three varieties of Rubus idaeus L. fruits (“Fall Gold”, “Glen Ample” and “Tulameen”) compared to Rubus occidentalis L. black raspberry (“Jewel” cultivar), adopting a comprehensive untargeted metabolomics approach developed with UHPLC analysis coupled with quadrupole/time-of-flight high resolution mass spectrometry, using the SWATH® acquisition protocol. The feature selection and annotation workflow, applied to the analysis of raspberry extracts in both polarities, allowed identifying 68 bioactive compounds mainly belonging to the classes of (poly)phenolic compounds. Interestingly, some of these identifications (e.g., ferulic acid glycosides and the ellagitannin-like nobotanin/malabathrin) represent the first report in raspberry fruits. Principal component analysis made possible highlighting the features more related to the expression of a genotype effect within the R. idaeus species or between the two raspberry species herein investigated. Overall, flavanols were the most discriminating features for the Fall Gold variety, whereas ellagitannins and flavonol glycosides represent more distinctive metabolic traits in Glen Ample and Tulameen fruits. Moreover, R. occidentalis Jewel variety was strongly characterized by the occurrence of anthocyanins, such as cyanidin, pelargonidin and delphinidin glycosides.
1. Introduction
Wild berries are well-known sources of bioactive compounds, mainly phenolics, synthesized by the plant secondary metabolism [1,2,3]. Such native chemicals play a crucial role in the prevention of a wide range of chronic and degenerative diseases [4,5]. For example, bilberry, blueberry and raspberry extracts demonstrated to exert antiproliferative and/or pro-apoptotic effects on specific cancer cell lines [6,7,8], whereas the intake of blueberry and strawberry supplements showed beneficial effects in the prevention and treatment of cardiovascular diseases [9] and diabetes [10], respectively.
Within the wide variety of wild berries, raspberry and blackberry are the most consumed edible fruits of a multitude of plant species in the genus Rubus of the Rosaceae family [11]. Rubus fruits are considered important functional foods due to their remarkable nutritional value and content of dietary antioxidants [11,12]. Within Rubus species, blackberry is commonly harvested as spontaneous wild berry, while raspberry is widely cultivated in Europe and North America as Rubus idaeus L. and Rubus occidentalis L. species, respectively [13], with a worldwide annual production of about one million tons in 2019 [14]. Despite their significant commercial value and recognized dietary importance, raspberry fruits have been investigated for their bioactive phenolic constituents to a limited extent.
More in detail, the phenolic composition of R. occidentalis berries has been poorly described in the literature, since, to our knowledge, only three studies have been published thus far [2,15,16], while a few more studies have been performed on R. idaeus fruits [2,17,18,19,20,21,22,23]. Some of these studies have been performed using liquid chromatography (LC) coupled with diode array detection and single quadrupole mass spectrometry through a selected ion monitoring approach, highlighting the occurrence of anthocyanins (i.e., cyanidin and pelargonidin derivatives) [2,19] and 32 compounds belonging to phenolic acids, flavanols, flavonols, ellagic acid and its derivatives and ellagitannins [2]. Other studies [17,18,20,21] adopted LC coupled with linear ion trap low-resolution mass spectrometer, which is in principle capable of more-in-depth structural analyses compared to single quadrupole. In this regard, a significant improvement of the identification process was obtained by Dincheva and co-workers [18], thus pushing the annotation up to 60 compounds belonging to the flavonols, flavanols and hydroxycinnamic acids, in addition to anthocyanins and ellagitannins. However, the use of low-resolution mass spectrometry does not provide the exact mass of both precursor and fragment ions, thus resulting in a low-accuracy identification, unless authentic standards are available. Conversely, high-resolution mass spectrometry, especially in the tandem mode (e.g., quadrupole/time-of-flight or quadrupole-orbital trap), is much more informative, since it allows obtaining important structurally related information through the fragmentation of parent molecules and the accurate mass readout of both precursors and fragments [1,24]. This consideration highlights the importance of adopting acquisition strategies based on high-resolution mass spectrometry, which has been applied in few cases for the exploration of the phenolic fraction of raspberry fruits, using LC hyphenated with time-of-flight [22] or quadrupole/time-of-flight (Q/TOF) [15,23] mass spectrometry (MS). More in detail, untargeted LC-Q/TOF was recently adopted for investigating negatively ionizable phenolic compounds in R. occidentalis berries [15]. Despite the accurate workflow adopted for feature extraction and annotation, the list of identified analytes was limited to a small number of compounds belonging to phenolic acids, flavonols, flavanols, ellagic acid and ellagic acid glycosides. A deeper untargeted analysis was performed by Zhang and co-workers [23] on R. idaeus extracts, identifying 50 phenolic secondary metabolites included in the group of anthocyanins and in the other aforementioned categories.
The expression of phenolic compounds in R. idaeus raspberries has been investigated as a function of stage of maturity [17], growing region [22] and genotype [17,22,25], suggesting the last one as the variable most influencing the phenolic profile. However, no data are reported in the literature concerning the effect of genotype between the R. idaeus and R. occidentalis berry species.
Based on the aforementioned considerations, this paper aims at: (i) deepening the knowledge of the phenolic fraction of R. idaeus and R. occidentalis berries, the latter being poorly described in the literature; and (ii) investigating the genotype effect on the phenolic expression in the two species. To these purposes, an untargeted metabolomics LC-Q/TOF study was performed on berries from “Glen Ample”, “Tulameen” and “Fall Gold” varieties of R. idaeus and from “Jewel” cultivar of R. occidentalis, cultivated in the same orchard and under the same rural practices.
2. Materials and Methods
2.1. Reagents and Standards
Analytical reference standards for identity confirmation were supplied, as specified in Section 1 of the Supplementary Materials. Hydrochloric acid (37%), LC-MS grade methanol and water were obtained from J.T. Baker (Deventer, the Netherlands). HPLC grade acetone, glacial acetic acid and LC-MS formic acid were purchased from Sigma-Aldrich (St. Louis, MO, USA). Sodium fluoride, Folin–Ciocalteu reagent and sodium carbonate were obtained by Merck (Darmstadt, Germany). Ultrapure water was taken from a Milli-Q system (Millipore, Billerica, MA, USA). Nylon membranes (porosity 0.2 μm) for the filtration of raspberry extracts before HPLC analysis were obtained from VWR™ International (Radnor, PA, USA).
2.2. Sample Preparation
R. idaeus and R. occidentalis analyzed in the present study were grown in a same experimental site located in Tuscany (44°02.175′, 10°47.361 ′, altitude 450 m a.s.l.), under the same agricultural conditions. The cultivars of R. idaeus investigated were “Glen Ample” (GA, red), “Tulameen” (T, red) and “Fall Gold” (G, yellow), whereas, for R. occidentalis, the cultivar “Jewel” (J, black) was selected. Six independent samples, each consisting of ten fresh fruits free of defects, were prepared for each raspberry cultivar. Three samples were used for the untargeted LC-Q/TOF study, while the others were destined to the pomological analyses. After the sampling, the berries intended for extraction were immediately frozen in liquid nitrogen, freeze-dried, grinded to obtain a homogeneous powder and finally stored at −20 °C until extraction and analysis were performed. Three representative aliquots from each freeze-dried berry sample were extracted according to a procedure previously developed by Zhang and co-workers [23] with few modifications. Briefly, about 500 mg dry weight (d.w.) raspberry aliquots were mixed with 5 mL of acetone/10 mM NaF water/acetic acid (70:29.7:0.3, v/v/v) and then vortexed for 30 s, sonicated in ice bath at controlled temperature (~0 °C) for 5 min and centrifuged at 8000× g for 10 min. This extraction protocol was replicated four times and its efficiency evaluated by measuring spectrophotometrically total soluble polyphenols (TSP) and total monomeric anthocyanins (TMA), as reported by Renai et al. [26] (see Section 2 of the Supplementary Materials for full details), using calibration curve ranges of 5–10 µg of procyanidin B1 and 20–300 µg of cyanidin-3-O-sophoroside, respectively. The results show that the fourth extraction allowed for recovering 3.6–6.5% and 3.0–5.8% of TSP and TMA determined with three extractions. Accordingly, for untargeted LC-Q/TOF analysis, three sequential extractions were performed on three independent aliquots of each raspberry cultivar and the resulting extracts were combined. The organic solvent was removed by vacuum evaporation and filtered at 0.2 μm using nylon membranes, and the resulting aqueous extract was analyzed.
2.3. Pomological analyses
Colorimetric coordinates (i.e., L, a, b), total soluble solids (TSS) and titratable acids (TA) were performed according to procedures elsewhere reported [27,28], in order to evaluate the stage of maturity of the harvested fruits. In detail, colorimetric coordinates were determined with a Minolta Chromameter CR200 (Konica Minolta, Tokyo, Japan) electronic colorimeter equipped with a pulsed xenon arc lamp inside a mixing chamber, which provides diffuse, uniform lighting over the 8-mm-diameter specimen area. TSS were determined using an Atago N1 digital refractometer (Atago Co., Ltd., Tokyo, Japan) and expressed as a percentage (°Brix). TA were determined by automatic titration (877 Titrino plus, Metrohm) with 0.1 M solution of NaOH up to pH 8.1, and the results were expressed as g of citric acid (CA) per kg of fresh fruit (f.w.). The results obtained are reported in Table 1.

Table 1.
Fruit pomological characterization of the investigated raspberry samples. Values of colorimetric coordinates (L, a and b), total soluble solids (TSS, expressed as Brix) and titratable acids (TA) are reported as means (n = 3) and relative standard deviations (in brackets). GA, Glen Ample; G, Fall Gold; T, Tulameen; J, Jewel; CA, citric acid; f.w., fruit fresh weight. Values marked with a different superscript letter (a, b, c) are statistically different (p-value < 0.05) according to Kruskal–Wallis Test.
2.4. LC-Q/TOF Analysis
LC analysis was performed on an ExionLC analytical UHPLC system (SCIEX, Framingham, MA, USA) equipped with an Acquity BEH C18 column (15 cm × 2.1 cm i.d., particle size 1.7 μm) and a guard column containing the same stationary phase (Waters, Milford, MA, USA). Column temperature was set at 50 °C. LC-MS water (eluent A) and methanol (eluent B) solutions were used for the analyte elution, acidifying each solvent with formic acid at 0.1% and 5% (v/v) for negative and positive electrospray ionization (ESI), respectively. The following elution gradient was adopted: 0–3 min, isocratic 2% B; 3–35 min, linear gradient 2–100% B; and 35–38 min, isocratic 100% B. The flow rate was 450 μL/min and the injection volume was 5 μL. The LC system was coupled with a TripleTOF® 6600 Q/TOF mass analyzer (SCIEX, Framingham, MA, USA) by the DuoSpray™ Source for TOF and Q/TOF analyses. The following source parameters were used during the acquisitions; (i) positive ionization: heater temperature 450 °C, Curtain Gas™ 30, nebulizing gas 55, heating gas 65 and spray voltage +5000 V; and (ii) negative ionization: heater temperature 450 °C, Curtain Gas™ 30, nebulizing gas 45, heating gas 55 and spray voltage −4500 V. Under both ionization modes, each extract was analyzed using the SWATH™ data independent acquisition protocol, which allows simultaneously acquiring TOF full scan MS and Q/TOF MS2 spectra with a comprehensive detection approach, i.e., virtually detecting all the analytes present in the extract and eluting under the chromatographic conditions adopted. The high-resolution TOF MS full scan experiment was carried out in the range 100–1000 Da (cycle time 200 ms), with an accumulation time of 150 ms and a collision energy of 70 eV. Automated calibration was performed by an external calibrant delivery system (CDS), infusing proper calibration solution prior to sample introduction.
2.5. Data Processing for Feature Selection and Identification
The number of raw data derived from the SWATH™ analysis of the investigated samples is very high, thus needing to be processed with specific software. In this study, Marker View® 1.3.1 software was used for instrumental noise removal and blank subtraction, spectra deconvolution and chromatogram alignment, based on the TOF exact mass and isotope pattern determinations, as well as on the Q/TOF fragmentation spectra of parent ions. The following alignment criteria were adopted within the three independent samples of each cultivar: (i) TOF accuracy of the pseudo-molecular ion < 5 ppm; (ii) isotope ratio difference compared to the theoretical isotope profile < 20%; (iii) purity score of the MS2 spectra compared to the one of available standards ≥ 80%; and (iv) retention time (tR) tolerance ≤ 0.05 min [1]. Afterwards, the following workflow was adopted using the R software (version 4.0.3, https://cran.r-project.org, accessed on 1 March 2021) for the selection of a restricted group of the aligned features. In detail, the following were selected: (i) features with a coefficient of variation (CV) among cultivars higher than that in QCs; (ii) features that after the Kruskal–Wallis comparison among cultivars were significantly different at the probability level of 2% (p-value < 0.02); and (iii) features that after the post-hoc Dwass, Steel, Critchlow-Fligner (DSCF) multiple comparison analysis, based on pairwise two-sample Wilcoxon comparisons [29] among sample groups were significantly different at the probability level of 20% (p-value < 0.2). Manual revision of the features resulting from the aforementioned workflow was finally carried out with the purpose of retaining only the features providing acceptable spectral data for the successive annotation.
In this study, according to metabolomics guidelines, four levels of feature annotation were distinguished [30]. Briefly, Level I was assigned when the feature in the aligned chromatogram was successfully compared with the reference standard. For Level II annotation, the identification is performed based upon exact mass value, isotopic profile, MS2 spectra and chromatographic behavior of the aligned feature in comparison with internal and/or freely available external libraries (i.e., MassBank, GNPS, MetaboBASE, Fiehn/Vaniya natural product library and BMDMS-NP) of mass spectra and literature information (putatively annotated compound). The identification at Level III is based on characteristic physicochemical properties of a chemical class of compounds, or by spectral similarity to known compounds of a chemical class (putatively characterized compound classes). Finally, Level IV includes the unknown compounds.
2.6. Chemometrics Analyses for Genotype Comparison
To compare the metabolome profiles of the four investigated cultivars and to highlight the features that mainly contributed to their differentiation, principal component analysis (PCA) of molecular or quasi-molecular ions of the assigned compounds was performed using MarkerView software. This approach was carried out separately for compounds detected under negative and positive ionization modes. Quality control (QC) of PCA was performed, using QC samples (n = 3), which consisted of a mixture of equal aliquots of each raspberry extract. QC evaluation was carried out by verifying if PCA object scores obtained by replicated injections of the QC sample were close to the origin of PCA coordinates.
Pearson product-moment correlation (PPMC) analysis was also performed to evaluate the grade of correlation among the selected features and pomological data.
3. Results and Discussion
3.1. Pomological Parameters
Pomological parameters are illustrated in Table 1. The CIELAB spatial coordinates measured on raspberry skin were in the ranges of 25–53, 2–23 and 3–34 for brightness (L), green to red (a) and blue to yellow (b) axes, respectively. These very wide variations obviously reflected the different skin colors of the investigated berries. TSS and TA showed not negligible variations, being in the ranges 8.1–13.1° Brix and 10.7–19.9 g of citric acid per kg of fresh weight fruit. However, the two red raspberry cultivars (R. idaeus GA and T) exhibited the same CIELAB coordinates; moreover, for these two genotypes, statistically comparable values of TSS and TA were found, thus highlighting for these fruits the same stage of maturity. It should also be noted that the values of pomological parameters found here for GA, T, G and J were in quite good agreement with data previously reported for fully mature raspberries of the same cultivars [31,32,33,34] and/or for other genotypes [35], thus indicating that the harvest time was properly chosen.
3.2. Feature Selection and Annotation
Data peak picking and retention time alignment resulted in a very large number of features in both negative and positive ionization modes, i.e., 13,211 and 44,251, respectively. The further workflow of feature selection provided an additional restriction of the aligned data, which accounted for 10,323 and 43,774 for ESI(−) and ESI(+), respectively. Non-parametric Kruskal–Wallis test highlighted 1732 features in negative polarity and 3088 features in positive polarity. Finally, contrast analysis and manual revision of the significant features resulted in 49 and 19 features in negative and positive ionization, respectively.
All selected features were annotated according to the identification criteria reported in Section 2.5. For each feature, Table 2 and Table 3 illustrate tR (min), mass to charge ratio (m/z) of the pseudo-molecular or the molecular ion found by the full scan experiment, main mass fragments, proposed formula and the corresponding exact mass, the mass accuracy (Δ, ppm), the raspberry variety in which the metabolite was identified and the tentative identification.
Table 2.
Retention times (tR, min), pseudo-molecular ions (TOF, Da), mass fragments (Q/TOF, Da), proposed formula, corresponding exact mass (Da) and accuracy (Δ, ppm) of peaks tentatively identified under negative ionization. Symbols + and − mean detected and not detected, respectively. GA, Glen Ample; T, Tulameen; J, Jewel; G, Fall Gold. a Peaks annotated at Level I. The base peak of each MS2 spectra is reported in bold character. Fragments marked with asterisk are double-charged ions.
Table 3.
Retention times (tR, min), molecular and pseudo-molecular ions (TOF, Da), mass fragments (Q/TOF, Da), proposed formula, corresponding exact mass (Da) and accuracy (Δ, ppm) of peaks identified under positive ionization. Symbols + and − mean detected and not detected, respectively. GA, Glen Ample; T, Tulameen; J, Jewel; G, Fall Gold. a Peaks annotated at Level I. The base peak of each MS2 spectra is reported in bold character.
Feature Annotation
Phenolic acids: Several phenolic acids belonging to the class of the hydroxybenzoic (Peaks 1 and 2) and hydroxycinnamic acids (Peaks 6, 9, 17, 18 and 27) were identified under negative ionization in at least one raspberry sample (Table 2). In detail, Peaks 1 and 2, which were identified at Level I as gallic acid and 3,4-dihydroxybenzoic acid, respectively, were detected only in the R. occidentalis cultivar. Among hydroxycinnamic acids, chlorogenic acid (Peak 17) was annotated at Level I, whereas the other acids (i.e., ferulic, p-coumaric and sinapic), occurring only as hexose glycosides, were identified at Level II with of 2.4–4.9 ppm. Interestingly, the two ferulic acid hexosides identified here in R. idaeus fruits (Peaks 6 and 9) represent the first report of ferulic acid glycosides in raspberry. As illustrated in Figure S1 and Scheme S1, these peaks were identified at Level II through their [M−H]− pseudo-molecular ion at m/z 355.10, which fragmented, giving rise to peaks at m/z 191.02 (164 Da, loss of hexose), 147.03 and 129.02 (successive losses of CO2 and water, respectively), as already reported in other berries [1]. Peak 18 showed a [M−H]− pseudo-molecular ion at m/z 325.09, which fragmented in m/z 118.04 and 117.03 due to the cleavage of the anomeric bond (loss of 163 Da) and successive loss of CO2 (loss of 44 Da). Based on these findings and previously reported patterns of fragmentation and related annotations [18,23], this feature was putatively identified (i.e., Level II) as a p-coumaroyl hexoside. Peak 27 with [M−H]− at m/z 385.12 was putatively annotated as sinapic acid hexoside since it fragmented giving rise to m/z 223.06 (loss of the hexose group), which further fragmented in m/z 205.05 (formal loss of H2O, 18 Da) and 190.03 (loss of methyl group) (Figure S2 and Scheme S2).
Ellagitannins: Thirteen ellagitannins (Peaks 3, 7, 8, 12, 19, 21–24 and 29) were identified under negative ionization in both R. idaeus and R. occidentalis raspberry (Table 2). Peak 3 evidenced a [M–H]– ion at m/z 633.07 and principal MS2 fragment at m/z 301.00 (i.e., ellagic acid), corresponding to the neutral loss of one galloyl-hexose unit. Another less intense dissociation product of the quasi-molecular ion was 331.07 (i.e., galloyl hexose), due to the loss of one hexahydroxydiphenoyl (HHDP) unit. This peak was therefore attributed to a galloyl-HHDP-hexose (Δ = 0.3 ppm), which has been previously reported in other fruit species [36,37] but not in raspberry. Peaks 7 and 19 showed double-charged ion with [M–2H]2–/2 at m/z 783.07, corresponding to a MW of 1569 Da and mono-charged fragment ions at m/z 935.09, 933.07, 633.08, 617.04, 331.07 and 300.99. This fragmentation pattern was in accordance with the ones observed by Zhang et al. [23] and Mullen et al. [38] in raspberry and attributed to two isomers of sanguiin H-10. Peaks 22 and 23 also showed a double-charged pseudo-molecular ion at m/z 934.08, corresponding to a MW of 1869 Da. The fragmentation gave rise to mono-charged ions at m/z 915.06, consistent with the losses of a galloyl-di-HHDP-hexose (934 Da), H2O and H2; a further loss of H2O originated the fragment at m/z 897.05. The product ions at m/z 633.08 (galloyl-HHDP-hexose) and 301.01 (ellagic acid) were the result of the fragmentation of the pseudo-molecular ion in the mono-charged fragment at m/z 934.07 (not detected, probably due to the high abundance of the double-charged ion) and its successive cleavage. Accordingly, these peaks were attributed to sanguiin H-6 isomers, already annotated in R. idaeus [23,39]. Peak 8 showed a double-charged ion with [M–2H]2–/2 at m/z 858.07, corresponding to a MW of 1717 Da. The fragmentation pattern included the product ions at m/z 935.09, 858.08, 633.08, 631.06, and 301.00, which are consistent with a sanguiin H-6 degalloylated, previously annotated by different authors in R. idaeus cultivars [23,39]. Peak 12 showed a mono-charged pseudo-molecular ion at m/z 633.08 which fragmented only in m/z 301.00. This peak was tentatively attributed (Level II) to corilagin, a low molecular weight ellagitannins previously identified in R. idaeus berries [23]. Peak 21 had a pseudo-molecular triple-charged ion at m/z 933.74, equivalent to a MW of 2805 Da. This peak fragmented in a double-charged ion at m/z 617.04 (corresponding to the loss of a di-HHDP-hexose-galloyl-HHDP) and a mono-charged ellagic acid ion (m/z 301.00). Based on these findings, this peak was annotated as lambertianin C, elsewhere described in R. idaeus berries [23,39,40]. Peak 24 was characterized by a double-charged pseudo-molecular ion at m/z 551.04 (corresponding to a MW of 1104 Da) and fragments at m/z 469.01 (HHDP-hexose), 301.00 (ellagic acid) and 169.01 (gallic acid), thus being identified as a sanguiin H-2, in accordance with a previous annotation on R. idaeus fruits [23]. Peak 28 exhibited a double-charged pseudo-molecular ion at m/z 859.08, corresponding to a MW = 1721.2 Da and fragments at m/z 785.09, 633.08 and 301.00 (Figure 1). This fragmentation pattern is consistent with the occurrence of an ellagitannin-like nobotanin/malabathrin molecule (see Scheme S3), which is here annotated in raspberry for the first time.

Figure 1.
TOF MS (top right) and Q/TOF MS2 spectra of Peak 28, tentatively identified as ellagitannin-like Nobotanin/Malabathrin.
Flavanols: Eight flavanols (Peaks 4, 5, 10, 11, 14, 16, 20 and 25) were identified under negative polarity in all genotypes, with the only exception of Peak 11, which was absent in R. occidentalis. Flavanols occurred mainly as proanthocyanidin dimers and trimers, whereas only (+)-catechin (Peak 10) and (−)-epicatechin (Peak 25) were annotated (Level I) as monomers. Peaks 4, 14 and 20 exhibited the same [M−H]− quasi-molecular ion (m/z 577.14) and typical fragmentation of B-type (epi)catechin-(epi)catechin dimers, consisting in the retro-Diels–Alder fission of the “C” ring (m/z 425.09), successive loss of water (m/z 407.08), the cleavage of the B-type linkage with formation of the (epi)catechin monomer (m/z 289.07) and the fission of the heterocyclic ring of the monomer (m/z 125.02) [1]. Peaks 14 and 20 were undoubtedly attributed to procyanidin B1 and procyanidin B2, respectively, based on the identity confirmation with authentic standards. Accordingly, Peak 4 was putatively ascribed to a B-type procyanidin isomer, in which the C4→C6 interflavanoid bond, instead of the C4→C8 one, is present between the two (epi)catechin units. Peaks 5 and 16 showed the same pseudo-molecular ion (m/z 863.20) and a fragmentation pattern consistent with the presence of monomer (m/z 287.06) and dimer (E)C units (m/z 577.13 and 575.12) derived from the quinone methide reaction, thus suggesting the attribution to B-type procyanidin trimers [41]. More in detail, for Peak 5, the undoubted attribution to procyanidin C1 was possible thanks to the availability of its authentic standard. Peak 11 showed a [M−H]− pseudo-molecular ion at m/z 863.19 and a populated fragmentation pattern (i.e., m/z 711.14, 693.13, 575.12, 449.09, 423.07, 413.09 and 287.06) consistent with an A/B-linked procyanidin trimers (see Figure 2). In fact, as illustrated in Scheme S4, the product ions at m/z 711.14 derived from the retro Diels–Alder reaction affecting the B-type-linked (epi)catechin and gave rise to m/z 693.13 due to the loss of water. Moreover, m/z 287.06 and 575.12 were produced from the pseudo-molecular ion by the quinone methide reaction, the latter giving rise to m/z 449.09 and 423.08 (heterocyclic ring fissions).
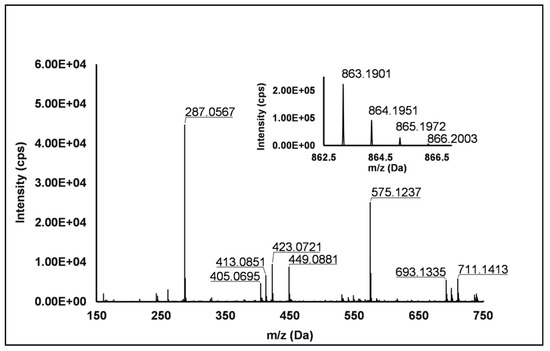
Figure 2.
TOF MS (top right) and Q/TOF MS2 spectra of Peak 11, tentatively identified as A/B type procyanidin trimer.
Flavanols in free and conjugated forms have been scarcely investigated in raspberry samples, since only Zhang and co-workers [23] investigated this compound class in depth, even though only one red raspberry variety was investigated and few metabolites were annotated. Hence, the present study adds new knowledge on the occurrence of flavanols in raspberry.
Flavonols: Nine flavonols were identified under negative polarity (Table 2), almost exclusively quercetin and kaempferol derivatives (Peaks 32, 34, 36–39, 41 and 44). Only one aglycone was found, i.e., quercetin (Peak 46), which was identified at Level I in all the investigated cultivars, thanks to its reference standard. Authentic standards allowed the Level I identification (Table 1) of quercetin-3-O-sophoroside (Peak 32) and quercetin-3,4-diglucoside (Peak 34) in R. idaeus, whereas quercetin-3-O-galactoside (Peak 36), quercetin-3-O-glucuronide (Peak 37), quercetin-3-O-glucoside (Peak 38), quercetin-3-O-rutinoside (Peak 39), kaempferol-3-O-glucuronide (Peak 41) and kaempferol-3-O-glucoside (Peak 44) were unequivocally annotated in all the investigated raspberry samples. These annotations have been described elsewhere in R. idaeus fruits [18,23,42], while they represent a first report in R. occidentalis. The MS2 fragmentation pattern of these features was characterized by the heterolytic and homolytic cleavages of the glycosidic bond that produced the characteristic [Y0]− aglycone (i.e., m/z 301 for quercetin and m/z 285 for kaempferol) and/or [Y0−H]•− (i.e., m/z 300 and 284) radical aglycone ions. Peak 13, identified only in J variety, exhibited a [M−H]− pseudo-molecular ion at m/z 609.15, which fragmented in m/z 301.04 and 300.03 (Figure 3), ascribable to the [Y0]− (Δ = −1.0 ppm) and [Y0−H]•− (Δ = 3.7 ppm) of quercetin aglycone. This fragmentation (see Scheme S5) corresponds to the neutral loss of 308 Da, consistent with deoxyhexose-hexoside unit [1]. Further typical ions were observed at m/z 151.00 and m/z 179.00, due to different retrocyclization processes [43]. Thus, the feature was tentatively identified as quercetin-deoxyhexose-hexoside. Peak 15 exhibited a [M−H]− pseudo-molecular ion at m/z 463.09, which is commonly found in many phenolic-rich fruits and attributed to flavonol glycosides [1,18]. However, the fragmentation pattern here observed highlighted product ions at m/z 327.05, 175.03 and 125.02, with no evidence of the aglycone ion formation (see Figure 4). Even though phenolic glycosides normally fragment through the cleavage of the glycosidic bond, the sugar moiety may undergo other bond breakings such as the cross-ring cleavage of the hexose part [44]. Based on the aforementioned findings, and considering the previously reported annotations of quercetin-3-O-hexosides (Peaks 36 and 38), this feature was tentatively attributed to a tetrahydroxyflavonol-3-O-hexoside with the aglycone different from quercetin (see Scheme S6). Peak 30 exhibited a [M−H]− pseudo-molecular ion at m/z 651.20, which fragmented giving rise to a base peak at m/z 593.17 and main further ions at m/z 325.08, 285.04 and 284.03 (Figure 5). According to the hypothesized fragmentation illustrated in Scheme S7, these latter ions are consistent with a flavonoid scaffold and can be originated from the base peak by the formal loss of a deoxyhexose-hexoside moiety, due to the homolytic (m/z 284.03) or heterolytic (m/z 285.04) fission of the glycosidic bond. Finally, the product ion at m/z 325.08 derived from the cleavage of the carbon-oxygen bond on the aglycone ring. Thus, such structural information led to the tentative annotation of Peak 30 to a trihydroxy-methoxyflavone deoxyhexose-hexose derivative. One flavanol (Peak 55) was also identified under positive ionization (Table 3). In detail, this feature exhibited [M + H]+ pseudo-molecular ion at m/z 481.10, which fragmented giving rise to the loss of 162.05 Da (hexose unit) and the product ion at m/z 319.05, consistent with the myricetin aglycone. The comparison with tR and MS2 fragmentation pattern of myricetin-3-O-glucoside reference standard confirmed the attribution to a myricetin hexoside but excluded the occurrence of the glucoside derivative. Myricetin derivatives have been identified as typical metabolomics traits of several berries [45], but this study revealed for the first time their occurrence in R. idaeus yellow variety.
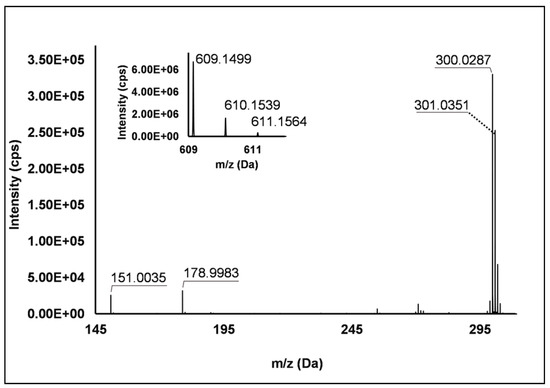
Figure 3.
TOF MS (top left) and Q/TOF MS2 spectrum of Peak 13, identified as quercetin-deoxyhexose-hexoside.
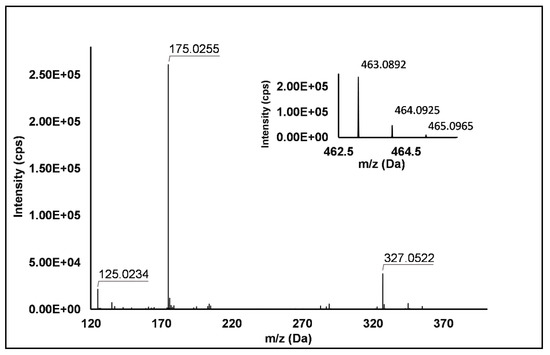
Figure 4.
TOF MS (top right) and Q/TOF MS2 spectra of Peak 15, tentatively identified as tetrahydroxyflavonol-3-O-hexoside.

Figure 5.
TOF MS (top left) and Q/TOF MS2 spectra of Peak 30, tentatively identified as trihydroxy-methoxyflavone deoxyhexose-hexose derivative.
Anthocyanins: As illustrated in Table 3, the features identified in positive ionization mode were mostly anthocyanins, which were annotated at Levels I and II. In detail, the majority of the anthocyanins detected in the four raspberry varieties were cyanidin mono-, di- and tri-glycosides. These antioxidant compounds are well-known metabolic traits of raspberries, and in general of berries, being responsible for their red to purple pigmentation [19,46]. Peaks 50, 52, 54, 57 and 63 were annotated at Level I as cyanidin-3-O-sophoroside, cyanidin-3-O-galactoside, cyanidin-3-O-glucoside, cyanidin-3-O-rutinoside and cyanidin-3-O-arabinoside, respectively. These anthocyanins occurred in all the investigated raspberry fruit samples (intensity order: J >> T > GA > G), with the only exception of Peak 63, which was found only in R. occidentalis variety. Other cyanidin derivatives, elsewhere annotated in Rubus species [17,18,23,47], were identified here throughout the investigated samples. Among them, Peaks 53, 60 and 64 were annotated at Level II in GA, T and J cultivars, while they were absent in G variety. Peak 53 exhibited [M]+ molecular ion at m/z 727.21 and MS2 spectra highlighting successive losses of 146 Da (deoxyhexose unit) up to the formation of the well-known cyanidin aglycone at m/z 287.06. Thus, Peak 53 was putatively annotated as cyanidin-3-O-xylosilrutinoside, which was previously reported in R. idaeus berries [18]. Peaks 60 and 64 exhibited the same [M]+ ion at m/z 595.17 and fragmentation pattern, which was characterized by successive losses of deoxyhexose (146 Da) and hexose (162 Da) units, giving rise to the cyanidin aglycone. These peaks were putatively annotated as two positional isomers of cyanidin diglycoside with hexose and rhamnose units. This attribution was consistent with: (i) their increased hydrophobicity compared to Peak 57 (cyanidin-3-O-rutinoside), ascribable to different linkages of the two glycosidic moieties (e.g., C3−glucose and C7−rhamnose) [48]; and (ii) the matches of their MS2 spectra with that of Peak 57. Peak 62 showed a unique loss (132 Da) in its MS2 spectra, leading to cyanidin aglycone fragment, which was ascribable to aldopentose loss [1]; moreover, thanks to the spectral matches with cyanidin-3-O-arabinoside reference standard, it was addressed at Level II as cyanidin-3-O-aldopentose. The remaining cyanidin derivatives were identified at Level II as cyanidin-3-O-(2G-glucosylrutinoside) (Peak 51, Δ = 0.1 ppm) and cyanidin-3-O-malonyl-glucoside (Peak 68, Δ = −1.5 ppm) with high mass accuracy, according to the isotopic profile of molecular ions and fragmentation pattern reported in previous studies [1,23].
Other fundamental anthocyanins in raspberries were pelargonidin derivatives, being their occurrence strongly dependent on fruit varieties [2], generally following the order J > T ≥ GA >> G. In detail, pelargonidin glycosides (Table 3) were putatively identified through the presence of the aglycone peak in the MS2 spectra (m/z 271.06) and of specific losses [18,23]: Peak 56 is the sophorose loss (324 Da,), Peak 58 is the successive losses of deoxyhexose (146 Da) and rutinose (324 Da) moieties, Peak 59 is the loss of glucose (162 Da) and Peak 61 is the deoxyhexose loss followed by glucose loss. Peak 56 occurred in the entire set of investigated raspberry cultivars, whereas Peaks 58 and 59 were both absent in yellow fruits, in which the anthocyanin content is strongly reduced [42]. As expected, pelargonidin-3-O-rutinoside was detected only in R. occidentalis black raspberries, since it has been already recognized as a specific trait of these fruits [2,16]. Thanks to the availability of reference standards, other two anthocyanins were identified at Level I in the four raspberry varieties; in detail, Peaks 65 and 66 were addressed as peonidin-3-O-glucoside and delphinidin-3-O-rutinoside, respectively. The former compound was detected in all investigated samples, notably for the very first time in yellow cultivar, while the latter occurred only in R. occidentalis fruits. It should be noted that delphinidin derivatives have been generally associated to the secondary metabolism of bilberry, blueberry and blackcurrant [1,49], and they represent an uncommon trait for R. idaeus species, but they can occur in different raspberry species [50] as reported in this study. Overall, the occurrence profile of anthocyanins here presented (i.e., J > T ≥ GA > G) agreed with previously reported data on raspberries. In fact, the content of anthocyanins in black cultivars is generally 3–10 times higher than in red fruits [46,51].
Other phenolics: Under negative ionization, nine further phenolic compounds (i.e., Peaks 26, 29, 31, 33, 35, 40, 42, 43, 45 and 47) were putatively or unequivocally identified in at least one of the four raspberry varieties investigated (Table 2). Peak 26 (detected only in G Rubus idaeus fruits) was characterized by a mono-charged precursor ion at m/z 341.12, which fragmented in m/z 179.07 and 121.03. The ion at m/z 341.12 derived from the loss of 162 Da (hexose unit) from the quasi-molecular ion and further fragmented in m/z 121.03 (loss of 57.03 Da). Interestingly, the two fragments are consistent with mass spectra of the available standard of coniferyl alcohol and literature findings [52]; accordingly, Peak 26 was undoubtedly identified as coniferin. This compound was previously annotated in the yellow raspberry cultivar “Heritage” and can therefore considered as a typical metabolic trait of yellow R. idaeus fruits [42]. Peaks 31, 35, 40, 43 and 47 were identified at Level I as taxifolin (flavanolol), ellagic acid, naringenin-7-O-glucoside (flavanone), phloridzin and phloretin (chalcones), confirming the annotations previously reported in raspberry varieties [23,25]. Peak 33 was also annotated at Level I and ascribed to polydatin (i.e., trihydroxystilbene-3-O-glucoside), the occurrence of which is conversely reported here for the first time in R. occidentalis berries. Peak 29 exhibited a [M–H]– pseudo-molecular ion at m/z 593.15, and it was putatively annotated with good accuracy (Δ = −0.1 ppm) as apigenin diglucoside in comparison with spectral libraries. In fact, its fragmentation originated the product ions at m/z 475.14 (loss of 118 Da, retro-cyclization of the flavonoid C ring) and at m/z 431.06 (loss of 162 Da, consistent with a hexoside moiety). The latter further fragmented giving rise to the base peak at m/z 245.14, deriving from a retro-cyclization process and a consequent loss of 72 Da. Peaks 42 ([M−H]– = 447.06 Da) and 45 ([M−H]– = 475.05 Da) were preliminary recognized owing to the occurrence of fragments at m/z 315.02 and 301.00 (base peaks), which corresponded with good accuracy to methylellagic acid (Δ = 18.7 ppm) and ellagic acid (Δ = −3.3 ppm) units. The pseudo-molecular ion of Peak 42 loosed a pentoside group (i.e., 132 Da) giving rise to the aforementioned base peak, which further fragmented in m/z 285.04, consistently with the loss of a methoxy group (31 Da). Peak 42 was therefore putatively identified as methylellagic acid pentose conjugate. Instead, the precursor ion of Peak 45, besides base peak, was characterized by fragments at m/z 432.03 and 329.13, originated from a loss of 43 Da (acetyl moiety) and from the cross-ring cleavage of the saccharide moiety, respectively. Based on these considerations and on findings previously reported in the literature [53], this peak was tentatively annotated as ellagic acid acetyl-pentose conjugate.
Non-phenolic compounds: Among the features identified in negative ionization (Table 2), Peaks 48 ([M−H]− = 503.34 Da) and 49 ([M−H]− = 487.34 Da) were detected in at least two raspberry varieties and attributed to the free triterpenic acids (TTPAs) madecassic acid (Δ = 3.6 ppm) and asiatic acid (Δ = −0.4 ppm). The two peaks exhibited similar MS2 fragmentation patterns, consistent to the aforementioned annotations, owing to successive neutral losses of water (18 Da) and CO2 (44 Da). The isotopic profile of full scan MS and MS2 spectra were also consistent with TTPAs [54]. The Level II identification of asiatic acid (Peaks 49) in T and GA varieties was in agreement with findings previously reported [55], while madecassic acid (Peak 48) was detected here for the first time in R. idaeus varieties.
Among the set of features identified in positive ionization mode (Table 3), Peak 67 showed a [M + H]+ pseudo-molecular ion at m/z 331.15 (Δ = −0.3 ppm), which occurred in all the raspberry sample here investigated. The fragmentation pattern (Figure 6) was characterized by the cleavage of the five-carbon ring, which gave rise to m/z 151.07, and the successive loss of the methyl group producing m/z 137.06 (see Scheme S8). Accordingly, thanks to the analysis of available spectral libraries, Peak 67 was putatively ascribed to gibberellin A7. Although gibberellins have been already investigated as phytohormones responsible of flowering in R. idaeus plants [56,57,58], this study provided for the first time its occurrence in R. occidentalis J variety.
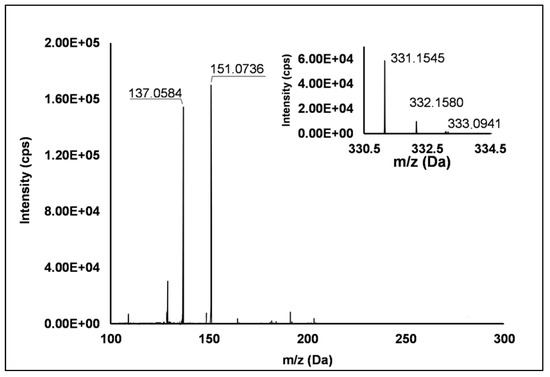
Figure 6.
TOF MS (top right) and Q/TOF MS2 spectra of Peak 67, tentatively identified as gibberellin A7.
3.3. Genotype Effects
A multivariate elaboration of the autoscaled original data (e.g., chromatographic feature intensities) was performed separately for compounds detected in negative and positive polarity, by means of PCA in order to discover possible clusterization among the investigated samples. As regards compounds detected in negative polarity, four principal components (PCs), characterized by eigenvalues > 1 and accounting for percentages of explained variances (EV%) of 55.4%, 19.5%, 13.1% and 5.2%, were obtained (total EV% = 93.2). Four significant PCs were also found for features identified in positive ionization, each one accounting for EV% of 55.2%, 16.6%, 13.6% and 8.4% (total EV% = 93.8%).
Figure 7 summarizes the information obtained from the metabolomics profiling of the native compounds occurring in the investigated raspberry samples (including QCs), allowing for identifying more easily possible genotype effects: (i) among different cultivars of R. idaeus; and (ii) between R. idaeus and R. occidentalis species. In detail, Figure 7A,B illustrates the score plots of PC1 vs. PC2 of the significant features identified in negative and positive polarity, respectively, while Figure 7C,D shows the corresponding loading plots. In both datasets, the percentage of cumulative EV% of PC1 vs. PC2 space was > 70%, making the PCA results shown in Figure 7 highly significant. Moreover, in both score plots, QCs were very close to the origin of the coordinates, indicating the high accuracy and precision of the entire analytical procedure. It should also be remarked that, in both score graphs, replicated samples showed very similar coordinates, thus indicating the homogeneous results obtained within each treatment.
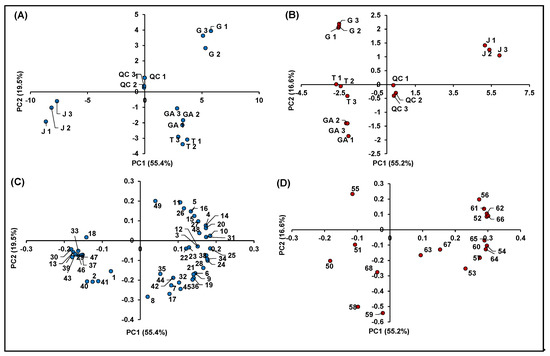
Figure 7.
Principal component analysis of the 68 identified significant features in R. idaeus and R. occidentalis fruits. (A) Score plot PC1 vs. PC2 of identified features in negative ionization; (B) score plot PC1 vs. PC2 of identified features in positive ionization; (C) loading plot PC1 vs. PC2 of identified features in negative ionization; and (D) loading plot PC1 vs. PC2 of identified features in positive ionization.
Both score plots showed a strong discrimination among different cultivars of R. idaeus and also between R. idaeus and R. occidentalis species, thus highlighting an effect of genotype on the expression of the annotated (poly)phenols. Interestingly, the four cultivars clustered according to their color not only as a function of their anthocyanin content (Figure 7B), but also in terms of the expression of other (poly)phenolics (Figure 7A). More in detail, as illustrated in Figure 7C, the red raspberries (i.e., GA and T) were mostly represented by ellagic acid and its derivatives and especially ellagitannins, which occurred in these cultivars with much higher intensities compared to J and G. Conversely, the G variety (R. idaeus) was mainly discriminated by the remarkable occurrence of flavanols, while the clusterization of the J cultivar (R. occidentalis) was due to the predominant presence of a miscellaneous compounds, which included mainly some flavonols and phenolic acids, one stilbene and two chalcones. A clearer scenario was highlighted for anthocyanins (Figure 7D), which were by far more abundant in J (R. occidentalis) as expected by its colorimetric analysis (Table 1). Cyanidin-3-O-sophoroside (Peak 50) and cyanidin-3-O-(2G-glucosylrutinoside) (Peak 51) were the only exceptions, being them more expressed in GA and T (R. idaeus).
3.4. Correlations Between Identified Features and Pomological Parameters
Figure 8 illustrates the PPMC analysis of the features identified in both ionization modes in relation to the main pomological parameters (Table 1) of the investigated raspberries. A significant (p-value < 0.05) positive correlation was found between brightness (L) and the presence of free and condensed flavanols (i.e., Peaks 4, 5, 10, 16, 20 and 26), since these metabolites were found to be a distinctive metabolic trait of the yellow and brighter cultivar G, as observed in the PCA. A positive correlation, although characterized by a greater coefficient spread, was also observed between ellagitannins (i.e., Peaks 7, 8, 12, 19, 21–24 and 28) and some phenolic acid glycosides (i.e., Peaks 6, 9, 18 and 27). Moreover, the signal intensity of both these groups of compounds positively correlated with the “a” color coordinate, indicating that, as the fruit color turns red, the intensities of these (poly)phenols increased. Conversely, some anthocyanins exhibited an unexpected statistically significant inverse correlation with respect to the coordinate “a”. However, the predominant anthocyanins of raspberries, i.e., the Peaks 50, 51, 58 and 59, were strongly and significantly correlated with the red color of fruits. Interestingly, a positive correlation was found among anthocyanins, flavonols glycosides and TSS, suggesting that the expression of soluble sugars, which contribute extensively to this parameter, is related to the presence of some (poly)phenolic classes. As a final outcome, the acidity of raspberry fruits, expressed as titratable acids (TA), is significantly correlated to the presence of hydroxycinnamic acids (i.e., Peaks 6, 9 and 18), ellagitannins (i.e., Peaks 7, 8, 12, 19, 21–24 and 28) and ellagic acid and its derivatives (i.e., Peaks 35, 42 and 45).
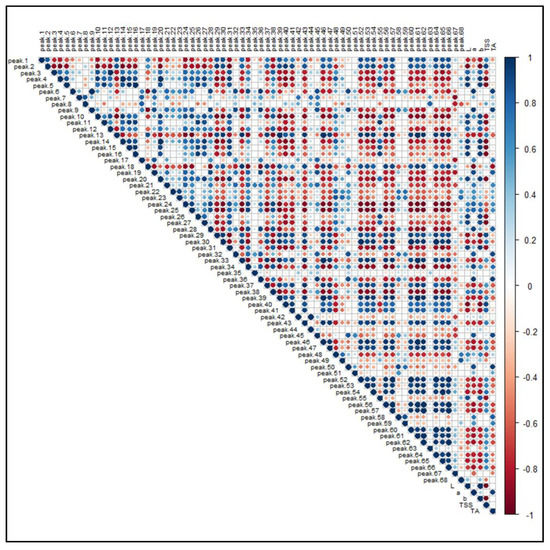
Figure 8.
Pearson product-moment correlation analysis of the 68 identified features in R. idaeus and R. occidentalis berries against pomological parameters. Features are indexed as reported in Table 1 (T1) and Table 2 (T2), respectively. Standard pomological data are reported in Table 1. L, brightness; a, red-shift; b, yellow-shift; TSS, total soluble solids (°Brix); TA, titratable acids (g citric acid kg−1 f.w.). The colored scale indicates the degree of correlation (white to blue color) or anti-correlation (white to red color).
4. Conclusions
This paper offers novel information on the (poly)phenolic composition of raspberry fruits, thanks to the adopted comprehensive untargeted strategy and data processing for features annotation, together with identity confirmation with authentic standards.
Briefly, 68 bioactive compounds were successfully identified at Levels I and II, providing an in-depth characterization of the investigated raspberry genotypes. Even though most of the identified features belong to the already known major categories of (poly)phenols occurring in raspberry fruits (i.e., phenolic acids, ellagitannins, flavonols, flavanols and anthocyanins), this study extends the current knowledge of native composition on R. idaeus and above all R. occidentalis, the latter being scarcely investigated elsewhere. In fact, ferulic acid glycosides, one ellagitannin and madecassic acid were annotated for the first time in all the four investigated varieties. Additionally, the annotation of flavonol glycosides, polydatin and gibberellin A7 in R. occidentalis and of myricetin hexoside and peonidin-3-glucoside in the G raspberry cultivar of the R. idaeus species represent a first report in the investigated samples.
The identification of few non-phenolic compounds possessing antioxidant properties, such as triterpenic acids, suggested the importance of extending untargeted investigations to compounds other than (poly)phenolic compounds.
Overall, the in-depth profiling of raspberry secondary metabolites, together with the PCA carried out on the identified features, clearly highlighted the presence of genotype effects: (i) among different cultivars of R. idaeus; and (ii) between R. idaeus and R. occidentalis species. The latter represents an aspect investigated here for the first time.
Supplementary Materials
The following are available online at https://www.mdpi.com/article/10.3390/antiox10050704/s1, Figure S1: TOF MS (top right) and Q/TOF MS2 spectra of Peaks 6 and 9 tentatively identified as ferulic acid hexosides. Scheme S1: Hypothesized structure and fragmentation scheme for Peaks 5 and 6 ([M–H]− = 355.1024). Figure S2: TOF MS (top right) and Q/TOF MS2 spectra of Peak 27 tentatively identified as sinapic acid hexosides. Scheme S2: Hypothesized structure and fragmentation scheme for Peak 27 ([M–H]− = 385.1154). Scheme S3: Hypothesized structure and fragmentation scheme for Peak 28 ([M–2H]2−/2 = 859.0802). Scheme S4: Hypothesized structure and fragmentation scheme for Peak 11 ([M–H]− = 863.1903). Scheme S5: Hypothesized structure and fragmentation scheme for Peak 13 ([M–H]− = 609.1499). Scheme S6: Hypothesized structure and fragmentation scheme for Peak 15 ([M–H]− = 463.0892). Scheme S7: Hypothesized structure and fragmentation scheme for Peak 30 ([M–H]− = 651.1963). Scheme S8: Hypothesized structure and fragmentation scheme for Peak 67 ([M + H]+ = 331.1545).
Author Contributions
Conceptualization, E.G. and M.D.B.; data curation, L.R., M.U. and W.A.P.; Investigation, L.R., C.V.A.S. and F.T.; Funding acquisition, E.G.; Resources, U.C.; writing—original draft, L.R. and M.D.B.; and Writing—review and editing, S.N. All authors have read and agreed to the published version of the manuscript.
Funding
This research was funded by Regione Toscana, PIF 40/2015.
Institutional Review Board Statement
Not applicable.
Informed Consent Statement
Not applicable.
Data Availability Statement
The data are contained within the article or the Supplementary Materials.
Conflicts of Interest
The authors declare no conflict of interest. The funders had no role in the design of the study; in the collection, analyses, or interpretation of data; in the writing of the manuscript, or in the decision to publish the results.
References
- Ancillotti, C.; Ciofi, L.; Rossini, D.; Chiuminatto, U.; Stahl-Zeng, J.; Orlandini, S.; Furlanetto, S.; Del Bubba, M. Liquid chromatographic/electrospray ionization quadrupole/time of flight tandem mass spectrometric study of polyphenolic composition of different Vaccinium berry species and their comparative evaluation. Anal. Bioanal. Chem. 2017, 409, 1347–1368. [Google Scholar] [CrossRef]
- Kula, M.; Majdan, M.; Głód, D.; Krauze-Baranowska, M. Phenolic composition of fruits from different cultivars of red and black raspberries grown in Poland. J. Food Compos. Anal. 2016, 52, 74–82. [Google Scholar] [CrossRef]
- La Barbera, G.; Capriotti, A.L.; Cavaliere, C.; Piovesana, S.; Samperi, R.; Chiozzi, R.Z.; Laganà, A. Comprehensive polyphenol profiling of a strawberry extract (Fragaria× ananassa) by ultra-high-performance liquid chromatography coupled with high-resolution mass spectrometry. Anal. Bioanal. Chem. 2017, 409, 2127–2142. [Google Scholar] [CrossRef] [PubMed]
- Burton-Freeman, B.M.; Sandhu, A.K.; Edirisinghe, I. Red raspberries and their bioactive polyphenols: Cardiometabolic and neuronal health links. Adv. Nutr. 2016, 7, 44–65. [Google Scholar] [CrossRef] [PubMed]
- Mazzoni, L.; Perez-Lopez, P.; Giampieri, F.; Alvarez-Suarez, J.M.; Gasparrini, M.; Forbes-Hernandez, T.Y.; Quiles, J.L.; Mezzetti, B.; Battino, M. The genetic aspects of berries: From field to health. J. Sci. Food Agric. 2016, 96, 365–371. [Google Scholar] [CrossRef]
- Del Bubba, M.; Di Serio, C.; Renai, L.; Scordo, C.V.A.; Checchini, L.; Ungar, A.; Tarantini, F.; Bartoletti, R. Vaccinium myrtillus L. extract and its native polyphenol-recombined mixture have anti-proliferative and pro-apoptotic effects on human prostate cancer cell lines. Phytother. Res. 2020, 35, 1089–1098. [Google Scholar] [CrossRef]
- Domazetovic, V.; Marcucci, G.; Falsetti, I.; Bilia, A.R.; Vincenzini, M.T.; Brandi, M.L.; Iantomasi, T. Blueberry Juice Antioxidants Protect Osteogenic Activity against Oxidative Stress and Improve Long-Term Activation of the Mineralization Process in Human Osteoblast-Like SaOS-2 Cells: Involvement of SIRT1. Antioxidants 2020, 9, 125. [Google Scholar] [CrossRef]
- God, J.; Tate, P.L.; Larcom, L.L. Red raspberries have antioxidant effects that play a minor role in the killing of stomach and colon cancer cells. Nutr. Res. 2010, 30, 777–782. [Google Scholar] [CrossRef]
- Rodriguez-Mateos, A.; Pino-García, R.D.; George, T.W.; Vidal-Diez, A.; Heiss, C.; Spencer, J.P. Impact of processing on the bioavailability and vascular effects of blueberry (poly) phenols. Mol. Nutr. Food Res. 2014, 58, 1952–1961. [Google Scholar] [CrossRef]
- Park, E.; Edirisinghe, I.; Wei, H.; Vijayakumar, L.P.; Banaszewski, K.; Cappozzo, J.C.; Burton-Freeman, B. A dose–response evaluation of freeze-dried strawberries independent of fiber content on metabolic indices in abdominally obese individuals with insulin resistance in a randomized, single-blinded, diet-controlled crossover trial. Mol. Nutr. Food Res. 2016, 60, 1099–1109. [Google Scholar] [CrossRef]
- Lee, J.; Dossett, M.; Finn, C.E. Rubus fruit phenolic research: The good, the bad, and the confusing. Food Chem. 2012, 130, 785–796. [Google Scholar] [CrossRef]
- Hidalgo, G.-I.; Almajano, M.P. Red fruits: Extraction of antioxidants, phenolic content, and radical scavenging determination: A review. Antioxidants 2017, 6, 7. [Google Scholar] [CrossRef] [PubMed]
- Pinczinger, D.; Reth, M.v.; Keilwagen, J.; Berner, T.; Peil, A.; Flachowsky, H.; Emeriewen, O.F. Mapping of the Waxy Bloom Gene in ‘Black Jewel’in a Parental Linkage Map of ‘Black Jewel’בGlen Ample’(Rubus) Interspecific Population. Agronomy 2020, 10, 1579. [Google Scholar] [CrossRef]
- FAOSTAT. Food and Agriculture Organization of United Nations. Available online: http://www.fao.org/faostat/en/#data/QC (accessed on 3 January 2021).
- Teegarden, M.D.; Schwartz, S.J.; Cooperstone, J.L. Profiling the impact of thermal processing on black raspberry phytochemicals using untargeted metabolomics. Food Chem. 2019, 274, 782–788. [Google Scholar] [CrossRef] [PubMed]
- Paudel, L.; Wyzgoski, F.J.; Giusti, M.M.; Johnson, J.L.; Rinaldi, P.L.; Scheerens, J.C.; Chanon, A.M.; Bomser, J.A.; Miller, A.R.; Hardy, J.K. NMR-based metabolomic investigation of bioactivity of chemical constituents in black raspberry (Rubus occidentalis L.) fruit extracts. J. Agric. Food Chem. 2014, 62, 1989–1998. [Google Scholar] [CrossRef]
- Mazur, S.P.; Nes, A.; Wold, A.-B.; Remberg, S.F.; Aaby, K. Quality and chemical composition of ten red raspberry (Rubus idaeus L.) genotypes during three harvest seasons. Food Chem. 2014, 160, 233–240. [Google Scholar] [CrossRef]
- Dincheva, I.; Badjakov, I.; Kondakova, V.; Dobson, P.; Mcdougall, G.; Stewart, D. Identification of the phenolic components in Bulgarian raspberry cultivars by LC-ESI-MSn. Int. J. Agric. Sci. Res. 2013, 3, 137–138. [Google Scholar]
- Mullen, W.; Lean, M.E.; Crozier, A. Rapid characterization of anthocyanins in red raspberry fruit by high-performance liquid chromatography coupled to single quadrupole mass spectrometry. J. Chromatogr. A 2002, 966, 63–70. [Google Scholar] [CrossRef]
- Remberg, S.F.; Sønsteby, A.; Aaby, K.; Heide, O.M. Influence of postflowering temperature on fruit size and chemical composition of Glen Ample raspberry (Rubus idaeus L.). J. Agric. Food Chem. 2010, 58, 9120–9128. [Google Scholar] [CrossRef]
- Borges, G.; Degeneve, A.; Mullen, W.; Crozier, A. Identification of flavonoid and phenolic antioxidants in black currants, blueberries, raspberries, red currants, and cranberries. J. Agric. Food Chem. 2009, 58, 3901–3909. [Google Scholar] [CrossRef]
- Bradish, C.M.; Perkins-Veazie, P.; Fernandez, G.E.; Xie, G.; Jia, W. Comparison of flavonoid composition of red raspberries (Rubus idaeus L.) grown in the Southern United States. J. Agric. Food Chem. 2011, 60, 5779–5786. [Google Scholar] [CrossRef] [PubMed]
- Zhang, X.; Sandhu, A.; Edirisinghe, I.; Burton-Freeman, B. An exploratory study of red raspberry (Rubus idaeus L.)(poly) phenols/metabolites in human biological samples. Food Funct. 2018, 9, 806–818. [Google Scholar] [CrossRef] [PubMed]
- Ancillotti, C.; Ulaszewska, M.; Mattivi, F.; Del Bubba, M. Untargeted Metabolomics Analytical Strategy Based on Liquid Chromatography/Electrospray Ionization Linear Ion Trap Quadrupole/Orbitrap Mass Spectrometry for Discovering New Polyphenol Metabolites in Human Biofluids after Acute Ingestion of Vaccinium myrtillus Berry Supplement. J. Am. Soc. Mass Spectrom. 2019, 30, 381–402. [Google Scholar]
- Carvalho, E.; Franceschi, P.; Feller, A.; Palmieri, L.; Wehrens, R.; Martens, S. A targeted metabolomics approach to understand differences in flavonoid biosynthesis in red and yellow raspberries. Plant Physiol. Biochem. 2013, 72, 79–86. [Google Scholar] [CrossRef]
- Renai, L.; Tozzi, F.; Scordo, C.V.; Giordani, E.; Bruzzoniti, M.C.; Fibbi, D.; Mandi, L.; Ouazzani, N.; Del Bubba, M. Productivity and nutritional and nutraceutical value of strawberry fruits (Fragaria x ananassa Duch.) cultivated under irrigation with treated wastewaters. J. Sci. Food Agric. 2021, 101, 1239–1246. [Google Scholar] [CrossRef] [PubMed]
- Del Bubba, M.; Giordani, E.; Ancillotti, C.; Petrucci, W.A.; Ciofi, L.; Morelli, D.; Marinelli, C.; Checchini, L.; Furlanetto, S. Morphological, nutraceutical and sensorial properties of cultivated Fragaria vesca L. berries: Influence of genotype, plant age, fertilization treatment on the overall fruit quality. Agric. Food Sci. 2016, 25, 187–201. [Google Scholar] [CrossRef]
- Tozzi, F.; Legua, P.; Martínez-Nicolás, J.J.; Núñez-Gómez, D.; Giordani, E.; Melgarejo, P. Morphological and nutraceutical characterization of six pomegranate cultivars of global commercial interest. Sci. Hortic. 2020, 272, 109557. [Google Scholar] [CrossRef]
- Douglas, C.E.; Michael, F.A. On distribution-free multiple comparisons in the one-way analysis of variance. Commun. Stat. Theory Methods 1991, 20, 127–139. [Google Scholar] [CrossRef]
- Sumner, L.W.; Amberg, A.; Barrett, D.; Beale, M.H.; Beger, R.; Daykin, C.A.; Fan, T.W.-M.; Fiehn, O.; Goodacre, R.; Griffin, J.L. Proposed minimum reporting standards for chemical analysis. Metabolomics 2007, 3, 211–221. [Google Scholar] [CrossRef]
- Krüger, E.; Dietrich, H.; Schöpplein, E.; Rasim, S.; Kürbel, P. Cultivar, storage conditions and ripening effects on physical and chemical qualities of red raspberry fruit. Postharvest Biol. Technol. 2011, 60, 31–37. [Google Scholar] [CrossRef]
- Pantelidis, G.E.; Vasilakakis, M.; Manganaris, G.A.; Diamantidis, G. Antioxidant capacity, phenol, anthocyanin and ascorbic acid contents in raspberries, blackberries, red currants, gooseberries and Cornelian cherries. Food Chem. 2007, 102, 777–783. [Google Scholar] [CrossRef]
- Stavang, J.A.; Freitag, S.; Foito, A.; Verrall, S.; Heide, O.M.; Stewart, D.; Sønsteby, A. Raspberry fruit quality changes during ripening and storage as assessed by colour, sensory evaluation and chemical analyses. Sci. Hortic. 2015, 195, 216–225. [Google Scholar] [CrossRef]
- Wang, S.Y.; Chen, C.-T.; Wang, C.Y. The influence of light and maturity on fruit quality and flavonoid content of red raspberries. Food Chem. 2009, 112, 676–684. [Google Scholar] [CrossRef]
- Schulz, M.; Chim, J.F. Nutritional and bioactive value of Rubus berries. Food Biosci. 2019, 31, 100438. [Google Scholar] [CrossRef]
- Del Bubba, M.; Checchini, L.; Chiuminatto, U.; Doumett, S.; Fibbi, D.; Giordani, E. Liquid chromatographic/electrospray ionization tandem mass spectrometric study of polyphenolic composition of four cultivars of Fragaria vesca L. berries and their comparative evaluation. J. Mass Spectrom. 2012, 47, 1207–1220. [Google Scholar] [CrossRef]
- Hager, T.J.; Howard, L.R.; Liyanage, R.; Lay, J.O.; Prior, R.L. Ellagitannin composition of blackberry as determined by HPLC-ESI-MS and MALDI-TOF-MS. J. Agric. Food Chem. 2008, 56, 661–669. [Google Scholar] [CrossRef]
- Mullen, W.; Yokota, T.; Lean, M.E.; Crozier, A. Analysis of ellagitannins and conjugates of ellagic acid and quercetin in raspberry fruits by LC–MSn. Phytochemistry 2003, 64, 617–624. [Google Scholar] [CrossRef]
- McDougall, G.; Martinussen, I.; Stewart, D. Towards fruitful metabolomics: High throughput analyses of polyphenol composition in berries using direct infusion mass spectrometry. J. Chromatogr. B 2008, 871, 362–369. [Google Scholar] [CrossRef]
- Mullen, W.; McGinn, J.; Lean, M.E.; MacLean, M.R.; Gardner, P.; Duthie, G.G.; Yokota, T.; Crozier, A. Ellagitannins, flavonoids, and other phenolics in red raspberries and their contribution to antioxidant capacity and vasorelaxation properties. J. Agric. Food Chem. 2002, 50, 5191–5196. [Google Scholar] [CrossRef]
- Teixeira, N.; Azevedo, J.; Mateus, N.; de Freitas, V. Proanthocyanidin screening by LC–ESI-MS of Portuguese red wines made with teinturier grapes. Food Chem. 2016, 190, 300–307. [Google Scholar] [CrossRef]
- Carvalho, E.; Fraser, P.D.; Martens, S. Carotenoids and tocopherols in yellow and red raspberries. Food Chem. 2013, 139, 744–752. [Google Scholar] [CrossRef] [PubMed]
- Justino, G.C.; Borges, C.M.; Florêncio, M.H. Electrospray ionization tandem mass spectrometry fragmentation of protonated flavone and flavonol aglycones: A re-examination. Rapid Commun. Mass Spectrom. 2009, 23, 237–248. [Google Scholar] [CrossRef]
- Yuan, T.; Guo, X.-F.; Shao, S.-Y.; An, R.-M.; Wang, J.; Sun, J. Characterization and identification of flavonoids from Bambusa chungii leaves extract by UPLC-ESI-Q-TOF-MS/MS. Acta Chromatogr. 2020. [Google Scholar] [CrossRef]
- Mikulic-Petkovsek, M.; Slatnar, A.; Stampar, F.; Veberic, R. HPLC–MSn identification and quantification of flavonol glycosides in 28 wild and cultivated berry species. Food Chem. 2012, 135, 2138–2146. [Google Scholar] [CrossRef] [PubMed]
- Bobinaitė, R.; Viškelis, P.; Venskutonis, P.R. Variation of total phenolics, anthocyanins, ellagic acid and radical scavenging capacity in various raspberry (Rubus spp.) cultivars. Food Chem. 2012, 132, 1495–1501. [Google Scholar] [CrossRef] [PubMed]
- Kaume, L.; Howard, L.R.; Devareddy, L. The blackberry fruit: A review on its composition and chemistry, metabolism and bioavailability, and health benefits. J. Agric. Food Chem. 2011, 60, 5716–5727. [Google Scholar] [CrossRef] [PubMed]
- Regos, I.; Urbanella, A.; Treutter, D. Identification and quantification of phenolic compounds from the forage legume sainfoin (Onobrychis viciifolia). J. Agric. Food Chem. 2009, 57, 5843–5852. [Google Scholar] [CrossRef]
- Chen, L.; Xin, X.; Yuan, Q.; Su, D.; Liu, W. Phytochemical properties and antioxidant capacities of various colored berries. J. Sci. Food Agric. 2014, 94, 180–188. [Google Scholar] [CrossRef]
- Fu, Y.; Zhou, X.; Chen, S.; Sun, Y.; Shen, Y.; Ye, X. Chemical composition and antioxidant activity of Chinese wild raspberry (Rubus hirsutus Thunb.). Food Sci. Technol. 2015, 60, 1262–1268. [Google Scholar] [CrossRef]
- Weber, C.; Perkins-Veazie, P.; Moore, P.; Howard, L. Variability of antioxidant content in raspberry germplasm. Acta Hortic. 2008, 493–498. [Google Scholar] [CrossRef]
- Tóth, G.; Barabás, C.; Tóth, A.; Kéry, Á.; Béni, S.; Boldizsár, I.; Varga, E.; Noszál, B. Characterization of antioxidant phenolics in Syringa vulgaris L. flowers and fruits by HPLC-DAD-ESI-MS. Biomed. Chromatogr. 2016, 30, 923–932. [Google Scholar] [CrossRef]
- de Andrade Neves, N.; Stringheta, P.C.; Gómez-Alonso, S.; Hermosín-Gutiérrez, I. Flavonols and ellagic acid derivatives in peels of different species of jabuticaba (Plinia spp.) identified by HPLC-DAD-ESI/MSn. Food Chem. 2018, 252, 61–71. [Google Scholar] [CrossRef] [PubMed]
- Guo, S.; Duan, J.-A.; Tang, Y.-P.; Yang, N.-Y.; Qian, D.-W.; Su, S.-L.; Shang, E.-X. Characterization of triterpenic acids in fruits of Ziziphus species by HPLC-ELSD-MS. J. Agric. Food Chem. 2010, 58, 6285–6289. [Google Scholar] [CrossRef]
- Wang, Y.; Suo, Y.; Sun, Y.; You, J. Determination of triterpene acids from 37 different varieties of raspberry using pre-column derivatization and HPLC fluorescence detection. Chromatographia 2016, 79, 1515–1525. [Google Scholar] [CrossRef]
- Chai, L.; Li, Y.; Chen, S.; Perl, A.; Zhao, F.; Ma, H. RNA sequencing reveals high resolution expression change of major plant hormone pathway genes after young seedless grape berries treated with gibberellin. Plant Sci. 2014, 229, 215–224. [Google Scholar] [CrossRef] [PubMed]
- Pérez, F.J.; Viani, C.; Retamales, J. Bioactive gibberellins in seeded and seedless grapes: Identification and changes in content during berry development. Am. J. Enol. Vitic. 2000, 51, 315–318. [Google Scholar]
- Palonen, P.; Pehkonen, E.; Rantanen, M. Growth control of “Glen Ample” and “Tulameen” raspberry cultivars with single and repeated ProCa applications. Eur. J. Hortic. Sci. 2013, 78, 22–29. [Google Scholar]


Publisher’s Note: MDPI stays neutral with regard to jurisdictional claims in published maps and institutional affiliations. |
© 2021 by the authors. Licensee MDPI, Basel, Switzerland. This article is an open access article distributed under the terms and conditions of the Creative Commons Attribution (CC BY) license (https://creativecommons.org/licenses/by/4.0/).