Morphogenetic Variability as Potential Biomarker of Functional Outcome After Ischemic Stroke

 and
and
Abstract
1. Introduction
2. Methods
2.1. Study Group
2.2. Functional Status Estimation
2.3. Tested Homozygous Recessive Characteristics
2.4. Statistical Analysis
3. Results
4. Discussion
5. Conclusions
Author Contributions
Funding
Acknowledgments
Conflicts of Interest
References
- Chopp, M.; Li, Y.; Zhang, J. Plasticity and remodeling of brain. J. Neurol. Sci. 2008, 265, 97–101. [Google Scholar] [CrossRef] [PubMed]
- Lindgren, A.; Maguire, J. Stroke Recovery Genetics. Stroke 2016, 47, 2427–2434. [Google Scholar] [CrossRef] [PubMed]
- Maguire, J.; Thakkinstian, A.; Levi, C.; Lincz, L.; Bisset, L.; Sturm, J.; Scott, R.; Whyte, S.; Attia, J. Impact of COX-2 rs5275 and rs20417 and GPIIIa rs5918 polymor- phisms on 90-day ischemic stroke functional outcome: A novel finding. J. Stroke Cerebrovasc. Dis. 2011, 20, 134–144. [Google Scholar] [CrossRef] [PubMed]
- Cramer, S.C.; Procaccio, V.; GAIN Americas; GAIN International Study Investigators. Correlation between genetic polymorphisms and stroke recovery: Analysis of the GAIN Americas and GAIN International Studies. Eur. J. Neurol. 2012, 19, 718–724. [Google Scholar] [CrossRef] [PubMed]
- Pearson-Fuhrhop, K.M.; Burke, E.; Cramer, S.C. The influence of genetic factors on brain plasticity and recovery after neural injury. Curr. Opin. Neurol. 2012, 25, 682–688. [Google Scholar] [CrossRef] [PubMed]
- Stewart, J.C.; Cramer, S.C. Genetic Variation and Neuroplasticity: Role in Rehabilitation after Stroke. J. Neurol. Phys. Ther. 2017, 41, S17–S23. [Google Scholar] [CrossRef]
- Stinear, C.M. Prediction of motor recovery after stroke: Advances in biomarkers. Lancet Neurol. 2017, 16, 826–836. [Google Scholar] [CrossRef]
- Glenny, C.; Stolee, P. Comparing the Functional Independence Measure and the interRAI/MDS for use in the functional assessment of older adults: A review of the literature. BMC Geriatr. 2009, 9, 52. [Google Scholar] [CrossRef]
- Quinn, T.J.; Langhorne, P.; Stott, D.J. Barthel Index for Stroke Trials: Development, Properties, and Application. Stroke 2011, 42, 1146–1151. [Google Scholar] [CrossRef]
- Marinkovic, D.; Ilic, M.; Spremo, B. Studies of human population—Genetic variation. Comparison of homozygously recessive traits in attendants of special and regular schools in Serbia. Arh. Biol. Nauka 1990, 42, 11–12. [Google Scholar]
- Marinkovic, D.; Cvjeticanin, S. Studies of human population genetic. The frequencies of ABO blood types and homozygously recessive traits among top sportsmen and young intellectuals. Arh. Biol. Nauka 1991, 43, 1–2. [Google Scholar]
- Marinkovic, D.; Cvjeticanin, S. Anthropogenetic Homozygosity and Adaptive Variability. In HRC-Test in Studies of Human Populations; Serbian Academy of Sciences and Arts: Belgrade, Serbia, 2013. [Google Scholar]
- Cvjeticanin, S.; Marinković, D. Genetic Variability in the Group of Patients with Congenital Hip Dislocation. Russ. J. Genet. 2005, 41, 936–940. [Google Scholar] [CrossRef]
- Cvjeticanin, S.; Marinkovic, D. Genetic variability and frequencies of ABO blood types among different samples of patients from Serbia. Korean J. Genet. 2005, 27, 35–40. [Google Scholar]
- Marinković, D.; Cvjeticanin, S.; Stanojevic, M. Population genetic analyses of susceptibility to developing alcohol dependence. Addict. Res. Theory 2008, 16, 331–337. [Google Scholar] [CrossRef]
- Petricevic, B.; Cvjeticanin, S. Morphogenetic variability and handedness in Montenegro and Serbia. Russ. J. Genet. 2011, 47, 358–363. [Google Scholar] [CrossRef]
- Brankovic, S.; Cvjeticanin, S. Anthropogenetic variability in groups of children from regular and special schools from different localities in Serbia. Genetika 2016, 48, 743–751. [Google Scholar] [CrossRef]
- Nikolic, D.; Cvjeticanin, S.; Petronić, I.; Milincic, Z.; Brdar, R.; Karan, R.; Konstantinović, L.; Dragin, A.; Cutovic, M. Population genetic analyses of susceptibility to increased body weight. Arch. Med. Sci. 2012, 8, 998–1002. [Google Scholar] [CrossRef] [PubMed]
- Cvjeticanin, S.; Marinković, D. Morphogenetic variability during selection of elite water polo players. J. Sports Sci. 2009, 27, 941–947. [Google Scholar] [CrossRef]
- Online Mendelian Inheritance in Man (OMIM). Available online: http://www.ncbi.nlm.nih.gov (accessed on 16 April 2018).
- Radosavljevic, N.; Lazovic, M.; Nikolic, D.; Petronić, I.; Radosavljevic, Z.; Jeremic, A. Influence of selective comorbidity predictors on functional recovery after hip fracture in an older population. Biomed. Pap. 2012, 156, 365–370. [Google Scholar] [CrossRef]
- Maguire, J.M.; Bevan, S.; Stanne, T.M.; Lorenzen, E.; Fernandez-Cadenas, I.; Hankey, G.J.; Jimenez-Conde, J.; Jood, K.; Lee, J.-M.; Lemmens, R.; et al. GISCOME–Genetics of Ischaemic Stroke Functional Outcome network: A protocol for an international multicentre genetic association study. Eur. Stroke J. 2017, 2, 229–237. [Google Scholar] [CrossRef]
- Boyd, L.A.; Hayward, K.S.; Ward, N.S.; Stinear, C.M.; Rosso, C.; Fisher, R.J.; Carter, A.R.; Leff, A.P.; Copland, D.A.; Carey, L.M.; et al. Biomarkers of Stroke Recovery: Consensus-Based Core Recommendations from the Stroke Recovery and Rehabilitation Roundtable. Neurorehabilit. Neural Repair 2017, 31, 864–876. [Google Scholar] [CrossRef] [PubMed]
- Savić, M.; Cvjeticanin, S.; Lazović, M.; Nikcevic, L.; Nikolić, D. Morphogenetic Variability and Hypertension in Ischemic Stroke Patients—Preliminary Study. J. Clin. Med. 2018, 7, 162. [Google Scholar] [CrossRef] [PubMed]
- Dimitrijevic, S.; Cvjeticanin, S.; Pusica, A.; Jekic, B.; Filipovic, T.; Nikolic, D. Anthropogenetic Variability in the Group of Individuals with Febrile Seizures: Population-Genetic Study. BioMed Res. Int. 2018, 2018, 1–6. [Google Scholar] [CrossRef] [PubMed]
- Karan, R.; Cvjeticanin, S.; Kovacevic-Kostic, N.; Nikolic, D.; Velinovic, M.; Milicevic, V.; Obrenovic-Kircanski, B. Genetic and Environmental Dispositions for Cardiovascular Variability: A Pilot Study. J. Clin. Med. 2018, 7, 232. [Google Scholar] [CrossRef] [PubMed]
- Dromerick, A.W.; Edwards, D.F.; Diringer, M.N. Sensitivity to changes in disability after stroke: A comparison of four scales useful in clinical trials. J. Rehabil. Res. Dev. 2003, 40, 1–8. [Google Scholar] [CrossRef] [PubMed]
- Sangha, H.; Lipson, D.; Foley, N.; Salter, K.; Bhogal, S.; Pohani, G.; Teasell, R.W. A comparison of the Barthel Index and the Functional Independence Measure as outcome measures in stroke rehabilitation: Patterns of disability scale usage in clinical trials. Int. J. Rehabil. Res. 2005, 28, 135–139. [Google Scholar] [CrossRef] [PubMed]


| HRC | Group 1 (MV ± SD) 95% CI | Group 2 (MV ± SD) 95% CI | Group 3 (MV ± SD) 95% CI | Group 4 (MV ± SD) 95% CI |
|---|---|---|---|---|
| FIM Score | ||||
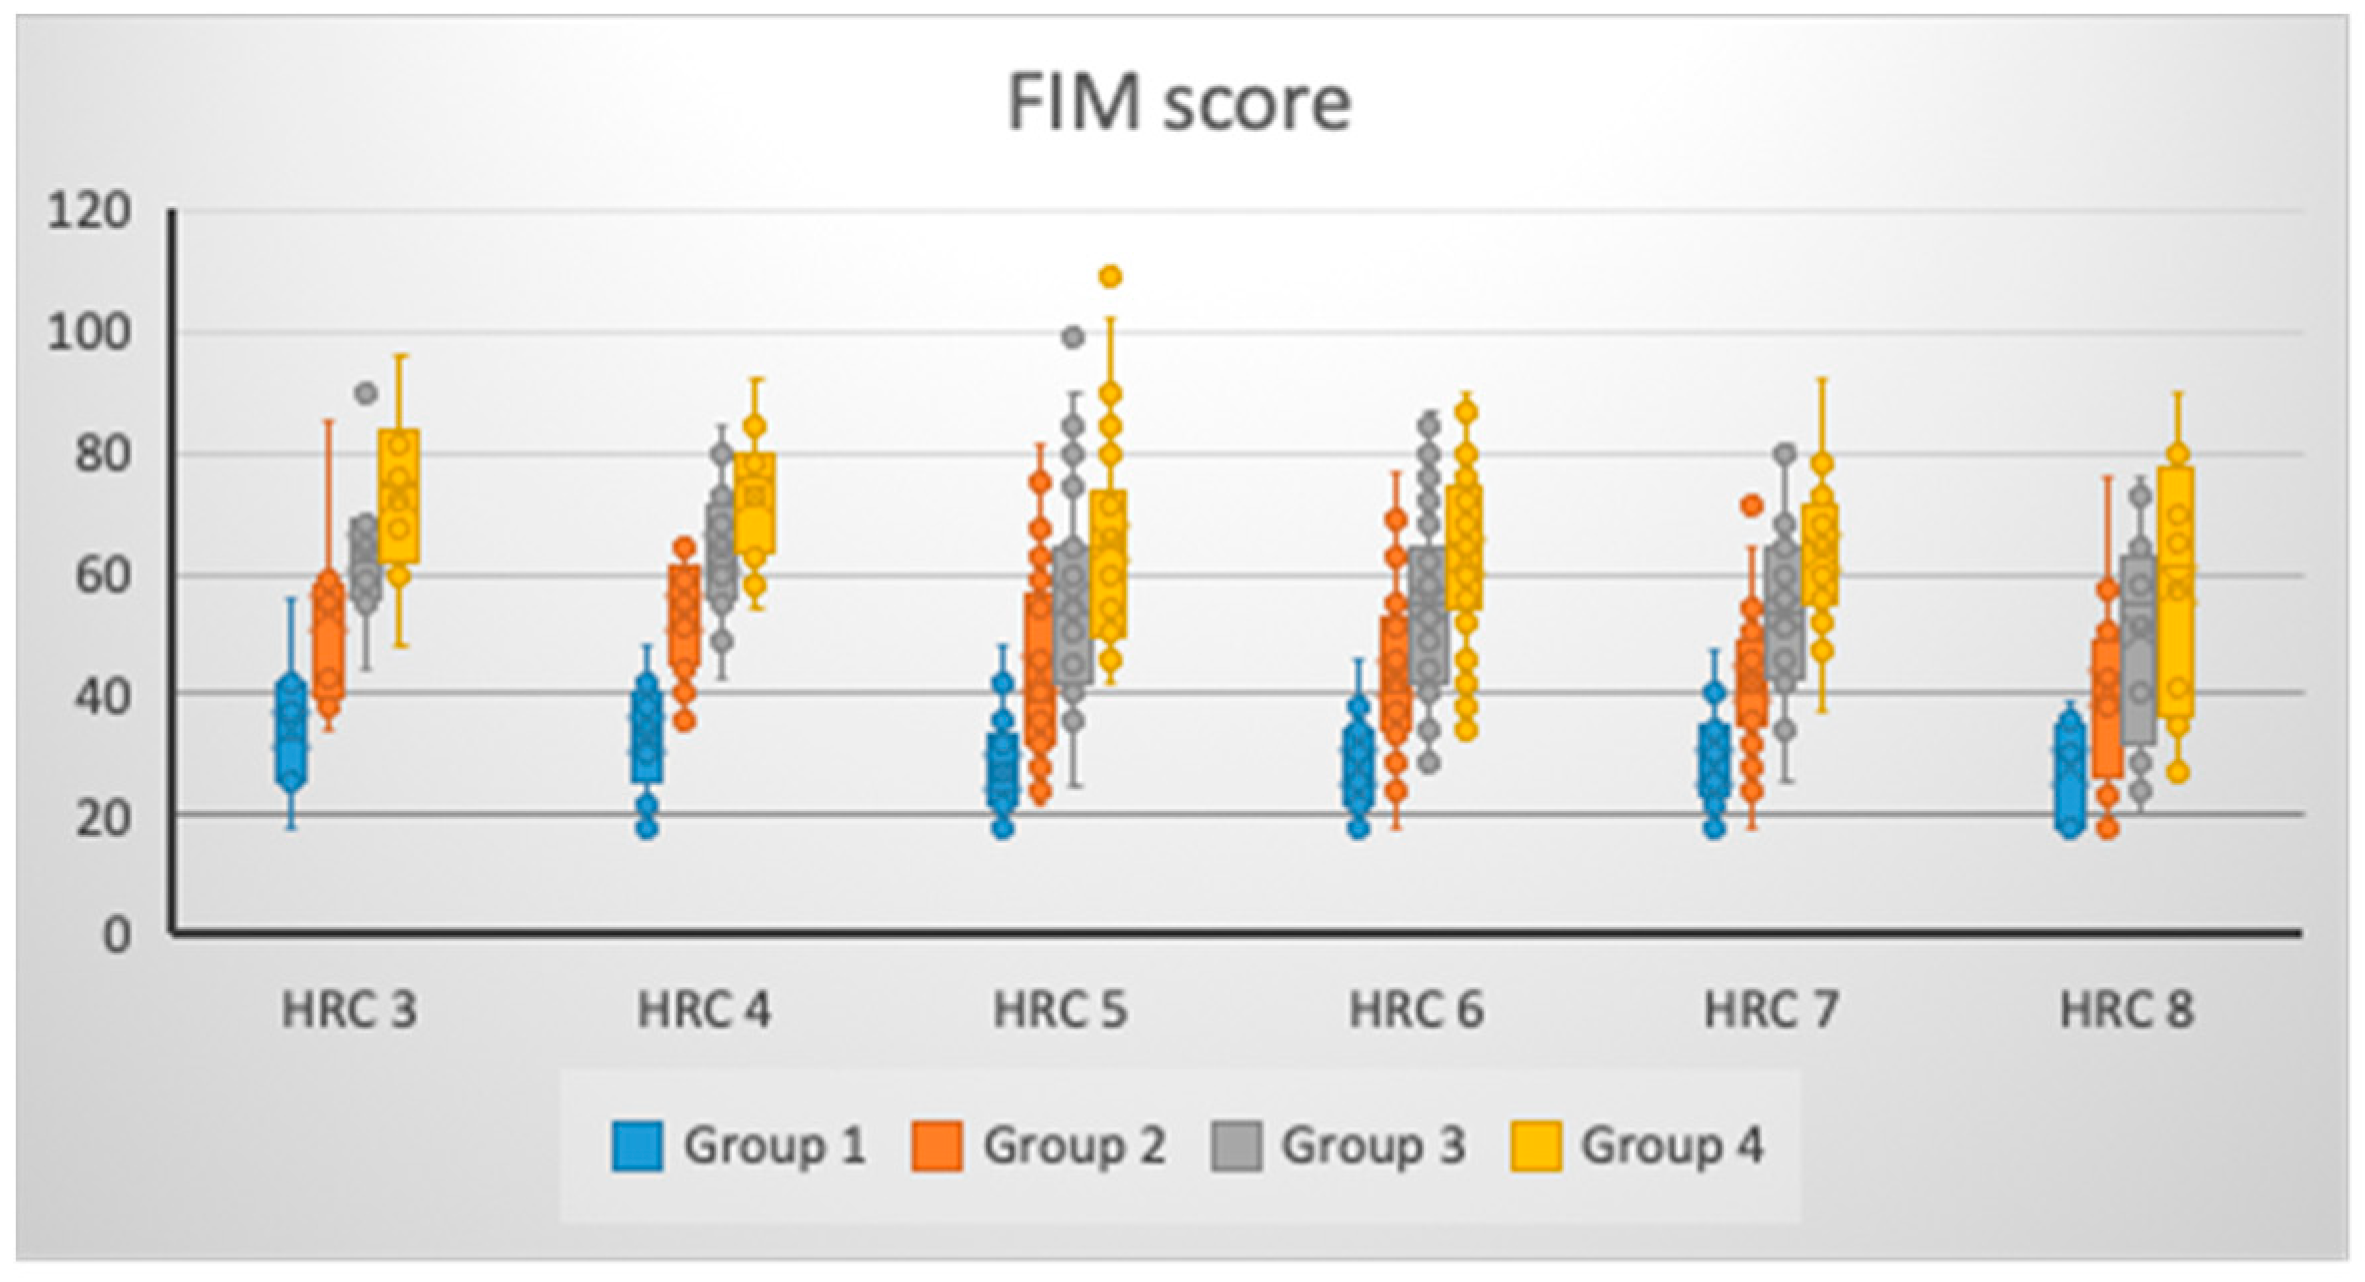
| 3 (N = 8) | 34.38 ± 12.19 24.19–44.56 | 53.13 ± 15.87 39.86–66.39 | 63.63 ± 13.30 52.51–74.74 | 73.00 ± 14.90 60.54–85.46 |
| 4 (N = 17) | 33.12 ± 9.11 28.43–37.80 | 53.35 ± 10.02 48.20–58.51 | 63.24 ± 10.87 57.65–68.82 | 72.47 ± 10.89 66.87–78.07 |
| 5 (N = 30) | 27.20 ± 8.21 24.13–30.27 | 43.27 ± 15.42 37.51–49.02 | 55.93 ± 17.92 49.24–62.62 | 65.30 ± 16.73 59.05–71.55 |
| 6 (N = 43) | 28.02 ± 7.45 25.73–30.32 | 42.91 ± 13.81 38.66–47.16 | 54.74 ± 15.36 50.02–59.47 | 62.95 ± 14.74 58.42–67.49 |
| 7 (N = 30) | 27.97 ± 7.78 25.06–30.87 | 42.17 ± 11.64 37.82–46.51 | 53.73 ± 13.41 48.73–58.74 | 63.33 ± 12.07 58.83–67.84 |
| 8 (N = 12) | 28.17 ± 8.03 23.06–33.27 | 41.42 ± 16.51 30.93–51.91 | 50.25 ± 18.38 38.57–61.93 | 58.08 ± 21.51 44.42–71.75 |
| p * | 0.077 | 0.033 | 0.141 | 0.075 |
| η2 (%) | 7.08% | 8.55% | 5.94% | 7.12% |
| HRC | BI | |||
| 3 (N = 8) | 40.63 ± 13.42 29.41–51.84 | 58.38 ± 16.54 44.54–72.21 | 69.50 ± 13.61 58.12–80.88 | 79.88 ± 11.93 69.90–89.85 |
| 4 (N = 17) | 36.29 ± 13.37 29.42–43.17 | 58.47 ± 13.78 51.39–65.56 | 71.59 ± 13.36 64.72–78.46 | 80.29 ± 11.04 74.62–85.97 |
| 5 (N = 30) | 24.17 ± 16.08 18.16–30.17 | 48.20 ± 20.24 40.64–55.76 | 63.43 ± 17.80 56.79–70.08 | 74.10 ± 15.14 68.45–79.75 |
| 6 (N = 43) | 25.47 ± 14.79 20.91–30.02 | 46.49 ± 17.23 41.18–51.79 | 62.65 ± 15.69 57.82–67.48 | 71.58 ± 16.13 66.62–76.55 |
| 7 (N = 30) | 25.23 ± 14.69 19.75–30.72 | 45.33 ± 13.70 40.22–50.45 | 60.10 ± 14.62 54.64–65.56 | 72.07 ± 13.25 67.12–77.01 |
| 8 (N = 12) | 24.17 ± 17.37 13.13–35.20 | 44.58 ± 23.40 29.72–59.45 | 56.58 ± 21.24 43.09–70.08 | 66.58 ± 23.35 51.75–81.42 |
| p * | 0.012 | 0.074 | 0.117 | 0.159 |
| η2 (%) | 10.27% | 7.13% | 6.30% | 5.70% |
| HRC | Group 1/2 * | Group 1/3 * | Group 1/4 * | Group 2/3 * | Group 2/4 * | Group 3/4 * |
|---|---|---|---|---|---|---|
| FIM Score | ||||||
| 3 | 0.027 | 0.002 | 0.001 | 0.073 | 0.032 | 0.171 |
| 4 | <0.000 | <0.000 | <0.000 | 0.025 | <0.000 | 0.029 |
| 5 | <0.000 | <0.000 | <0.000 | 0.004 | <0.000 | 0.023 |
| 6 | <0.000 | <0.000 | <0.000 | 0.001 | <0.000 | 0.018 |
| 7 | <0.000 | <0.000 | <0.000 | 0.001 | <0.000 | 0.006 |
| 8 | 0.014 | 0.006 | 0.002 | 0.126 | 0.064 | 0.298 |
| HRC | BI | |||||
| 3 | 0.024 | 0.003 | 0.001 | 0.093 | 0.032 | 0.103 |
| 4 | <0.000 | <0.000 | <0.000 | 0.023 | <0.000 | 0.048 |
| 5 | <0.000 | <0.000 | <0.000 | 0.007 | <0.000 | 0.020 |
| 6 | <0.000 | <0.000 | <0.000 | <0.000 | <0.000 | 0.008 |
| 7 | <0.000 | <0.000 | <0.000 | <0.000 | <0.000 | 0.003 |
| 8 | 0.016 | 0.002 | <0.000 | 0.194 | 0.040 | 0.285 |
| HRC | Group 1/Age * | Group 2/Age * | Group 3/Age * | Group 4/Age * |
|---|---|---|---|---|
| FIM Score | ||||
| 3 | 0.205 | −0.036 | 0.167 | 0.357 |
| 4 | 0.127 | −0.005 | −0.088 | 0.041 |
| 5 | −0.271 | −0.418 ** | −0.316 | −0.318 |
| 6 | 0.000 | −0.238 | −0.122 | −0.112 |
| 7 | −0.108 | −0.137 | −0.037 | 0.050 |
| 8 | 0.391 | 0.205 | −0.172 | −0.158 |
| HRC | BI | |||
| 3 | 0.548 | −0.036 | −0.756 ** | −0.756 ** |
| 4 | 0.019 | 0.071 | −0.079 | 0.018 |
| 5 | −0.255 | −0.371 ** | −0.329 | −0.362 ** |
| 6 | −0.261 | −0.211 | −0.102 | −0.035 |
| 7 | −0.177 | −0.001 | −0.020 | 0.126 |
| 8 | 0.000 | 0.320 | −0.160 | −0.174 |
© 2019 by the authors. Licensee MDPI, Basel, Switzerland. This article is an open access article distributed under the terms and conditions of the Creative Commons Attribution (CC BY) license (http://creativecommons.org/licenses/by/4.0/).
Share and Cite
Savic, M.; Cvjeticanin, S.; Lazovic, M.; Nikcevic, L.; Petronic, I.; Cirovic, D.; Nikolic, D. Morphogenetic Variability as Potential Biomarker of Functional Outcome After Ischemic Stroke. Brain Sci. 2019, 9, 138. https://doi.org/10.3390/brainsci9060138
Savic M, Cvjeticanin S, Lazovic M, Nikcevic L, Petronic I, Cirovic D, Nikolic D. Morphogenetic Variability as Potential Biomarker of Functional Outcome After Ischemic Stroke. Brain Sciences. 2019; 9(6):138. https://doi.org/10.3390/brainsci9060138
Chicago/Turabian StyleSavic, Milan, Suzana Cvjeticanin, Milica Lazovic, Ljubica Nikcevic, Ivana Petronic, Dragana Cirovic, and Dejan Nikolic. 2019. "Morphogenetic Variability as Potential Biomarker of Functional Outcome After Ischemic Stroke" Brain Sciences 9, no. 6: 138. https://doi.org/10.3390/brainsci9060138
APA StyleSavic, M., Cvjeticanin, S., Lazovic, M., Nikcevic, L., Petronic, I., Cirovic, D., & Nikolic, D. (2019). Morphogenetic Variability as Potential Biomarker of Functional Outcome After Ischemic Stroke. Brain Sciences, 9(6), 138. https://doi.org/10.3390/brainsci9060138