Abstract
The activity of excitatory and inhibitory neural circuits in the motor cortex can be probed and modified by transcranial magnetic stimulation (TMS) and repetitive TMS (rTMS), noninvasively. At present, not only has a consensus regarding the interhemispheric effect of high frequency rTMS not been reached, but the attributes of these TMS-related circuits are also poorly understood. To address this question comprehensively, we integrated a single- and paired-pulse TMS evaluation with excitatory 20-Hz rTMS intervention in order to probe the interhemispheric effect on the intracortical circuits by high-frequency rTMS. In the rest state, after 20-Hz rTMS, a significant increase of single-pulse MEP and paired-pulse intracortical facilitation (ICF) in the non-stimulated hemisphere was observed with good test–retest reliability. Intracortical inhibition (measured by the cortical silent period) in the unstimulated hemisphere also increased after rTMS. No significant time–course change was observed in the sham-rTMS group. The results provide the evidence that 20-Hz rTMS induced a reliable interhemispheric facilitatory effect. Findings from the present study suggest that the glutamatergic facilitatory system and the GABAergic inhibitory system may vary synchronously.
1. Introduction
Neuromodulation, as a group of techniques by which activities of the nervous system are directly modulated, is gaining increasing popularity and acceptance as an important treatment for various neurological disorders (e.g., major depression, epilepsy, stroke, spinal cord injury, traumatic brain injury, etc.) [,,,]. By virtue of non-invasive brain stimulation (NIBS), not only can the impaired neural function be modulated in neurological patients, but the neural processes and network connectivity in the human brain can also be unveiled []. Transcranial magnetic stimulation (TMS) has been considered the only non-invasive approach able to both modulate and probe neuroactivity and neuroplasticity [,,]. By applying single- and paired-pulse TMS to the primary motor cortex (M1), corticospinal excitability, as well as the activity of cortical facilitatory and inhibitory circuits, can be revealed by the amplitude of motor evoked potential (MEP) [,]. In particular, intracortical inhibition (ICI) can be probed not only with paired-pulse TMS, but also single-pulse TMS during voluntary muscle activation as the cortical silent period (CSP). CSP is defined as the temporary suppression of ongoing muscle activity after TMS-induced MEP. A longer suppression (silent period) indicates a stronger ICI. It has been concluded that CSP reflects the GABAergic ICI, with a CSP shorter than 100 ms reflecting the GABAA-mediated inhibition, while a CSP longer than 100 ms mainly reflects the GABAB-mediated ICI []. However, intracortical facilitation is usually assessed only using paired-pulse TMS (for a review, see []). Paired-pulse ICF consists of short interval ICF (SICF) and long-interval ICF (LICF) [,]. SICF is considered to reflect the cortical-mediated I-wave facilitation [], while LICF may result from neural populations other than those generating the I-waves, as the two phenomena differ in ISI and pulse intensity []. However, not only do the attributes of SICF and LICF phenomena in rest and during voluntary muscle activation remain obscure, consensus on the physiological processes of ICF (cortical and subcortical) and their interaction with other cortical circuits also remains incomplete [,].
Apart from probing cortical activity, applying TMS repetitively at a certain frequency (i.e., repetitive TMS, rTMS) substantially modulates cortical excitability by inducing neuroplasticity. It has been widely proven that high-frequency (≥3 Hz) rTMS increases the cortical excitability of the stimulated hemisphere, whereas low-frequency rTMS (≤1 Hz) decreases it []. However, the effect of rTMS on the unstimulated hemisphere varies greatly, with different outcomes reported in both high- and low-frequency rTMS protocols (for review see []). This modulation can be referred to as an alteration of the cortical and subcortical excitability in the contralateral (unstimulated) M1, possibly through the interhemispheric pathways, including interhemispheric inhibition (IHI) and interhemispheric facilitation (IHF) acting upon the intracortical inhibitory and facilitatory circuits [,].
Currently, several important questions regarding TMS remain to be answered. First, consensus on the interhemispheric effect of excitatory rTMS and its reliability has not been reached, which demands systematic investigation. Second, the relationship between cortical facilitation and inhibition is also pending further investigation, owing to major difficulties in correlating neurophysiological phenomena (observed by TMS, etc.) with metabolic processes (measured using magnetic resonance spectroscopy, etc.) [,,]. To answer these questions, we devised a comprehensive TMS protocol in the present study to explore: (1) the modulation of SICF and LICF by contralateral excitatory rTMS, and (2) the attributes of glutamatergic intracortical facilitation (SICF and LICF) under the influence of rTMS and voluntary drive. For the interaction between ICF and ICI, we sought to infer this relationship by analysing the interaction between ICF and cortical silent period (CSP, indicating the GABAergic ICI). We assumed that: (1) excitatory rTMS can reliably potentiate single-pulse MEP, SICF, and LICF in the non-stimulated hemisphere when assessed both in the rest state and during voluntary movement; (2) the modulation outcome differs between SICF and LICF; and (3) the relationship between the glutamatergic and GABAergic neuronal circuits can be revealed in the modulation of ICF and CSP.
2. Materials and Methods
2.1. Ethical Approval
The experiment protocol was approved by the Ethics Committee of Tohoku University Graduate School of Medicine (Protocol Identification Number: 2021-1-919) and conducted in accordance with the Declaration of Helsinki.
2.2. Participants
Forty-two healthy adults participated in the experiment and were randomly assigned as the real rTMS (twenty-two healthy adults, nine males, aged 26.8 ± 3.34 years) and age-matched sham-rTMS (twenty healthy adults, six males, aged 27.5 ± 4.62 years) groups. Written informed consent was obtained prior to the experiment. All participants were right-handed according to the Edinburgh Handedness Inventory []. None of the participants reported a history or current signs of neurological or musculoskeletal impairment. A questionnaire for TMS and rTMS was used to perform screening for TMS contraindications [,]. Sample size was selected based on previous rTMS studies [,] and an a-priori power analysis using the GPower 3.0 software (http://www.psycho.uni-duesseldorf.de/abteilungen/aap/gpower3/, accessed on 2 March, 2021). The alpha and beta errors were set as α = 0.05 and β = 0.2 with a medium effect size of f = 0.25. The calculation resulted in 17 subjects for each group.
2.3. Protocol
Participants of the real rTMS group underwent the comprehensive TMS experimental protocol in Figure 1 for three identical sessions, taking place during three consecutive days. In the rTMS intervention, cortical excitability of the right hemisphere was upregulated by 20-Hz rTMS. TMS measurement was performed at four time points (Baseline, During, Post and Later) across the experiment. In the rest condition, we measured single-pulse unconditioned MEP (MEPsp) with single-pulse TMS, and MEPSICF, MEPLICF with paired-pulse TMS during the complete rest of the hand, which was confirmed by real-time electromyography (EMG). The same measurements were also performed separately in the context of voluntary movement (VM). For VM, we adopted slight isometric thumb abduction (i.e., isometric contraction of the abductor pollicis brevis, APB) to avoid possible involvement of the ipsilateral M1 as like crossed facilitation [,]. Specifically, participants were first instructed to perform maximum thumb abduction to produce a maximum voluntary contraction (100% MVC). Then, participants were instructed to slightly stretch from the inside a circular elastic band of 1-cm width using the interphalangeal (IP) joint of their thumb and the proximal interphalangeal (PIP) joint of their index finger, producing a 20 ± 10% MVC (approximately 20% of the amplitude of 100% MVC EMG) isometric contraction of the right APB. Throughout VM measurements, participants were not presented with visual real-time EMG, but received vocal feedback from the experimenter (who constantly monitored the real-time EMG) to maintain optimal muscle output.
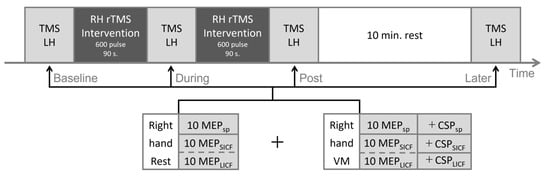
Figure 1.
Experimental protocol. Repetitive TMS intervention (real or sham, dark grey) was applied in two sessions with 600 pulses each. TMS measurement (light grey) was performed at four timepoints throughout the experiment. The order of SICF and LICF measurements was randomized for each timepoint, as shown in dashed lines. LH = left hemisphere; RH = right hemisphere; VM = voluntary movement; MEP = motor evoked potential; SICF = short-interval intracortical facilitation; LICF = long-interval intracortical facilitation; CSP = cortical silent period; sp = single-pulse.
For the sham-rTMS group, participants underwent the protocol in Figure 1 for only one session (one day). In the sham rTMS intervention, 20-Hz sham-rTMS was applied to the right hemisphere. The rTMS coil was positioned perpendicular to the cranium over the right M1. The rTMS stimulation intensity and TMS evaluation was conducted in accordance with the real rTMS group.
The experiment was carried out in a quiet, well-lit laboratory. During the experiment, participants were comfortably seated in an armchair with their arms resting on the armrest. Earplugs were used to avoid auditory influence by TMS. Given that attention can affect MEP size and rTMS modulation [,], participants were instructed to fixate on a printed fixation cross (5 × 5 cm) set 50 cm away from the front during the entire experiment.
2.4. TMS Parameters
2.4.1. TMS Equipment and Basic Configuration
Single- and paired-pulse TMS were delivered to the left hemisphere through a figure-of-eight coil (70-mm double coil MAG-9925-00) connected to a pair of Magstim 2002 via a Bistim module (Magstim Co., Whitland, UK). The coil was oriented at an angle 45° to the midsagittal plane, with the coil handle pointing backwards to induce posterior-to-anterior current flow. Repetitive TMS (TMS intervention) was delivered to the right hemisphere using Magstim Rapid2 (Magstim Co., Whitland, UK) with a figure-of-eight coil (D702 Coil), following the same coil orientation as the TMS measurement.
All TMS and rTMS were delivered to the M1 representational area of APB (i.e., the APB-hotspot, at the location where a suprathreshold single-pulse TMS evoked MEP with maximum amplitude in the APB muscle []), marked with a pen over the scalp. The TMS coil was held by an articulated mechanical arm (Manfrotto 244, VitecGroup, Cassola, Italy), with the coil junction centre placed tangentially over the APB-hotspot. TMS measurement was automatically executed by customised MATLAB 2021a (The MathWorks, Inc., Natick, MA, USA) scripts with the MAGIC toolbox [].
2.4.2. Measurement: Single-Pulse TMS
Prior to the experiment, the bilateral resting motor threshold (rMT) of each participant was determined using single-pulse TMS []. Based on the rMT, TMS intensity (% Maximum stimulator output, MSO) eliciting MEPs with 0.5- to 1-mV peak-to-peak amplitude (0.5–1-mV stimulation intensity, SI0.5–1 mV) of the right APB was also determined by gradually increasing the stimulus intensity (by 1%MSO) from rMT until 10 consecutive MEPs of optimal amplitude were elicited [].
In the experiment, MEPsp (rest and VM) was measured using the SI0.5–1 mV TMS pulse. The stimulation interval for MEPsp was set as 5 s []. Abundant evidence exists that 20-Hz rTMS can substantially increase MEP amplitude in the stimulated hemisphere, therefore we did not assess the MEP in the stimulated hemisphere according to the established consensus.
2.4.3. Measurement: Paired-Pulse TMS
Paired-pulse TMS assessing SICF was given at S1 = SI0.5–1 mV and S2 = 100% rMT. The ISI of SICF was set to 1.5 ms, corresponding to the ISI that elicits the clearest facilitatory I1-wave [,]. LICF was assessed at S1 = 70% rMT and S2 = SI0.5–1 mV with 10 ms ISI [,]. To avoid possible carryover effect [,], SICF and LICF trials were applied every 10 s. The order of SICF and LICF measurements was randomised to prevent order effects.
2.4.4. Intervention: Repetitive TMS
20-Hz rTMS intervention was applied for two 90-s sessions (Figure 1) with the stimulation intensity set as 70% rMT. Each train of stimulation consisted of 2-s stimulation of 40 pulses and 4-s inter-trial interval (ITI) [,,]. During the rTMS session, participants were instructed to rest their arms completely. EMG activity of both APBs was constantly monitored by the experimenter to ensure no MEP was induced by subthreshold rTMS.
2.5. EMG Recording
EMG from bilateral APBs was recorded throughout the TMS evaluation and was monitored during rTMS intervention. The recorded EMG data was stored for offline analysis. Disposable surface electrodes (Ambu Blue Sensor N, N-00-S/25, Ambu A/S, Ballerup, Denmark) were placed over the APB muscle in a lengthwise belly–belly montage [], with reference electrodes placed over the ulnar styloid process. Surface EMG signals were recorded with a bio-amplifier (MEG-6116 M, Nihon-kohden, Tokyo, Japan) connected to a PowerLab 16/35 device and processed using the LabChart Pro 8.0 software (AD Instruments Inc., Dunedin, New Zealand). Raw EMG signals were digitised at a sampling frequency of 10 kHz, amplified 1000×, and filtered within 20–450 Hz.
The time zone of all EMG analyses was set from 500 ms before TMS to 2000 ms after TMS. CSP was automatically calculated as the duration between the onset of MEP and restoration of pre-MEP average EMG amplitude (500 ms prior to TMS pulse) in VM [].
2.6. Statistics
For the real rTMS group, the intrasubject difference of baseline MEPsp, MEPSICF and MEPLICF amplitudes from the 3-day repetitive measurement sessions was assessed using repeated measures analysis of variance (RMANOVA). The average EMG amplitude 500 ms prior to TMS was also processed using one-way ANOVA for intrasubject difference analysis, with DAY set as the independent variable.
Time-course modulation of all MEPsp, MEPSICF and MEPLICF amplitudes and CSPsp, CSPSICF and CSPLICF duration (VM only) contralateral to rTMS in the 3-day experiment was analysed using repeated-measures ANOVA (RMANOVA), with TIME (Baseline, During, Post0, Post10) set as the within-subject factor. The post hoc test of Bonferroni correction was performed for significant results or tendencies. To exclude the effects of baseline MEPsp interindividual variability, we further normalised the outcomes of MEPSICF and MEPLICF by converting all data into a percentage of baseline MEPsp values as the ratio of SICF and LICF and included the ratio in the statistical analyses [,]. All time-course modulation analyses were performed separately in rest and VM, to address the effects of muscle activation throughout the experiment.
In light of the effects of different paradigms, all MEP amplitude and CSP duration of single-pulse, SICF and LICF paradigms in the 3-day experiment were also analysed using one-way ANOVA with the independent variable PARADIGM (single-pulse, SICF and LICF).
To determine the test–retest reliability of the measured parameters in the rest state and VM, intraclass correlation coefficients (ICCs) of all parameters were calculated based on the intrasubject data measured during the 3-day repetitive measurement. We calculated ICC based on a single-rater, one-way random effect for the absolute agreement model (i.e., ICC(1, 3)) [].
For the sham-rTMS group, the baseline MEPsp amplitude was compared with the average of the 3-day experiment baseline MEPsp of the real rTMS group, using an independent two-sample Student’s t-test. Time-course modulation of all parameters (including the SICF and LICF ratio) was analysed using RMANOVA with Bonferroni corrections as in the real rTMS group. Inter-paradigm difference of the paradigms was also assessed using the same statistic method as the real rTMS group.
Statistical significance was accepted at p < 0.05. The IBM SPSS Statistics v.26 software (IBM Corp., Armonk, NY, USA) was used to perform all statistical analyses. Figures were generated using customized MATLAB scripts.
3. Results
The experiment protocol was well tolerated by all participants. However, in the real rTMS group, stable MEPs > 0.2 mV could not be evoked from one individual during the entire experiment, and another individual withdrew on the third day for personal reasons. Data from these two participants were excluded from all statistical analyses.
The rest motor threshold of the real rTMS group was 53.55 ± 6.84%MSO for the left hemisphere and 54.60 ± 6.76%MSO for the right hemisphere. For the sham-rTMS group, the rMT was 55.1 ± 7.33%MSO and 55.9 ± 6.55%MSO for the left and right hemispheres respectively. The intensity for SI0.5–1 mV (left hemisphere only) was 64.60 ± 6.47%MSO and 66.45 ± 8.09%MSO for the real- and sham-rTMS group.
3.1. Baseline Measurements
For all TMS-measured variables in the real rTMS group, there was no significant baseline intrasubject difference in the 3-day repetitive measurement of all parameters (MEP amplitude and CSP duration, all p > 0.05, Supplementary Table S1). For the EMG activity measured 500 ms prior to TMS pulse in the VM condition, one-way ANOVA showed no significant intrasubject difference among the 3 days (F2717 = 0.691, p = 0.502), indicating no carry-over effects along the 3-day experiment sessions. There was no significant difference in the rest and VM baseline MEPsp between the real rTMS and sham-rTMS groups (n = 20, rest p = 0.43, VM p = 0.12, independent two-sample Student’s t-test).
3.2. Interhemispheric ICF Modulation by rTMS
MEPsp, MEPSICF and MEPLICF amplitudes measured in the rest state throughout the experiment (real-rTMS group) are shown in Figure 2. Difference between rest, MEPsp, MEPSICF and MEPLICF by TIME reached significance by RMANOVA (F3,217 = 4.830, 3.443, and 3.578; p = 0.003, 0.018 and 0.015 for MEPsp, MEPSICF and MEPLICF). The post hoc test revealed significant increase in rest, MEPsp, MEPSICF and MEPLICF between the Baseline and Post time points (p = 0.002, 0.016 and 0.013 for MEPsp, MEPSICF and MEPLICF, Figure 2A–C). Moreover, compared to that at baseline, the rest MEPsp at the later timepoint demonstrated a tendency to increase, yet the post hoc test failed to reach statistical significance (p = 0.089). At the During timepoint, there was no significant chronological effect of any MEP parameter measured. In VM, no significant chronological modulation of MEP at any timepoint was shown (F3,217 = 0.461, 0.176, and 0.555; p = 0.710, 0.913 and 0.645 for MEPsp, MEPSICF and MEPLICF).
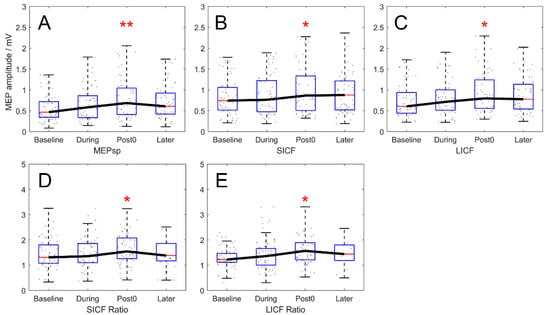
Figure 2.
Chronological modulation of MEPsp, SICF and LICF in rest condition (real-rTMS group). (A–C) Outcomes expressed in MEP amplitude (mV). MEP amplitude of rest MEPsp, MEPSICF and MEPLICF increased significantly at the Post timepoint, compared to Baseline. (D,E) Outcomes expressed in ICF ratio normalized by baseline MEPsp amplitude. Normalized SICF and LICF ratio also showed significant enhancement at the Post timepoint compared to Baseline. Boxes denote 25th and 75th percentile values, whiskers denote minimum and maximum values. Asterisks denote significant difference compared to the Baseline timepoint. * p < 0.05; ** p < 0.01.
After normalisation, along with the significant effect of TIME (F3,217 = 2.803 and 2.985; p = 0.041 and 0.032 for SICF and LICF ratio), the increase of the rest SICF and LICF ratios remained significant between the Baseline and Post timepoints and returned to baseline 10 min after rTMS (Baseline–Post: p = 0.045 for SICF ratio; p = 0.030 for LICF ratio. Baseline–Later: p = 0.571 for SICF ratio; p = 0.154 for LICF ratio; after correction; Figure 2D,E).
In the sham-rTMS group, no significant time-course modulation of all MEP amplitudes (including SICF and LICF ratio) was revealed (RMANOVA, p > 0.05, Supplementary Table S2).
3.3. Interhemispheric ICI Modulation by rTMS
CSPsp, CSPSICF, and CSPLICF modulation throughout the experiment (real-rTMS group) is plotted in Figure 3. A significant effect of TIME was revealed in all three paradigms (F3,217 = 4.876, 4.928, and 3.011; p = 0.003, 0.002 and 0.031 for CSPsp, CSPSICF and CSPLICF). The post hoc test showed that chronological modulation of CSPsp demonstrated significant prolongation at the During and Post timepoint, and returned to baseline at the Later timepoint (Baseline–During, p = 0.017; Baseline–Post, p = 0.006; Baseline–Later, p = 1.000, Figure 3A), whereas the increase of CSPSICF reached significance at the Post timepoint and demonstrated significant prolongation 10 min after rTMS (Baseline–Post, p = 0.021; Baseline–Later, p = 0.003, Figure 3B). However, despite the significant difference by TIME, after correction, the CSPLICF only showed a tendency to increase (Baseline–Post, p = 0.069; Baseline–Later, p = 0.053, Figure 3C).
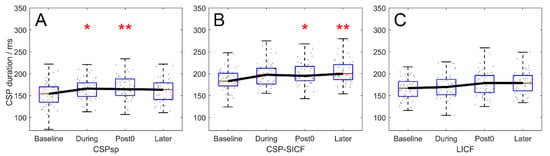
Figure 3.
Chronological modulation of CSP duration by 20-Hz rTMS, in the real-rTMS group. (A) modulation of CSPsp. (B) modulation of CSPSICF. (C) modulation of CSPLICF. CSPsp demonstrated significant prolongation at the During and Post timepoints, while CSPSICF and CSPSICF showed significant prolongation at the Post and Later timepoints. The prolongation of CSPLICF was not significant. Boxes denote 25th and 75th percentile values, whiskers denote minimum and maximum values. Asterisks denote significant difference compared to the Baseline timepoint. * p < 0.05; ** p < 0.01.
In the sham-rTMS group, no significant time-course modulation of all CSP durations was revealed (RMANOVA, p > 0.05, Supplementary Table S2).
3.4. Paradigm-Wise Effects of Rest and VM
In the rest condition, the overall MEPSICF and MEPLICF were enhanced by 176.1 ± 89.2% and 173.60 ± 93.6% (real-rTMS group, n = 20 × 3 days, F2717 = 13.773, p < 0.001) compared to MEPsp, respectively. In VM, MEP modulation also reached statistical significance (F2717 = 6.682, p = 0.001), with MEPLICF being significantly greater than MEPsp (p = 0.002) and MEPSICF (p = 0.015) as revealed by the post hoc test. However, in VM, the difference between MEPsp and MEPSICF amplitudes was not significant (p = 1.000, Figure 4A). In terms of CSP, the overall duration of CSPSICF (200.32 ± 30.00 ms) was significantly longer than that of CSPsp (165.94 ± 32.76 ms, p < 0.001) and CSPLICF (174.33 ± 32.72 ms, p < 0.001). Additionally, the duration was also longer for CSPLICF than for CSPsp (p = 0.012, Figure 4B).
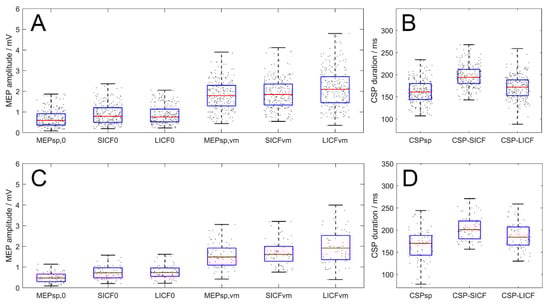
Figure 4.
Paradigm-wise effects of MEP amplitude and CSP duration of all timepoints (real- and sham-rTMS group, upper and lower panel respectively). (A,C) Amplitude of MEPsp, MEPSICF and MEPLICF. In VM condition, MEPLICF demonstrated significant facilitatory effect while the facilitation of MEPSICF was absent. (B,D) CSP duration in the three paradigms. CSPSICF and CSPLICF duration were longer than the CSPsp, with CSPSICF significantly longer than CSPLICF. Boxes denote 25th and 75th percentile values, whiskers denote minimum and maximum values.
For the sham-rTMS group, in rest state, MEPSICF and MEPLICF were enhanced by 60.4 ± 65.8% and 63.7 ± 74.7% (n = 20, F2717 = 7.049, p = 0.001) compared to MEPsp, respectively. In VM, MEP modulation also reached statistical significance (F2717 = 5.620, p = 0.004), with MEPLICF being significantly greater than MEPsp (p = 0.003) as revealed by the post hoc test. However, in VM, the difference between MEPsp and MEPSICF amplitudes was not significant (p = 1.000). Meanwhile, the difference between MEPSICF and MEPLICF failed to reach statistical significance in the post hoc test (p = 0.146). In terms of CSP, one-way ANOVA revealed a significant effect of PARADIGM on the CSP duration (n = 20, F2237 = 17.732, p < 0.001). Post-hoc test revealed that the overall duration of CSPSICF (199.46 ± 34.68 ms) was significantly longer than that of CSPsp (167.01 ± 35.63 ms, p < 0.001) and CSPLICF (183.11 ± 33.02 ms, p = 0.009). Similarly, the duration of CSPLICF was also longer than CSPsp (p = 0.010).
3.5. Parameter-Wise Test–Retest Reliability
MEPsp, MEPSICF and MEPLICF in the 3-day repetitive measurement (real-rTMS group) demonstrated good to excellent test–retest reliability in both rest and VM (ICC rest [95% confidence interval]: MEPsp = 0.766 [0.661–0.842]; MEPSICF = 0.839 [0.766–0.892]; MEPLICF = 0.803 [0.714–0.867]; ICC VM: MEPsp = 0.872 [0.815–0.914]; MEPSICF = 0.838 [0.765–0.891]; MEPLICF = 0.868 [0.809–0.911], all p < 0.001). ICC of CSPsp and CSPSICF resulted in moderate to good intra-rater reproducibility, whereas ICC of CSPLICF was poor, different from that of the other two paradigms (ICC CSPsp = 0.715 [0.587–0.808]; CSPSICF = 0.762 [0.655–0.840], p < 0.001; ICC of CSPLICF = 0.454 [0.209–0.633], p = 0.001).
4. Discussion
The present study provides three main findings. First, 20-Hz rTMS induced interhemispheric facilitatory effect, potentiating rest MEPsp, MEPSICF and MEPLICF in the unstimulated hemisphere with good test–retest reliability. Second, attribute differences coexisted between SICF and LICF paradigms. Third, ICI also increased in the presence of IHF, with different modulation among the three paradigms of single-pulse TMS, SICF and LICF.
4.1. Interhemispheric Facilitatory Effects of 20-Hz rTMS
The interhemispheric effects of excitatory high-frequency rTMS remains controversial (for a review, see []) when assessed with TMS. However, studies using fMRI [,,,], fluorodeoxyglucose-positron emission tomography (FDG-PET) [], functional near-infrared spectroscopy (fNIRS) [] and electroencephalogram (EEG) [,] have reported that excitatory rTMS induced cortical activation in both the stimulated and non-stimulated hemisphere, even though the neuroplastic effect and its persistency varied by stimulation frequency, dose and pattern. In the present study, we observed such IHF effects using TMS, showing as the MEP enhancement at the Post time points in the real-rTMS group (but not in the sham-rTMS group). Upon considering the result of the sham group, in which no time-course MEP modulation was shown, we expect the modulation to be induced by the rTMS intervention instead of the influence of environmental and other external factors. Given that callosal projections are excitatory and glutamatergic [,], this interhemispheric MEPsp, SICF and LICF facilitation may stem from the transcallosal glutamatergic pathway, indicating a possible contribution of the glutamate-mediated IHF. This result appears to be contradictory to the traditional IHI theory, according to which the excitation of one hemisphere should result in inhibition of the contralateral hemisphere. We believe that this IHF observation is essential to the understanding of the interhemispheric interaction mechanisms.
4.2. Modulation of ICF by 20-Hz rTMS
Despite the evidence of ipsilateral ICF increase after excitatory high-frequency rTMS [,,], contralateral (interhemispheric) ICF modulation by excitatory rTMS remains controversial. Jung et al. [] reported persistent LICF suppression and SICI enhancement in the unstimulated hemisphere after 20 trains (1000 pulses) of 10-Hz rTMS, along with an inhibition of MEP amplitude. On the other hand, Gorsler et al. [] reported no SICI and LICF changes in the unstimulated hemisphere after 1800 pulses of 5-Hz rTMS, whereas 1800 pulses of 0.5-Hz rTMS decreased LICF contralateral to rTMS. Our results contradict the aforementioned evidence by presenting a significant increase in the amplitude and ratio of both SICF and LICF after 1200 pulses of 20-Hz rTMS. We attribute this incongruity to the expression of ICF. The majority of paired-pulse TMS studies have normalised the paired-pulse ICF and ICI amplitude into a percentage of the corresponding single-pulse MEP amplitude [], which bears the risk of a ceiling effect when rTMS raises the amplitude of single-pulse MEP through long-term potentiation (LTP) [,]. The mechanisms of ICF also remain elusive at present, we therefore adopted the normalisation of baseline MEPsp amplitude to exclude the individual variability while preserving possible rTMS-induced variation of the parameters. This increase in ICF indicates that the excitability of the ICF circuit was also potentiated by 20-Hz rTMS, in accordance with the potentiation of the MEPsp.
4.3. Modulation of ICI by 20-Hz rTMS
In the present study, the interhemispheric ICI modulation measured by CSP increased with the contralateral 20-Hz rTMS in all three paradigms, which is supported by the evidence for ipsilateral CSP increase after 20-Hz rTMS []. As post-rTMS (ipsilateral) CSP duration tends to increase with higher rTMS frequency [,], we propose that rTMS with higher frequency can summon additional inhibitory postsynaptic potentials (IPSPs, lasting approximately 200–300 ms, []) from the asynchronous GABA release by the inhibitory interneurons, with the pulse interval being shorter than the duration of the IPSPs. However, while the restoration of CSPsp was in agreement with previous findings [], we present for the first time that the CSPSICF and CSPLICF (albeit tendency only) prolongation outlasted CSPsp for 10 min after rTMS. As the thresholds of ICI circuits are below rMT [,], we speculate that the low-threshold ICI circuits summoned by subthreshold rTMS were also activated by the subthreshold conditioning pulse of SICF and LICF, causing the persistent CSP prolongation.
4.4. Attributes of ICI and ICF
In the present study, significant differences were identified between the three TMS measurement paradigms. The results demonstrated that MEPLICF was not suppressed by VM, in contrast with MEPSICF. As voluntary drive can suppress the effects of ICF and ICI when muscle output increases [,], it is intriguing that the facilitatory effects of LICF were not suppressed by VM in the present study. Moreover, CSPSICF and CSPLICF also differed in duration and rTMS-induced chronological modulation. The difference between CSPSICF and CSPsp was also found in the work of Kojima et al. [], reporting longer CSPSICF than CSPsp under constant intensity of the suprathreshold test stimulus. However, in another study by Silbert et al. [], no difference between CSPSICF and the SICF-amplitude-matched CSPsp was reported. From this, we infer that the difference between CSPsp and CSPSICF is merely due to the integrated stimulus intensity of the paired pulse. Interestingly, we observed that CSPLICF was significantly shorter than CSPSICF, despite the integrated stimulation intensity similar to that of CSPSICF. In relation to CSP, previous triple-pulse studies showed that LICF was not influenced in the presence of LICI [,], along with the fact that I-waves were not affected by LICF [], highlighting the neural difference between LICF and SICF. Therefore, we speculate that LICF, although sharing a common neural basis with SICF, may bypass the inhibitory system to some extent, with its neural mechanisms differing from those of SICF.
4.5. Limitation
It is important to note that our study is limited in four aspects. First, the paired-pulse IHF was not assessed, thus a comparison of interhemispheric ICF modulation and paired-pulse IHF cannot be completed to explore the specific contribution of IHF. Second, IHI was also not assessed, which, to some extent, can bring uncertainty to the underlying process of interhemispheric interaction that caused the excitatory interhemispheric effect of 20-Hz rTMS. Third, since we adopted isometric contraction of the hand muscle, the modulation in movement initiation and task conditions demands further exploration. As IHI is lifted prior to movement initiation [], the possibility exists that integrating the TMS intervention with the timing of movement may yield better modulation effects. Fourth, although we presented the main IHF results with good test–retest reproducibility, the influence of the nature variability of MEP due to both physiological and environmental factors is unignorable []. Since cortical excitability and intracortical circuitry can be alternatively probed with novel protocols such as high-resolution cerebral blood volume (CBV-fMRI) [] and quantitative EEG [], we believe that further evidence on the attributes of rTMS-induced IHF would be of great importance, as the presence of IHF possesses a great potential to both the understanding of the circuit wiring of the human brain and the promotion of neurorehabilitation.
5. Conclusions
In summary, the present study provides evidence that 1200 pulses of 20-Hz rTMS applied to the M1 can induce an interhemispheric facilitatory effect, increasing the MEP responses to single-pulse TMS, paired-pulse short- and long-interval intracortical facilitation in the unstimulated hemisphere with sufficient test–retest reproducibility. This result shows the possibility of an interhemispheric facilitation mechanism other than the traditional interhemispheric inhibition theory. We also propose that the ICF and ICI may vary synchronously, opposing the generally accepted concept of ‘antagonistically.’ In the mechanistic aspect, for the first time, we discover that LICF is less influenced by the intracortical inhibitory circuits compared to SICF. Although the mechanisms and brain networks underlying TMS still warrant further exploration, we suggest that interhemispheric facilitation would be a novel way to promote neurorehabilitation outcomes, as well as TMS technological innovations, to a higher level.
Supplementary Materials
The following supporting information can be downloaded at: https://www.mdpi.com/article/10.3390/brainsci12080970/s1, Table S1: Mean (SD) of the 3-day baseline MEP amplitude and CSP duration; Table S2: Mean (SD) of the chronological modulation of MEP amplitude and CSP duration (sham-rTMS group).
Author Contributions
Conceived and designed the experiments: D.T., S.-I.I.; performed the experiments: D.T.; data analysis: D.T.; program script: D.T.; Draft the paper: D.T.; proofreading and revision: S.-I.I. All authors have read and agreed to the published version of the manuscript.
Funding
This work was supported by JST SPRING, grant number JPMJSP2114, to Dongting Tian.
Institutional Review Board Statement
The study was conducted according to the guidelines of the Declaration of Helsinki and approved by the Ethics Committee of Tohoku University Graduate School of Medicine (Protocol Identification Number: 2021-1-919).
Informed Consent Statement
Informed consent was obtained from all subjects involved in the study.
Data Availability Statement
The data presented in this study are available on request from the corresponding author.
Acknowledgments
The authors wish to thank all participants for their time and patience during the experiment.
Conflicts of Interest
The authors declare no conflict of interest.
References
- Caglayan, A.B.; Beker, M.C.; Caglayan, B.; Yalcin, E.; Caglayan, A.; Yulug, B.; Hanoglu, L.; Kutlu, S.; Doeppner, T.R.; Hermann, D.M. Acute and post-acute neuromodulation induces stroke recovery by promoting survival signaling, neurogenesis, and pyramidal tract plasticity. Front. Cell. Neurosci. 2019, 13, 144. [Google Scholar] [CrossRef] [PubMed] [Green Version]
- Davis, P.; Gaitanis, J. Neuromodulation for the treatment of epilepsy: A review of current approaches and future directions. Clin. Ther. 2020, 42, 1140–1154. [Google Scholar] [CrossRef] [PubMed]
- McGirr, A.; Berlim, M.T. Clinical Usefulness of Therapeutic Neuromodulation for Major Depression: A Systematic Meta-Review of Recent Meta-Analyses. Psychiatr. Clin. N. Am. 2018, 41, 485–503. [Google Scholar] [CrossRef] [PubMed]
- dos Santos, R.B.C.; Galvão, S.C.B.; Frederico, L.M.P.; Amaral, N.S.L.; Carneiro, M.I.S.; de Moura Filho, A.G.; Piscitelli, D.; Monte-Silva, K. Cortical and spinal excitability changes after repetitive transcranial magnetic stimulation combined to physiotherapy in stroke spastic patients. Neurol. Sci. 2019, 40, 1199–1207. [Google Scholar] [CrossRef] [PubMed]
- Polania, R.; Nitsche, M.A.; Ruff, C.C. Studying and modifying brain function with non-invasive brain stimulation. Nat. Neurosci. 2018, 21, 174–187. [Google Scholar] [CrossRef]
- Barker, A.T.; Jalinous, R.; Freeston, I.L. Non-invasive magnetic stimulation of human motor cortex. Lancet 1985, 325, 1106–1107. [Google Scholar] [CrossRef]
- Izumi, S.-I. Investigation of Human Motor Control Using Transcranial Magnetic Stimulation. Jpn. J. Rehabil. Med. 2001, 38, 671–681. [Google Scholar] [CrossRef]
- Chaves, A.R.; Snow, N.J.; Alcock, L.R.; Ploughman, M. Probing the Brain–Body Connection Using Transcranial Magnetic Stimulation (TMS): Validating a Promising Tool to Provide Biomarkers of Neuroplasticity and Central Nervous System Function. Brain Sci. 2021, 11, 384. [Google Scholar] [CrossRef]
- Rossini, P.M.; Burke, D.; Chen, R.; Cohen, L.G.; Daskalakis, Z.; Di Iorio, R.; Di Lazzaro, V.; Ferreri, F.; Fitzgerald, P.B.; George, M.S.; et al. Non-invasive electrical and magnetic stimulation of the brain, spinal cord, roots and peripheral nerves: Basic principles and procedures for routine clinical and research application. An updated report from an IFCN Committee. Clin. Neurophysiol. 2015, 126, 1071–1107. [Google Scholar] [CrossRef]
- Kujirai, T.; Caramia, M.D.; Rothwell, J.C.; Day, B.L.; Thompson, P.D.; Ferbert, A.; Wroe, S.; Asselman, P.; Marsden, C.D. Corticocortical inhibition in human motor cortex. J. Physiol. 1993, 471, 501–519. [Google Scholar] [CrossRef]
- Ziemann, U.L.F.; Rothwell, J.C.; Ridding, M.C. Interaction between intracortical inhibition and facilitation in human motor cortex. J. Physiol. 1996, 496, 873–881. [Google Scholar] [CrossRef]
- Ziemann, U. I-waves in motor cortex revisited. Exp. Brain Res. 2020, 238, 1601. [Google Scholar] [CrossRef] [Green Version]
- Di Lazzaro, V.; Rothwell, J.C. Corticospinal activity evoked and modulated by non-invasive stimulation of the intact human motor cortex. J. Physiol. 2014, 592, 4115–4128. [Google Scholar] [CrossRef]
- Wiegel, P.; Niemann, N.; Rothwell, J.C.; Leukel, C. Evidence for a subcortical contribution to intracortical facilitation. Eur. J. Neurosci. 2018, 47, 1311–1319. [Google Scholar] [CrossRef]
- Udupa, K.; Ni, Z.; Gunraj, C.; Chen, R. Effect of long interval interhemispheric inhibition on intracortical inhibitory and facilitatory circuits. J. Physiol. 2010, 588, 2633–2641. [Google Scholar] [CrossRef]
- Gorsler, A.; Bäumer, T.; Weiller, C.; Münchau, A.; Liepert, J. Interhemispheric effects of high and low frequency rTMS in healthy humans. Clin. Neurophysiol. 2003, 114, 1800–1807. [Google Scholar] [CrossRef]
- Pal, P.K.; Hanajima, R.; Gunraj, C.A.; Li, J.-Y.; Wagle-Shukla, A.; Morgante, F.; Chen, R. Effect of Low-Frequency Repetitive Transcranial Magnetic Stimulation on Interhemispheric Inhibition. J. Neurophysiol. 2005, 94, 1668–1675. [Google Scholar] [CrossRef] [Green Version]
- Fitzgerald, P.B.; Fountain, S.; Daskalakis, Z.J. A comprehensive review of the effects of rTMS on motor cortical excitability and inhibition. Clin. Neurophysiol. 2006, 117, 2584–2596. [Google Scholar] [CrossRef]
- Petroff, O.A.C. Book review: GABA and glutamate in the human brain. Neuroscientist 2002, 8, 562–573. [Google Scholar] [CrossRef]
- Tremblay, S.; Beaulé, V.; Proulx, S.; De Beaumont, L.; Marjańska, M.; Doyon, J.; Pascual-Leone, A.; Lassonde, M.; Théoret, H. Relationship between transcranial magnetic stimulation measures of intracortical inhibition and spectroscopy measures of GABA and glutamate+ glutamine. J. Neurophysiol. 2013, 109, 1343–1349. [Google Scholar] [CrossRef]
- Cuypers, K.; Marsman, A. Transcranial magnetic stimulation and magnetic resonance spectroscopy: Opportunities for a bimodal approach in human neuroscience. Neuroimage 2021, 224, 117394. [Google Scholar] [CrossRef]
- Oldfield, R.C. The assessment and analysis of handedness: The Edinburgh inventory. Neuropsychologia 1971, 9, 97–113. [Google Scholar] [CrossRef]
- Rossi, S.; Hallett, M.; Rossini, P.M.; Pascual-Leone, A. Screening questionnaire before TMS: An update. Clin. Neurophysiol. 2011, 1222, 1686. [Google Scholar] [CrossRef] [PubMed]
- Rossi, S.; Antal, A.; Bestmann, S.; Bikson, M.; Brewer, C.; Brockmoller, J.; Carpenter, L.L.; Cincotta, M.; Chen, R.; Daskalakis, J.D.; et al. Safety and recommendations for TMS use in healthy subjects and patient populations, with updates on training, ethical and regulatory issues: Expert Guidelines. Clin. Neurophysiol. 2021, 132, 269–306. [Google Scholar] [CrossRef] [PubMed]
- Kim, M.S.; Chang, W.H.; Cho, J.W.; Youn, J.; Kim, Y.K.; Kim, S.W.; Kim, Y.-H. Efficacy of cumulative high-frequency rTMS on freezing of gait in Parkinson’s disease. Restor. Neurol. Neurosci. 2015, 33, 521–530. [Google Scholar] [CrossRef] [Green Version]
- Perez, M.A.; Cohen, L.G. Mechanisms underlying functional changes in the primary motor cortex ipsilateral to an active hand. J. Neurosci. 2008, 28, 5631–5640. [Google Scholar] [CrossRef]
- Derosiere, G.; Alexandre, F.; Bourdillon, N.; Mandrick, K.; Ward, T.E.; Perrey, S. Similar scaling of contralateral and ipsilateral cortical responses during graded unimanual force generation. Neuroimage 2014, 85, 471–477. [Google Scholar] [CrossRef]
- Conte, A.; Belvisi, D.; Iezzi, E.; Mari, F.; Inghilleri, M.; Berardelli, A. Effects of attention on inhibitory and facilitatory phenomena elicited by paired-pulse transcranial magnetic stimulation in healthy subjects. Exp. Brain Res. 2008, 186, 393–399. [Google Scholar] [CrossRef] [PubMed]
- Conte, A.; Gilio, F.; Iezzi, E.; Frasca, V.; Inghilleri, M.; Berardelli, A. Attention influences the excitability of cortical motor areas in healthy humans. Exp. Brain Res. 2007, 182, 109–117. [Google Scholar] [CrossRef]
- Wilson, S.A.; Thickbroom, G.W.; Mastaglia, F.L. Transcranial magnetic stimulation mapping of the motor cortex in normal subjects: The representation of two intrinsic hand muscles. J. Neurol. Sci. 1993, 118, 134–144. [Google Scholar] [CrossRef]
- Saatlou, F.H.; Rogasch, N.C.; McNair, N.A.; Biabani, M.; Pillen, S.D.; Marshall, T.R.; Bergmann, T.O. MAGIC: An open-source MATLAB toolbox for external control of transcranial magnetic stimulation devices. Brain Stimul. Basic Transl. Clin. Res. Neuromodulation 2018, 11, 1189–1191. [Google Scholar]
- Chen, R.; Cros, D.; Curra, A.; Di Lazzaro, V.; Lefaucheur, J.P.; Magistris, M.R.; Mills, K.; Rosler, K.M.; Triggs, W.J.; Ugawa, Y.; et al. The clinical diagnostic utility of transcranial magnetic stimulation: Report of an IFCN committee. Clin. Neurophysiol. 2008, 119, 504–532. [Google Scholar] [CrossRef]
- Qasem, H.; Fujiyama, H.; Rurak, B.K.; Vallence, A.-M. Good test–retest reliability of a paired-pulse transcranial magnetic stimulation protocol to measure short-interval intracortical facilitation. Exp. Brain Res. 2020, 238, 2711–2723. [Google Scholar] [CrossRef]
- Vaseghi, B.; Zoghi, M.; Jaberzadeh, S. Inter-pulse interval affects the size of single-pulse TMS-induced motor evoked potentials: A reliability study. Basic Clin. Neurosci. 2015, 6, 44. [Google Scholar]
- Di Lazzaro, V.; Oliviero, A.; Profice, P.; Saturno, E.; Pilato, F.; Insola, A.; Mazzone, P.; Tonali, P.; Rothwell, J.C. Comparison of descending volleys evoked by transcranial magnetic and electric stimulation in conscious humans. Electroencephalogr. Clin. Neurophysiol. 1998, 109, 397–401. [Google Scholar] [CrossRef]
- Biabani, M.; Aminitehrani, M.; Zoghi, M.; Farrell, M.; Egan, G.; Jaberzadeh, S. The effects of transcranial direct current stimulation on short-interval intracortical inhibition and intracortical facilitation: A systematic review and meta-analysis. Rev. Neurosci. 2018, 29, 99–114. [Google Scholar] [CrossRef]
- Thickbroom, G.W.; Byrnes, M.L.; Edwards, D.J.; Mastaglia, F.L. Repetitive paired-pulse TMS at I-wave periodicity markedly increases corticospinal excitability: A new technique for modulating synaptic plasticity. Clin. Neurophysiol. 2006, 117, 61–66. [Google Scholar] [CrossRef]
- Opie, G.M.; Sasaki, R.; Hand, B.J.; Semmler, J.G. Modulation of motor cortex plasticity by repetitive paired-pulse TMS at late I-wave intervals is influenced by intracortical excitability. Brain Sci. 2021, 11, 121. [Google Scholar] [CrossRef]
- Cash, R.F.H.; Dar, A.; Hui, J.; De Ruiter, L.; Baarbé, J.; Fettes, P.; Peters, S.; Fitzgerald, P.B.; Downar, J.; Chen, R. Influence of inter-train interval on the plastic effects of rTMS. Brain Stimul. 2017, 10, 630–636. [Google Scholar] [CrossRef]
- Maeda, F.; Keenan, J.P.; Tormos, J.M.; Topka, H.; Pascual-Leone, A. Interindividual variability of the modulatory effects of repetitive transcranial magnetic stimulation on cortical excitability. Exp. Brain Res. 2000, 133, 425–430. [Google Scholar] [CrossRef]
- Corneal, S.F.; Butler, A.J.; Wolf, S.L. Intra-and intersubject reliability of abductor pollicis brevis muscle motor map characteristics with transcranial magnetic stimulation. Arch. Phys. Med. Rehabil. 2005, 86, 1670–1675. [Google Scholar] [CrossRef] [PubMed] [Green Version]
- Säisänen, L.; Pirinen, E.; Teitti, S.; Könönen, M.; Julkunen, P.; Määttä, S.; Karhu, J. Factors influencing cortical silent period: Optimized stimulus location, intensity and muscle contraction. J. Neurosci. Methods 2008, 169, 231–238. [Google Scholar] [CrossRef] [PubMed]
- Cash, R.F.H.; Benwell, N.M.; Murray, K.; Mastaglia, F.L.; Thickbroom, G.W. Neuromodulation by paired-pulse TMS at an I-wave interval facilitates multiple I-waves. Exp. Brain Res. 2009, 193, 1–7. [Google Scholar] [CrossRef] [PubMed]
- Akoglu, H. User’s guide to correlation coefficients. Turk. J. Emerg. Med. 2018, 18, 91–93. [Google Scholar] [CrossRef]
- Watanabe, T.; Hanajima, R.; Shirota, Y.; Ohminami, S.; Tsutsumi, R.; Terao, Y.; Ugawa, Y.; Hirose, S.; Miyashita, Y.; Konishi, S. Bidirectional effects on interhemispheric resting-state functional connectivity induced by excitatory and inhibitory repetitive transcranial magnetic stimulation. Hum. Brain Mapp. 2014, 35, 1896–1905. [Google Scholar] [CrossRef]
- Yoo, W.-K.; You, S.H.; Ko, M.-H.; Kim, S.T.; Park, C.-H.; Park, J.-W.; Ohn, S.H.; Hallett, M.; Kim, Y.-H. High frequency rTMS modulation of the sensorimotor networks: Behavioral changes and fMRI correlates. Neuroimage 2008, 39, 1886–1895. [Google Scholar] [CrossRef]
- Nettekoven, C.; Volz, L.J.; Kutscha, M.; Pool, E.-M.; Rehme, A.K.; Eickhoff, S.B.; Fink, G.R.; Grefkes, C. Dose-dependent effects of theta burst rTMS on cortical excitability and resting-state connectivity of the human motor system. J. Neurosci. 2014, 34, 6849–6859. [Google Scholar] [CrossRef]
- Shimomura, T.; Fujiki, M.; Ohba, H.; Kochiyma, T.; Sugita, K.; Matsuta, H.; Kawasaki, Y.; Oonishi, K.; Fudaba, H.; Kamida, T. Contralateral Negative Bold Responses in the Motor Network during Subthreshold High-Frequency Interleaved TMS-fMRI over the Human Primary Motor Cortex. J. Neurol. Neurophysiol. 2018, 9, 1–8. [Google Scholar] [CrossRef]
- Siebner, H.R.; Peller, M.; Willoch, F.; Minoshima, S.; Boecker, H.; Auer, C.; Drzezga, A.; Conrad, B.; Bartenstein, P. Lasting cortical activation after repetitive TMS of the motor cortex: A glucose metabolic study. Neurology 2000, 54, 956–963. [Google Scholar] [CrossRef]
- Li, R.; Potter, T.; Wang, J.; Shi, Z.; Wang, C.; Yang, L.; Chan, R.; Zhang, Y. Cortical hemodynamic response and connectivity modulated by sub-threshold high-frequency repetitive transcranial magnetic stimulation. Front. Hum. Neurosci. 2019, 13, 90. [Google Scholar] [CrossRef] [Green Version]
- Jing, H.; Takigawa, M. Observation of EEG coherence after repetitive transcranial magnetic stimulation. Clin. Neurophysiol. 2000, 111, 1620–1631. [Google Scholar] [CrossRef]
- Oliviero, A.; Strens, L.H.A.; Lazzaro, V.; Tonali, P.A.; Brown, P. Persistent effects of high frequency repetitive TMS on the coupling between motor areas in the human. Exp. Brain Res. 2003, 149, 107–113. [Google Scholar] [CrossRef]
- Kawaguchi, Y. Receptor subtypes involved in callosally-induced postsynaptic potentials in rat frontal agranular cortex in vitro. Exp. Brain Res. 1992, 88, 33–40. [Google Scholar] [CrossRef]
- Conti, F.; Manzoni, T. The neurotransmitters and postsynaptic actions of callosally projecting neurons. Behav. Brain Res. 1994, 64, 37–53. [Google Scholar] [CrossRef]
- Wu, T.; Sommer, M.; Tergau, F.; Paulus, W. Lasting influence of repetitive transcranial magnetic stimulation on intracortical excitability in human subjects. Neurosci. Lett. 2000, 287, 37–40. [Google Scholar] [CrossRef]
- Malcolm, M.P.; Paxton, R.J. High-frequency repetitive transcranial magnetic stimulation effects on motor intracortical neurophysiology: A sham-controlled investigation. J. Clin. Neurophysiol. 2015, 32, 428–433. [Google Scholar] [CrossRef]
- Jung, S.H.; Shin, J.E.; Jeong, Y.-S.; Shin, H.-I. Changes in motor cortical excitability induced by high-frequency repetitive transcranial magnetic stimulation of different stimulation durations. Clin. Neurophysiol. 2008, 119, 71–79. [Google Scholar] [CrossRef]
- Dyke, K.; Kim, S.; Jackson, G.M.; Jackson, S.R. Reliability of single and paired pulse transcranial magnetic stimulation parameters across eight testing sessions. Brain Stimul. 2018, 11, 1393–1394. [Google Scholar] [CrossRef]
- Brown, J.C.; Yuan, S.; DeVries, W.H.; Armstrong, N.M.; Korte, J.E.; Sahlem, G.L.; Carpenter, L.L.; George, M.S. NMDA-receptor agonist reveals LTP-like properties of 10-Hz rTMS in the human motor cortex. Brain Stimul. Basic Transl. Clin. Res. Neuromodulation 2021, 14, 619–621. [Google Scholar] [CrossRef]
- Esser, S.K.; Huber, R.; Massimini, M.; Peterson, M.J.; Ferrarelli, F.; Tononi, G. A direct demonstration of cortical LTP in humans: A combined TMS/EEG study. Brain Res. Bull. 2006, 69, 86–94. [Google Scholar] [CrossRef]
- de Jesus, D.R.; de Souza Favalli, G.P.; Hoppenbrouwers, S.S.; Barr, M.S.; Chen, R.; Fitzgerald, P.B.; Daskalakis, Z.J. Determining optimal rTMS parameters through changes in cortical inhibition. Clin. Neurophysiol. 2014, 125, 755–762. [Google Scholar] [CrossRef]
- Daskalakis, Z.J.; Möller, B.; Christensen, B.K.; Fitzgerald, P.B.; Gunraj, C.; Chen, R. The effects of repetitive transcranial magnetic stimulation on cortical inhibition in healthy human subjects. Exp. Brain Res. 2006, 174, 403–412. [Google Scholar] [CrossRef]
- Romeo, S.; Gilio, F.; Pedace, F.; Ozkaynak, S.; Inghilleri, M.; Manfredi, M.; Berardelli, A. Changes in the cortical silent period after repetitive magnetic stimulation of cortical motor areas. Exp. Brain Res. 2000, 135, 504–510. [Google Scholar] [CrossRef]
- Dreifuss, J.J.; Kelly, J.S.; Krnjević, K. Cortical inhibition and γ-aminobutyric acid. Exp. Brain Res. 1969, 9, 137–154. [Google Scholar] [CrossRef]
- Ortu, E.; Deriu, F.; Suppa, A.; Tolu, E.; Rothwell, J.C. Effects of volitional contraction on intracortical inhibition and facilitation in the human motor cortex. J. Physiol. 2008, 586, 5147–5159. [Google Scholar] [CrossRef]
- Orth, M.; Rothwell, J.C. The cortical silent period: Intrinsic variability and relation to the waveform of the transcranial magnetic stimulation pulse. Clin. Neurophysiol. 2004, 115, 1076–1082. [Google Scholar] [CrossRef]
- Kojima, S.; Onishi, H.; Sugawara, K.; Kirimoto, H.; Suzuki, M.; Tamaki, H. Modulation of the cortical silent period elicited by single-and paired-pulse transcranial magnetic stimulation. BMC Neurosci. 2013, 14, 1–10. [Google Scholar] [CrossRef] [PubMed] [Green Version]
- Silbert, B.I.; Thickbroom, G.W. Conditioning the cortical silent period with paired transcranial magnetic stimulation. Brain Stimul. 2013, 6, 541–544. [Google Scholar] [CrossRef]
- Ni, Z.; Gunraj, C.; Chen, R. Short interval intracortical inhibition and facilitation during the silent period in human. J. Physiol. 2007, 583, 971–982. [Google Scholar] [CrossRef]
- Ni, Z.; Gunraj, C.; Wagle-Shukla, A.; Udupa, K.; Mazzella, F.; Lozano, A.M.; Chen, R. Direct demonstration of inhibitory interactions between long interval intracortical inhibition and short interval intracortical inhibition. J. Physiol. 2011, 589, 2955–2962. [Google Scholar] [CrossRef]
- Xu, J.; Branscheidt, M.; Schambra, H.; Steiner, L.; Widmer, M.; Diedrichsen, J.; Goldsmith, J.; Lindquist, M.; Kitago, T.; Luft, A.R.; et al. Rethinking interhemispheric imbalance as a target for stroke neurorehabilitation. Ann. Neurol. 2019, 85, 502–513. [Google Scholar] [CrossRef] [PubMed] [Green Version]
- Huber, L.; Handwerker, D.A.; Jangraw, D.C.; Chen, G.; Hall, A.; Stüber, C.; Gonzalez-Castillo, J.; Ivanov, D.; Marrett, S.; Guidi, M.; et al. High-Resolution CBV-fMRI Allows Mapping of Laminar Activity and Connectivity of Cortical Input and Output in Human M1. Neuron 2017, 96, 1253–1263.e1257. [Google Scholar] [CrossRef] [PubMed]
- Brito, R.; Baltar, A.; Berenguer-Rocha, M.; Shirahige, L.; Rocha, S.; Fonseca, A.; Piscitelli, D.; Monte-Silva, K. Intrahemispheric EEG: A New Perspective for Quantitative EEG Assessment in Poststroke Individuals. Neural Plast. 2021, 2021, 5664647. [Google Scholar] [CrossRef] [PubMed]
Publisher’s Note: MDPI stays neutral with regard to jurisdictional claims in published maps and institutional affiliations. |
© 2022 by the authors. Licensee MDPI, Basel, Switzerland. This article is an open access article distributed under the terms and conditions of the Creative Commons Attribution (CC BY) license (https://creativecommons.org/licenses/by/4.0/).