
In Vivo Basilar Membrane Time Delays in Humans

 , , ,
, , ,  and
and 
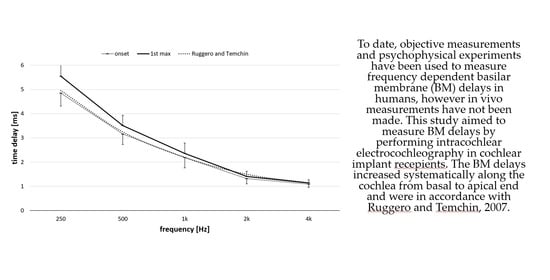
Abstract
:
1. Introduction
2. Materials and Methods
2.1. Subjects
2.2. Methods
2.3. Intracochclear Electrococgleography
2.4. Experiment 1: Tone Burst Stimulation
2.5. Stimulation Level Assessment
2.6. Experiment 2: Level Dependent Recordings
2.7. Experiment 3: Derived Method
2.8. Data Analysis
3. Results
4. Discussion
4.1. Extraction of CM and BM Delay Measurements
4.2. Effects on BM Delays
4.3. Derived and Other Methods of BM Delays
4.4. Application in Audio Coding Strategies
4.5. Previous Works
4.6. Temporal Synchrony Stimuli Application
5. Conclusions
Author Contributions
Funding
Institutional Review Board Statement
Acknowledgments
Conflicts of Interest
References
- Von Békésy, G. Uber die Rezonanzkurve und die Abklingzeit der verschiedenen Stellen der Schneckentrennwand. Akustische Zeitschrift 1943, 8, 66–76. [Google Scholar]
- Gundersen, T.; Skarstein, Ø.; Sikkeland, T. A Study of the Vibration of the Basilar Membrane in Human Temporal Bone Preparations by the Use of the Mossbauer Effect. Acta Oto-Laryngol. 1978, 86, 225–232. [Google Scholar] [CrossRef] [PubMed]
- Stenfelt, S.; Puria, S.; Hato, N.; Goode, R.L. Basilar membrane and osseous spiral lamina motion in human cadavers with air and bone conduction stimuli. Hear. Res. 2003, 181, 131–143. [Google Scholar] [CrossRef]
- Don, M.; Ponton, C.W.; Eggermont, J.J.; Kwong, B. The effects of sensory hearing loss on cochlear filter times estimated from auditory brainstem response latencies. J. Acoust. Soc. Am. 1998, 104, 2280–2289. [Google Scholar] [CrossRef]
- Zirn, S.; Arndt, S.; Aschendorff, A.; Wesarg, T. Interaural stimulation timing in single sided deaf cochlear implant users. Hear. Res. 2015, 328, 148–156. [Google Scholar] [CrossRef]
- Eggermont, J.J. Narrow-band AP latencies in normal and recruiting human ears. J. Acoust. Soc. Am. 1979, 65, 463–470. [Google Scholar] [CrossRef]
- Parker, D.J.; Thornton, A.R.D. Derived Cochlear Nerve and Brainstem Evoked Responses of the Human Auditory System the Effect of Masking in the Derived Band. Scand. Audiol. 1978, 7, 73–80. [Google Scholar] [CrossRef]
- Harte, J.; Pigasse, G.; Dau, T. Comparison of cochlear delay estimates using otoacoustic emissions and auditory brainstem responses. J. Acoust. Soc. Am. 2009, 126, 1291–1301. [Google Scholar] [CrossRef] [Green Version]
- Moleti, A.; Sisto, R. Comparison between otoacoustic and auditory brainstem response latencies supports slow backward propagation of otoacoustic emissions. J. Acoust. Soc. Am. 2008, 123, 1495–1503. [Google Scholar] [CrossRef]
- Schoonhoven, R.; Prijs, V.F.; Schneider, S. DPOAE group delays versus electrophysiological measures of cochlear delay in normal human ears. J. Acoust. Soc. Am. 2001, 109, 1503–1512. [Google Scholar] [CrossRef]
- Ruggero, M.A. Comparison of group delays of 2f1−f2 distortion product otoacoustic emissions and cochlear travel times. Acoust. Res. Lett. Online 2004, 5, 143–147. [Google Scholar] [CrossRef] [PubMed] [Green Version]
- Abdala, C.; Guérit, F.; Luo, P.; Shera, C.A. Distortion-product otoacoustic emission reflection-component delays and cochlear tuning: Estimates from across the human lifespan. J. Acoust. Soc. Am. 2014, 135, 1950–1958. [Google Scholar] [CrossRef] [PubMed] [Green Version]
- Şerbetçioğlu, M.B.; Parker, D.J. Measures of Cochlear Travelling Wave Delay in Humans: I. Comparison of Three Techniques in Subjects with Normal Hearing. Acta Oto-Laryngol. 1999, 119, 537–543. [Google Scholar] [CrossRef]
- Neely, S.T. Latency of auditory brain-stem responses and otoacoustic emissions using tone-burst stimuli. J. Acoust. Soc. Am. 1988, 83, 652–656. [Google Scholar] [CrossRef] [PubMed]
- Shera, C.A.; Guinan, J.J.; Oxenham, A.J. Revised estimates of human cochlear tuning from otoacoustic and behavioral measurements. Proc. Natl. Acad. Sci. USA 2002, 99, 3318–3323. [Google Scholar] [CrossRef] [PubMed] [Green Version]
- Ruggero, M.A.; Temchin, A.N. Similarity of Traveling-Wave Delays in the Hearing Organs of Humans and Other Tetrapods. J. Assoc. Res. Otolaryngol. 2007, 8, 153–166. [Google Scholar] [CrossRef] [PubMed] [Green Version]
- Eggermont, J.J. Ups and Downs in 75 Years of Electrocochleography. Front. Syst. Neurosci. 2017, 11, 2. [Google Scholar] [CrossRef] [Green Version]
- Patuzzi, R.B.; Yates, G.K.; Johnstone, B.M. The origin of the low-frequency microphonic in the first cochlear turn of guinea-pig. Hear. Res. 1989, 39, 177–188. [Google Scholar] [CrossRef]
- Robles, L.; Ruggero, M.A. Mechanics of the Mammalian Cochlea. Physiol. Rev. 2001, 81, 1305–1352. [Google Scholar] [CrossRef]
- Skarzynski, H.; Lorens, A. Electric Acoustic Stimulation in Children. In Cochlear Implants and Hearing Preservation; Van de Heyning, P., Kleine Punte, A., Eds.; Karger: Basel, Switzerland, 2010; Volume 67, pp. 135–143. [Google Scholar]
- Skarżyński, H.; Lorens, A.; Zgoda, M.; Piotrowska, A.; Skarzyński, P.H.; Szkielkowska, A. Atraumatic round window deep insertion of cochlear electrodes. Acta Oto-Laryngol. 2011, 131, 740–749. [Google Scholar] [CrossRef]
- Helbig, S.; Baumann, U.; Hey, C.; Helbig, M. Hearing Preservation after Complete Cochlear Coverage in Cochlear Implantation With the Free-Fitting FLEXSOFT Electrode Carrier. Otol. Neurotol. 2011, 32, 973–979. [Google Scholar] [CrossRef] [PubMed]
- Bruce, I.A.; Felton, M.; Lockley, M.; Melling, C.; Lloyd, S.K.; Freeman, S.R.; Green, K.M. Hearing Preservation Cochlear Implantation in Adolescents. Otol. Neurotol. 2014, 35, 1552–1559. [Google Scholar] [CrossRef] [PubMed]
- Nordfalk, K.F.; Rasmussen, K.; Bunne, M.; Jablonski, G.E. Deep round window insertion versus standard approach in cochlear implant surgery. Eur. Arch. Oto-Rhino-Laryngol. 2016, 273, 43–50. [Google Scholar] [CrossRef] [PubMed]
- O’Connell, B.P.; Hunter, J.; Haynes, D.S.; Holder, J.; Dedmon, M.M.; Noble, J.H.; Dawant, B.M.; Wanna, G.B. Insertion depth impacts speech perception and hearing preservation for lateral wall electrodes. Laryngoscope 2017, 127, 2352–2357. [Google Scholar] [CrossRef]
- Moteki, H.; Nishio, S.-Y.; Miyagawa, M.; Tsukada, K.; Noguchi, Y.; Usami, S.-I. Feasibility of hearing preservation for residual hearing with longer cochlear implant electrodes. Acta Oto-Laryngol. 2018, 138, 1080–1085. [Google Scholar] [CrossRef] [Green Version]
- Yoshimura, H.; Moteki, H.; Nishio, S.-Y.; Usami, S.-I. Electric-acoustic stimulation with longer electrodes for potential deterioration in low-frequency hearing. Acta Oto-Laryngol. 2020, 140, 624–630. [Google Scholar] [CrossRef]
- Calloway, N.H.; Fitzpatrick, D.C.; Campbell, A.P.; Iseli, C.; Pulver, S.; Buchman, C.A.; Adunka, O.F. Intracochlear Electrocochleography During Cochlear Implantation. Otol. Neurotol. 2014, 35, 1451–1457. [Google Scholar] [CrossRef]
- Dalbert, A.; Huber, A.; Veraguth, D.; Roosli, C.; Pfiffner, F. Assessment of Cochlear Trauma During Cochlear Implantation Using Electrocochleography and Cone Beam Computed Tomography. Otol. Neurotol. 2016, 37, 446–453. [Google Scholar] [CrossRef] [Green Version]
- Acharya, A.N.; Tavora-Vieira, D.; Rajan, G.P. Using the Implant Electrode Array to Conduct Real-time Intraoperative Hearing Monitoring During Pediatric Cochlear Implantation. Otol. Neurotol. 2016, 37, e148–e153. [Google Scholar] [CrossRef]
- Campbell, L.; Bester, C.; Iseli, C.; Sly, D.; Dragovic, A.; O’Leary, S.; Gummer, A.W. Electrophysiological Evidence of the Basilar-Membrane Travelling Wave and Frequency Place Coding of Sound in Cochlear Implant Recipients. Audiol. Neurotol. 2017, 22, 180–189. [Google Scholar] [CrossRef]
- Lorens, A.; Polak, M.; Piotrowska, A.; Skarzynski, H. Outcomes of Treatment of Partial Deafness with Cochlear Implantation: A DUET Study. Laryngoscope 2008, 118, 288–294. [Google Scholar] [CrossRef] [PubMed] [Green Version]
- Lorens, A.; Polak, M.; Walkowiak, A.; Skarzynski, H. Recordings of Acoustic Evoked Potentials Directly from the Different Places of Cochlea via Intracochlear Electrodes in Cochlear Implantees. In Abstract Book, Proceedings of the XXXII World Congress of Audiology, Brisbane, Australia, 3–7 May 2014; American Society for Surgery of the Hand: Chicago, IL, USA, 2014; Volume 452, p. 102. [Google Scholar]
- Bester, C.; Weder, S.; Collins, A.; Dragovic, A.; Brody, K.; Hampson, A.; O’Leary, S. Cochlear microphonic latency predicts outer hair cell function in animal models and clinical populations. Hear. Res. 2020, 398, 108094. [Google Scholar] [CrossRef] [PubMed]
- Jang, J.; Lee, J.W.; Woo, S.; Sly, D.J.; Campbell, L.J.; Cho, J.-H.; O’Leary, S.J.; Park, M.-H.; Han, S.; Choi, J.-W.; et al. A microelectromechanical system artificial basilar membrane based on a piezoelectric cantilever array and its characterization using an animal model. Sci. Rep. 2015, 5, 12447. [Google Scholar] [CrossRef] [PubMed]
- Altoè, A.; Shera, C.A. The cochlear ear horn: Geometric origin of tonotopic variations in auditory signal processing. Sci. Rep. 2020, 10, 20528. [Google Scholar] [CrossRef]
- Lorens, A.; Walkowiak, A.; Polak, M.; Kowalczuk, A.; Furmanek, M.; Skarzynski, H.; Obrycka, A.; Med-El, I. Cochlear Microphonics in Hearing Preservation Cochlear Implantees. J. Int. Adv. Otol. 2019, 15, 345–351. [Google Scholar] [CrossRef]
- Greenwood, D.D. A cochlear frequency-position function for several species—29 years later. J. Acoust. Soc. Am. 1990, 87, 2592–2605. [Google Scholar] [CrossRef]
- Stakhovskaya, O.; Sridhar, D.; Bonham, B.H.; Leake, P.A. Frequency Map for the Human Cochlear Spiral Ganglion: Implications for Cochlear Implants. J. Assoc. Res. Otolaryngol. 2007, 8, 220–233. [Google Scholar] [CrossRef] [Green Version]
- Polak, M.; Lorens, A.; Furmanek, M.; Skarzyński, H. Electrode estimation in the acoustic region of the human Cochlea. Acta Oto-Laryngol. 2020, 140, 487–496. [Google Scholar] [CrossRef]
- Verschooten, E.; Robles, L.; Joris, P.X. Assessment of the Limits of Neural Phase-Locking Using Mass Potentials. J. Neurosci. 2015, 35, 2255–2268. [Google Scholar] [CrossRef] [Green Version]
- Hellbrück, J.; Moser, L.M. Hörgeräte–Audiometrie: Ein computerunterstütztes psychologisches Verfahren zur Hörgeräte-anpassung. Psychol. Beiträge 1985, 27, 494–508. [Google Scholar]
- Don, M.; Eggermont, J.J. Analysis of the click-evoked brainstem potentials in man using high-pass noise masking. J. Acoust. Soc. Am. 1978, 63, 1084–1092. [Google Scholar] [CrossRef] [PubMed]
- Chertoff, M.E.; Earl, B.R.; Diaz, F.J.; Sorensen, J.L. Analysis of the cochlear microphonic to a low-frequency tone embedded in filtered noise. J. Acoust. Soc. Am. 2012, 132, 3351–3362. [Google Scholar] [CrossRef] [PubMed] [Green Version]
- Eggermont, J.J. Electrocochleography. In Handbook of Sensory Physiology; Keidel, W.D., Neff, W.D., Eds.; Springer: Berlin, Germany, 1976; pp. 625–705. [Google Scholar]
- Forgues, M.; Koehn, H.A.; Dunnon, A.K.; Pulver, S.H.; Buchman, C.A.; Adunka, O.F.; Fitzpatrick, D.C. Distinguishing hair cell from neural potentials recorded at the round window. J. Neurophysiol. 2014, 111, 580–593. [Google Scholar] [CrossRef] [PubMed] [Green Version]
- Fontenot, T.E.; Giardina, C.K.; Fitzpatrick, D.C. A Model-Based Approach for Separating the Cochlear Microphonic from the Auditory Nerve Neurophonic in the Ongoing Response Using Electrocochleography. Front. Neurosci. 2017, 11, 592. [Google Scholar] [CrossRef]
- Sparacino, G.; Milani, S.; Magnavita, V.; Arslan, E. Electrocochleography potentials evoked by condensation and rarefaction clicks independently derived by a new numerical filtering approach. Audiol. Neurootol. 2000, 5, 276–291. [Google Scholar] [CrossRef]
- Temchin, A.N.; Recio-Spinoso, A.; Van Dijk, P.; Ruggero, M.A. Wiener Kernels of Chinchilla Auditory-Nerve Fibers: Verification Using Responses to Tones, Clicks, and Noise and Comparison With Basilar-Membrane Vibrations. J. Neurophysiol. 2005, 93, 3635–3648. [Google Scholar] [CrossRef] [Green Version]
- Javel, E. Auditory System, Peripheral. In Encyclopedia of the Neurological Sciences; Elsevier BV: Amsterdam, The Netherlands, 2003; pp. 305–311. [Google Scholar]
- Wright, A. Dimensions of the cochlear stereocilia in man and the guinea pig. Hear. Res. 1984, 13, 89–98. [Google Scholar] [CrossRef]
- Møller, A.R. Auditory Neurophysiology. J. Clin. Neurophysiol. 1994, 11, 284–308. [Google Scholar] [CrossRef]
- Ruggero, M.A. Cochlear delays and traveling waves: Comments on ‘Experimental look at cochlear mechanics’. Audiology 1994, 33, 131–142. [Google Scholar] [CrossRef]
- Liberman, M.C.; Kiang, N.Y. Acoustic trauma in cats. Cochlear pathology and auditory-nerve activity. Acta Oto-Laryngol. Suppl. 1978, 358, 1–63. [Google Scholar]
- Gorga, M.P.; Kaminski, J.R.; Beauchaine, K.L. Effects of stimulus phase on the latency of the auditory brainstem response. J. Am. Acad. Audiol. 1991, 2, 1–6. [Google Scholar] [PubMed]
- Murray, J.G.; Cohn, E.S.; Harker, L.A.; Gorga, M.P. Tone burst auditory brain stem response latency estimates of cochlear travel time in Meniere’s disease, cochlear hearing loss, and normal ears. Am. J. Otol. 1998, 19, 854–859. [Google Scholar] [PubMed]
- Mitra, S.K. Signals and Systems; Cambridge University Press: Cambridge, UK, 2016; ISBN 9780190245290. [Google Scholar]
- Polak, M.; Hodges, A.V.; King, J.E.; Balkany, T.J. Further prospective findings with compound action potentials from Nucleus 24 cochlear implants. Hear. Res. 2004, 188, 104–116. [Google Scholar] [CrossRef]
- He, S.; Teagle, H.F.B.; Buchman, C.A. The Electrically Evoked Compound Action Potential: From Laboratory to Clinic. Front. Neurosci. 2017, 11, 339. [Google Scholar] [CrossRef]
- Peake, W.T.; Kiang, N.Y. Cochlear responses to condensation and rarefaction clicks. Biophys. J. 1962, 2, 23–34. [Google Scholar] [CrossRef] [Green Version]
- Elberling, C, Don M Auditory brainstem responses to a chirp stimulus designed from derived-band latencies in normal-hearing subjects. J. Acoust. Soc. Am. 2008, 124, 3022–3037. [CrossRef]
- Siegel, J.H.; Cerka, A.J.; Recio-Spinoso, A.; Temchin, A.N.; Van Dijk, P.; Ruggero, M.A. Delays of stimulus-frequency otoacoustic emissions and cochlear vibrations contradict the theory of coherent reflection filtering. J. Acoust. Soc. Am. 2005, 118, 2434–2443. [Google Scholar] [CrossRef]
- Joris, P.X.; Bergevin, C.; Kalluri, R.; Mc Laughlin, M.; Michelet, P.; van der Heijden, M.; Shera, C.A. Frequency selectivity in Old-World monkeys corroborates sharp cochlear tuning in humans. Proc. Natl. Acad. Sci. USA 2011, 108, 17516–17520. [Google Scholar] [CrossRef] [Green Version]
- Sumner, C.J.; Wells, T.T.; Bergevin, C.; Sollini, J.; Kreft, H.A.; Palmer, A.R.; Oxenham, A.J.; Shera, C.A. Mammalian behavior and physiology converge to confirm sharper cochlear tuning in humans. Proc. Natl. Acad. Sci. USA 2018, 115, 11322–11326. [Google Scholar] [CrossRef] [Green Version]
- Bowman, D.M. The effect of sound intensity on f1-sweep and f2-sweep distortion product otoacoustic emissions phase delay estimates in human adults. J. Acoust. Soc. Am. 1997, 101, 1550–1559. [Google Scholar] [CrossRef]
- Ren, T.; He, W.; Scott, M.; Nuttall, A.L. Group Delay of Acoustic Emissions in the Ear. J. Neurophysiol. 2006, 96, 2785–2791. [Google Scholar] [CrossRef] [PubMed] [Green Version]
- Russell, I.J.; Nilsen, K.E. The location of the cochlear amplifier: Spatial representation of a single tone on the guinea pig basilar membrane. Proc. Natl. Acad. Sci. USA 1997, 94, 2660–2664. [Google Scholar] [CrossRef] [PubMed] [Green Version]
- Ren, T. Longitudinal pattern of basilar membrane vibration in the sensitive cochlea. Proc. Natl. Acad. Sci. USA 2002, 99, 17101–17106. [Google Scholar] [CrossRef] [PubMed] [Green Version]
- Rhode, W.S.; Recio, A. Study of mechanical motions in the basal region of the chinchilla cochlea. J. Acoust. Soc. Am. 2000, 107, 3317–3332. [Google Scholar] [CrossRef] [Green Version]
- Olson, E.S. Observing middle and inner ear mechanics with novel intracochlear pressure sensors. J. Acoust. Soc. Am. 1998, 103, 3445–3463. [Google Scholar] [CrossRef] [Green Version]
- Pfeiffer, R.R.; Kim, D.O. Cochlear nerve fiber responses: Distribution along the cochlear partition. J. Acoust. Soc. Am. 1975, 58, 867–869. [Google Scholar] [CrossRef]
- De Boer, E. Auditory physics. Physical principles in hearing theory. II. Phys. Rep. 1984, 105, 141–226. [Google Scholar] [CrossRef]
- De Boer, E.; Nuttall, A.L. Cochlear travel time and minimum phase. In Proceedings of the Association for Research in Otolaryngology Midwinter Meeting, St. Petersburg Beach, FL, USA, 4–8 February 1996; Abstract 228. Volume 19, p. 57. [Google Scholar]
- Lighthill, J. Energy flow in the cochlea. J. Fluid Mech. 1981, 106, 149–213. [Google Scholar] [CrossRef]
- Mammano, F.; Nobili, R. Biophysics of the cochlea: Linear approximation. J. Acoust. Soc. Am. 1993, 93, 3320–3332. [Google Scholar] [CrossRef]
- Shore, S.E.; Nuttall, A.L. High-synchrony cochlear compound action potentials evoked by rising frequency-swept tone bursts. J. Acoust. Soc. Am. 1985, 78, 1286–1295. [Google Scholar] [CrossRef]
- De Boer, E. A cylindrical cochlea model: The bridge between two and three dimensions. Hear. Res. 1980, 3, 109–131. [Google Scholar] [CrossRef]
- Shera, C.A.; Guinan, J.J., Jr. Stimulus-frequency-emission group delay: A test of coherent reflection filtering and a window on cochlear tuning. J. Acoust. Soc. Am. 2003, 113, 2762–2772. [Google Scholar] [CrossRef] [PubMed] [Green Version]
- Elberling, C.; Callø, J.; Don, M. Evaluating auditory brainstem responses to different chirp stimulus at three levels of stimulation. J. Acoust. Soc. Am. 2010, 128, 215–223. [Google Scholar] [CrossRef] [PubMed]


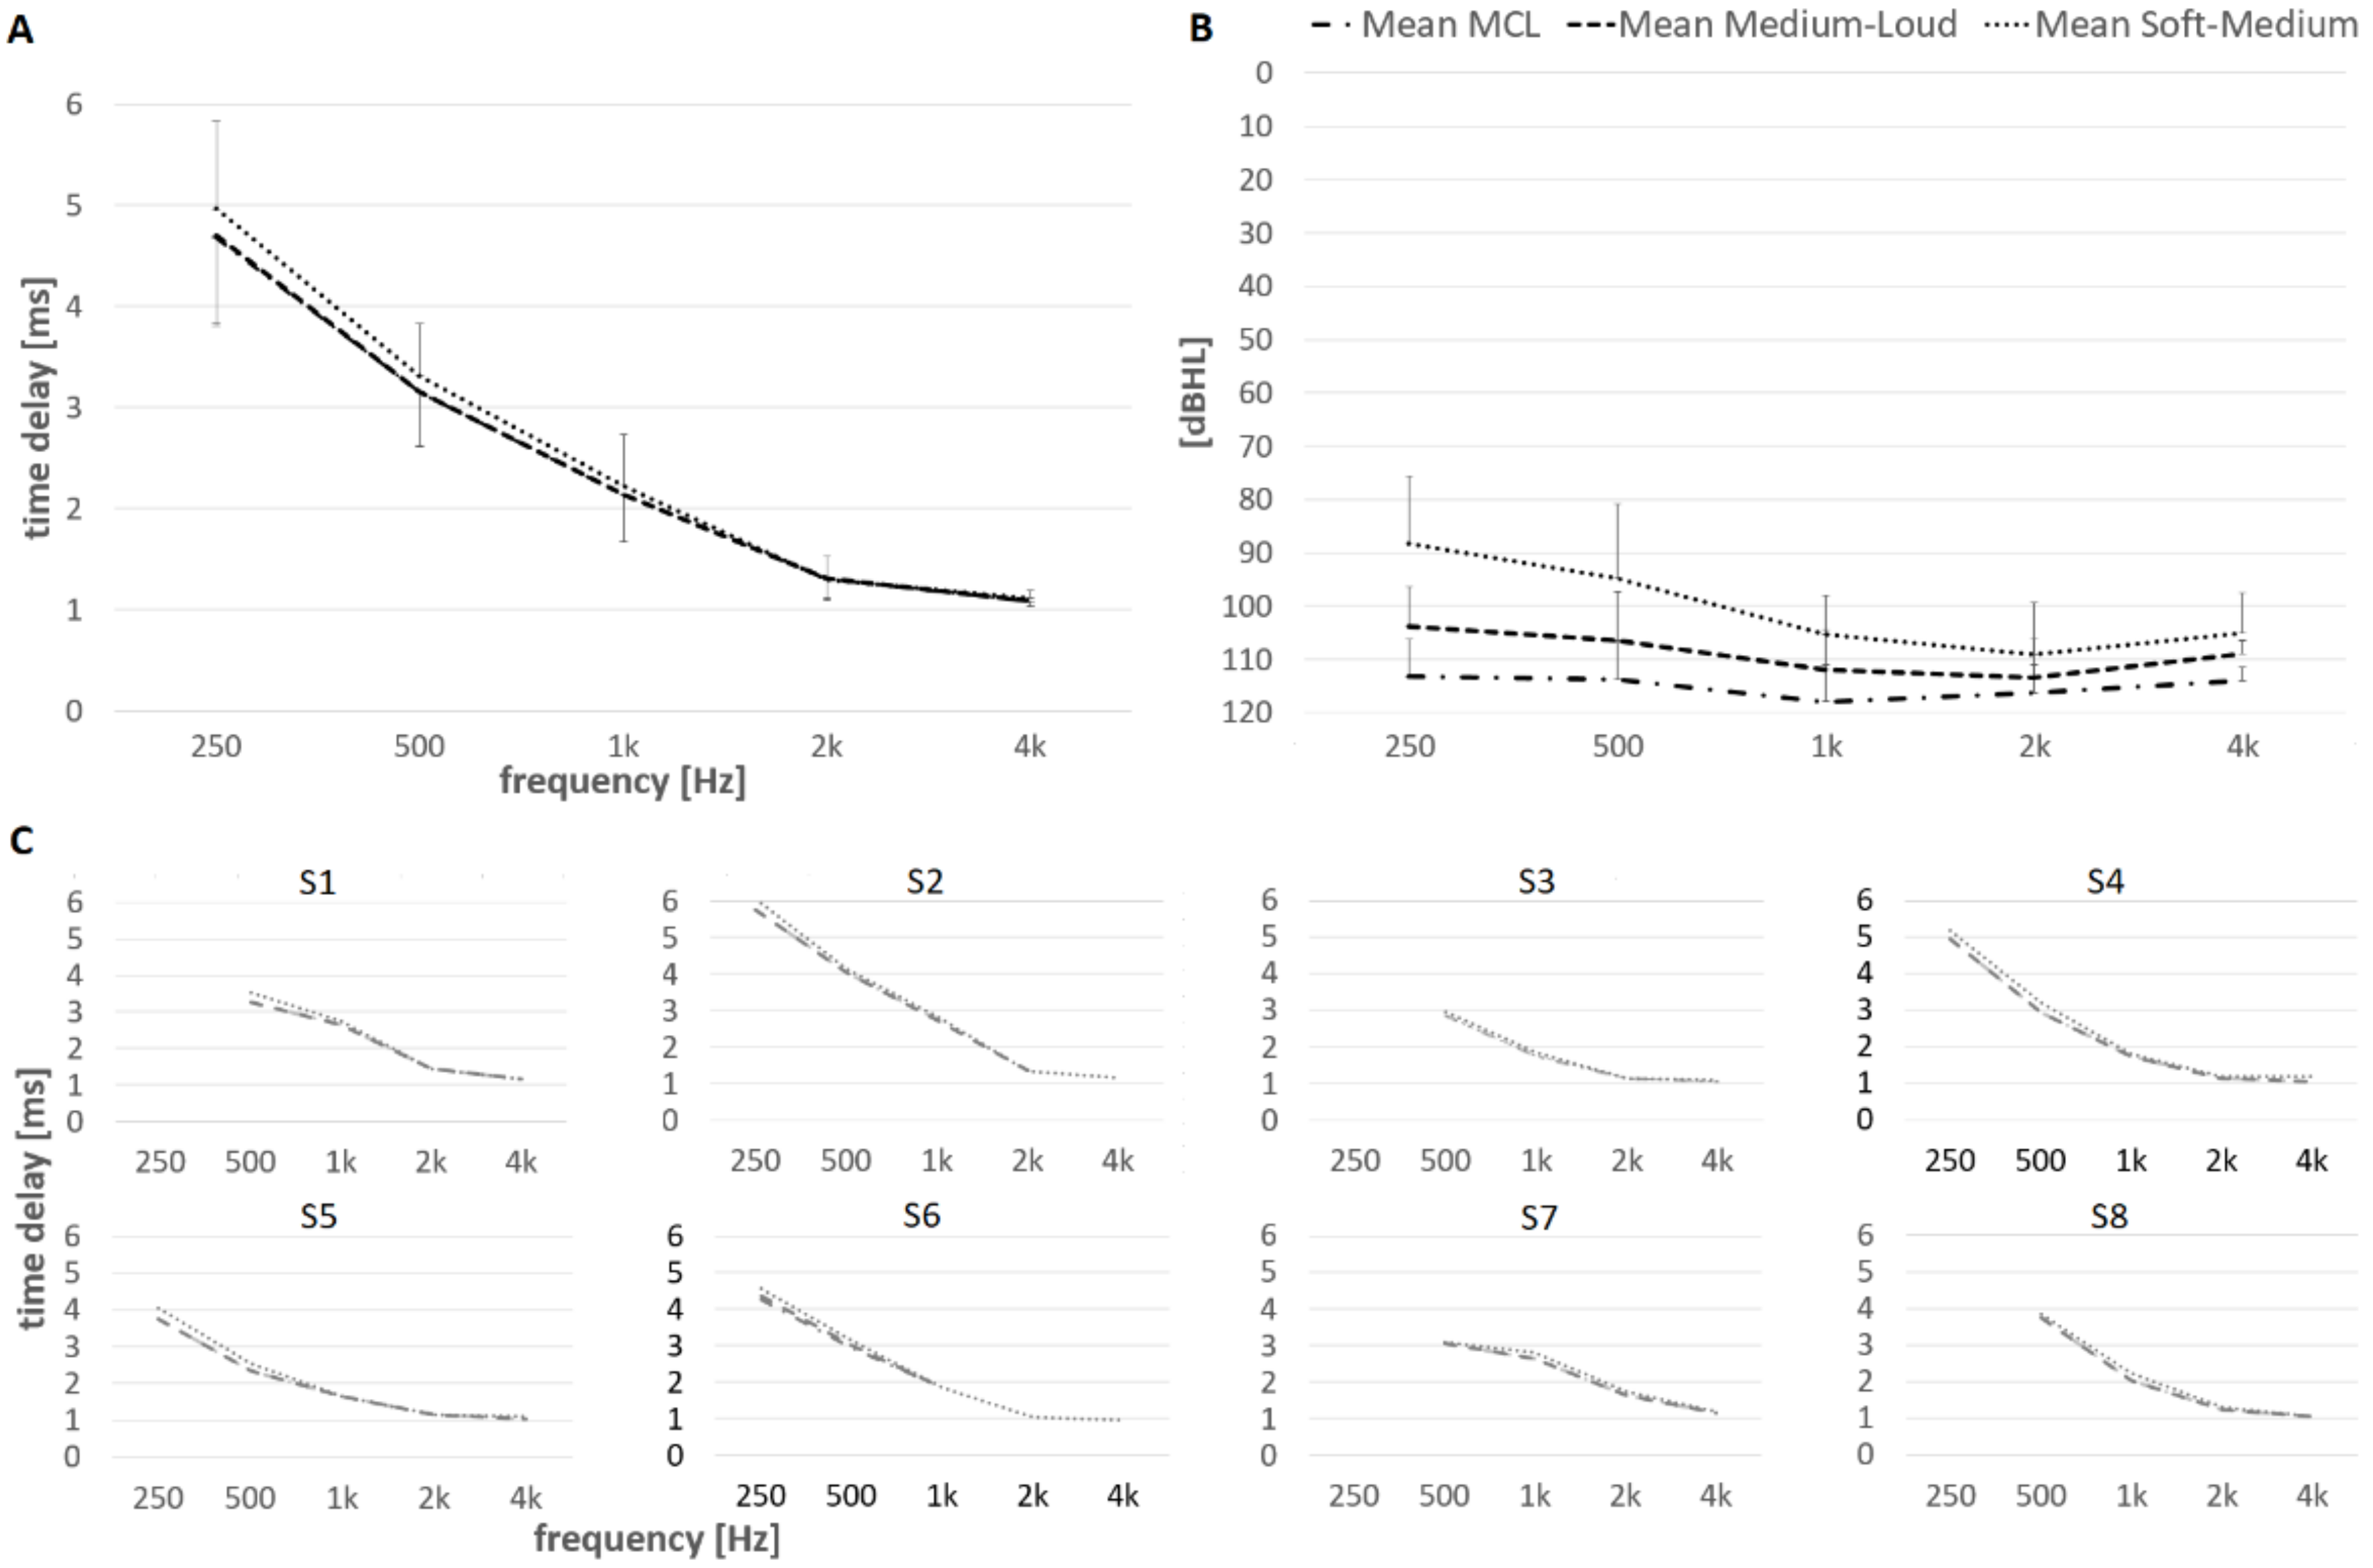
| Frequency (Hz) | 250 | 500 | 1 k | 2 k | 4 k |
|---|---|---|---|---|---|
| Onset of CM Mean ± SD (ms) | 4.85 ± 0.54 | 3.16 ± 0.43 | 2.19 ± 0.42 | 1.32 ± 0.22 | 1.09 ± 0.13 |
| 1st CM Peak Mean ± SD (ms) | 5.51 ± 0.58 | 3.51 ± 0.45 | 2.36 ± 0.44 | 1.41 ± 0.23 | 1.14 ± 0.14 |
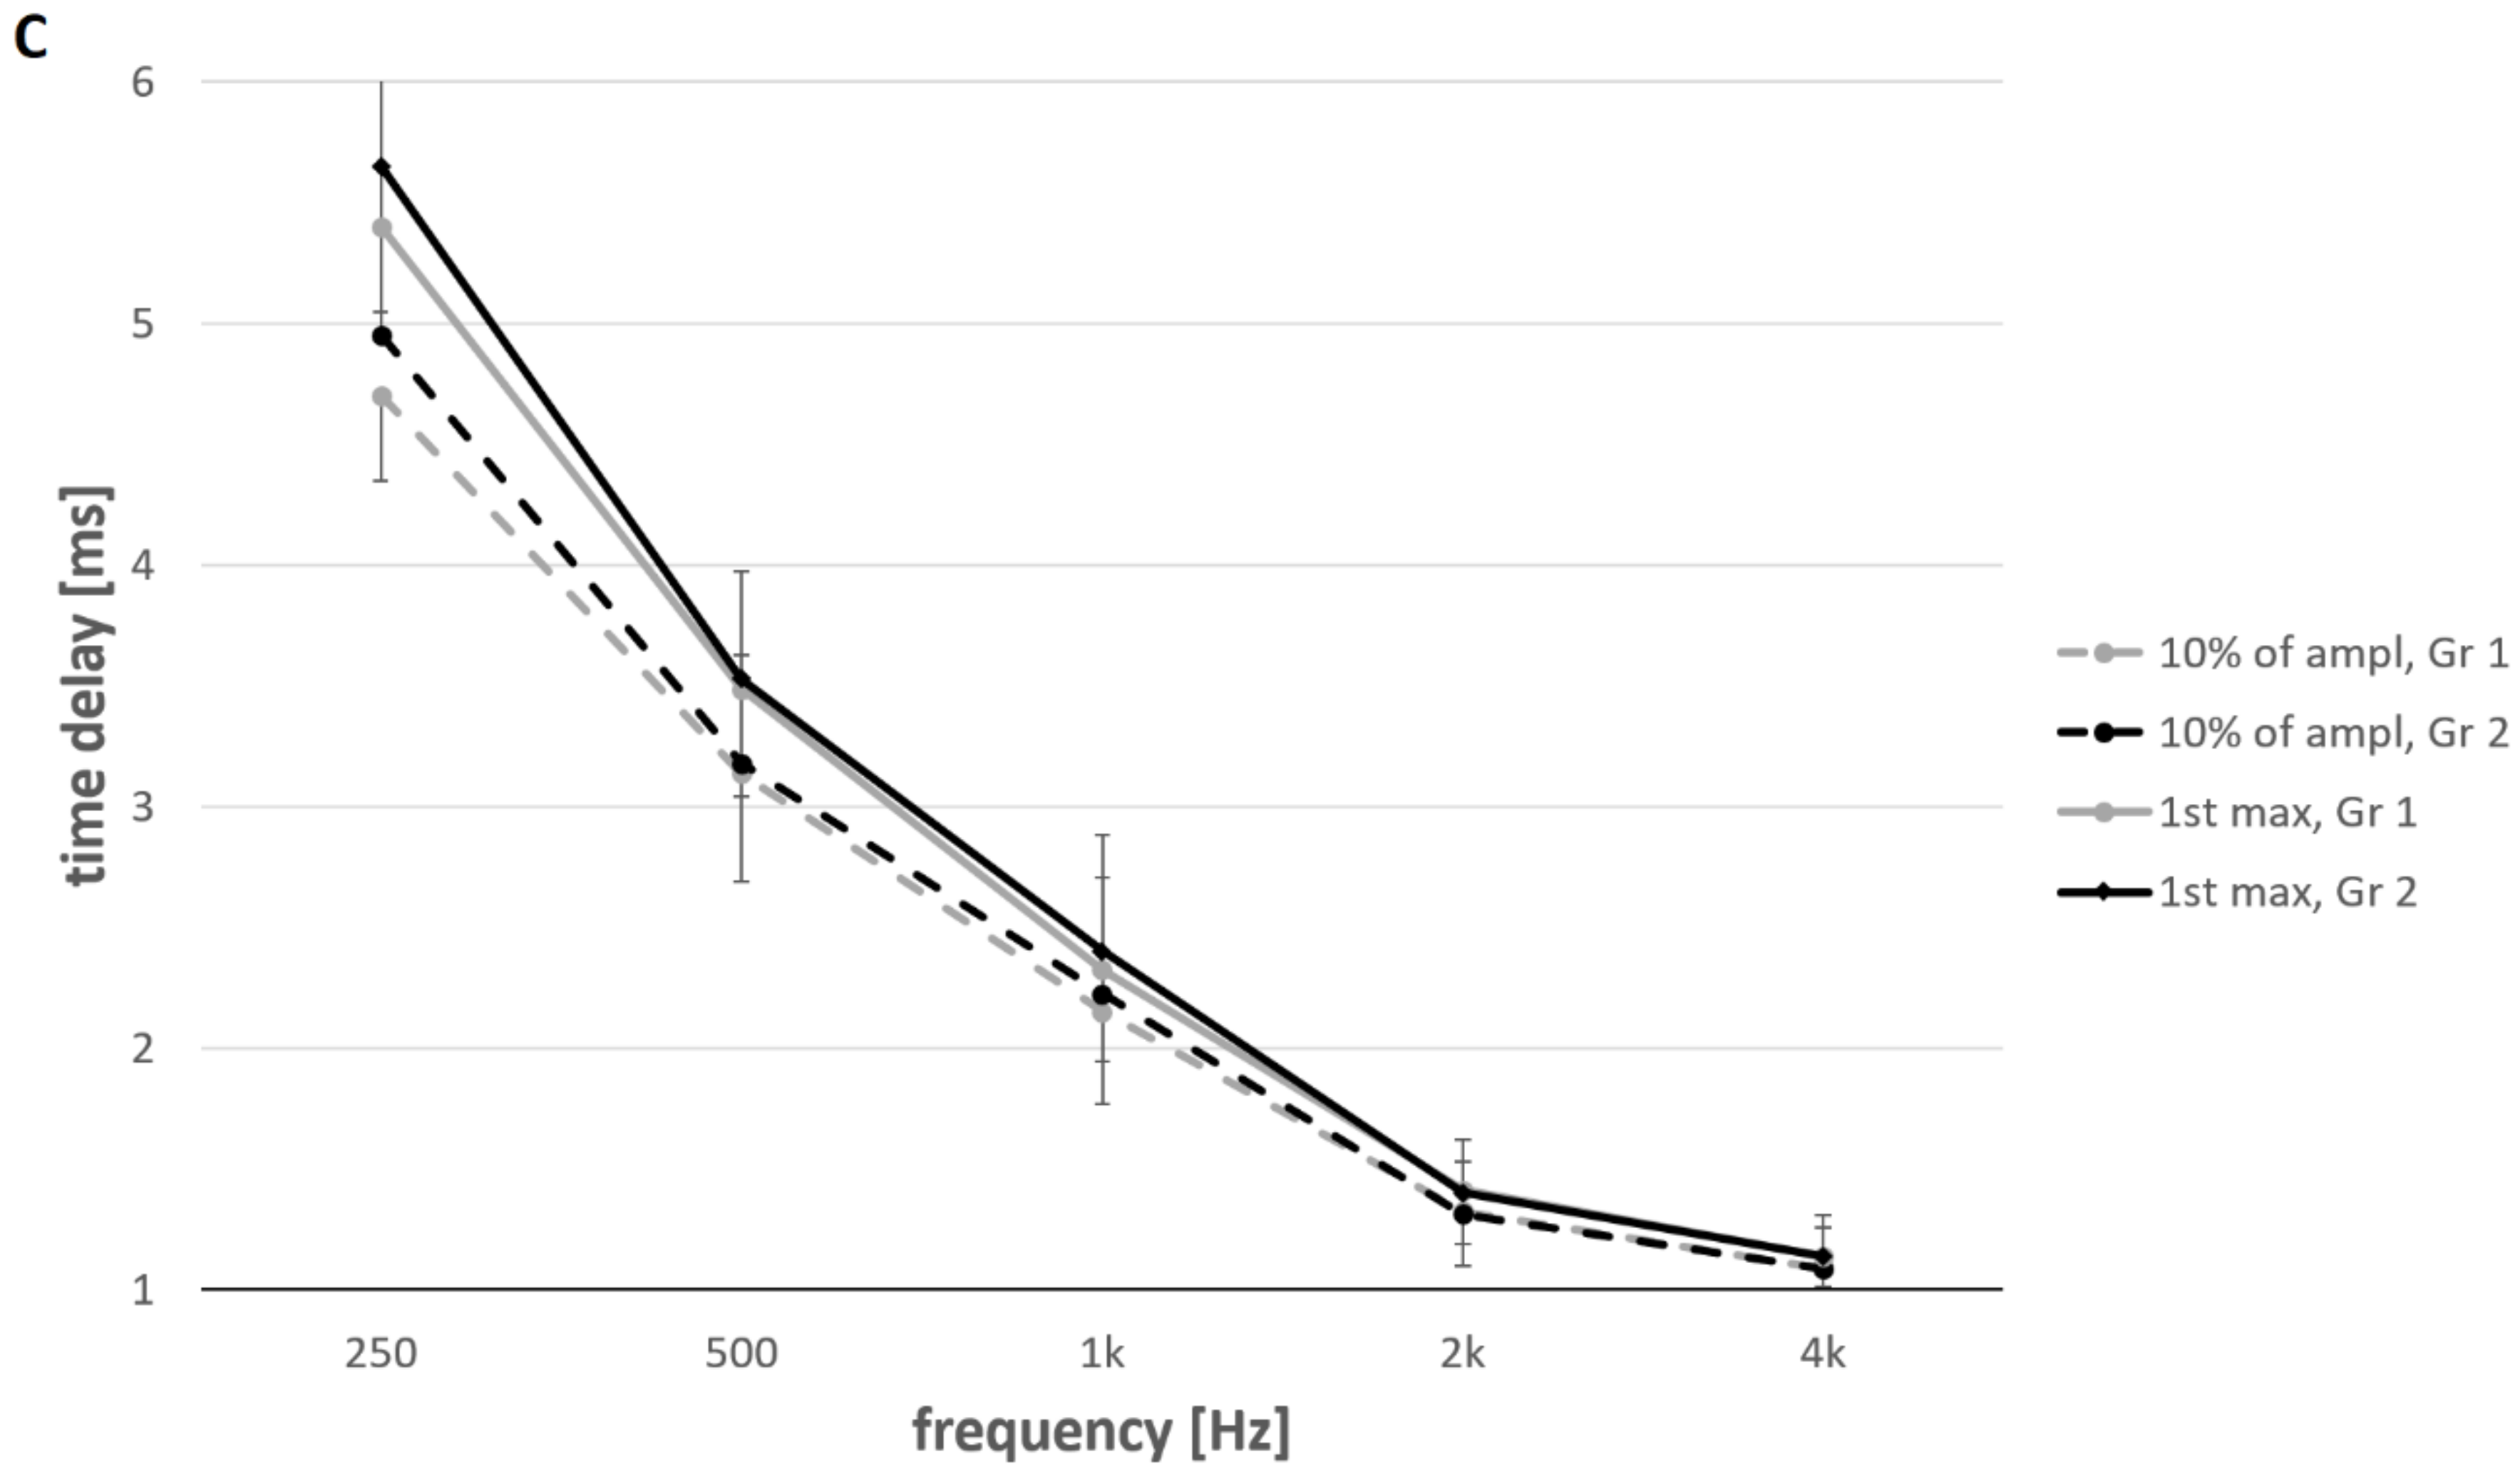
| Frequency (Hz) | 250 | 500 | 1 k | 2 k | 4 k |
|---|---|---|---|---|---|
| Group 1 Onset of CM Mean ± SD (ms) | 4.70 ± 0.35 | 3.14 ± 0.45 | 2.15 ± 0.38 | 1.33 ± 0.23 | 1.09 ±0.07 |
| Group 1 1st CM Peak Mean ± SD (ms) | 5.40 ± 0.38 | 3.49 ± 0.47 | 2.33 ± 0.41 | 1.41 ± 0.25 | 1.14 ± 0.07 |
| Group 2 Onset of CM Mean ± SD (ms) | 4.95 ± 0.69 | 3.18 ± 0.45 | 2.23 ± 0.48 | 1.31 ± 0.22 | 1.09 ± 0.17 |
| Group 2 1st CM Peak Mean ± SD (ms) | 5.65 ± 0.71 | 3.53 ± 0.47 | 2.40 ± 0.47 | 1.40 ± 0.22 | 1.14 ± 0.17 |
Publisher’s Note: MDPI stays neutral with regard to jurisdictional claims in published maps and institutional affiliations. |
© 2022 by the authors. Licensee MDPI, Basel, Switzerland. This article is an open access article distributed under the terms and conditions of the Creative Commons Attribution (CC BY) license (https://creativecommons.org/licenses/by/4.0/).
Share and Cite
Polak, M.; Lorens, A.; Walkowiak, A.; Furmanek, M.; Skarzynski, P.H.; Skarzynski, H. In Vivo Basilar Membrane Time Delays in Humans. Brain Sci. 2022, 12, 400. https://doi.org/10.3390/brainsci12030400
Polak M, Lorens A, Walkowiak A, Furmanek M, Skarzynski PH, Skarzynski H. In Vivo Basilar Membrane Time Delays in Humans. Brain Sciences. 2022; 12(3):400. https://doi.org/10.3390/brainsci12030400
Chicago/Turabian StylePolak, Marek, Artur Lorens, Adam Walkowiak, Mariusz Furmanek, Piotr Henryk Skarzynski, and Henryk Skarzynski. 2022. "In Vivo Basilar Membrane Time Delays in Humans" Brain Sciences 12, no. 3: 400. https://doi.org/10.3390/brainsci12030400
APA StylePolak, M., Lorens, A., Walkowiak, A., Furmanek, M., Skarzynski, P. H., & Skarzynski, H. (2022). In Vivo Basilar Membrane Time Delays in Humans. Brain Sciences, 12(3), 400. https://doi.org/10.3390/brainsci12030400