White Matter Microstructural Alterations in Newly Diagnosed Parkinson’s Disease: A Whole-Brain Analysis Using dMRI


Abstract
:1. Introduction
2. Materials and Methods
2.1. Participants
2.2. MRI Data Acquisition
2.3. Image Processing
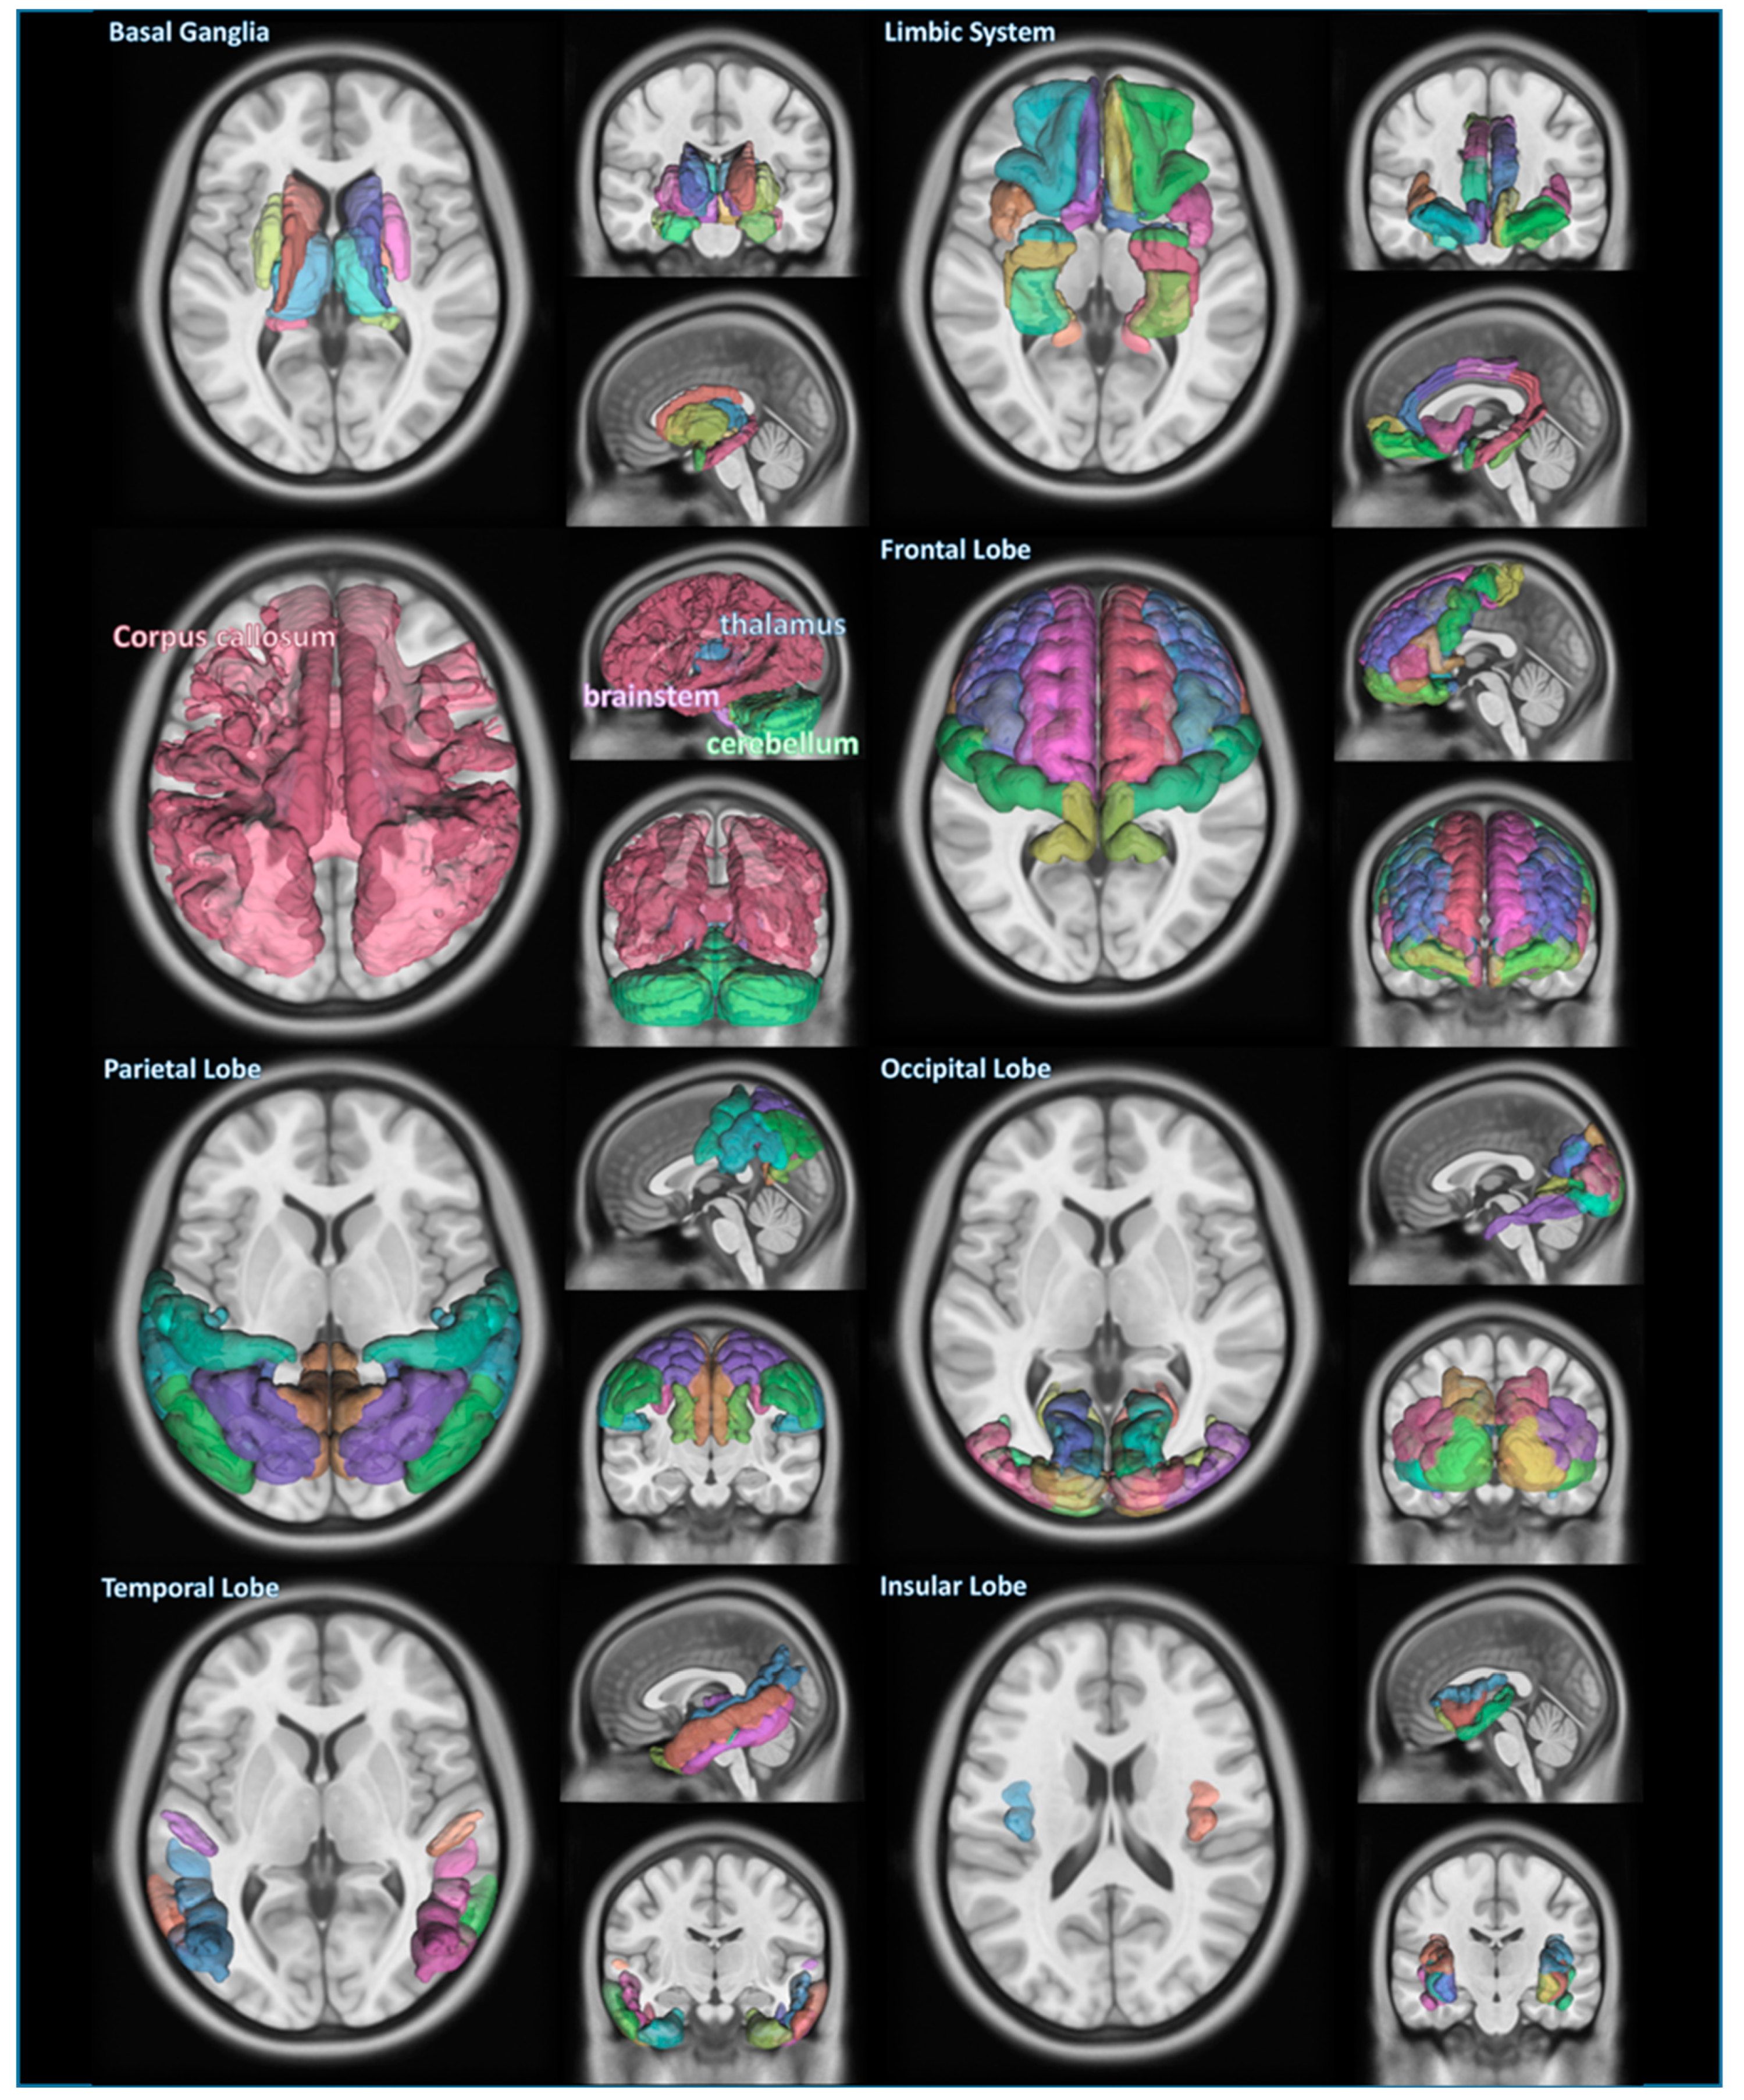
2.4. Classification of Brain Structures
2.5. Statistical Analysis
3. Results
4. Discussion
5. Conclusions
Author Contributions
Funding
Institutional Review Board Statement
Informed Consent Statement
Data Availability Statement
Acknowledgments
Conflicts of Interest
References
- Xia, R.; Mao, Z.H. Progression of motor symptoms in Parkinson’s disease. Neurosci. Bull. 2012, 28, 39–48. [Google Scholar] [CrossRef]
- Devi, L.; Raghavendran, V.; Prabhu, B.M.; Avadhani, N.G.; Anandatheerthavarada, H.K. Mitochondrial import and accumulation of alpha-synuclein impair complex I in human dopaminergic neuronal cultures and Parkinson disease brain. J. Biol. Chem. 2008, 283, 9089–9100. [Google Scholar] [CrossRef] [Green Version]
- Braak, H.; Ghebremedhin, E.; Rüb, U.; Bratzke, H.; Del Tredici, K. Stages in the development of Parkinson’s disease-related pathology. Cell Tissue Res. 2004, 318, 121–134. [Google Scholar] [CrossRef]
- Salat, D.; Noyce, A.J.; Schrag, A.; Tolosa, E. Challenges of modifying disease progression in prediagnostic Parkinson’s disease. Lancet Neurol. 2016, 15, 637–648. [Google Scholar] [CrossRef]
- Postuma, R.B.; Aarsland, D.; Barone, P.; Burn, D.J.; Hawkes, C.H.; Oertel, W.; Ziemssen, T. Identifying prodromal Parkinson’s disease: Pre-motor disorders in Parkinson’s disease. Mov. Disord. 2012, 27, 617–626. [Google Scholar] [CrossRef] [PubMed]
- Atkinson-Clement, C.; Pinto, S.; Eusebio, A.; Coulon, O. Diffusion tensor imaging in Parkinson’s disease: Review and meta-analysis. Neuroimage Clin. 2017, 16, 98–110. [Google Scholar] [CrossRef]
- Assaf, Y.; Pasternak, O. Diffusion tensor imaging (DTI)-based white matter mapping in brain research: A review. J. Mol. Neurosci. 2008, 34, 51–61. [Google Scholar] [CrossRef]
- Salan, T.; Jacobs, E.L.; Reddick, W.E. A 3D model-based simulation of demyelination to understand its effects on diffusion tensor imaging. Annu. Int. Conf. IEEE Eng. Med. Biol. Soc. 2017, 2017, 3525–3528. [Google Scholar]
- Gu, L.; Li, J.; Feng, D.F.; Cheng, E.T.; Li, D.C.; Yang, X.Q.; Wang, B.C. Detection of white matter lesions in the acute stage of diffuse axonal injury predicts long-term cognitive impairments: A clinical diffusion tensor imaging study. J. Trauma. Acute Care Surg. 2013, 74, 242–247. [Google Scholar] [CrossRef]
- Winklewski, P.J.; Sabisz, A.; Naumczyk, P.; Jodzio, K.; Szurowska, E.; Szarmach, A. Understanding the Physiopathology Behind Axial and Radial Diffusivity Changes-What Do We Know? Front. Neurol. 2018, 9, 92. [Google Scholar] [CrossRef] [Green Version]
- Yeh, F.C.; Wedeen, V.J.; Tseng, W.Y. Generalized q-sampling imaging. IEEE Trans. Med. Imaging 2010, 29, 1626–1635. [Google Scholar]
- Jin, Z.; Bao, Y.; Wang, Y.; Li, Z.; Zheng, X.; Long, S.; Wang, Y. Differences between generalized Q-sampling imaging and diffusion tensor imaging in visualization of crossing neural fibers in the brain. Surg. Radiol. Anat. 2019, 41, 1019–1028. [Google Scholar] [CrossRef] [Green Version]
- Shen, C.Y.; Tyan, Y.S.; Kuo, L.W.; Wu, C.W.; Weng, J.C. Quantitative Evaluation of Rabbit Brain Injury after Cerebral Hemisphere Radiation Exposure Using Generalized q-Sampling Imaging. PLoS ONE 2015, 10, e0133001. [Google Scholar] [CrossRef] [Green Version]
- Celtikci, P.; Fernandes-Cabral, D.T.; Yeh, F.C.; Panesar, S.S.; Fernandez-Miranda, J.C. Generalized q-sampling imaging fiber tractography reveals displacement and infiltration of fiber tracts in low-grade gliomas. Neuroradiology 2018, 60, 267–280. [Google Scholar] [CrossRef]
- Schwarz, S.T.; Abaei, M.; Gontu, V.; Morgan, P.S.; Bajaj, N.; Auer, D.P. Diffusion tensor imaging of nigral degeneration in Parkinson’s disease: A region-of-interest and voxel-based study at 3 T and systematic review with meta-analysis. Neuroimage Clin. 2013, 3, 481–488. [Google Scholar] [CrossRef] [Green Version]
- Nagae, L.M.; Honce, J.M.; Tanabe, J.; Shelton, E.; Sillau, S.H.; Berman, B.D. Microstructural Changes within the Basal Ganglia Differ between Parkinson Disease Subtypes. Front. Neuroanat. 2016, 10, 17. [Google Scholar] [CrossRef] [Green Version]
- Chen, N.K.; Chou, Y.H.; Sundman, M.; Hickey, P.; Kasoff, W.S.; Bernstein, A.; Trouard, T.P.; Lin, T.; Rapcsak, S.Z.; Sherman, S.J.; et al. Alteration of Diffusion-Tensor Magnetic Resonance Imaging Measures in Brain Regions Involved in Early Stages of Parkinson’s Disease. Brain Connect. 2018, 8, 343–349. [Google Scholar] [CrossRef]
- Wen, M.C.; Heng, H.S.E.; Hsu, J.L.; Xu, Z.; Liew, G.M.; Au, W.L.; Chan, L.L.; Tan, L.C.S.; Tan, E.K. Structural connectome alterations in prodromal and de novo Parkinson’s disease patients. Parkinsonism Relat. Disord. 2017, 45, 21–27. [Google Scholar] [CrossRef]
- Mishra, V.R.; Sreenivasan, K.R.; Yang, Z.; Zhuang, X.; Cordes, D.; Mari, Z.; Litvan, I.; Fernandez, H.H.; Eidelberg, D.; Ritter, A.; et al. Unique white matter structural connectivity in early-stage drug-naive Parkinson disease. Neurology 2020, 94, e774–e784. [Google Scholar] [CrossRef]
- Sobhani, S.; Rahmani, F.; Aarabi, M.H.; Sadr, A.V. Exploring white matter microstructure and olfaction dysfunction in early parkinson disease: Diffusion MRI reveals new insight. Brain Imaging Behav. 2019, 13, 210–219. [Google Scholar] [CrossRef]
- Vaillancourt, D.E.; Spraker, M.B.; Prodoehl, J.; Abraham, I.; Corcos, D.M.; Zhou, X.J.; Comella, C.L.; Little, D.M. High-resolution diffusion tensor imaging in the substantia nigra of de novo Parkinson disease. Neurology 2009, 72, 1378–1384. [Google Scholar] [CrossRef] [PubMed] [Green Version]
- Pelizzari, L.; Laganà, M.M.; Di Tella, S.; Rossetto, F.; Bergsland, N.; Nemni, R.; Clerici, M.; Baglio, F. Combined Assessment of Diffusion Parameters and Cerebral Blood Flow Within Basal Ganglia in Early Parkinson’s Disease. Front. Aging Neurosci. 2019, 11, 134. [Google Scholar] [CrossRef] [PubMed] [Green Version]
- Mangia, S.; Svatkova, A.; Mascali, D.; Nissi, M.J.; Burton, P.C.; Bednarik, P.; Auerbach, E.J.; Giove, F.; Eberly, L.E.; Howell, M.J.; et al. Multi-modal Brain MRI in Subjects with PD and iRBD. Front. Neurosci. 2017, 11, 709. [Google Scholar] [CrossRef] [PubMed]
- Mole, J.P.; Subramanian, L.; Bracht, T.; Morris, H.; Metzler-Baddeley, C.; Linden, D.E. Increased fractional anisotropy in the motor tracts of Parkinson’s disease suggests compensatory neuroplasticity or selective neurodegeneration. Eur. Radiol. 2016, 26, 3327–3335. [Google Scholar] [CrossRef] [Green Version]
- Wen, M.C.; Heng, H.S.; Ng, S.Y.; Tan, L.C.; Chan, L.L.; Tan, E.K. White matter microstructural characteristics in newly diagnosed Parkinson’s disease: An unbiased whole-brain study. Sci. Rep. 2016, 6, 35601. [Google Scholar] [CrossRef] [Green Version]
- Bergamino, M.; Keeling, E.G.; Mishra, V.R.; Stokes, A.M.; Walsh, R.R. Assessing White Matter Pathology in Early-Stage Parkinson Disease Using Diffusion MRI: A Systematic Review. Front. Neurol. 2020, 11, 314. [Google Scholar] [CrossRef]
- Andersson, J.L.R.; Sotiropoulos, S.N. An integrated approach to correction for off-resonance effects and subject movement in diffusion MR imaging. Neuroimage 2016, 125, 1063–1078. [Google Scholar] [CrossRef] [Green Version]
- Tournier, J.D.; Smith, R.; Raffelt, D.; Tabbara, R.; Dhollander, T.; Pietsch, M.; Christiaens, D.; Jeurissen, B.; Yeh, C.H.; Connelly, A. MRtrix3: A fast, flexible and open software framework for medical image processing and visualisation. Neuroimage 2019, 202, 116137. [Google Scholar] [CrossRef]
- Desikan, R.S.; Ségonne, F.; Fischl, B.; Quinn, B.T.; Dickerson, B.C.; Blacker, D.; Buckner, R.L.; Dale, A.M.; Maguire, R.P.; Hyman, B.T.; et al. An automated labeling system for subdividing the human cerebral cortex on MRI scans into gyral based regions of interest. Neuroimage 2006, 31, 968–980. [Google Scholar] [CrossRef]
- Sveinbjornsdottir, S. The clinical symptoms of Parkinson’s disease. J. Neurochem. 2016, 139, 318–324. [Google Scholar] [CrossRef] [Green Version]
- Wei, X.; Yan, R.; Chen, Z.; Weng, R.; Liu, X.; Gao, H.; Xu, X.; Kang, Z.; Liu, Z.; Guo, Y.; et al. Combined Diffusion Tensor Imaging and Arterial Spin Labeling as Markers of Early Parkinson’s disease. Sci. Rep. 2016, 6, 33762. [Google Scholar] [CrossRef] [Green Version]
- Joshi, N.; Rolheiser, T.M.; Fisk, J.D.; McKelvey, J.R.; Schoffer, K.; Phillips, G.; Armstrong, M.; Khan, M.N.; Leslie, R.A.; Rusak, B.; et al. Lateralized microstructural changes in early-stage Parkinson’s disease in anterior olfactory structures, but not in substantia nigra. J. Neurol. 2017, 264, 1497–1505. [Google Scholar] [CrossRef] [PubMed]
- Galvan, A.; Devergnas, A.; Wichmann, T. Alterations in neuronal activity in basal ganglia-thalamocortical circuits in the parkinsonian state. Front. Neuroanat. 2015, 9, 5. [Google Scholar] [CrossRef] [PubMed] [Green Version]
- Skidmore, F.M.; Spetsieris, P.G.; Anthony, T.; Cutter, G.R.; von Deneen, K.M.; Liu, Y.; White, K.D.; Heilman, K.M.; Myers, J.; Standaert, D.G.; et al. A full-brain, bootstrapped analysis of diffusion tensor imaging robustly differentiates Parkinson disease from healthy controls. Neuroinformatics 2015, 13, 7–18. [Google Scholar] [CrossRef] [Green Version]
- Sanjari Moghaddam, H.; Dolatshahi, M.; Salardini, E.; Aarabi, M.H. Association of olfaction dysfunction with brain microstructure in prodromal Parkinson disease. Neurol. Sci. 2019, 40, 283–291. [Google Scholar] [CrossRef]
- Gregory, S.; Long, J.D.; Klöppel, S.; Razi, A.; Scheller, E.; Minkova, L.; Papoutsi, M.; Mills, J.A.; Durr, A.; Leavitt, B.R.; et al. Operationalizing compensation over time in neurodegenerative disease. Brain 2017, 140, 1158–1165. [Google Scholar] [CrossRef] [PubMed]
- Fullard, M.E.; Morley, J.F.; Duda, J.E. Olfactory Dysfunction as an Early Biomarker in Parkinson’s Disease. Neurosci. Bull. 2017, 33, 515–525. [Google Scholar] [CrossRef]
- Zald, D.H.; Pardo, J.V. Emotion, olfaction, and the human amygdala: Amygdala activation during aversive olfactory stimulation. Proc. Natl. Acad. Sci. USA 1997, 94, 4119–4124. [Google Scholar] [CrossRef] [Green Version]
- Kay, L.M.; Freeman, W.J. Bidirectional processing in the olfactory-limbic axis during olfactory behavior. Behav. Neurosci. 1998, 112, 541–553. [Google Scholar] [CrossRef]
- Ibarretxe-Bilbao, N.; Junque, C.; Marti, M.J.; Valldeoriola, F.; Vendrell, P.; Bargallo, N.; Zarei, M.; Tolosa, E. Olfactory impairment in Parkinson’s disease and white matter abnormalities in central olfactory areas: A voxel-based diffusion tensor imaging study. Mov. Disord. 2010, 25, 1888–1894. [Google Scholar] [CrossRef]
- Roy-Côté, F.; Zahal, R.; Frasnelli, J.; Nguyen, D.K.; Boucher, O. Insula and Olfaction: A Literature Review and Case Report. Brain Sci. 2021, 11, 198. [Google Scholar] [CrossRef] [PubMed]
- Arrigo, A.; Calamuneri, A.; Milardi, D.; Mormina, E.; Rania, L.; Postorino, E.; Marino, S.; Di Lorenzo, G.; Anastasi, G.P.; Ghilardi, M.F.; et al. Visual System Involvement in Patients with Newly Diagnosed Parkinson Disease. Radiology 2017, 285, 885–895. [Google Scholar] [CrossRef] [PubMed]
- Armstrong, R.A. Visual Dysfunction in Parkinson’s Disease. Int. Rev. Neurobiol. 2017, 134, 921–946. [Google Scholar] [PubMed]
- Guimarães, R.P.; Campos, B.M.; de Rezende, T.J.; Piovesana, L.; Azevedo, P.C.; Amato-Filho, A.C.; Cendes, F.; D’Abreu, A. Is Diffusion Tensor Imaging a Good Biomarker for Early Parkinson’s Disease? Front. Neurol. 2018, 9, 626. [Google Scholar] [CrossRef] [PubMed] [Green Version]
- Zhang, Y.; Wu, I.W.; Buckley, S.; Coffey, C.S.; Foster, E.; Mendick, S.; Seibyl, J.; Schuff, N. Diffusion tensor imaging of the nigrostriatal fibers in Parkinson’s disease. Mov. Disord. 2015, 30, 1229–1236. [Google Scholar] [CrossRef] [PubMed]
- Rolheiser, T.M.; Fulton, H.G.; Good, K.P.; Fisk, J.D.; McKelvey, J.R.; Scherfler, C.; Khan, N.M.; Leslie, R.A.; Robertson, H.A. Diffusion tensor imaging and olfactory identification testing in early-stage Parkinson’s disease. J. Neurol. 2011, 258, 1254–1260. [Google Scholar] [CrossRef] [PubMed]
- Bohnen, N.I.; Müller, M.L. In vivo neurochemical imaging of olfactory dysfunction in Parkinson’s disease. J. Neural. Transm. 2013, 120, 571–576. [Google Scholar] [CrossRef]
- Braak, H.; Del Tredici, K.; Rüb, U.; de Vos, R.A.; Jansen Steur, E.N.; Braak, E. Staging of brain pathology related to sporadic Parkinson’s disease. Neurobiol. Aging. 2003, 24, 197–211. [Google Scholar] [CrossRef]
- Ansari, M.; Rahmani, F.; Dolatshahi, M.; Pooyan, A.; Aarabi, M.H. Brain pathway differences between Parkinson’s disease patients with and without REM sleep behavior disorder. Sleep Breath. 2017, 21, 155–161. [Google Scholar] [CrossRef]
- Ashraf-Ganjouei, A.; Majd, A.; Javinani, A.; Aarabi, M.H. Autonomic dysfunction and white matter microstructural changes in drug-naïve patients with Parkinson’s disease. PeerJ 2018, 6, e5539. [Google Scholar] [CrossRef]
- Barrio-Arranz, G.; de Luis-Garcia, R.; Tristan-Vega, A.; Martin-Femandez, M.; Aja-Fernandez, S. Impact of MR Acquisition Parameters on DTI Scalar Indexes: A Tractography Based Approach. PLoS ONE 2015, 10, e0137905. [Google Scholar] [CrossRef] [PubMed]
- Wang, J.; Abdi, H.; Bakhadirov, K.; Diaz-Arrastia, R.; Devous, M. A comprehensive reliability assessment of quantitative diffusion tensor tractography. Neuroimage 2012, 60, 1127–1138. [Google Scholar] [CrossRef] [PubMed] [Green Version]


| Group | HC (n = 44) | PD (n = 44) | p-Value |
|---|---|---|---|
| Age (mean ± SD) | 60.4 ± 9.6 | 58.3 ± 9.3 | 0.316 |
| Sex (male/female) | 27/17 | 27/17 | - |
| Dominant side (left/right) | - | 23/21 | - |
| Education years (mean ± SD) | 16.2 ± 2.9 | 15.3 ± 3.1 | 0.186 |
| Age onset in years (mean ± SD) | - | 56.6 ± 9.7 | - |
| Duration of disease in months (mean ± SD) | - | 6.1 ± 6.4 | - |
| H & Y scale (mean ± SD) | 0.0 ± 0.0 | 1.5 ± 0.5 | <0.001 |
| MDS-UPDRS III score (mean ± SD) | 0.7 ± 1.1 | 19.7 ± 9.1 | <0.001 |
| UPSIT score (mean ± SD) | 33.3 ± 4.8 | 23.7 ± 6.9 | <0.001 |
| SCOPA-AUT score (mean ± SD) | 5.4 ± 2.7 | 8.7 ± 5.7 | <0.001 |
| RBDSQ score (mean ± SD) | 2.6 ± 2.0 | 3.6 ± 2.0 | 0.017 |
| GDS score (mean ± SD) | 1.2 ± 2.5 | 1.8 ± 1.7 | 0.154 |
| MoCA score (mean ± SD) | 28.4 ± 1.1 | 28.0 ± 1.7 | 0.188 |
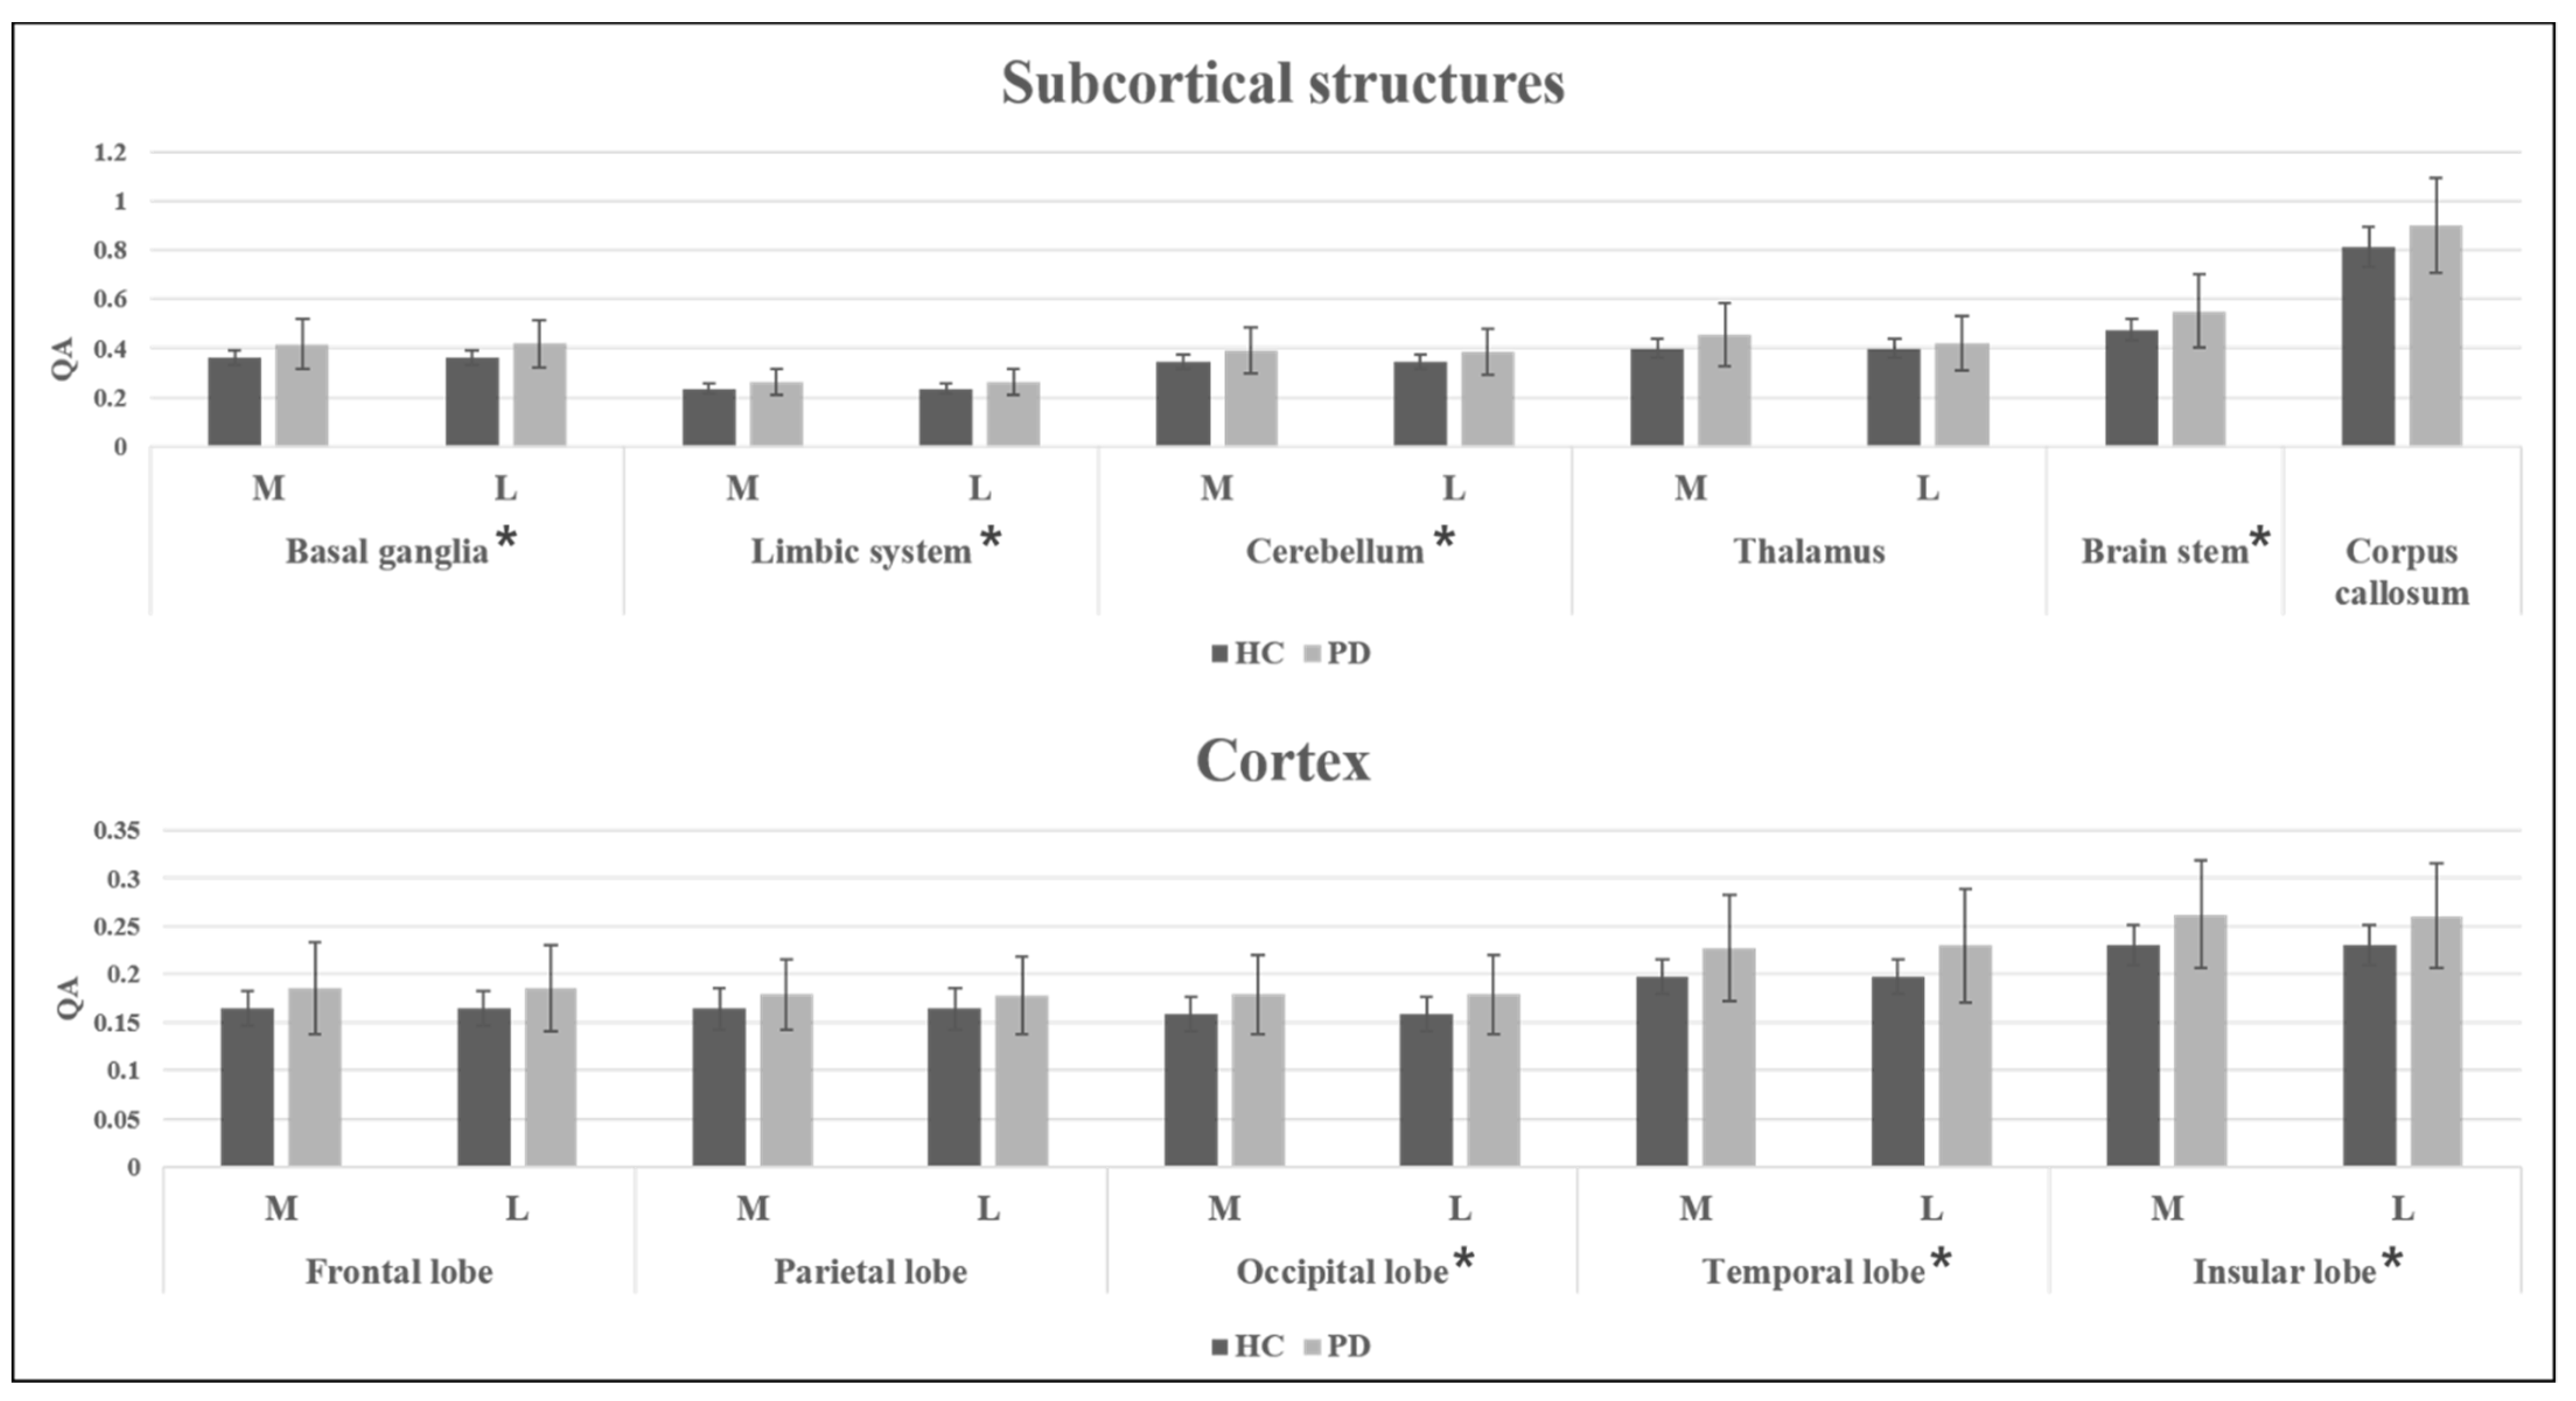
| Region | Subregion | HC QA (Mean ± SD) | PD QA (Mean ± SD) | p1 Value | p2 Value |
|---|---|---|---|---|---|
| Basal ganglia | 0.361 ± 0.031 | 0.417 ± 0.103 (M) | 0.001 | 0.002 | |
| 0.418 ± 0.095 (L) | <0.001 | <0.001 | |||
| Striatum | 0.329 ± 0.030 | 0.385 ± 0.086 (M) | <0.001 | <0.001 | |
| 0.383 ± 0.093 (L) | <0.001 | <0.001 | |||
| Limbic system | 0.234 ± 0.020 | 0.263 ± 0.054 (M) | 0.002 | 0.002 | |
| 0.263 ± 0.053 (L) | 0.001 | 0.002 | |||
| Cingulate gyrus | 0.209 ± 0.018 | 0.228 ± 0.043 (M) | 0.008 | 0.004 | |
| 0.229 ± 0.047 (L) | 0.011 | 0.005 | |||
| Cerebellum | 0.343 ± 0.029 | 0.389 ± 0.094 (M) | 0.003 | 0.003 | |
| 0.386 ± 0.092 (L) | 0.002 | 0.003 | |||
| Thalamus | 0.398 ± 0.038 | 0.454 ± 0.130 (M) | 0.008 | 0.004 | |
| 0.422 ± 0.111 (L) | 0.003 | 0.003 | |||
| Brain stem | 0.474 ± 0.044 | 0.551 ± 0.149 | 0.002 | 0.003 | |
| Corpus callosum | 0.811 ± 0.081 | 0.901 ± 0.193 | 0.006 | 0.004 |
| Region | HC QA (Mean ± SD) | PD QA (Mean ± SD) | p1 Value | p2 Value |
|---|---|---|---|---|
| Frontal lobe | 0.164 ± 0.018 | 0.186 ± 0.048 (M) | 0.007 | 0.004 |
| 0.186 ± 0.045 (L) | 0.004 | 0.004 | ||
| Parietal lobe | 0.164 ± 0.022 | 0.179 ± 0.037 (M) | 0.030 | 0.005 |
| 0.178 ± 0.040 (L) | 0.043 | 0.005 | ||
| Occipital lobe | 0.158 ± 0.018 | 0.179 ± 0.041 (M) | 0.002 | 0.003 |
| 0.179 ± 0.041 (L) | 0.003 | 0.003 | ||
| Temporal lobe | 0.197 ± 0.018 | 0.227 ± 0.055 (M) | 0.001 | 0.001 |
| 0.230 ± 0.059 (L) | <0.001 | <0.001 | ||
| Insular lobe | 0.231 ± 0.021 | 0.262 ± 0.056 (M) | <0.001 | 0.001 |
| 0.261 ± 0.055 (L) | 0.002 | 0.002 |
Publisher’s Note: MDPI stays neutral with regard to jurisdictional claims in published maps and institutional affiliations. |
© 2022 by the authors. Licensee MDPI, Basel, Switzerland. This article is an open access article distributed under the terms and conditions of the Creative Commons Attribution (CC BY) license (https://creativecommons.org/licenses/by/4.0/).
Share and Cite
Kim, J.-Y.; Shim, J.-H.; Baek, H.-M. White Matter Microstructural Alterations in Newly Diagnosed Parkinson’s Disease: A Whole-Brain Analysis Using dMRI. Brain Sci. 2022, 12, 227. https://doi.org/10.3390/brainsci12020227
Kim J-Y, Shim J-H, Baek H-M. White Matter Microstructural Alterations in Newly Diagnosed Parkinson’s Disease: A Whole-Brain Analysis Using dMRI. Brain Sciences. 2022; 12(2):227. https://doi.org/10.3390/brainsci12020227
Chicago/Turabian StyleKim, Jun-Yeop, Jae-Hyuk Shim, and Hyeon-Man Baek. 2022. "White Matter Microstructural Alterations in Newly Diagnosed Parkinson’s Disease: A Whole-Brain Analysis Using dMRI" Brain Sciences 12, no. 2: 227. https://doi.org/10.3390/brainsci12020227
APA StyleKim, J.-Y., Shim, J.-H., & Baek, H.-M. (2022). White Matter Microstructural Alterations in Newly Diagnosed Parkinson’s Disease: A Whole-Brain Analysis Using dMRI. Brain Sciences, 12(2), 227. https://doi.org/10.3390/brainsci12020227