
Sensorimotor Activity and Network Connectivity to Dynamic and Static Emotional Faces in 7-Month-Old Infants

 , ,
, , 
Abstract
:1. Introduction
2. Materials and Methods
2.1. Participants
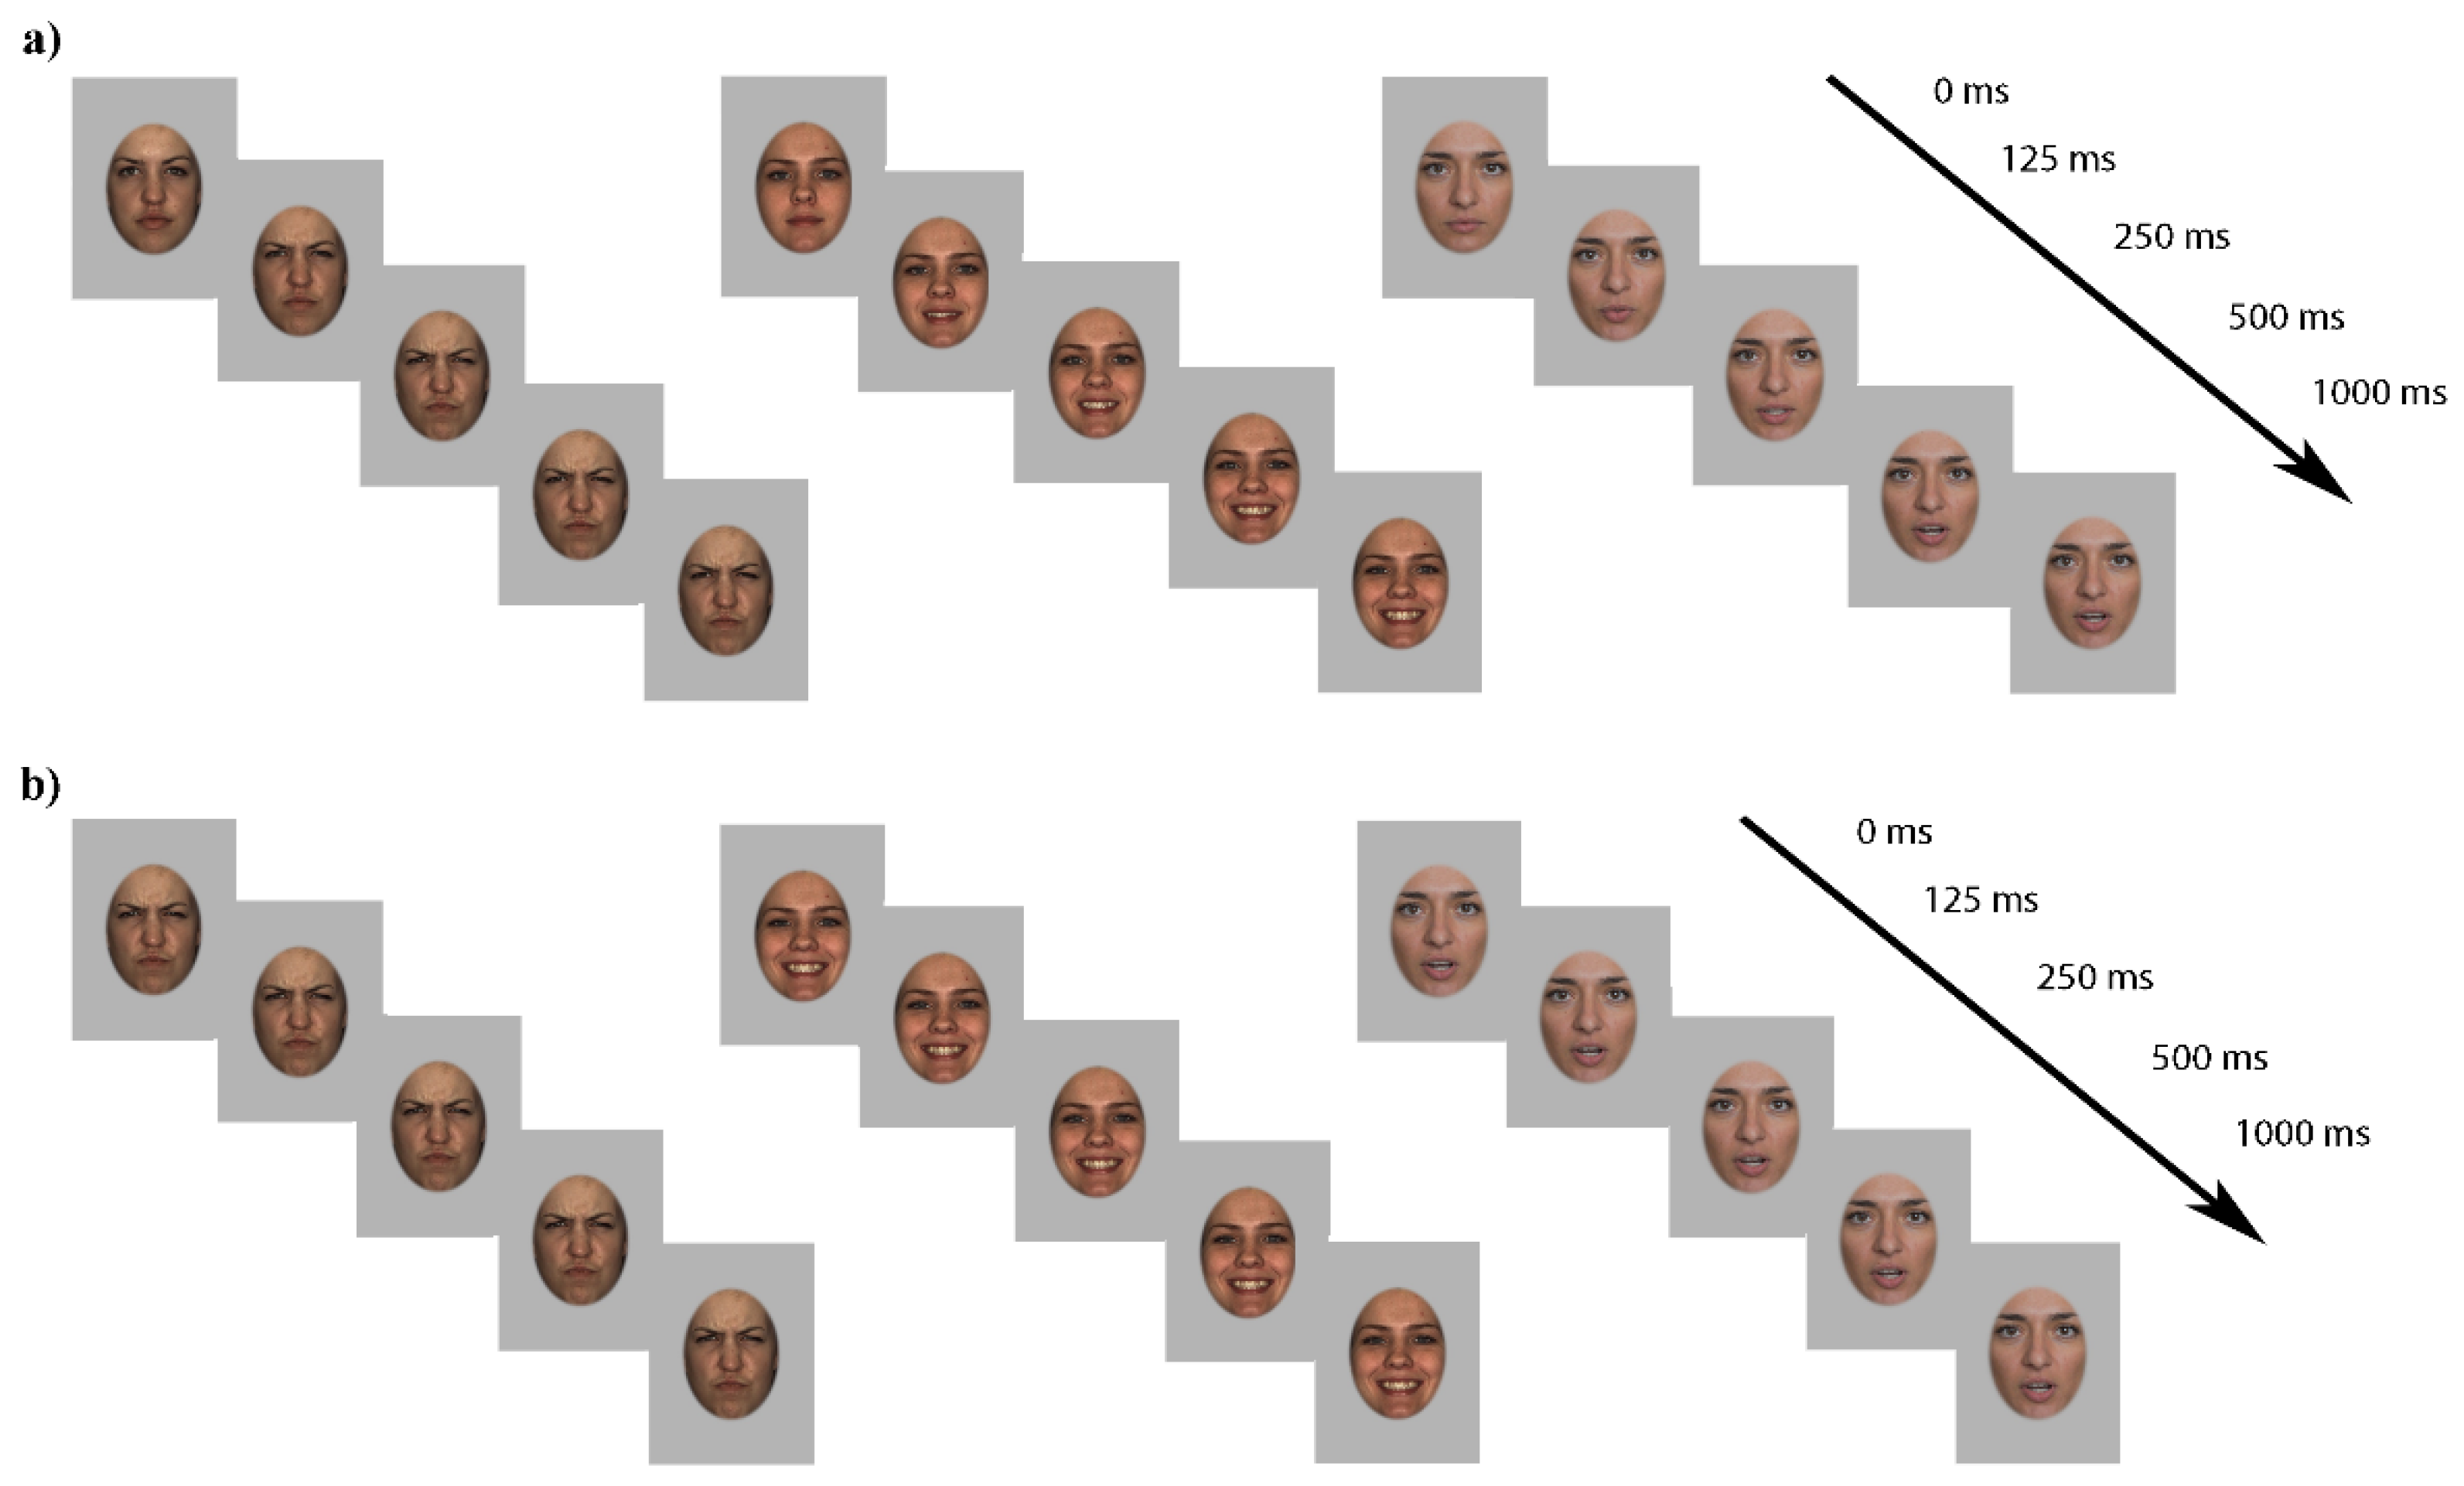
2.2. Stimuli
2.3. Procedure
2.4. EEG Recording and Processing
2.5. Time–Frequency Analysis
2.6. Network Analysis
3. Results
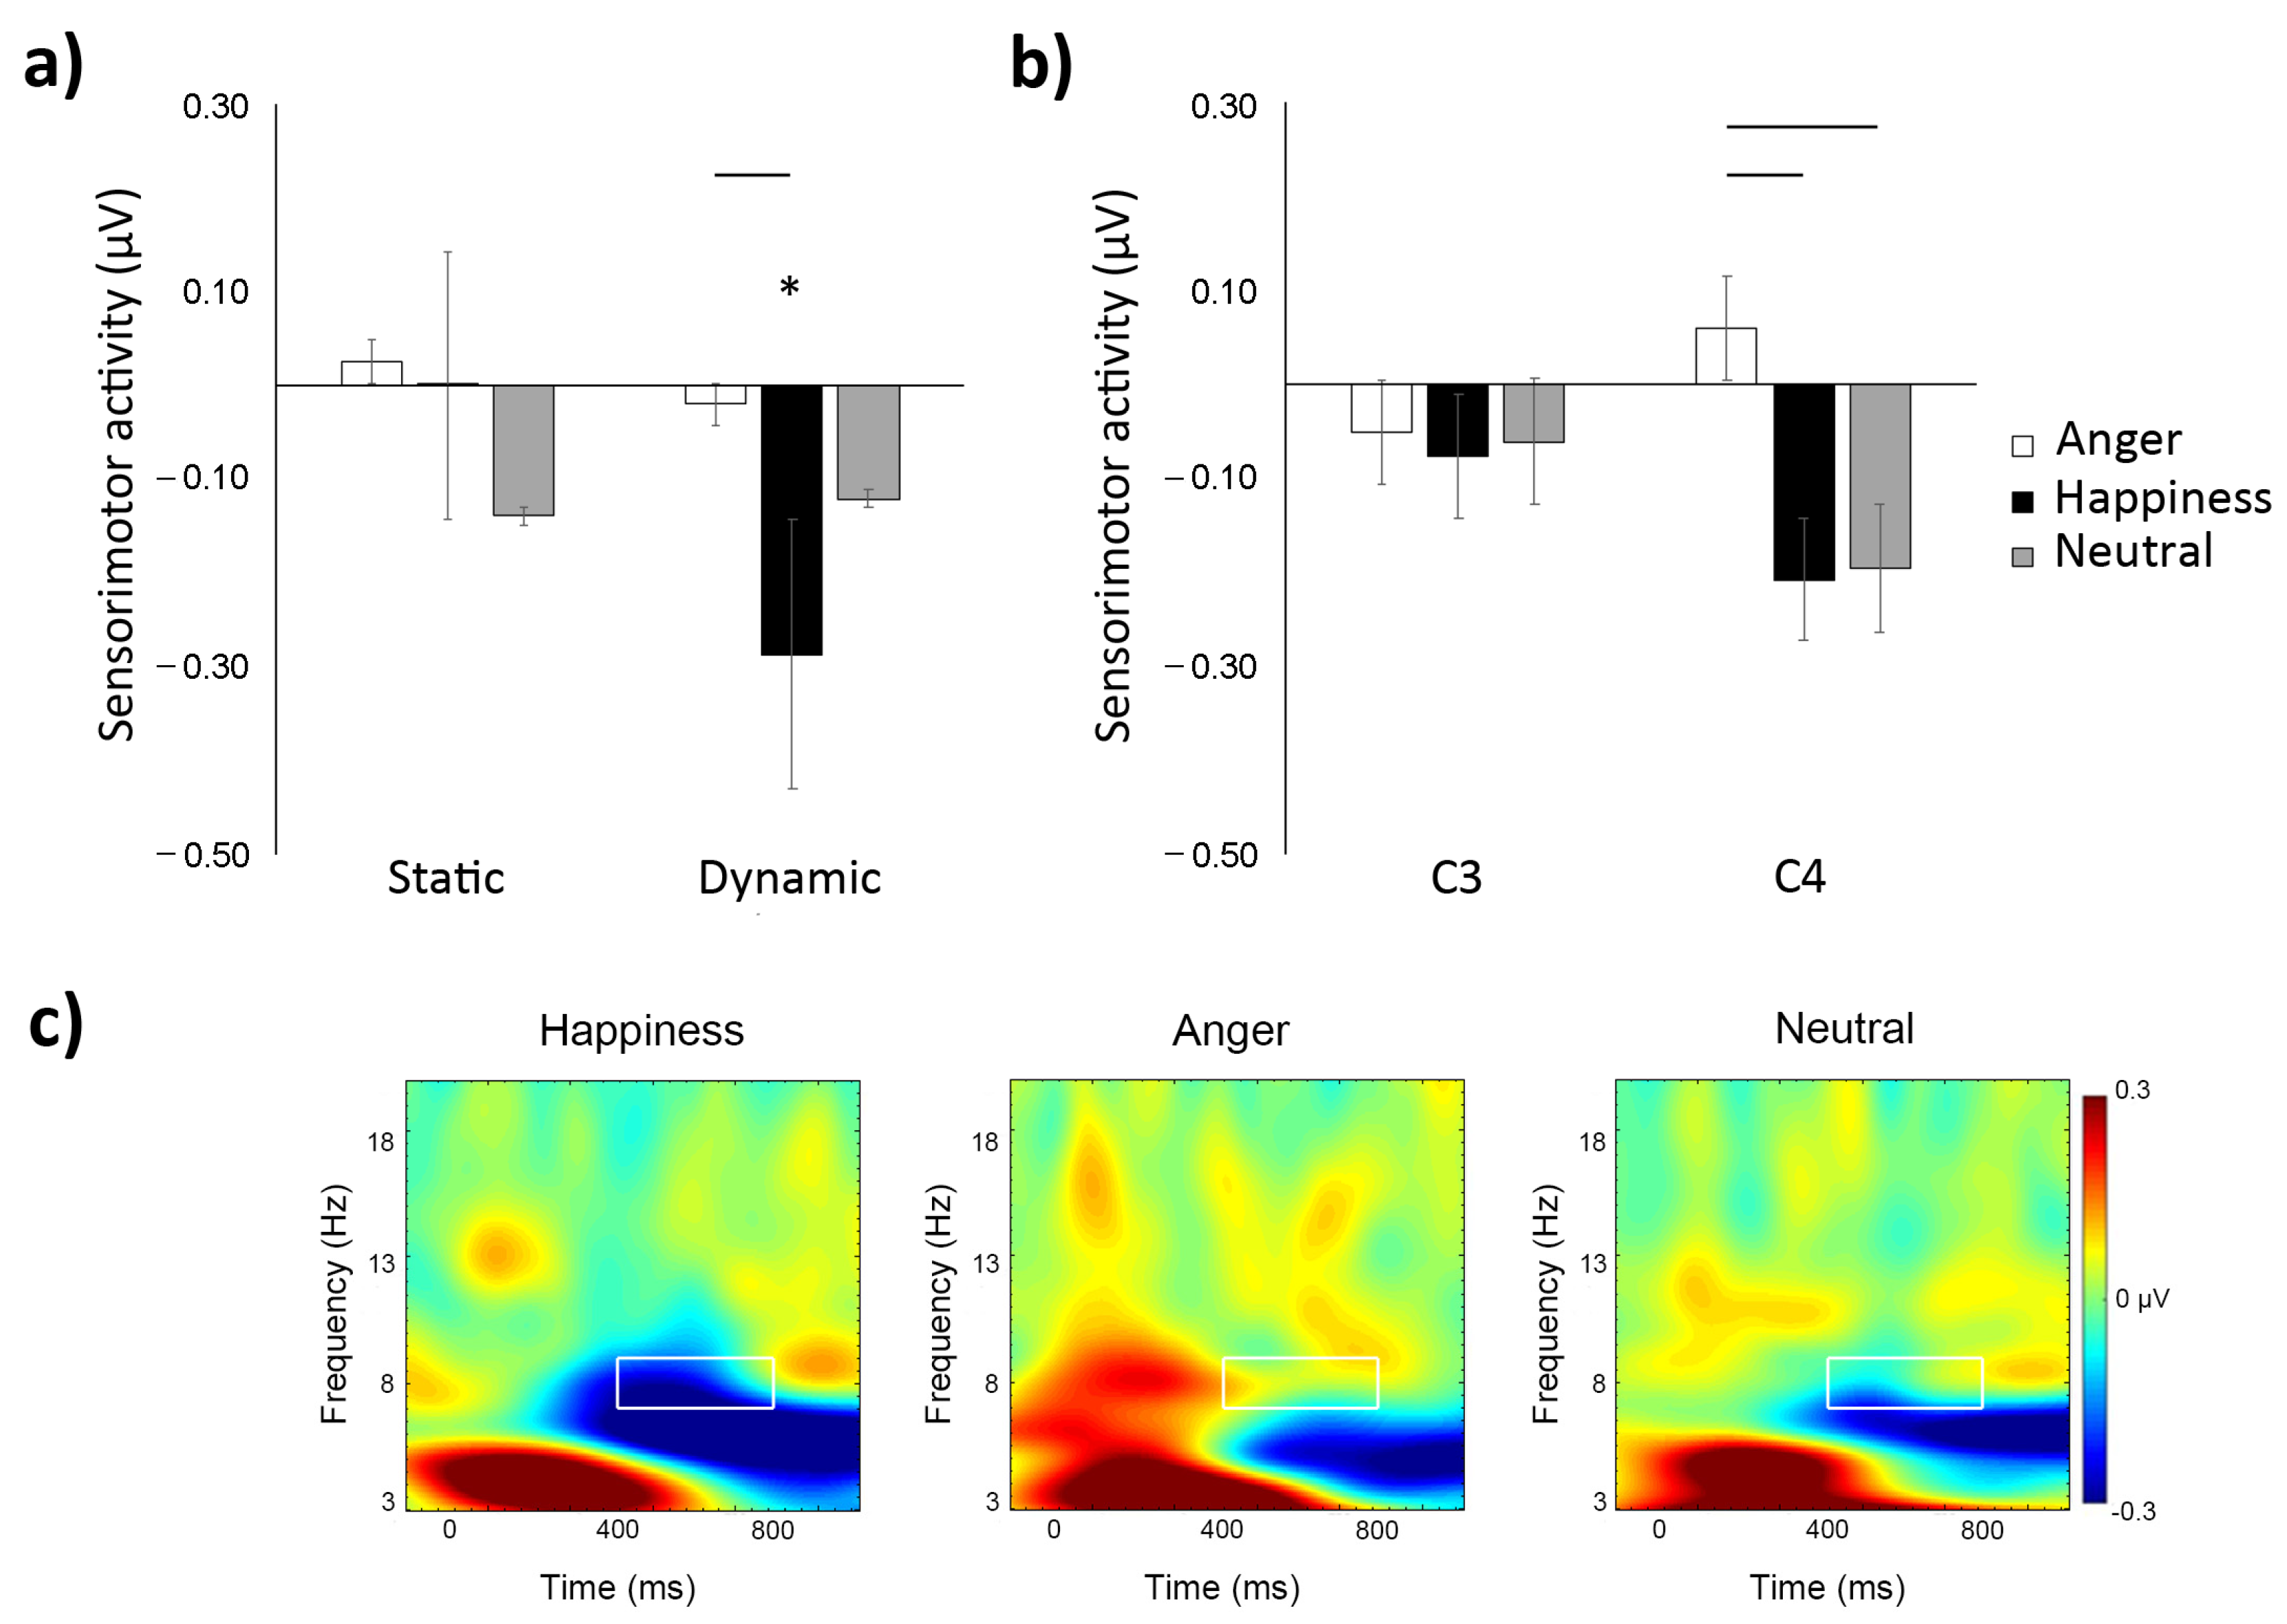
3.1. Time–Frequency
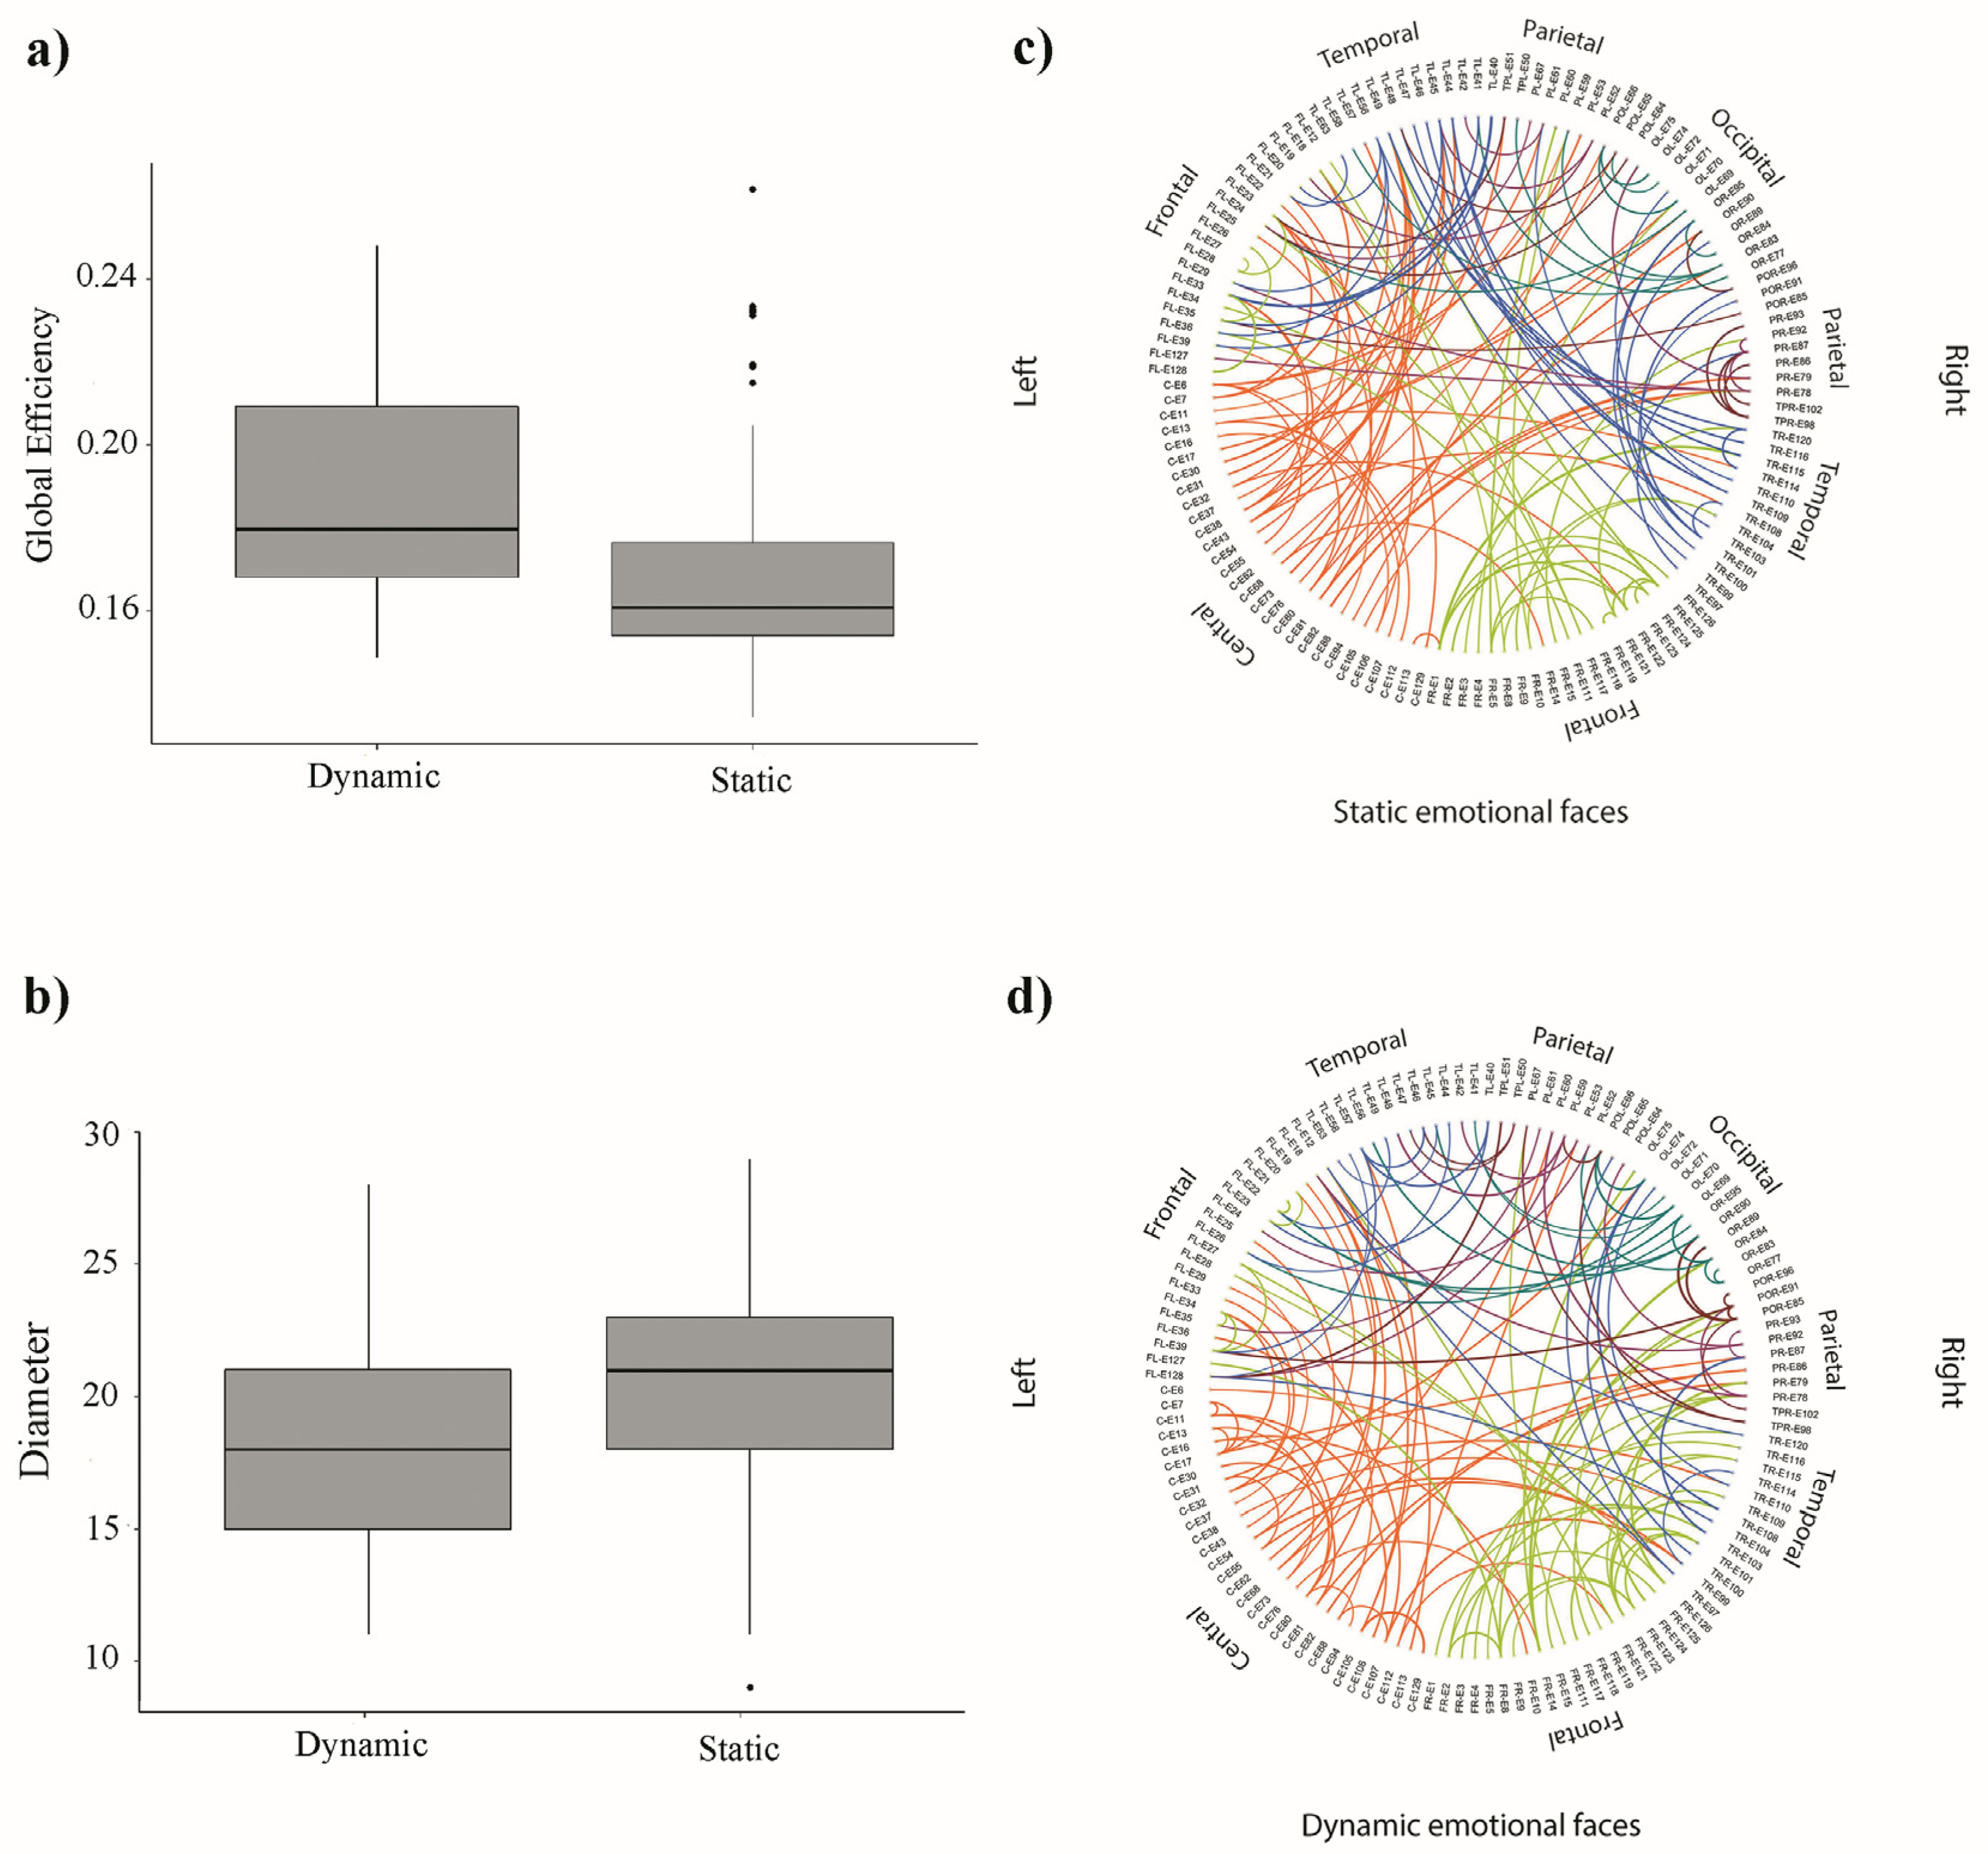
3.2. Network Analysis
4. Discussion
5. Conclusions
Author Contributions
Funding
Institutional Review Board Statement
Informed Consent Statement
Data Availability Statement
Acknowledgments
Conflicts of Interest
References
- Adolphs, R. Recognizing emotion from facial expressions: Psychological and neurological mechanisms. Behav. Cogn. Neurosci. Rev. 2002, 1, 21–62. [Google Scholar] [CrossRef] [PubMed] [Green Version]
- Leppänen, J.M.; Nelson, C.A. Tuning the developing brain to social signals of emotions. Nat. Rev. Neurosci. 2008, 10, 37–47. [Google Scholar] [CrossRef] [PubMed] [Green Version]
- Leppänen, J.M. Neural and developmental bases of the ability to recognize social signals of emotions. Emot. Rev. 2011, 3, 179–188. [Google Scholar] [CrossRef]
- Carr, L.; Iacoboni, M.; Dubeau, M.-C.; Mazziotta, J.C.; Lenzi, G.L. Neural mechanisms of empathy in humans: A relay from neural systems for imitation to limbic areas. Proc. Natl. Acad. Sci. USA 2003, 100, 5497–5502. [Google Scholar] [CrossRef] [Green Version]
- Leslie, K.R.; Johnson-Frey, S.H.; Grafton, S.T. Functional imaging of face and hand imitation: Towards a motor theory of empathy. NeuroImage 2004, 21, 601–607. [Google Scholar] [CrossRef]
- Crespo-Llado, M.M.; Vanderwert, R.; Roberti, E.; Geangu, E. Eight-month-old infants’ behavioral responses to peers’ emotions as related to the asymmetric frontal cortex activity. Sci. Rep. 2018, 8, 17152. [Google Scholar] [CrossRef] [PubMed]
- Jessen, S.; Grossmann, T. Neural signatures of conscious and unconscious emotional face processing in human infants. Cortex 2015, 64, 260–270. [Google Scholar] [CrossRef]
- Haxby, J.V.; Hoffman, E.A.; Gobbini, M. The distributed human neural system for face perception. Trends Cogn. Sci. 2000, 4, 223–233. [Google Scholar] [CrossRef]
- Eimer, M.; Holmes, A. Event-related brain potential correlates of emotional face processing. Neuropsychologia 2007, 45, 15–31. [Google Scholar] [CrossRef] [Green Version]
- Dapretto, M.; Davies, M.S.; Pfeifer, J.H.; Scott, A.A.; Sigman, M.; Bookheimer, S.; Iacoboni, M. Understanding emotions in others: Mirror neuron dysfunction in children with autism spectrum disorders. Nat. Neurosci. 2005, 9, 28–30. [Google Scholar] [CrossRef] [Green Version]
- Van Der Gaag, C.; Minderaa, R.B.; Keysers, C. Facial expressions: What the mirror neuron system can and cannot tell us. Soc. Neurosci. 2007, 2, 179–222. [Google Scholar] [CrossRef] [PubMed]
- di Pellegrino, G.; Fadiga, L.; Fogassi, L.; Gallese, V.; Rizzolatti, G. Understanding motor events: A neurophysiological study. Exp. Brain Res. 1992, 91, 176–180. [Google Scholar] [CrossRef]
- Fadiga, L.; Craighero, L. Electrophysiology of action representation. J. Clin. Neurophysiol. 2004, 21, 157–169. [Google Scholar] [CrossRef] [PubMed]
- Rizzolatti, G.; Fadiga, L.; Gallese, V.; Fogassi, L. Premotor cortex and the recognition of motor actions. Cogn. Brain Res. 1996, 3, 131–141. [Google Scholar] [CrossRef]
- Enticott, P.G.; Johnston, P.J.; Herring, S.; Hoy, K.; Fitzgerald, P.B. Mirror neuron activation is associated with facial emotion processing. Neuropsychologia 2008, 46, 2851–2854. [Google Scholar] [CrossRef] [PubMed]
- Gallese, V. The roots of empathy: The shared manifold hypothesis and the neural basis of intersubjectivity. Psychopathology 2003, 36, 171–180. [Google Scholar] [CrossRef]
- Kaplan, J.T.; Iacoboni, M. Getting a grip on other minds: Mirror neurons, intention understanding, and cognitive empathy. Soc. Neurosci. 2006, 1, 175–183. [Google Scholar] [CrossRef]
- Bastiaansen, J.; Thioux, M.; Keysers, C. Evidence for mirror systems in emotions. Philos. Trans. R. Soc. B Biol. Sci. 2009, 364, 2391–2404. [Google Scholar] [CrossRef] [Green Version]
- Pohl, A.; Anders, S.; Schulte-Rüther, M.; Mathiak, K.; Kircher, T. Positive facial affect—An fMRI study on the involvement of insula and amygdala. PLoS ONE 2013, 8, e69886. [Google Scholar] [CrossRef]
- Peltola, M.J.; Leppänen, J.M.; Mäki, S.; Hietanen, J.K. Emergence of enhanced attention to fearful faces between 5 and 7 months of age. Soc. Cogn. Affect. Neurosci. 2009, 4, 134–142. [Google Scholar] [CrossRef] [Green Version]
- Quadrelli, E.; Conte, S.; Cassia, V.M.; Turati, C. Emotion in motion: Facial dynamics affect infants’ neural processing of emotions. Dev. Psychobiol. 2019, 61, 843–858. [Google Scholar] [CrossRef] [PubMed]
- Taylor-Colls, S.; Pasco Fearon, R.M. The effects of parental behavior on infants’ neural processing of emotion expressions. Child. Dev. 2015, 86, 877–888. [Google Scholar] [CrossRef] [Green Version]
- Grossmann, T.; Striano, T.; Friederici, A.D. Developmental changes in infants’ processing of happy and angry facial expressions: A neurobehavioral study. Brain Cogn. 2007, 64, 30–41. [Google Scholar] [CrossRef]
- Addabbo, M.; Longhi, E.; Marchis, I.C.; Tagliabue, P.; Turati, C. Dynamic facial expressions of emotions are discriminated at birth. PLoS ONE 2018, 13, e0193868. [Google Scholar] [CrossRef] [Green Version]
- Missana, M.; Grigutsch, M.; Grossmann, T. Developmental and individual differences in the neural processing of dynamic expressions of pain and anger. PLoS ONE 2014, 9, e93728. [Google Scholar] [CrossRef] [PubMed]
- Rotem-Kohavi, N.; Oberlander, T.; Virji-Babul, N. Infants and adults have similar regional functional brain organization for the perception of emotions. Neurosci. Lett. 2017, 650, 118–125. [Google Scholar] [CrossRef]
- Fransson, P.; Åden, U.; Blennow, M.; Lagercrantz, H. The functional architecture of the infant brain as revealed by resting-state fMRI. Cereb. Cortex 2011, 21, 145–154. [Google Scholar] [CrossRef] [PubMed] [Green Version]
- Datyner, A.; Henry, J.D.; Richmond, J.L. Rapid facial reactions in response to happy and angry expressions in 7-month-old infants. Dev. Psychobiol. 2017, 59, 1046–1050. [Google Scholar] [CrossRef]
- De Klerk, C.C.; Bulgarelli, C.; Hamilton, A.; Southgate, V. Selective facial mimicry of native over foreign speakers in preverbal infants. J. Exp. Child. Psychol. 2019, 183, 33–47. [Google Scholar] [CrossRef] [PubMed]
- Hashiya, K.; Meng, X.; Uto, Y.; Tajiri, K. Overt congruent facial reaction to dynamic emotional expressions in 9–10-month-old infants. Infant Behav. Dev. 2018, 54, 48–56. [Google Scholar] [CrossRef] [PubMed]
- Geangu, E.; Quadrelli, E.; Conte, S.; Croci, E.; Turati, C. Three-year-olds’ rapid facial electromyographic responses to emotional facial expressions and body postures. J. Exp. Child. Psychol. 2016, 144, 1–14. [Google Scholar] [CrossRef] [Green Version]
- Kaiser, J.; Crespo-Llado, M.M.; Turati, C.; Geangu, E. The development of spontaneous facial responses to others’ emotions in infancy: An EMG study. Sci. Rep. 2017, 7, 1–10. [Google Scholar] [CrossRef]
- Marshall, P.J.; Bar-Haim, Y.; Fox, A.N. Development of the EEG from 5 months to 4 years of age. Clin. Neurophysiol. 2002, 113, 1199–1208. [Google Scholar] [CrossRef]
- De Klerk, C.C.; Johnson, M.; Heyes, C.M.; Southgate, V. Baby steps: Investigating the development of perceptual-motor couplings in infancy. Dev. Sci. 2014, 18, 270–280. [Google Scholar] [CrossRef] [PubMed] [Green Version]
- Fox, N.A.; Bakermans-Kranenburg, M.J.; Yoo, K.H.; Bowman, L.C.; Cannon, E.N.; Vanderwert, R.E.; Ferrari, P.F.; van Ijzendoorn, M. Assessing human mirror activity with EEG mu rhythm: A meta-analysis. Psychol. Bull. 2016, 142, 291–313. [Google Scholar] [CrossRef] [PubMed]
- Quadrelli, E.; Geangu, E.; Turati, C. Human action sounds elicit sensorimotor activation early in life. Cortex 2019, 117, 323–335. [Google Scholar] [CrossRef]
- Rayson, H.; Bonaiuto, J.J.; Ferrari, P.F.; Murray, L. Mu desynchronization during observation and execution of facial expressions in 30-month-old children. Dev. Cogn. Neurosci. 2016, 19, 279–287. [Google Scholar] [CrossRef] [Green Version]
- Rayson, H.; Bonaiuto, J.; Ferrari, P.F.; Murray, L. Early maternal mirroring predicts infant motor system activation during facial expression observation. Sci. Rep. 2017, 7, 1–11. [Google Scholar] [CrossRef]
- Izard, C.E. Basic emotions, natural kinds, emotion schemas, and a new paradigm. Perspect. Psychol. Sci. 2007, 2, 260–280. [Google Scholar] [CrossRef] [PubMed]
- Bullmore, E.; Barnes, A.; Bassett, D.S.; Fornito, A.; Kitzbichler, M.; Meunier, D.; Suckling, J. Generic aspects of complexity in brain imaging data and other biological systems. NeuroImage 2009, 47, 1125–1134. [Google Scholar] [CrossRef]
- Smit, D.J.; de Geus, E.J.; Boersma, M.; Boomsma, D.I.; Stam, C.J. Life-span development of brain network integration assessed with phase lag index connectivity and minimum spanning tree graphs. Brain Connect. 2016, 6, 312–325. [Google Scholar] [CrossRef] [Green Version]
- Boersma, M.; Smit, D.J.; Boomsma, D.I.; de Geus, E.; De Waal, H.A.D.-V.; Stam, C.J. Growing trees in child brains: Graph theoretical analysis of electroencephalography-derived minimum spanning tree in 5- and 7-year-old children reflects brain maturation. Brain Connect. 2013, 3, 50–60. [Google Scholar] [CrossRef]
- Stam, C.; Tewarie, P.; van Dellen, E.; van Straaten, E.; Hillebrand, A.; Van Mieghem, P. The trees and the forest: Characterization of complex brain networks with minimum spanning trees. Int. J. Psychophysiol. 2014, 92, 129–138. [Google Scholar] [CrossRef] [Green Version]
- Tewarie, P.; van Dellen, E.; Hillebrand, A.; Stam, C. The minimum spanning tree: An unbiased method for brain network analysis. NeuroImage 2015, 104, 177–188. [Google Scholar] [CrossRef]
- Rubinov, M.; Sporns, O. Complex network measures of brain connectivity: Uses and interpretations. NeuroImage 2010, 52, 1059–1069. [Google Scholar] [CrossRef] [PubMed]
- Tóth, B.; Urbán, G.; Háden, G.P.; Márk, M.; Török, M.; Stam, C.J.; Winkler, I. Large-scale network organization of EEG functional connectivity in newborn infants. Hum. Brain Mapp. 2017, 38, 4019–4033. [Google Scholar] [CrossRef] [Green Version]
- Gerson, S.A.; Bekkering, H.; Hunnius, S. Short-term motor training, but not observational training, alters neurocognitive mechanisms of action processing in infancy. J. Cogn. Neurosci. 2015, 27, 1207–1214. [Google Scholar] [CrossRef] [PubMed] [Green Version]
- Paulus, M.; Hunnius, S.; van Elk, M.; Bekkering, H. How learning to shake a rattle affects 8-month-old infants’ perception of the rattle’s sound: Electrophysiological evidence for action-effect binding in infancy. Dev. Cogn. Neurosci. 2012, 2, 90–96. [Google Scholar] [CrossRef] [PubMed] [Green Version]
- Yin, L.; Chen, X.; Sun, Y.; Worm, T.; Reale, M. A high-resolution 3D dynamic facial expression database. In Proceedings of the 8th International Conference on Automatic Face and Gesture Recognition, Amsterdam, The Netherlands, 17–19 September 2008. [Google Scholar]
- Leitzke, B.T.; Pollak, S.D. Developmental changes in the primacy of facial cues for emotion recognition. Dev. Psychol. 2016, 52, 572–581. [Google Scholar] [CrossRef]
- Richoz, A.-R.; Lao, J.; Pascalis, O.; Caldara, R. Tracking the recognition of static and dynamic facial expressions of emotion across the life span. J. Vis. 2018, 18, 5. [Google Scholar] [CrossRef] [Green Version]
- Mondloch, C.J.; Geldart, S.; Maurer, D.; Le Grand, R. Developmental changes in face processing skills. J. Exp. Child. Psychol. 2003, 86, 67–84. [Google Scholar] [CrossRef]
- Grossmann, T.; Jessen, S. When in infancy does the “fear bias” develop? J. Exp. Child. Psychol. 2017, 153, 149–154. [Google Scholar] [CrossRef]
- Pichon, S.; de Gelder, B.; Grèzes, J. Two different faces of threat. Comparing the neural systems for recognizing fear and anger in dynamic body expressions. NeuroImage 2009, 47, 1873–1883. [Google Scholar] [CrossRef] [PubMed] [Green Version]
- Cannon, E.N.; Yoo, K.H.; Vanderwert, R.; Ferrari, P.F.; Woodward, A.; Fox, N.A. Action experience, more than observation, influences mu rhythm desynchronization. PLoS ONE 2014, 9, e92002. [Google Scholar] [CrossRef]
- Parise, E.; Csibra, G. Neural responses to multimodal ostensive signals in 5-month-old infants. PLoS ONE 2013, 8, e72360. [Google Scholar] [CrossRef] [PubMed] [Green Version]
- Pomiechowska, B.; Csibra, G. Motor activation during action perception depends on action interpretation. Neuropsychologia 2017, 105, 84–91. [Google Scholar] [CrossRef] [Green Version]
- Csibra, G.; Davis, G.; Spratling, M.W.; Johnson, M.H. Gamma oscillations and object processing in the infant brain. Science 2000, 290, 1582–1585. [Google Scholar] [CrossRef] [PubMed] [Green Version]
- Marshall, P.J.; Meltzoff, A. Neural mirroring systems: Exploring the EEG mu rhythm in human infancy. Dev. Cogn. Neurosci. 2011, 1, 110–123. [Google Scholar] [CrossRef] [Green Version]
- Cuevas, K.; Cannon, E.N.; Yoo, K.; Fox, N.A. The infant EEG mu rhythm: Methodological considerations and best practices. Dev. Rev. 2014, 34, 26–43. [Google Scholar] [CrossRef]
- Gudgeon, A.C.; Howell, D.C. Statistical methods for psychology. J. R. Stat. Soc. Ser. D. Stat. 1994, 43, 211. [Google Scholar] [CrossRef]
- Abdi, H. Holm’s sequential Bonferroni procedure. Encycl. Res. Des. 2010, 1, 1–8. [Google Scholar]
- Oostenveld, R.; Fries, P.; Maris, E.; Schoffelen, J.-M. FieldTrip: Open source software for advanced analysis of MEG, EEG, and invasive electrophysiological data. Comput. Intell. Neurosci. 2010, 2011, 1–9. [Google Scholar] [CrossRef] [PubMed]
- Vinck, M.; Oostenveld, R.; van Wingerden, M.; Battaglia, F.; Pennartz, C.M.A. An improved index of phase-synchronization for electrophysiological data in the presence of volume-conduction, noise and sample-size bias. NeuroImage 2011, 55, 1548–1565. [Google Scholar] [CrossRef] [PubMed]
- Tillem, S.; Van Dongen, J.; Brazil, I.; Baskin-Sommers, A. Psychopathic traits are differentially associated with efficiency of neural communication. Psychophysiology 2018, 55, e13194. [Google Scholar] [CrossRef] [PubMed]
- Kruskal, J.B. On the shortest spanning subtree of a graph and the traveling salesman problem. Proc. Am. Math. Soc. 1956, 7, 48–50. [Google Scholar] [CrossRef]
- Fornito, A.; Zalesky, A.; Bullmore, E. Fundamentals of Brain Network Analysis; Academic Press: Cambridge, MA, USA, 2016. [Google Scholar]
- Latora, V.; Marchiori, M. Efficient behavior of small-world networks. Phys. Rev. Lett. 2001, 87, 198701. [Google Scholar] [CrossRef] [Green Version]
- Filippi, C.A.; Cannon, E.N.; Fox, N.A.; Thorpe, S.; Ferrari, P.F.; Woodward, A. Motor system activation predicts goal imitation in 7-month-old infants. Psychol. Sci. 2016, 27, 675–684. [Google Scholar] [CrossRef]
- Southgate, V.; Vernetti, A. Belief-based action prediction in preverbal infants. Cognition 2014, 130, 1–10. [Google Scholar] [CrossRef] [Green Version]
- Upshaw, M.B.; Bernier, R.A.; Sommerville, J.A. Infants’ grip strength predicts mu rhythm attenuation during observation of lifting actions with weighted blocks. Dev. Sci. 2016, 19, 195–207. [Google Scholar] [CrossRef] [Green Version]
- Benjamini, Y.; Hochberg, Y. Controlling the false discovery rate: A practical and powerful approach to multiple testing. J. R. Stat. Soc. Ser. B 1995, 57, 289–300. [Google Scholar] [CrossRef]
- Ambadar, Z.; Schooler, J.W.; Cohn, J.F. Deciphering the enigmatic face: The importance of facial dynamics in interpreting subtle facial expressions. Psychol. Sci. 2005, 16, 403–410. [Google Scholar] [CrossRef] [PubMed]
- Krumhuber, E.; Kappas, A.; Manstead, A. Effects of dynamic aspects of facial expressions: A review. Emot. Rev. 2013, 5, 41–46. [Google Scholar] [CrossRef]
- Rymarczyk, K.; Biele, C.; Grabowska, A.; Majczyński, H. EMG activity in response to static and dynamic facial expressions. Int. J. Psychophysiol. 2011, 79, 330–333. [Google Scholar] [CrossRef] [PubMed]
- Weyers, P.; Muhlberger, A.; Hefele, C.; Pauli, P. Electromyographic responses to static and dynamic avatar emotional facial expressions. Psychophysiology 2006, 43, 450–453. [Google Scholar] [CrossRef]
- Heck, A.; Hock, A.; White, H.; Jubran, R.; Bhatt, R.S. The development of attention to dynamic facial emotions. J. Exp. Child. Psychol. 2016, 147, 100–110. [Google Scholar] [CrossRef] [Green Version]
- Heck, A.; Hock, A.; White, H.; Jubran, R.; Bhatt, R.S. Further evidence of early development of attention to dynamic facial emotions: Reply to Grossmann and Jessen. J. Exp. Child. Psychol. 2017, 153, 155–162. [Google Scholar] [CrossRef] [PubMed] [Green Version]
- Farroni, T.; Menon, E.; Rigato, S.; Johnson, M.H. The perception of facial expressions in newborns. Eur. J. Dev. Psychol. 2007, 4, 2–13. [Google Scholar] [CrossRef] [PubMed] [Green Version]
- Hoehl, S. Emotion processing in infancy. In The Impact of Immigration on Children’s Development; S. Karger: Berlin, Germany, 2013; Volume 26, pp. 1–12. [Google Scholar]
- Vaish, A.; Grossmann, T.; Woodward, A. Not all emotions are created equal: The negativity bias in social-emotional development. Psychol. Bull. 2008, 134, 383–403. [Google Scholar] [CrossRef] [Green Version]
- Moore, A.; Gorodnitsky, I.; Pineda, J. EEG mu component responses to viewing emotional faces. Behav. Brain Res. 2012, 226, 309–316. [Google Scholar] [CrossRef] [PubMed]
- Calvo, M.G.; Beltrán, D. Brain lateralization of holistic versus analytic processing of emotional facial expressions. NeuroImage 2014, 92, 237–247. [Google Scholar] [CrossRef]
- Quadrelli, E.; Turati, C. Origins and development of mirroring mechanisms: A neuroconstructivist framework. Br. J. Dev. Psychol. 2015, 34, 6–23. [Google Scholar] [CrossRef] [PubMed]
- Repacholi, B.M.; Meltzoff, A.N.; Olsen, B. Infants’ understanding of the link between visual perception and emotion: “If she can’t see me doing it, she won’t get angry”. Dev. Psychol. 2008, 44, 561–574. [Google Scholar] [CrossRef] [Green Version]
- Lewkowicz, D.J.; Hansen-Tift, A.M. Infants deploy selective attention to the mouth of a talking face when learning speech. Proc. Natl. Acad. Sci. USA 2012, 109, 1431–1436. [Google Scholar] [CrossRef] [PubMed] [Green Version]
- Weikum, W.M.; Vouloumanos, A.; Navarra, J.; Soto-Faraco, S.; Sebastián-Gallés, N.; Werker, J.F. Visual language discrimination in infancy. Science 2007, 316, 1159. [Google Scholar] [CrossRef] [PubMed] [Green Version]
- Marshall, P.J.; Bouquet, C.A.; Shipley, T.F.; Young, T. Effects of brief imitative experience on EEG desynchronization during action observation. Neuropsychologia 2009, 47, 2100–2106. [Google Scholar] [CrossRef] [PubMed]
- Warreyn, P.; Ruysschaert, L.; Wiersema, J.R.; Handl, A.; Pattyn, G.; Roeyers, H. Infants’ mu suppression during the observation of real and mimicked goal-directed actions. Dev. Sci. 2013, 16, 173–185. [Google Scholar] [CrossRef] [PubMed] [Green Version]
- Debnath, R.; Salo, V.; Buzzell, G.A.; Yoo, K.H.; Fox, N.A. Mu rhythm desynchronization is specific to action execution and observation: Evidence from time-frequency and connectivity analysis. NeuroImage 2019, 184, 496–507. [Google Scholar] [CrossRef] [PubMed]
- Cao, M.; Huang, H.; He, Y. Developmental connectomics from infancy through early childhood. Trends Neurosci. 2017, 40, 494–506. [Google Scholar] [CrossRef]
- Boersma, M.; Smit, D.J.; de Bie, H.M.; Van Baal, G.C.M.; Boomsma, D.I.; de Geus, E.J.; de Waal, H.A.D.-V.; Stam, C.J. Network analysis of resting state EEG in the developing young brain: Structure comes with maturation. Hum. Brain Mapp. 2011, 32, 413–425. [Google Scholar] [CrossRef]
- Wen, X.; Zhang, H.; Li, G.; Liu, M.; Yin, W.; Lin, W.; Zhang, J.; Shen, D. First-year development of modules and hubs in infant brain functional networks. NeuroImage 2019, 185, 222–235. [Google Scholar] [CrossRef]

Publisher’s Note: MDPI stays neutral with regard to jurisdictional claims in published maps and institutional affiliations. |
© 2021 by the authors. Licensee MDPI, Basel, Switzerland. This article is an open access article distributed under the terms and conditions of the Creative Commons Attribution (CC BY) license (https://creativecommons.org/licenses/by/4.0/).
Share and Cite
Quadrelli, E.; Roberti, E.; Polver, S.; Bulf, H.; Turati, C. Sensorimotor Activity and Network Connectivity to Dynamic and Static Emotional Faces in 7-Month-Old Infants. Brain Sci. 2021, 11, 1396. https://doi.org/10.3390/brainsci11111396
Quadrelli E, Roberti E, Polver S, Bulf H, Turati C. Sensorimotor Activity and Network Connectivity to Dynamic and Static Emotional Faces in 7-Month-Old Infants. Brain Sciences. 2021; 11(11):1396. https://doi.org/10.3390/brainsci11111396
Chicago/Turabian StyleQuadrelli, Ermanno, Elisa Roberti, Silvia Polver, Hermann Bulf, and Chiara Turati. 2021. "Sensorimotor Activity and Network Connectivity to Dynamic and Static Emotional Faces in 7-Month-Old Infants" Brain Sciences 11, no. 11: 1396. https://doi.org/10.3390/brainsci11111396
APA StyleQuadrelli, E., Roberti, E., Polver, S., Bulf, H., & Turati, C. (2021). Sensorimotor Activity and Network Connectivity to Dynamic and Static Emotional Faces in 7-Month-Old Infants. Brain Sciences, 11(11), 1396. https://doi.org/10.3390/brainsci11111396