Abstract
Normally, the average of the horizontal-to-vertical (H/V) ratios of the 5% damped response spectra of ground motions is used to classify the site of strong-motion stations. In these cases, only the three-orthogonal as-recorded acceleration components are used in the analysis, and all the vector compositions that can generate a different response for each period oscillator are excluded. In this study, the Spanish strong-motion database was used to classify the sites of accelerometric stations based on the predominant periods through the average horizontal-to-vertical spectral ratios (HVSR) of recorded ground motions. Moreover, the directionality effects using the vector composition of the horizontal components of ground motions were also considered in the estimations of H/V ratios. This consideration is a relevant novelty compared to the traditional H/V ratios methods. Only earthquakes with magnitudes above 3.5 and hypocentral distances below 200 km were selected, which resulted in 692 ground-motion records, corresponding to 86 stations, from events in the period between 1993 and 2017. After the analysis, a predominant-period site classification was assigned to each station. On the whole, the obtained mean and standard deviation values of the spectral ratios are comparable to those shown by other researchers. Therefore, the advantages of the proposed procedure, which takes the directionality effects into account, can be summarized as follows: (a) The obtained information is richer and gives enables more sophisticated and realistic analyses on the basis of percentiles and (b) it is easier to detect anomalous stations, sites, and/or accelerograms. Moreover, the method eliminates the effect of directionality as a contributor to epistemic uncertainty.
1. Introduction
The Vs30 value (the time-averaged shear-wave velocity in the upper 30 meters) is a measure that is commonly used to define site classifications in seismic codes and ground-motion prediction equations (GMPEs) [1,2]. Table 1 shows seismic site classifications based on the Vs30 from European [3], Spanish [4], and American [5] seismic codes and structural standards. However, researchers have reported some limitations and problems with this classification [6,7,8,9]. Some of these include the (i) the limited availability of near-surface shear-wave data at strong-motion sites, (ii) the complexity of data acquisition, and (iii) the fact that these classifications do not consider the effect of the thickness of soft sediments.

Table 1.
Classification based on Vs30 for seismic codes and standard regulations from Europe, Spain, and the United States.
As an alternative to the Vs30 classification, a method based on horizontal-to-vertical (H/V) ratios of 5% damped response spectra, which can be used to obtain site predominant periods, was proposed by Zhao et al. [7]. This method was adapted to the seismic design of highway bridge regulations in Japan. After this paper, many authors presented studies based on the Zhao et al. method with data from Europe–United States–Japan [8], Iran [10], Italy [9], and India [11].
Ground motions during earthquakes are recorded in three orthogonal components: two horizontal and one vertical. Horizontal components are usually recorded in North-South (N-S) and East-West (E-W) directions, but other adequate directions are often used when, for instance, bridges, buildings, or other structures are instrumented. In these cases, longitudinal and transversal directions are normally preferred.
The as-recorded components do not necessarily represent the maximum intensity at the site. For instance, in addition to the response spectra of the two as-recoded accelerograms, namely E30° N and N30° W, Figure 1a shows the response spectra of the accelerograms corresponding to a rotated recording axis with increments of 1° in the range between 0° and 180°. The as-recorded components are rotated 30°, according to the data provided by the Spanish National Geographic Institute, since the sensor is installed with a 30° offset from the north. Figure 1b is a 3D representation of particle motion, showing how maximum recorded values strongly depend on the direction of the recording instruments. The following equation is used to obtain the rotated acceleration response time histories, accrot(t,θ,T,ξ):
where t is time, θ is the rotation angle, T is the period of the oscillator and ξ is the damping ratio. Usually, acc1(t,0,0,0) and acc2(t,0,0,0) are the as-recorded accelerograms. Maximum values lead to the response spectra RotDpp where Rot means rotated, D means period-dependent and pp means percentile. For other details on directionality, see Pinzón et al. [12].
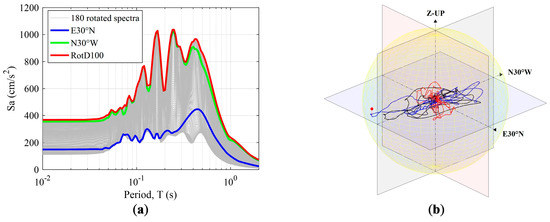
Figure 1.
The 11 May 2011 Lorca (Spain) earthquake, 5.1 Mw at 18:47:00 local time. (a) Response spectra comparison and (b) 3D particle motion for the ground-motion record registered in LOR station. E30°N and N30°W correspond to the as-recorded accelerograms.
As can be seen in Figure 1a, the N30°W component has larger Sa values than E30°N but does not represent the RotD100 (Rot: rotated; D: period-dependent; 100: 100th percentile) spectrum well. RotD100 is the spectrum that represents the maximum (100th percentile) values of response spectra of the two as-recorded horizontal components rotated onto all non-redundant azimuths [13]. This is due to the directionality effect of strong motion recordings, which is now considered in the GMPEs [12,14,15] and in the variability of the performance of structures due to the angle of incidence of the seismic action [16,17,18,19].
Directionality effects also play an important role in seismic site classification by means of H/V response spectral ratios [7]. Normally, the three as-recorded orthogonal components are used to perform the analysis. In some cases, the same site predominant period is captured with both horizontal components (see Figure 2a where a predominant period, Tg, of 0.61 s is obtained), but in other cases, as can be seen in Figure 2b, the predominant period varies for each horizontal component (Tg [N-S] = 1.11 s and Tg [E-W] = 0.95 s). By considering the directionality effects, using the 50th percentile of all the rotated ratios, a single site predominant period is obtained in both cases (Tg = 0.61 s and Tg = 1.11 s for the ground motions of Lorca and Alhucemas respectively). This procedure reduces epistemic uncertainty, since all non-redundant orientations are considered.
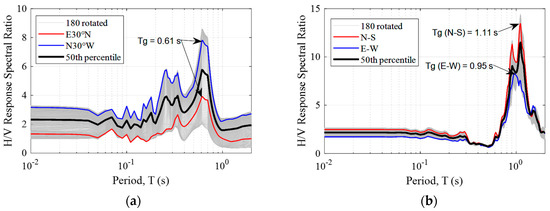
Figure 2.
Horizontal-to-vertical (H/V) 5% damped response spectral ratio comparison for (a) the 11 May 2011 Lorca (Spain) earthquake recorded in the LOR station (5.1 Mw at 18:47:00 local time) and (b) the 24 February 2004 Alhucemas (Morocco) earthquake recorded in the ALG station (6.3 Mw at 02:27:47 local time).
Earthquakes such as those in Sicily (Italy) in 1693 [20], Lisbon (Portugal) in 1755 [21], and Messina (Italy) in 1908 [22] were highly destructive events that left their mark on the European continent in the past. Over the last decade, a considerable number of high-magnitude earthquakes have occurred, causing property damage and fatalities. In Italy, the earthquakes of L’Aquila (Italy) in 2009 [23] and the Central Italian events of 2016 [24] caused around 600 fatalities and thousands lost their homes. In Spain, the Lorca 2011 earthquake is an example of how a moderate earthquake (Mw = 5.1) can produce significant damage with considerable economic loss, loss of homes, and fatalities [25,26]. This confirms the need to increase knowledge of earthquakes and provide advanced tools to improve the evaluation and management of seismic hazard and risk in Spain [27].
The main aim of this study is to improve the seismic site classification of the accelerometric stations of the strong-motion network of Spain. The site classification method proposed by di Alessandro et al. [9] is adopted, with the only difference being that directionality effects are taken into account. For this purpose, acceleration records from the Spanish strong-motion network (Spanish National Geographic Institute, IGN) are used. A predominant-period site classification is assigned to each strong-motion station and the results of the mean ratios are compared with those obtained by other researchers.
2. Methodology
In this study, the method proposed by di Alessandro et al. [9] is used to classify the sites of accelerometric stations. Furthermore, the Rotational H/V response spectral ratio (H/V Rot) is proposed as an extension of the method to consider the directionality effects. The aim of the H/V Rot method is to eliminate the contribution of sensor orientation uncertainty in the estimation of the response spectral ratios.
Instead of using only the three-orthogonal as-recorded components, the method considers directionality effects according to the following steps:
1. An estimation of 5% damped response spectra for each linear combination of the two horizontal orthogonal components between 0 and 180 degrees of rotation is computed (180 in total using Equation (1)). In this study, a period range between 0 and 2 seconds is used to compute the spectra with increments of 0.01 s.
2. The H/V response spectral ratios are computed for the 180 response spectra.
3. The 50th percentile (median value) of the 180 H/V spectral ratios are computed, to obtain a single ratio for each record.
Zhao et al. [7], Fukushima et al. [8], and di Alessandro et al. [9] proposed a seismic site classification method based on the site natural period at each station using H/V spectral ratios estimated with 5% damped response spectra. The criteria used by each researcher are shown in Table 2. In this table, Tg is the natural (predominant/fundamental) period of the site in seconds, SC refers to soil class and CL to site class. In this paper, the classification proposed by di Alessandro et al. [9] (see Table 2) is applied to the strong-motion network of Spain.
Table 2.
Comparison of the site classification definition based on the predominant period (Tg) proposed by Zhao et al. [7], Fukushima et al. [8], and di Alessandro et al. [9].
3. Data
The complete analysis was performed using the accelerometric database of the Spanish strong-motion network from the Spanish National Geographic Institute (IGN). This database contains records from 1993 to 2017. Ground motions were carefully corrected through baseline removal and band-pass filtering (Butterworth fourth-order). Only ground motions with body-wave (mb) and/or moment magnitudes (Mw) ≥ 3.5 and hypocentral distances ≤ 200 km were selected. Mw and mb magnitudes were used in the selection, since these were the magnitudes available in the database catalog. Magnitudes of earthquakes before 2010 were defined with mb and after this year they were defined with Mw. Thus, a dataset with 692 three orthogonal accelerograms, recorded at 86 stations, was segregated for the analysis.
The distribution of magnitude as a function of the hypocentral distance of the selected ground motions is displayed in Figure 3 and the earthquake locations are shown in Figure 4. Most records correspond to earthquakes with magnitudes below 4 and with a hypocentral distance between 20 and 30 km.
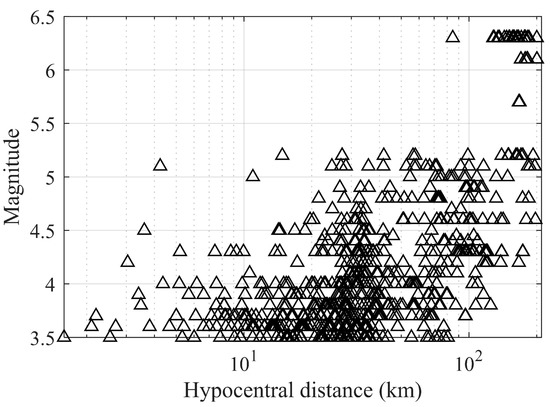
Figure 3.
Magnitudes and hypocentral distances for selected earthquakes and stations.
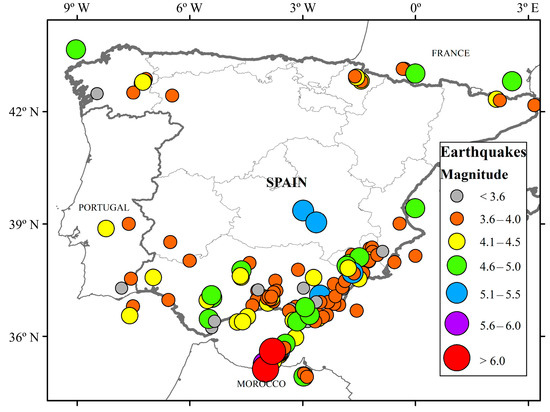
Figure 4.
Location of the earthquakes used in the analysis.
From the 692 ground motion records, only one has a peak ground acceleration (PGA) higher than 0.30 g (high seismicity), the 2011 Lorca earthquake recorded in the LOR station with a PGA = 0.36 g (see Figure 2a). Figure 5 shows the results of the H/V spectral ratios of the LOR station using all the available records. The median predominant period is 0.46 s compared to the 0.61 s period obtained in Figure 2a. This difference in the period is due to the high PGA of the motion, producing high deformations and leading to a nonlinear response of the soil [28,29,30,31].
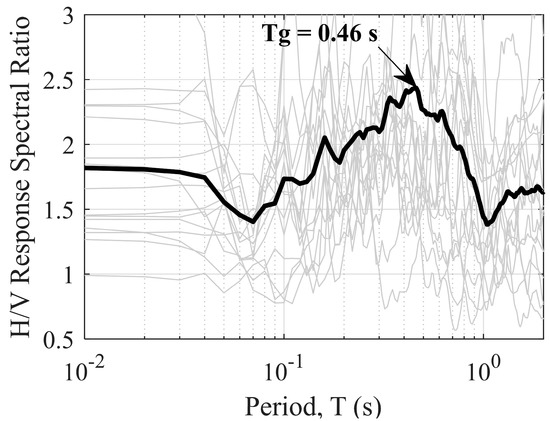
Figure 5.
H/V response spectral ratios for the LOR station. Gray lines are the H/V ratios of all the ground motions recorded in LOR station and in black the 50th percentile. The predominant period found is 0.46 s.
4. Results
Once the complete database had been analyzed, a seismic site class was assigned to each strong-motion station. Seventy-three percent of the stations were classified in the first four categories corresponding to 78% of the ground-motion records (Table 3).
Table 3.
Number of accelerometric stations and ground-motion records for each site class according to the di Alessandro et al. [9] classification.
The location of the 86 analyzed stations are shown in Figure 6, and, in order to summarize the results obtained and to allow easy comparison with previous classifications, Table 4 shows the new and old site classifications. In this table, the classification based on the predominant periods, the geology (provided by the IGN), and the site classification published by Mezcua et al. [32] are shown. For the geology classification, R refers to rock, H to hard soil, and S to soft soil. To characterize each site, Mezcua et al. [32] used the crude site qualitative description provided for each station. Site class 1 corresponds to compact rocks, 2 refers to firm soil, and 3 applies to soft sedimentary deposits.
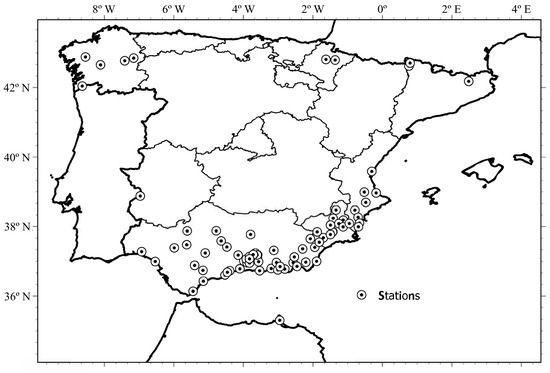
Figure 6.
Location of accelerometric stations.
Table 4.
Site classification of the Spanish strong-motion stations.
The geometric means (GM) of the H/V ratios of the 5% damped response spectra and their standard deviations were calculated for each site class. The results are shown in Figure 7 and in Table 5 and Table 6. The shape of the GM ratio is similar to that obtained by Zhao et al. [7] using the Japanese database and di Alessandro et al. [9] using the Italian one. Differences in amplitudes of the GM of the ratios were also observed: Maximum values were around 4 with the Japanese dataset (see Figure 3 of Zhao et al. [7]), 2.8 with the Italian dataset (see Figure 3 of di Alessandro et al. [9]), and 2.3 in this study (see Figure 7). These differences are related to the range of magnitudes used and the number of records. The analysis for Japan was made with ground motions from earthquakes with magnitudes ≥ 5.0 and in Italy with magnitudes ≥ 4.0. In the case of the present study, most of the records were from earthquakes with a magnitude ≤ 4. For this reason, smaller amplitudes were found in the GM of ratios.
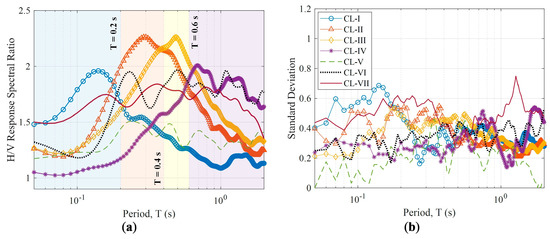
Figure 7.
(a) Geometric means (GM) of the H/V ratios of the 5% damped response spectra for each site class. (b) The corresponding standard deviations.
Table 5.
Numerical values of the GM of the H/V ratios of the 5% damped response spectra for the site classes of the accelerometric stations based on the Spanish ground-motion database. (See also Figure 7a).
Table 6.
Standard deviation of the GM of H/V ratios of the 5% damped response spectra for the site classes of accelerometric stations based on the Spanish ground-motion database (see also Figure 7b).
In the case of the standard deviations of the geometric mean of H/V response spectra ratios (Figure 7b), the results show values around 0.3 on average. These results are similar to those obtained by Zhao et al. [7], Fukushima et al. [8], Ghasemi et al. [10], and di Alessandro et al. [9].
The spectral ratios (spectral amplification factors) obtained for each site class (see Figure 7a and Table 5) are used to compare the results with the elastic design spectra of the Eurocode 8 (EC-8) [3]. To make this comparison, the spectral shapes of each site class are first normalized at the zero-sec-period and the EC-8 design spectrum for Type 2 earthquakes and soil type A (EC8-2A spectrum) (see Table 1) is used as a reference spectrum. This reference spectral shape was selected because of the low-to-moderate seismic hazard in Spain [18] and the relatively low magnitudes of the events involved in this study (see Figure 3). Recall that Type 2 spectra are recommended for regions with earthquakes whose surface-wave magnitude (Ms) is no greater than 5.5 (low seismicity) [1,10]. The EC8-2A design spectrum and the normalized spectral ratios are then multiplied to obtain the expected design spectrum at each site class. This procedure is equivalent to considering the normalized spectral ratios as transfer functions between the basement and the surface soils, when the EC8-2A design spectrum is the reference spectrum in the hard rock basement. Thus, each site class can also be compared with the EC-8 design spectra for different soil classes (Figure 8). Site classes CL-I, CL-V, and CL-VII match well with EC8-2A and EC8-2B soil types, while CL-II, CL-III, and CL-VI are a better fit with EC8-2B and EC8-2C soil types. Finally, the spectrum corresponding to the CL-IV site class has large amplitudes for higher periods and lower amplitudes for low periods so that the long period section is a good match with the spectra for EC8-2C and EC8-2D soil types, and the short period section, that is, periods below 0.3 s, is well fitted by the EC8-2B spectrum.
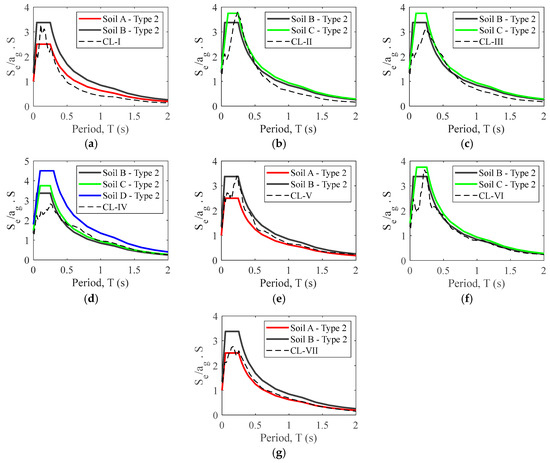
Figure 8.
Comparison between the EC-8 Type 2 design spectra and the mean spectral shapes obtained for the site classes: (a) CL-I, (b) CL-II, (c) CL-III, (d) CL-IV, (e) CL-V, (f) CL-VI, and (g) CL-VII.
Table 7 summarizes and highlights similarities between the site classes of this study and the EC-8. However, we must be aware that it does not mean that site classes and EC-08 soils are equivalent but only that there exist significant similarities in the corresponding spectra, mainly in the long period range. In our view, the spectra for site classes must be preferred for assessment purposes, because they are based on actual strong motion recordings. For design purposes, spectra of the Eurocode soil type may also be a good option, because design spectra are based on smoothed spectra, which envelop maximum spectral values of expected strong motions.
Table 7.
Main similarities among the classification obtained in this study for the Spanish strong motion database and the soil classification of the Eurocode 8 [3].
5. Conclusions
In this study, the Spanish ground-motion database was used to classify the site of each accelerometric station through the predominant period obtained using H/V ratios of the 5% damped response spectra. Directionality effects were also considered in the analysis through linear combinations of the horizontal components. For each ground motion, 180 H/V ratios were estimated (one per rotation angle). The 50th percentile was then selected to obtain a single ratio per ground motion. To determine the classification based on the site predominant period, the geometric mean of the ratios of each station was calculated to obtain one spectral shape per station. It is important to mention that is not usual to include the effects of directionality in H/V calculations. In most cases, the spectral quotients are only calculated with the orthogonal components.
Without considering directionality effects, this seismic site classification has previously been applied to ground motion databases from other countries. The application of this methodology to the Spanish network helps to improve the site classification of each station and fill the gap generated by the lack of information. One important novelty of this study is that it provides empirical information about the site response due to ground motions, complementing existing hypotheses based on geology maps. The proposed classification is made with data collected in the same station. It is not usual to classify an entire network according to a homogeneous common parameter, which is not a proxy from geology or topography. In fact, most networks have few stations characterized by direct measurements such as Vs30 or the predominant frequency of the site.
This classification provides some advantages compared to others (e.g., Vs30-based). (i) The acquisition and processing of data are simple and automatic, since the network works continuously. (ii) This methodology may be easily exported to other networks, depending on the availability of strong motion databases. (iii) Moreover, this classification considers the real response of the site to actual seismic actions. This way, more realistic site conditions are obtained in comparison to the more general, simplified, and proxy classifications, which are used in seismic codes (e.g., Eurocode 8 site classification). (iv) When directionality is included, the method allows us to have information about the likely anisotropy of both the strong motion and the soil response. An additional value of the method is that the epistemic uncertainty decreases since all of the orientations are considered in the analysis.
In recent years, interest in the site conditions of installed stations has increased for research purposes and for engineering uses. From an engineering perspective, this classification plays an important role in the evaluation and design of structures, which can be useful, for instance, when actual accelerograms are needed for deterministic and/or probabilistic dynamic analyses, thus improving the results for specific areas and contributing to reducing epistemic uncertainties. Moreover, an equivalent classification to the Eurocode 8 soil classes was obtained using the design spectra and the spectral shapes of each station as transfer functions. This equivalence can be very useful if a study or project is carried out following the Eurocode 8 specifications, either for the earthquake resistant design or for assessment of existing structures.
Finally, the impact of these site classes on the development of new generation empirical ground motion predictive equations (GMPE) in comparison to the more traditional ones based on more simplified approaches that take into account the local site effects based on conventional rock/soil classifications remains a relevant and interesting issue.
Author Contributions
L.A.P. carried out the calculations and analysis. L.A.P., L.G.P., and A.M. wrote the paper. E.C. and J.M.A. provided the ground motion database.
Funding
This research was partially funded by the Spanish Government’s Ministry of Economy and Competitiveness (MINECO) and by the European Regional Development Fund (ERDF) of the European Union (EU) through the project referenced as CGL2015-65913-P (MINECO/ ERDF, EU). The first author is supported by a Ph.D. scholarship grant from the Government of Panama’s Institute for the Training and Development of Human Resources (IFARHU) and the National Secretariat of Science, Technology, and Innovation (SENACYT).
Acknowledgments
We thank Lucille Banham for her assistance in the preparation of the English manuscript.
Conflicts of Interest
The authors declare no conflict of interest.
References
- Akkar, S.; Sandıkkaya, M.A.; Bommer, J.J. Empirical ground-motion models for point- and extended-source crustal earthquake scenarios in Europe and the Middle East. Bull. Earthq. Eng. 2014, 12, 359–387. [Google Scholar] [CrossRef]
- Cadet, H.; Macau, A.; Benjumea, B.; Bellmunt, F.; Figueras, S. From ambient noise recordings to site effect assessment: The case study of Barcelona microzonation. Soil Dyn. Earthq. Eng. 2011, 3, 271–281. [Google Scholar] [CrossRef]
- CEN. Eurocode 8: Design of Structures for Earthquake Resistance- Part 1: General Rules, Seismic Actions and Rules for Buildings; European Standard, I.S.EN 1998-1:2005; CEN: Brussels, Belgium, 2004; (English Version). [Google Scholar]
- de Fomento, M. Norma de Construcción Sismorresistente: Parte General y Edificación (NCSE-02); Centro de Publicaciones Secretar General Tecnica-Ministerio de Fomento: Madrid, Spain, 2002. [Google Scholar]
- American Society of Civil Engineers (ASCE). Minimum Design Loads and Associated Criteria for Buildings and Other Structures; ACSE: Reston, VA, USA, 2017. [Google Scholar] [CrossRef]
- Steidl, J.H. Site response in southern California for probabilistic seismic hazard analysis. Bull. Seismol. Soc. Am. 2000, 90, 149–169. [Google Scholar] [CrossRef]
- Zhao, J.X.; Irikura, K.; Zhang, J.; Fukushima, Y.; Somerville, P.G.; Asano, A.; Ohno, Y.; Oouchi, T.; Takahashi, T.; Ogawa, H. An empirical site-classification method for strong-motion stations in Japan using H/V response spectral ratio. Bull. Seismol. Soc. Am. 2006, 96, 914–925. [Google Scholar] [CrossRef]
- Fukushima, Y.; Bonilla, L.F.; Scotti, O.; Douglas, J. Site classification using horizontal-to-vertical response spectral ratios and its impact when deriving empirical ground-motion prediction equations. J. Earthq. Eng. 2007, 11, 712–724. [Google Scholar] [CrossRef]
- Di Alessandro, C.; Bonilla, L.F.; Boore, D.M.; Rovelli, A.; Scotti, O. Predominant-period site classification for response spectra prediction equations in Italy. Bull. Seismol. Soc. Am. 2012, 102, 680–695. [Google Scholar] [CrossRef]
- Ghasemi, H.; Zare, M.; Fukushima, Y.; Sinaeian, F. Applying empirical methods in site classification, using response spectral ratio (H/V): A case study on Iranian strong motion network (ISMN). Soil Dyn. Earthq. Eng. 2009, 29, 121–132. [Google Scholar] [CrossRef]
- Chopra, S.; Kumar, V.; Choudhury, P.; Yadav, R.B.S. Site classification of Indian strong motion network using response spectra ratios. J. Seismol. 2017, 22, 419–438. [Google Scholar] [CrossRef]
- Pinzón, L.A.; Pujades, L.G.; Hidalgo-leiva, D.A.; Diaz, S.A. Directionality models from ground motions of Italy. Ing. Sismica 2018, 35, 43–63. [Google Scholar]
- Boore, D.M. Orientation-independent, nongeometric-mean measures of seismic intensity from two horizontal components of motion. Bull. Seismol. Soc. Am. 2010, 100, 1830–1835. [Google Scholar] [CrossRef]
- Shahi, S.K.; Baker, J.W. NGA-West2 models for ground-motion directionality. Earthq. Spectra 2014, 46, 1285–1300. [Google Scholar] [CrossRef]
- Bozorgnia, Y.; Abrahamson, N.A.; Atik, L.A.; Ancheta, T.D.; Atkinson, G.M.; Baker, J.W.; Baltay, A.; Boore, D.M.; Campbell, K.W.; Choiu, B.S.-J.; et al. NGA-West2 research project. Earthq. Spectra 2014, 30, 973–987. [Google Scholar] [CrossRef]
- Lagaros, N.D. The impact of the earthquake incident angle on the seismic loss estimation. Eng. Struct. 2010, 32, 1577–1589. [Google Scholar] [CrossRef]
- Torbol, M.; Shinozuka, M. The directionality effect in the seismic risk assessment of highway networks. Struct. Infrastruct. Eng. 2014, 10, 175–188. [Google Scholar] [CrossRef]
- Vargas-Alzate, Y.F.; Pujades, L.G.; Barbat, A.H.; Hurtado, J.E.; Diaz, S.A.; Hidalgo-Leiva, D.A. Probabilistic seismic damage assessment of reinforced concrete buildings considering direccionality effects. Struct. Infrastruct. Eng. 2017, 14, 817–829. [Google Scholar] [CrossRef]
- Pinzón, L.A.; Pujades, L.G.; Diaz, S.A.; Alva, R.E. Do directionality effects influence expected damage? A case study of the 2017 Central Mexico earthquake. Bull. Seismol. Soc. Am. 2018, 108, 2543–2555. [Google Scholar] [CrossRef]
- Bianca, M.; Monaco, C.; Tortorici, L.; Cernobori, L. Quaternary normal faulting in southeastern Sicily (Italy): A seismic source for the 1693 large earthquake. Geophys. J. Int. 1999, 139, 370–394. [Google Scholar] [CrossRef]
- Baptista, M.A.; Miranda, J.M.; Chierici, F.; Zitellini, N. New study of the 1755 earthquake source based on multi-channel seismic survey data and tsunami modeling. Nat. Hazards Earth Syst. Sci. 2010, 3, 333–340. [Google Scholar] [CrossRef]
- Amoruso, A.; Crescentini, L.; Scarpa, R. Source parameters of the 1908 Messina Straits, Italy, earthquake from geodetic and seismic data. J. Geophys. Res. Solid Earth 2002, 107, ESE 4-1–ESE 4-11. [Google Scholar] [CrossRef]
- Çelebi, M.; Bazzurro, P.; Chiaraluce, L.; Clemente, P.; Decanini, L.; Desortis, A.; Ellsworth, W.; Gorini, A.; Kalkan, E.; Marcucci, S.; et al. Recorded motions of the 6 April 2009 Mw 6.3 L’Aquila, Italy, earthquake and implications for building structural damage: Overview. Earthq. Spectra 2010, 26, 651–684. [Google Scholar] [CrossRef]
- Fiorentino, G.; Forte, A.; Pagano, E.; Sabetta, F.; Baggio, C.; Lavorato, D.; Nuti, C.; Santini, S. Damage patterns in the town of Amatrice after August 24th 2016 Central Italy earthquakes. Bull. Earthq. Eng. 2018, 16, 1399–1423. [Google Scholar] [CrossRef]
- De Luca, F.; Verderame, G.M.; Gómez-Martínez, F.; Pérez-García, A. The structural role played by masonry infills on RC building performances after the 2011 Lorca, Spain, earthquake. Bull. Earthq. Eng. 2014, 12, 1999–2026. [Google Scholar] [CrossRef]
- Alfaro, P.; Delgado, J.; García-Tortosa, F.J.; Lenti, L.; López, J.A.; López-Casado, C.; Martino, S. Widespread landslides induced by the Mw 5.1 earthquake of 11 May 2011 in Lorca, SE Spain. Eng. Geol. 2012, 137–138, 40–52. [Google Scholar] [CrossRef]
- Pinzón, L.A.; Pujades, L.G.; Macau, A.; Figueras, S. Increased seismic hazard in Barcelona (Spain) due to soil-building resonance effects. Soil Dyn. Earthq. Eng. 2019, 117, 245–250. [Google Scholar] [CrossRef]
- Angina, A.; Steri, A.; Stacul, S.; Lo Presti, D. Free-field seismic response analysis: The Piazza dei Miracoli in Pisa case study. Int. J. Geotech. Earthq. Eng. 2018, 9, 1–21. [Google Scholar] [CrossRef]
- Lo Presti, D.C.; Lai, C.G.; Puci, I. ONDA: Computer code for nonlinear seismic response analyses of soil deposits. J. Geotech. Geoenviron. Eng. 2006, 132, 223–236. [Google Scholar] [CrossRef]
- Fiorentino, G.; Quaranta, G.; Mylonakis, G.; Lavorato, D.; Pagliaroli, A.; Carlucci, G.; Sabetta, F.; Della Monica, G.; Lanzo, G.; Aprile, V.; et al. Seismic reassessment of the leaning tower of Pisa: Dynamic monitoring, site response, and SSI. Earthq. Spectra 2019, 35, 703–736. [Google Scholar] [CrossRef]
- Pinzón, L.A.; Mánica Malcom, M.Á.; Pujades, L.G.; Alva, R.E. A simplified approach to account for directionality effects on 2D dynamic soil-structure interaction analysis. In Earthquake Geotechnical Engineering for Protection and Development of Environment and Constructions; Silvestri, F., Moraci, N., Eds.; CRC Press, Taylor & Francis Group: Boca Raton, FL, USA, 2019; pp. 4490–4497. [Google Scholar]
- Mezcua, J.; García Blanco, R.M.; Rueda, J. On the strong ground motion attenuation in Spain. Bull. Seismol. Soc. Am. 2008, 98, 1343–1353. [Google Scholar] [CrossRef]
© 2019 by the authors. Licensee MDPI, Basel, Switzerland. This article is an open access article distributed under the terms and conditions of the Creative Commons Attribution (CC BY) license (http://creativecommons.org/licenses/by/4.0/).