Article

Unsupervised Classification for Landslide Detection from Airborne Laser Scanning

1
Department of Civil Engineering, California State Polytechnic University, Pomona, CA 91768, USA
2
Department of Geography, University of California, Los Angeles, CA 90095, USA
3
Instituto Argentino de Nivología, Glaciología y Ciencias Ambientales (IANIGLA)—CONICET, 5500 Mendoza, Argentina
*
Author to whom correspondence should be addressed.
Geosciences 2019, 9(5), 221; https://doi.org/10.3390/geosciences9050221
Submission received: 22 March 2019 / Revised: 6 May 2019 / Accepted: 11 May 2019 / Published: 15 May 2019

Abstract

:
Landslides are natural disasters that cause extensive environmental, infrastructure and socioeconomic damage worldwide. Since they are difficult to identify, it is imperative to evaluate innovative approaches to detect early-warning signs and assess their susceptibility, hazard and risk. The increasing availability of airborne laser-scanning data provides an opportunity for modern landslide mapping techniques to analyze topographic signature patterns of landslide, landslide-prone and landslide scarred areas over large swaths of terrain. In this study, a methodology based on several feature extractors and unsupervised classification, specifically k-means clustering and the Gaussian mixture model (GMM) were tested at the Carlyon Beach Peninsula in the state of Washington to map slide and non-slide terrain. When compared with the detailed, independently compiled landslide inventory map, the unsupervised methods correctly classify up to 87% of the terrain in the study area. These results suggest that (1) landslide scars associated with past deep-seated landslides may be identified using digital elevation models (DEMs) with unsupervised classification models; (2) feature extractors allow for individual analysis of specific topographic signatures; (3) unsupervised classification can be performed on each topographic signature using multiple number of clusters; (4) comparison of documented landslide prone regions to algorithm mapped regions show that algorithmic classification can accurately identify areas where deep-seated landslides have occurred. The conclusions of this study can be summarized by stating that unsupervised classification mapping methods and airborne light detection and ranging (LiDAR)-derived DEMs can offer important surface information that can be used as effective tools for digital terrain analysis to support landslide detection.

1. Introduction

Landslides are known to cause distress worldwide and are considered the third most significant natural hazard [1,2,3]. They are a form of mass wasting that includes a wide range of ground movements, such as rock falls, deep failure of slopes and shallow debris flows [4]. They are caused by pre-conditional surface and/or sub-surface instability that occurs after slope changes, rainfall or land topography manipulation [5]. Thus, landslides usually occur on steep slopes of mountains or hills [6]. Landscape, climate, quarrying and construction are human factors, in addition to natural factors that impact landslides. Landslides pose a global threat as they affect human conditions and extensively damage the environment and infrastructure; they are natural disasters for highways, buildings, residential developments, bridges and other human-inhabited areas [7,8]. For these reasons, it is imperative to prevent future risk posed by these natural disasters. Accurate landslide mapping and cataloging are essential in the mitigation of the damages caused by these hazardous events [9].
Conventional landslide mapping methods include aerial photograph interpretation, field inspection and contour map analysis [2,6,7,8,10,11]. However, despite the accuracy and precision of these traditional landslide mapping methods, they are limited; field inspection sites are dangerous or inaccessible, contour maps do not have the spatial resolution required to analyze small slides, and aerial photograph interpretation cannot penetrate highly vegetated areas [7,10,12]. These methods have proven to be time consuming, costly, difficult to implement, subjective and unable to detect smaller slope failures [6,7,8,10,11,13]. These disadvantages in traditional landslide mapping techniques make them ineffective to support the mitigation of landslide hazard events. For these reasons, contemporary methods are needed to map and catalogue landslides.
Modern mapping algorithms have shown incredible improvements in detecting, classifying and monitoring landslides [14,15,16]. Most proposed methods implement remote-sensing technologies due to their incredible advancements in spatial resolution, accuracy and accessibility [6,7,8,10,11,13,14,17,18,19,20]. Remote-sensing technologies have supported the development of intricate models based on surface features that can help detect landslide susceptible areas [21,22]. One of the remote-sensing techniques that can be used for landslide monitoring is the interferometric synthetic aperture radar (InSAR), which has been evaluated in previous studies [23]. However, InSAR at higher C- or X-band frequencies, is limited in vegetated areas, since the radar signals of two repeat-pass acquisitions are incoherent. One particular remote-sensing technology that has supported the landslide community is laser scanning. Light detection and ranging (LiDAR) sensors provide an opportunity to map and model surfaces and have improved from a resolution greater than 10 m to less than 1 m [7], thus allowing for the detection of finer spatial features that are typically found in slower mass movements, and/or small failures. One particular laser scanning system that is of interest is airborne LiDAR. This system is capable of penetrating vegetative cover with filtering processes to reveal the bare Earth surface and map large swaths of terrain up to thousands of square meters [24]. Airborne LiDAR technologies allow for the mapping of small failures in areas of slow mass movement for monitoring and offer the detection of landslide/non-landslide surface terrain [25]. In particular, airborne LiDAR provides an opportunity to analyze topographic features related to past deep-seated landslides [10]. They also provide great opportunities for studies about earth surfaces and their surface features [24,25].
The use of digital elevation models (DEMs) in landslide mapping has improved the safety of infrastructures and reduced the hazard caused by landslides. To further analyze landslide occurrences, studies have concentrated not only on the slides, but on different aspects of the area such as water flow, rock and sediment types, as these can affect the stability of the terrain [7,26,27]. Using these newer technology-based methods has improved the analysis of the different aspects of the terrain. Feature extraction is used on DEMs to identify and isolate landslides by examining the surface models [7,11,25]. Various feature extraction models have been used in landslide studies including slope, hillshade, aspect and statistics [6,7,10,11,13]. A few of these features have been tested through automated and semi-automated algorithms [28,29]. For example, statistics have been used in a very specific length scale to compute roughness in order to isolate the landslide-scarred area [6]. While such features are a key method to identifying landslide terrain, studies suggest that the type of features used to identify slides can be subjective to each site [30]. Different features are able to characterize and map landslide and non-landslide areas. Knowing the quantity of vegetation, in addition to the features already included within the site, is a crucial component that enables the use of these features from DEMs [31]. Furthermore, feature properties do not always correspond to data classes, therefore, after classification is complete an evaluation of the classification results is required. To support the detection of landslides by using surface features they need to be combined with a classifier, such as an unsupervised classifier.
Unsupervised classification is the process where features/pixels of common characteristics are grouped together into clusters/classes [32]. This process is performed without providing prior information to the classifier and is solely based on similarity [33]. Some of the advantages of performing unsupervised classification techniques is that they are fast, easy to perform, do not require prior knowledge and are feature-based. Some limitations include the fact that feature classes do not always correspond to data classes, therefore time needs to be spent after the classification is complete to analyze the results, and the fact that feature properties can change over time [32,33]. Nonetheless, prior studies have shown that these classification techniques provide an opportunity to analyze earth surfaces applied to landslide detection [34,35,36,37,38]. The coupling of airborne LiDAR-derived DEMs with unsupervised classification methods offer an opportunity to develop semi-automated algorithms that can help support the initial process of landslide mapping.
However, airborne LiDAR-derived DEMs are currently used operationally to generate landslide inventory maps. The common practice to produce landslide inventory maps which incorporate LiDAR data are based on manual identification of landslide surface features (e.g., surface roughness and scarps), as described for instance in [39] and [40], where the identification of landslides is performed by spatially identifying and tabulating landslides manually into categories using a geographic information system (GIS). However, this approach is time consuming, subjective and inefficient, especially when time-sensitive events occur (e.g., emergency and disaster events). For these reasons, it is critical to develop and test semi-automatic methods to support the initial process of landslide mapping.
In this paper, we aim to evaluate two unsupervised classification methods to detect and map the topographic signatures of landslide and non-landslide terrain utilizing an airborne LiDAR-derived DEM. Specifically, the unsupervised techniques are based on k-means and Gaussian mixture model (GMM) clustering. These methods will use characteristics of feature extractors to evaluate the surface topography, specifically: slope, roughness, local topographic range, and local topographic variability. The techniques evaluated fuse feature extraction and unsupervised classification to identify areas where deep-seated landslides have occurred. To evaluate the performance of the proposed algorithms, a study area susceptible to sliding in the Carlyon Beach Peninsula in the state of Washington was used for testing. Subsequently, the resulting landslide map was compared to an independently compiled landslide inventory map and the methods were shown to correctly identify up to 87% of the terrain in the study area. The results obtained from the test indicate that the proposed unsupervised classification algorithms and LiDAR-derived DEMs provide important surface information for the detection of landslide surface features that can cause continuous damage to inhabited areas.

2. Study Area, Light Detection and Ranging (LiDAR) Data and Inventory Map

The study area was the Carlyon Beach (Hunter Point landslide) in northwestern Thurston County, Washington (Approx. Latitude: N 47°10′46″, Longitude: W 122°56′24″), see Figure 1. The general location resides at an elevation of 165 feet above mean sea level with slopes ranging from 7 to 20 degrees. Carlyon Beach has a sparsely developed amount of vegetation that consists of sub-mature, second growth coniferous trees, deciduous trees and sword fern that play a crucial role in deeper-seated slope movement.
The landslide was located along the northern end of the Steamboat Island Peninsula and includes a portion of the private community of Carlyon Beach, as well as a number of rural residential dwellings along Northwest Hunter Point Road [41]. Significant landslide movement was detected in early 1999 from cracks in various residences and city infrastructure, distressed building foundations, and damaged subsurface utilities. In addition, the area has experienced a continuous amount of movement due to the soil composition [10]. Soil boring was performed in the area to analyze soil composition and engineers concluded that the area resides on unstable soils including soft silt, stiff silt and clay, which are heavily affected by weather, construction and the environment itself [41]. The topographic features visible by the bluff-forming landslide are scarps, blocks and hummocky terrain.
Carlyon Beach failures can also be somewhat attributed to a shallow groundwater table that proves detrimental to slope stability when compounded with the weak overlying soil. The Carlyon Beach Peninsula experiences above average rainfall, between 3% and 65% above the average in neighboring regions [42]. The increased rainfall contributes to an increased amount of groundwater flow to the area, resulting in a higher landslide probability [41]. About 26% of the Carlyon Beach site has deep-seated landslides [10]. Landslide conditions have caused considerable damage to hundreds of homes that have now been declared uninhabitable or have decreased in value. Human development of the area around the Carlyon Beach Peninsula has also removed some visible surface features of landslides, which may cause difficulty when determining potentially problematic areas [10].
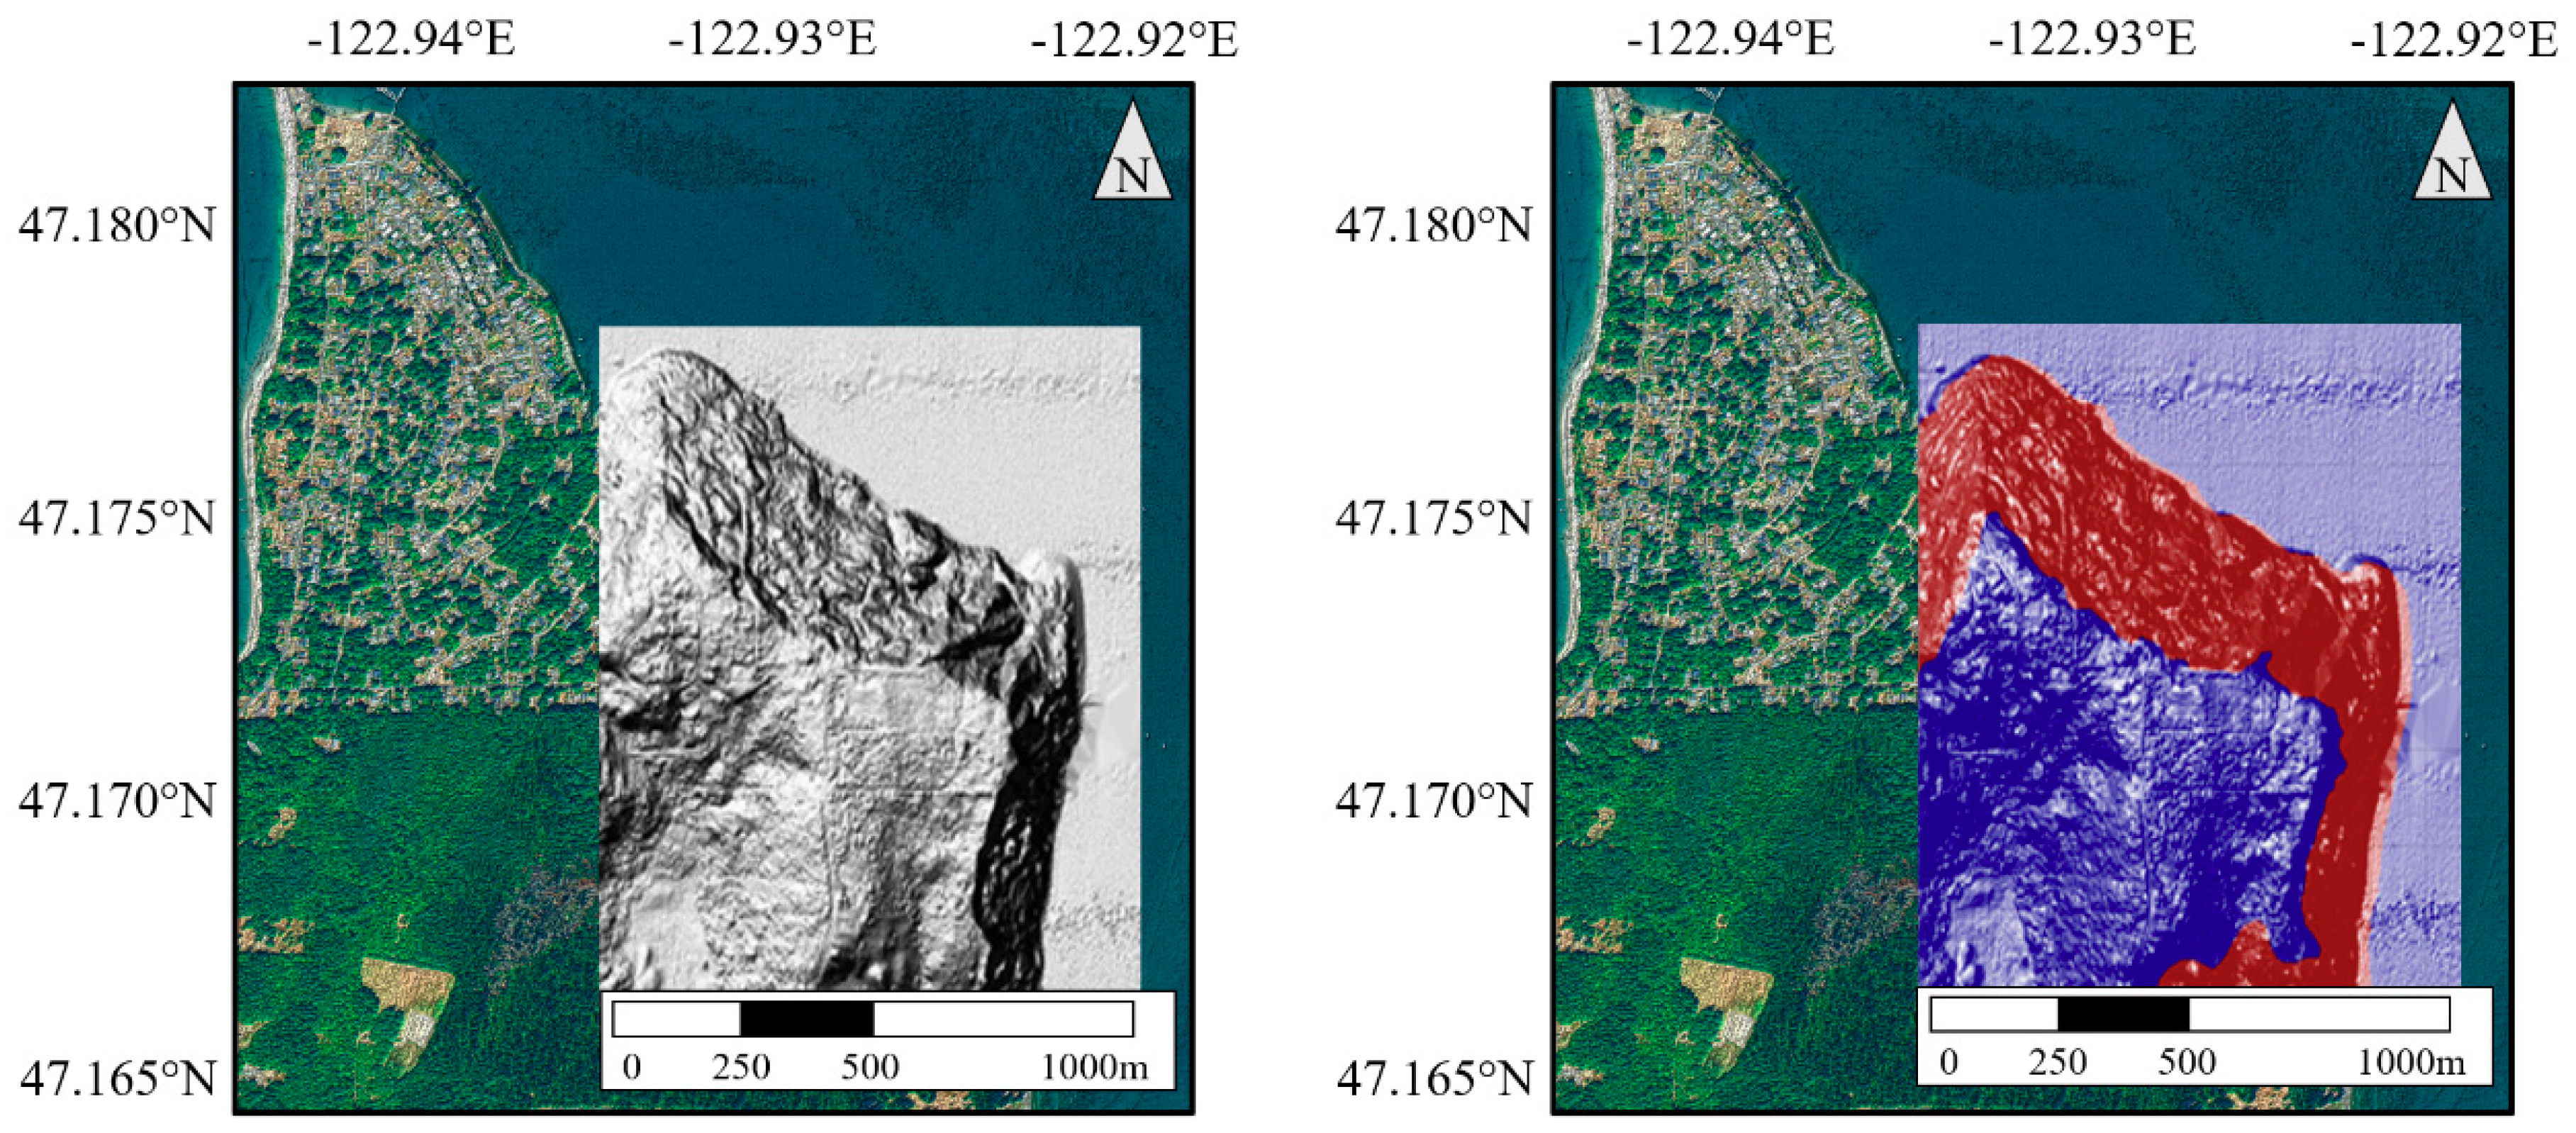
The DEM used in this study for topographic signature analysis was made available by the Puget Sound LiDAR Consortium (http://pugetsoundlidar.ess.washington.edu/), see Figure 2. The high-resolution LiDAR-derived DEM data was collected in 2002, and had a point spacing of 1.8 m (6-ft). The landslide inventory map was compiled by the Geology and Earth Resources division of the Washington State Department of Natural Resources (WA DNR) using a combination of LiDAR-derived DEMs together with aerial photographs and field inspection [10] to identify landslide scars and unaffected regions as landslide and unfailed terrain, respectively, seen in Figure 2.

3. Methodology

Airborne laser scanning provides high-resolution surface information and accuracy needed for landslide detection. Landslide surface feature extraction is conducted by applying individual feature extractors to the DEM of the study area to identify topographic signatures of landslide morphology. The geomorphological features are extracted by applying a sliding window that analyzes the terrain, in particular, the surface topographic variability. Prior studies have shown that higher topographic variations in the terrain result in a rough surface as found in landslide terrain, whereas low variations result in a smooth surface found in unfailed terrain [6,7,10].

3.1. Algorithm

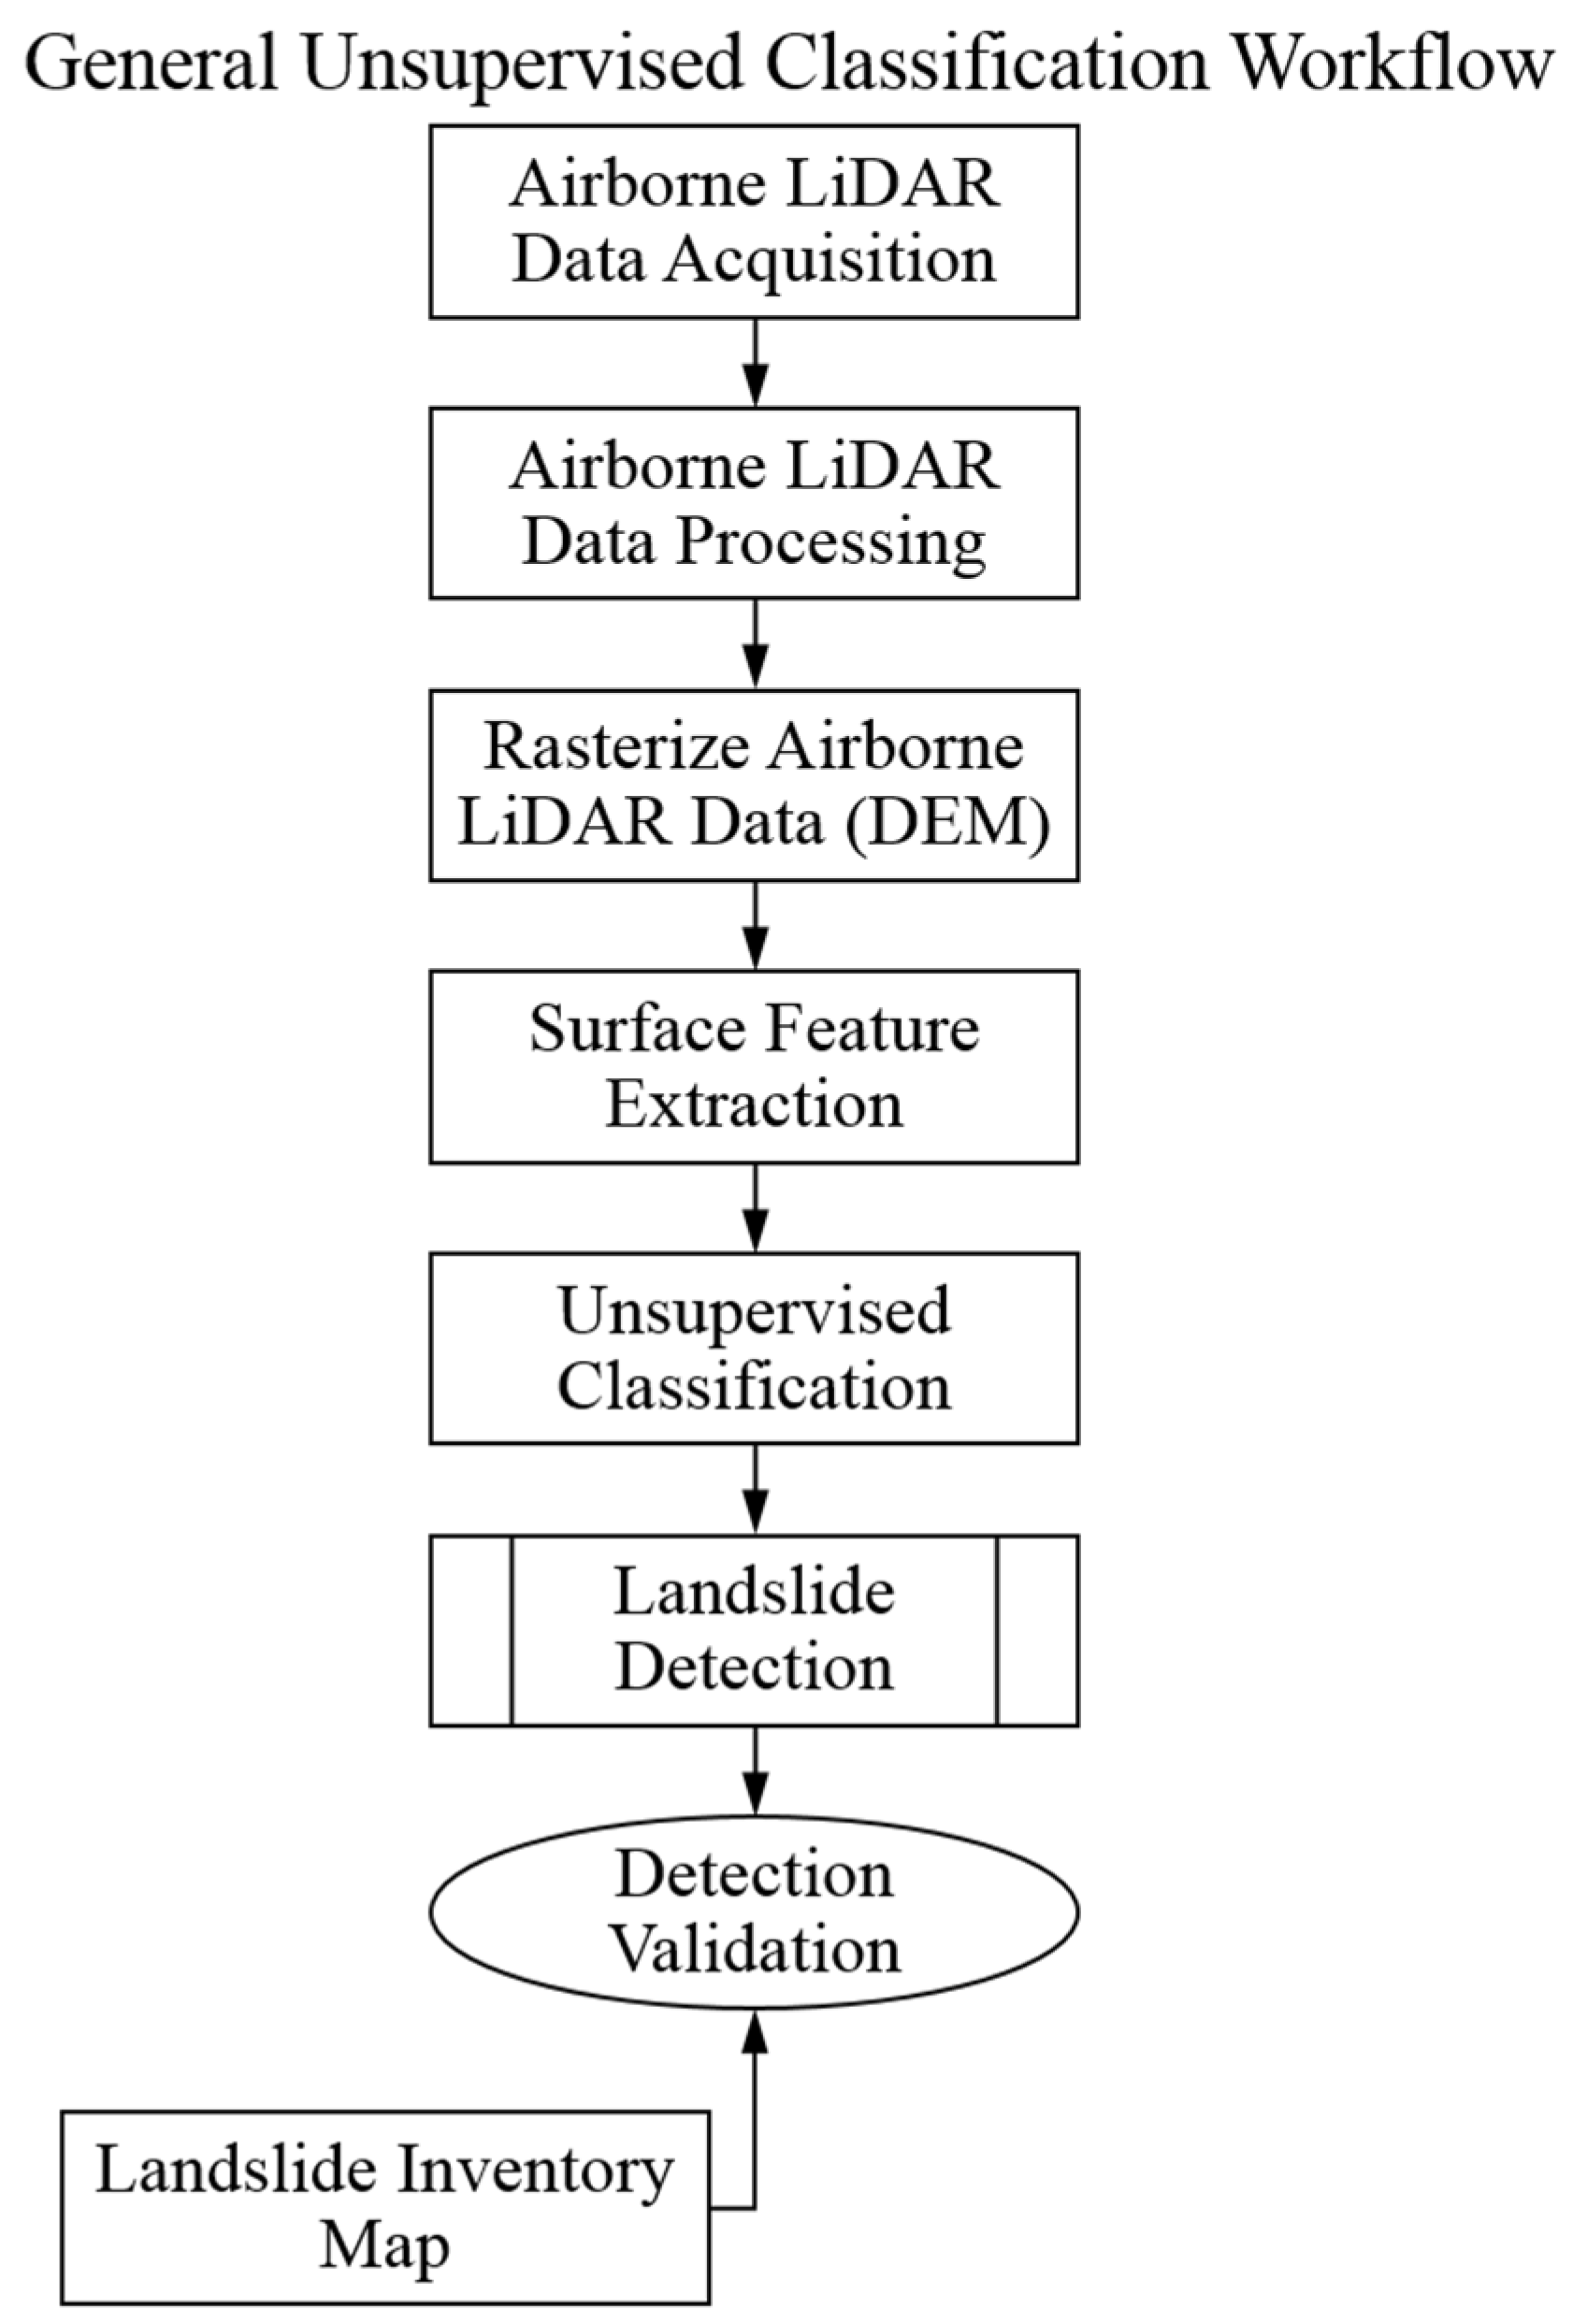
To support traditional mapping methods and reduce the efforts conventionally required to detect landslide surface features, we propose to evaluate unsupervised classification methods for landslide mapping. The steps followed by the proposed workflow can be described as follows: first, geomorphologic surface feature extraction is performed to analyze the variability of roughness, slope, local topographic range and local topographic variability for each DEM cell. Next, unsupervised classification methods, in particular, k-means and GMM clustering are applied to quantify and map the topographic signatures of landslide and unfailed terrain by employing the aforementioned surface feature extractors. Subsequently, the airborne LiDAR-derived DEM is classified into various clusters, also known as classes. The number of clusters can be selected manually by the user and is dependent on the complexity of the terrain and landslides. Then, the user manually classifies the various clusters into landslide and unfailed terrain based on prior knowledge of the study area. Prior knowledge may come from existing or previously known landslide locations. Finally, to assess the performance of the unsupervised classification methods, an evaluation is performed in reference to the independently compiled landslide inventory map (detection validation). The workflow of the methodology is described in Figure 3, which outlines the process of the landslide detection and validation.

3.2. Landslide Surface Feature Extraction

Feature extraction is a type of dimensionality reduction that efficiently represents specific parts of an image or DEM as a compact feature vector [43]. It performs a neighborhood operation where a specified algorithm visits each cell of the raster and calculates an allotted value within a selected neighborhood. Optimal landslide readings are identified after altering window sizes, neighborhood types and feature extractors, as performed in our study, where several of each were evaluated. However, only the optimal results observed are shown.
To quantify topographic variations found in the terrain, a fixed window size of 39 × 39 was used to evaluate the local variability (a statistic measure of the standard deviation) of the surface features obtained from roughness, slope and local topographic range detailed below. Subsequently, the resulting local variability parameters were input in our unsupervised classification methods. A total of four feature extractors are analyzed in our evaluation.

3.2.1. Roughness

Determining the greatest difference between the center pixel and its neighborhood generates a value to describe the roughness of the surface terrain. This computation utilizes the following formula and a 3 × 3 cell as shown in Equation (1), R = Max(ZijZ11), where i = 0–2, j = 0–2 [7].
Z02  Z12  Z22
Z01  Z11  Z21
Z00  Z10  Z20

3.2.2. Slope

The slope of the surface is defined as the greatest rate of change among the center cell and the adjacent cells. Calculating the value of the sharpest gradient of a DEM can evaluate the slope. This can be done using Equation (1), and the formula, S D 8 = max [ Z i j Z 11 h φ ( i j ) ] , where, i = 0–2, j = 0–2. Use the value of φ(ij) = 1 for the cardinal directions (north, south, east and west) and φ(ij) = 2 for diagonally adjacent cells [7].

3.2.3. Local Topographic Range

The local topographic range describes the difference between the highest and lowest elevations of a local neighborhood. This is essentially the range of elevations for the particular section of the surface, which can be evaluated using Equation (1), and the following formula: Range = Max(Zij) − Min(Zij), where i = 0–2, j = 0–2.

3.2.4. Local Topographic Variability

Local topographic variability assesses the standard deviation of local neighborhoods in a DEM. This technique is applied to the pure surface elevation data and is used as an input parameter in our unsupervised classification techniques. A fixed window size of 39 × 39 was used in our evaluation.

3.3. Clustering Methods

In the unsupervised k-means clustering method, any individual data point is clustered based on similarity [44]. A map of all data points in the DEM, classified by which cluster each data point belongs to is produced [32]. The goal of the k-means algorithm is to group the data by iteratively assigning each data point to one of the clusters based on similarities. Some of the advantages of k-means clustering is that it is simple and efficient. Some drawbacks are that it does not develop an optimal number of clusters, does not provide association to a cluster based on likelihood and is sensitive to the scale of the input data. This classification method was tested using a class setting from two through five. A second common unsupervised classification model used for data classification is a GMM clustering method. GMMs cluster data based on assigning each data point to a cluster that will maximize the statistical probability that a hypothesis is true, relative to the data set. Clusters for GMM are defined as Gaussian distributions that are centered on their barycenters [33]. GMM clustering is flexible because it has the option of hard or soft/fuzzy clustering [45]. Hard clustering is when one data point is assigned to exactly one cluster, whereas soft/fuzzy clustering is where each data point is assigned a score for each cluster, representing the probability of it belonging to the latter. Although, the option of hard or soft/fuzzy clustering is available, a hard clustering approach was followed. GMM employs model clustering as a mixture of multivariate normal density components [46]. Some of the advantages of GMM clustering is that it is efficient and flexible. Some disadvantages are that the user manually sets the number of clusters that the algorithm will fit and that the approach assumes a normal distribution across dimensions. This classification method was tested using a class setting from two through five.
Both methods were tested to compare their classification performance when delineating surface features extracted from a LiDAR-derived DEM. Although, GMM clustering is more complex than k-means clustering, the classification outcomes are expected to be similar based on the fact that k-means clustering is a form of GMM clustering.

3.4. Accuracy Assessment

The accuracy assessment method used is the confusion matrix, which will provide an evaluation of the unsupervised methods tested [47,48]. The confusion matrix provides assessment methods, specifically: accuracy (AC), true positive (TP), false positive (FP), true negative (TN), false negative (FN), and precision (P) [49]. AC is the overall performance of the unsupervised clustering method, in other words, how often does the algorithm correctly identify landslide and non-landslide terrain. The positive/negative portion of the labels refer to the identification of the terrain: positive for landslide terrain and negative for non-landslide terrain. The true/false nomenclature indicates whether the clustering correctly identified the terrain: true for correct identification and false for incorrect identification. For example, FP means that an area was incorrectly identified as landslide terrain. In other words, it was false that the terrain exhibited landslide surface features, and thus in reality a non-landslide area. FP is known as a type I error, while FN is known as a type II error. A type II error is more severe as it neglects to identify a landslide, and may potentially lead to severe damage to structures built on top under the assumption that it was safe from any sliding. The confusion matrix is used to compare the percentage of matching terrain between the algorithm mapped areas and the landslide inventory map. The algorithm mapped terrain in this step would be the results from the k-means and GMM clustering techniques. It is noted that each resulting classification map from the unsupervised classifiers need to be designated landslide or non-landslide manually.

4. Results and Discussion

For each of the four topographic signatures extracted, two to five classes are evaluated by applying GMM and k-means clustering. However, only a sample based on each technique was selected and shown. After clustering the data from the feature extractors, an evaluation process of selecting which group (landslide or non-landslide) the various classes pertain to is performed manually. Figure 4 and Figure 5 demonstrate the process, it begins with the features being extracted (Figure 4A and Figure 5E), followed by the clustering (Figure 4B and Figure 5F), then the manual designation of each cluster to a landslide or non-landslide group (Figure 4C and Figure 5G), and finally the process ends with a comparison between algorithm-mapped landslide locations and the inventory-mapped landslides (Figure 4D, and Figure 5H). Figure 4 demonstrates the results and process based on the GMM clustering method after applying the local topographic range feature extractor and clustering the data into five different groups. Figure 5 shows the results obtained from the roughness feature extractor, clustering the data into 3 classes, and by applying the k-means clustering method. In Figure 4D and Figure 5H the locations marked in gray signify correctly mapped areas (TP and TN), while the black define incorrectly mapped locations (FP and FN). The confusion matrix results for Figure 4 are shown in Table 1, while the results for Figure 5 are shown in Table 2. The evaluation process was performed similarly for all feature extractors (roughness, slope, local topographic range and local topographic variability) that were evaluated, where two through five clusters were examined by applying both the GMM and k-means clustering methods. In general, the process is the same for both algorithms, other than the two different unsupervised classification clustering methods tested (k-means and GMM).
Table 1 and Table 2 display the confusion matrix results from the feature extractors tested with their corresponding classes. Shown in Table 1 are the results obtained by applying the GMM clustering, and in Table 2 are those based on k-means clustering. Two important factors analyzed from the confusion matrix are AC and FN. AC is the overall matching percentage between algorithm-mapped locations and the landslide inventory map. Thus, a higher AC indicates that most locations were mapped correctly. However, FN should be minimized due to the fact that it defines falsely identified landslide areas as non-landslide. FN areas can be hazardous as it may define an area as stable, when in reality it is not. FN values are inversely related to TP, by minimizing FN it ensures a higher TP value. It is noted that the best results do not necessarily reflect the lowest possible FN values. In our case, some of the data shows that the AC for the lowest FN values are lower than acceptable. The results may have been impacted by an over classification that resulted in a low FN; however, the AC classification performance is lower than desired (43.69% and 54.54%, see Table 1 and Table 2, respectively). Therefore, the results must be carefully evaluated and an overall balance must be found amongst the confusion matrix results.
In Table 2, the k-means clustering method demonstrates that the highest AC value for the slope feature extractor is 85.47% with an FN value of 13.95%. The slope feature with four clusters, yielded an AC of 85.45% and a FN value of 8.45%. It did comparatively better, and performed similarly as the roughness, local topographic variability and local topographic range features. When comparing AC values of different number of classes within each feature extractor, results were generally within ±2% of each other. The only two exceptions to this is the local topographic variability where AC values ranged from approximately 72% to 85%, and slope from approximately 55% to 85%. Two of the best performing results were the local topographic range and roughness feature extractors with 3 clusters. The k-means method with the roughness feature extractor and with three clusters achieved an AC of 86.28% and an FN of 6.30%, see Table 2. The FN value was 0.19% higher than that found through the local topographic range filter with three clusters, which on its own, is not significantly different. The AC value was 0.28% more than local topographic range, in this instance it is slightly more accurate.
When comparing TP and FN values, GMM performed differently than k-means clustering. Using GMM clustering, approximately 75% of all values had a FN value equal to or less than 10% compared to the 44% that passed the same criteria using k-means clustering. The opposite is true with AC values, where 50% of values found through k-means analysis were over 86% accurate, compared to the 25% of GMM values with the same cut-off value. This data shows that the GMM clustering method had a higher performance when classifying landslides than k-means clustering, but was not done as accurately, therefore, there was an over classification.
The roughness and local topographic range feature extractors performed similarly amongst all clusters in the GMM analysis, see Table 1. The FN values were all under 9% and had AC values in the 82% range. These results were generally better than those found through slope and local topographic variability. For local topographic range and roughness, clusters of four and five had an AC of at least 86% while clusters of 2 and 3 were slightly lower, closer to approximately 82%. The FN values were 2 to 3% higher in the larger number of clusters than in the lower number of clusters. Again, the difference in AC gives a slightly higher FN value in these results by not overclassifying. From the GMM analysis, one of the top-performing results was from the range filter with 5 classes having an AC of 86.50% and an FN of 7.31%.
The algorithms that showed the best performance had similarities in their landslide classified maps (see Figure 4 and Figure 5). The locations detected as landslide were areas that displayed rough surfaces, while areas that were undetected were smooth. This is evident in Figure 4A and Figure 5E, and is an important step within the proposed approach. There needs to be a difference observed when the surface feature extractors are applied between landslide and unfailed terrain, otherwise, the unsupervised classification algorithms will have difficulties in delineating the two. Areas identified as having high topographic variability coincide with those mapped in the landslide inventory map, validating the suggested approach and its likelihood to detect landslide terrain (see Figure 4 and Figure 5). Although, the proposed approach performs well, there are a few limitations that occur. The first clear drawback is shown in areas where there are sharp edges in the surface. The algorithm over classifies these locations as being landslide, and although these locations are on the landslide limits, not all locations are landslide, and are incorrect predictions by the approach. In our study area, sharp edge locations that incline to be misclassified as landslide, include top and toe of slopes (see Figure 4D and Figure 5H). Therefore, any abrupt change in elevation will be classified as landslide (e.g., roads along hillslopes, bluffs, narrow valley bottoms, etc.). Conversely, the approach tends to overlook topographic signatures that have endured erosive processes or terrain improvements that mimic unfailed surfaces. Nonetheless, the performance of the classification results for both unsupervised methods were similar, as expected.
Landslides, in general, experience numerous activity levels, and have various ages, so the landslides will typically endure different levels of post-failure changes. Typically, soil transport will probably subdue the topographic signatures of old landslides, minimizing the local topographic variability and making them challenging to detect. For example, our approach overlooks the smooth topography in the Southeast corner of Figure 4D and Figure 5H. The smooth topography of the area is caused by the age of the landslide being ancient [10], and may be also caused by man-made improvements that have impacted the landscape of the area.
Despite the misclassifications observed, our results illustrate that the proposed landslide mapping approach can produce an accurate landslide map of our study area. The topographic signatures in Figure 4A and Figure 5E, indicate that the landslide signatures are similar in our study area. The clusters of the landslide signatures in Figure 4B,C and Figure 5F,G, specify that the topographic variability contained within the landslide can be delineated and grouped. Finally, Figure 4D and Figure 5H, quantify the performance and support that landslide mapping can be performed with high confidence from the proposed approach (See Table 1 and Table 2 for confusion matrix results). The applicability and reliability of the proposed approach is demonstrated throughout the study area by evaluating the results as a landslide inventory, assessing the sensitivity of the approach to changes in input parameters, such as; number of clusters and feature extractors. In addition, we explored how the different clustering methods impacted the resulting landslide inventory maps.
A thorough evaluation would be incomplete without recommending the preferred surface feature extractor, the number of clusters required and the unsupervised classification algorithm needed to classify deep-seated landslides with high-confidence. The preferred surface feature extractors for both algorithms are roughness and local topographic range (see Table 1 and Table 2). Both of these surface feature extractors perform well for all cluster sizes tested (2–5). They maximize the TP and FN performance for both k-means and GMM classification algorithms. When applying the same unsupervised classification algorithm amongst both surface feature extractors they have similar performance. The performance related to the number of clusters needed differs based on the surface feature extractor and unsupervised classification algorithm tested. Higher fluctuations in performance is seen across the k-means results shown in Table 2 and the performance outcomes vary based on the surface feature extractor evaluated and number of clusters chosen. This fluctuation shown may be a drawback of the simplicity of the k-means clustering algorithm. The GMM clustering method demonstrates results where a pattern is more clearly defined and can be deciphered, especially amongst the roughness and local topographic range surface features. Since these two feature extractors perform the best we will focus on those two clustering results. To maximize the performance of the algorithm a cluster size of 4 and 5 will increase the performance for the GMM clustering method and a cluster size of 3 and 5 for the k-means clustering technique. Given that a drawback was seen earlier in the k-means clustering method that leads to results that fluctuate, the GMM clustering method would be the preferred unsupervised technique.
Landslides in the Carlyon Beach Peninsula have caused a major impact on human life, infrastructure and the economy. As a result, modern geospatial mapping technologies, and contemporary classification algorithms were applied to detect landslides affecting the area. By applying the unsupervised classification algorithms; k-means, and GMM clustering, we were able to group/cluster topographic signatures revealed through feature extraction on the LiDAR-derived DEM. Furthermore, we were able to identify the following: (1) stable terrain with smooth surface features, and (2) landslide terrain with rough surface features. These results support prior findings that describe landslide terrain with high topographic variations and unfailed terrain with low topographic variations [6,7,10].

5. Conclusion

The purpose of the proposed semi-automatic approach was to evaluate techniques that fuse feature extraction and unsupervised classification to identify areas where deep-seated landslides have occurred to aid landslide mapping. The core idea is that the method will be able to rapidly perform an evaluation of a LiDAR-derived DEM and generate a landslide inventory map that may be comparable to that of an expertly mapped landslide inventory.
Two semi-automatic methods are presented to support the initial process of landslide mapping. The methods were evaluated using a LiDAR-derived DEM of the Carlyon Beach Peninsula. Qualitative and quantitative evaluations were made from the results, producing the following conclusions: (1) landslide scars associated with past deep-seated landslides may be identified using DEMs with unsupervised classification models; (2) feature extractors allow for individual analysis of specific topographic signatures; (3) unsupervised classification can be performed on each topographic signature using multiple number of clusters; (4) comparison of documented landslide prone regions to algorithm mapped regions show that algorithmic classification can accurately identify areas where deep-seated landslides have occurred. The conclusions of this study can be summarized by stating that unsupervised classification mapping methods and airborne LiDAR-derived DEMs can offer important surface information that can be used as effective tools for digital terrain analysis to support landslide detection.
Compared to previous studies, this study did not require substantial prior information for training a supervised classification algorithm successfully, which is an advantage. Yet, the classification results from k-means and GMM clustering are able to attain an accuracy up to 87% when compared to the landslide inventory map. Both unsupervised classification methods displayed comparable performance statistically and visually when inspecting manually the classified landslide map.
From the observations, it can be said that unsupervised classification algorithms fused with proper feature extraction procedures can support landslide mapping when prior information is unknown and/or a landslide sample is unavailable for training. As a result, modern techniques are able to detect landslide terrain using DEMs in a time-effective manner that is affordable and accessible. It is not to say that the proposed approach is without limitations, therefore, future recommendations include; (1) the use of a larger dataset for testing, (2) the evaluation of additional unsupervised classification algorithms, and (3) the implementation of several other feature extractors. These suggestions may help determine if the results can be improved, the techniques are robust and can be employed to other regions.
It is noted that in most cases, especially in areas that are uninhabited, there is no prior knowledge of landslide hazards affecting the habitat. For this reason, it is projected that the proposed approach in this paper will play a significant role in the initial process of landslide mapping.

Author Contributions

C.J.T. and O.E.M. conceived and designed the experiments; C.J.T. performed the experiments; C.J.T., O.E.M., J.V.F. and M.G.L. analyzed the experimental results; C.J.T., O.E.M. and J.V.F. contributed figures/materials; C.J.T., O.E.M. and J.V.F. wrote the paper.

Funding

This research received no external funding.

Acknowledgments

The authors wish to acknowledge Tin Lieu, Joy Sellman and Alaeddin Slayyeh for their contributions and support throughout this project.

Conflicts of Interest

The authors declare no conflict of interest.

References

  1. Ahmed, B.; Rahman, M.; Islam, R.; Sammonds, P.; Zhou, C.; Uddin, K.; Al-Hussaini, T. Developing a dynamic Web-GIS based landslide early warning system for the Chittagong Metropolitan Area Bangladesh. ISPRS Int. J. Geo-Inf. 2018, 7, 485. [Google Scholar] [CrossRef]
  2. Lu, P.; Stumpf, A.; Kerle, N.; Casagli, N. Object-oriented change detection for landslide rapid mapping. IEEE Geosci. Remote S. 2011, 8, 701–705. [Google Scholar] [CrossRef]
  3. Song, Y.; Niu, R.; Xu, S.; Ye, R.; Peng, L.; Guo, T.; Li, S.; Chen, T. Landslide susceptibility mapping based on weighted gradient boosting decision tree in Wanzhou section of the Three Gorges Reservoir Area (China). ISPRS Int. J. Geo-Inf. 2019, 8, 4. [Google Scholar] [CrossRef]
  4. Effat, H.A.; Hegazy, M.N. Mapping landslide susceptibility using satellite data and spatial multicriteria evaluation: The case of Helwan District, Cairo. Appl. Geomatics 2014, 6, 215–228. [Google Scholar] [CrossRef]
  5. Dalyot, S.; Keinan, E.; Doytsher, Y. Landslide morphology analysis model based on LiDAR and topographic dataset comparison. Surv. Land Inf. Sci. 2008, 68, 155–170. [Google Scholar]
  6. McKean, J.; Roering, J. Objective landslide detection and surface morphology mapping using high-resolution airborne laser altimetry. Geomorphology 2004, 57, 331–351. [Google Scholar] [CrossRef]
  7. Mora, O.E.; Liu, J.K.; Lenzano, M.G.; Toth, C.K.; Grejner-Brzezinska, D.A. Small landslide susceptibility and hazard assessment based on airborne lidar data. Photogramm. Eng. Rem. S 2015, 81, 239–247. [Google Scholar] [CrossRef]
  8. Mora, O.E.; Liu, J.K.; Lenzano, M.G.; Toth, C.K.; Grejner-Brzezinska, D.A.; Fayne, J.V. Landslide Change Detection Based on Multi-Temporal Airborne LiDAR-Derived DEMs. Geosciences 2018, 8, 23. [Google Scholar] [CrossRef]
  9. Reichenbach, P.; Rossi, M.; Malamud, B.; Mihir, M.; Guzzetti, F. A review of statistically-based landslide susceptibility models. Earth Sci. Rev. 2018, 180, 60–91. [Google Scholar] [CrossRef]
  10. Booth, A.M.; Roering, J.J.; Perron, J.T. Automated landslide mapping using spectral analysis and high-resolution topographic data: Puget Sound lowlands, Washington, and Portland Hills, Oregon. Geomorphology 2009, 109, 132–147. [Google Scholar] [CrossRef]
  11. Glenn, N.F.; Streutker, D.R.; Chadwick, D.J.; Thackray, G.D.; Dorsch, S.J. Analysis of LiDAR-derived topographic information for characterizing and differentiating landslide morphology and activity. Geomorphology 2006, 73, 131–148. [Google Scholar] [CrossRef]
  12. Mora, O.E.; Lenzano, M.C.; Toth, C.K.; Grejner-Brzezinska, D.A. Analyzing the Effects of Spatial Resolution for Small Landslide Susceptibility and Hazard Mapping. 2014. Available online: https://www.int-arch-photogramm-remote-sens-spatial-inf-sci.net/XL-1/293/2014/isprsarchives-XL-1-293-2014.pdf (accessed on 13 April 2019).
  13. Mezaal, M.R.; Pradhan, B. An improved algorithm for identifying shallow and deep-seated landslides in dense tropical forest from airborne laser scanning data. CATENA 2018, 167, 147–159. [Google Scholar] [CrossRef]
  14. Pawluszek, K.; Borkowski, A.; Tarolli, P. Sensitivity analysis of automatic landslide mapping: Numerical experiments towards the best solution. Landslides 2018, 15, 1–15. [Google Scholar] [CrossRef]
  15. Si, A.; Zhang, J.; Tong, S.; Lai, Q.; Wang, R.; Li, N.; Bao, Y. Regional Landslide Identification Based on Susceptibility Analysis and Change Detection. ISPRS Int. J. Geo-Inf. 2018, 7, 394. [Google Scholar] [CrossRef]
  16. Sun, X.; Chen, J.; Bao, Y.; Han, X.; Zhan, J.; Peng, W. Landslide Susceptibility Mapping Using Logistic Regression Analysis along the Jinsha River and Its Tributaries Close to Derong and Deqin County, Southwestern China. ISPRS Int. J. Geo-Inf. 2018, 7, 438. [Google Scholar] [CrossRef]
  17. Borkowski, A.; Perski, Z.; Wojciechowski, T.; Jozkow, G.; Wojeik, A. Landslides Mapping in Roznow Lake Vicinity, Poland Using Airborne Laser Scanning Data. Available online: https://www.irsm.cas.cz/materialy/acta_content/2011_03/14_Borkowski.pdf (accessed on 13 April 2019).
  18. Shrestha, S.; Kang, T.S.; Suwal, M.K. An Ensemble Model for Co-Seismic Landslide Susceptibility Using GIS and Random Forest Method. ISPRS Int. J. Geo-Inf. 2017, 6, 365. [Google Scholar] [CrossRef]
  19. Bardarella, M.; Di Benedetto, A.; Finai, M.; Guida, D.; Lugli, A. Use of DEMs Derived from TLS and HRSI Data for Landslide Feature Recognition. ISPRS Int. J. Geo-Inf. 2018, 7, 160. [Google Scholar] [CrossRef]
  20. Fayne, J.V.; Ahamed, A.; Roberts-Pierel, J.; Rumsey, A.C.; Kirschbaum, D. Automated Satellite-Based Landslide Identification Product for Nepal. Earth Interact. 2019, 23, 1–21. [Google Scholar] [CrossRef]
  21. Pawluszek, K.; Borkowski, A. Impact of DEM-derived factors and analytical hierarchy process on landslide susceptibility mapping in the region of Rożnów Lake, Poland. Nat. Hazards 2017, 86, 919–952. [Google Scholar] [CrossRef]
  22. Tarolli, P.; Sofia, G.; Dalla Fontana, G. Geomorphic features extraction from high-resolution topography: Landslide crowns and bank erosion. Nat. Hazards 2012, 61, 65–83. [Google Scholar] [CrossRef]
  23. Bardi, F.; Raspini, F.; Ciampalini, A.; Kristensen, L.; Rouyet, L.; Lauknes, T.; Frauendelder, R.; Casagli, N. Space-borne and ground-based InSAR data integration: The Åknes test site. Remote Sens. 2016, 8, 237. [Google Scholar] [CrossRef]
  24. Shan, J.; Toth, C.K. Topographic Laser Ranging and Scanning: Principles and Processing; CRC Press: Boca Raton, FL, USA, 2018. [Google Scholar]
  25. Jaboyedoff, M.; Oppikofer, T.; Abellán, A.; Derron, M.H.; Loye, A.; Metzger, R.; Pedrazzini, A. Use of LIDAR in landslide investigations: A review. Nat. Hazards 2012, 61, 5–28. [Google Scholar] [CrossRef]
  26. An, H.; Kim, M.; Lee, L. Survey of spatial and temporal landslide prediction methods and techniques. Korean J. Agric. Sci. 2016, 43, 507–521. [Google Scholar]
  27. Leshcinsky, B.A.; Olsen, M.J.; Tanyu, B.F. Contour Connection Method for automated identification and classification of landslide deposits. Comput. Geosci. 2015, 74, 27–38. [Google Scholar] [CrossRef]
  28. Cheng, G.; Guo, L.; Zhao, T.; Han, J.; Li, H.; Fang, J. Automatic landslide detection from remote-sensing imagery using a scene classification method based on BoVW and pLSA. Int. J. Remote Sens. 2013, 34, 45–59. [Google Scholar] [CrossRef]
  29. Hölbling, D.; Friedl, B.; Eisank, C. An object-based approach for semi-automated landslide change detection and attribution of changes to landslide classes in northern Taiwan. Earth Sci. Inform. 2015, 8, 327–335. [Google Scholar] [CrossRef] [Green Version]
  30. Dou, J.; Bui, D.T.; Yunus, A.P.; Jia, K.; Song, X.; Revhaug, I.; Xia, H.; Zhu, Z. Optimization of causative factors for landslide susceptibility evaluation using remote sensing and GIS data in parts of Niigata, Japan. PLoS ONE 2015, 10, 133262. [Google Scholar] [CrossRef] [PubMed]
  31. Sarkar, S.; Kanungo, D.P.; Patra, A.K.; Kumar, P. GIS based spatial data analysis for landslide susceptibility mapping. J. Mt. Sci. 2008, 5, 52–62. [Google Scholar] [CrossRef]
  32. Seber, G.A. Multivariate Observations; John Wiley & Sons: Hoboken, NJ, USA, 2004; Volume 252, pp. 347–394. [Google Scholar]
  33. Banfield, J.D.; Raftery, A.E. Model-Based Gaussian and Non-Gaussian Clustering. Available online: https://apps.dtic.mil/dtic/tr/fulltext/u2/a222097.pdf (accessed on 13 April 2019).
  34. Gorsevski, P.V.; Gessler, P.E.; Jankowski, P. Integrating a fuzzy k-means classification and a Bayesian approach for spatial prediction of landslide hazard. J. Geogr. Syst. 2003, 5, 223–251. [Google Scholar] [CrossRef]
  35. Gorsevski, P.V.; Jankowski, P.; Gessler, P.E. Spatial Prediction of Landslide Hazard Using Fuzzy k-means and Dempster-Shafer Theory. Trans. GIS 2005, 9, 455–474. [Google Scholar] [CrossRef]
  36. Borghuis, A.M.; Chang, K.; Lee, H. Comparison between automated and manual mapping of typhoon-triggered landslides from SPOT-5 imagery. Int. J. Remote Sens. 2007, 28, 1843–1856. [Google Scholar] [CrossRef]
  37. Melchiorre, C.; Matteucci, M.; Azzoni, A.; Zanchi, A. Artificial neural networks and cluster analysis in landslide susceptibility zonation. Geomorphology 2008, 94, 379–400. [Google Scholar] [CrossRef]
  38. Naidu, S.; Sajinkumar, K.S.; Oommen, T.; Anuja, V.J.; Samuel, R.A.; Muraleedharan, C. Early warning system for shallow landslides using rainfall threshold and slope stability analysis. Geosci. Front. 2018, 9, 1871–1882. [Google Scholar] [CrossRef]
  39. Slaughter, S.L.; Burns, W.J.; Mickelson, K.A.; Jacobacci, K.E.; Biel, A.; Contreras, T.A. Protocol for landslide inventory mapping from lidar data in Washington State. Wash. Geol. Surv. Bull. 2017, 82, 27. [Google Scholar]
  40. Burns, W.J.; Madin, I.A. Protocol for Inventory Mapping of Landslide Deposits from Light Detection and Ranging (LiDAR) Imagery; Oregon Department of Geology: Oregon, OR, USA, 2009; p. 23. [Google Scholar]
  41. GeoEngineers. Report, Phase I-Reconnaissance Evaluation, Carlyon Beach/Hunter Beach Landslide; Thurston County: Washington, DC, USA, 1999. [Google Scholar]
  42. GeoEngineers. Report, Phase II-Reconnaissance Evaluation, Carlyon Beach/Hunter Beach Landslide; Thurston County: Washington, DC, USA, 1999. [Google Scholar]
  43. Lee, J.; Fisher, P.F.; Snyder, P.K. Modeling the effect of data errors on feature extraction from digital elevation models. Photogramm. Eng. Rem. S. 1992, 58, 1461–1467. [Google Scholar]
  44. Martha, T.R.; Kerle, N.; Van Westen, C.J.; Jetten, V.; Kumar, K.V. Segment optimization and data-driven thresholding for knowledge-based landslide detection by object-based image analysis. IEEE T. Geosci. Remote 2011, 49, 4928–4943. [Google Scholar] [CrossRef]
  45. Bilmes, J. A Gentle Tutorial of the EM Algorithm and its Application to Parameter Estimation for Gaussian Mixture and Hidden Markov Models. Available online: http://www.leap.ee.iisc.ac.in/sriram/teaching/MLSP_18/refs/GMM_Bilmes.pdf (accessed on 13 April 2019).
  46. McLachlan, G.; Peel, D. Finite Mixture Models; John Wiley & Sons, Inc.: New York, NY, USA, 2000; pp. 238–256. [Google Scholar]
  47. Lewis, H.G.; Brown, M. A generalized confusion matrix for assessing area estimates from remotely sensed data. Int. J. Remote Sens. 2001, 22, 3223–3235. [Google Scholar] [CrossRef] [Green Version]
  48. Schuldt, C.; Laptev, I.; Caputo, B. Recognizing human actions: A local SVM approach. In Proceedings of the 17th International Conference, Cambridge, UK, 26 August 2004. [Google Scholar]
  49. Visa, S.; Ramsay, B.; Ralescu, A.L.; Van Der Knaap, E. Confusion Matrix-based Feature Selection. MAICS 2011, 710, 120–127. [Google Scholar]
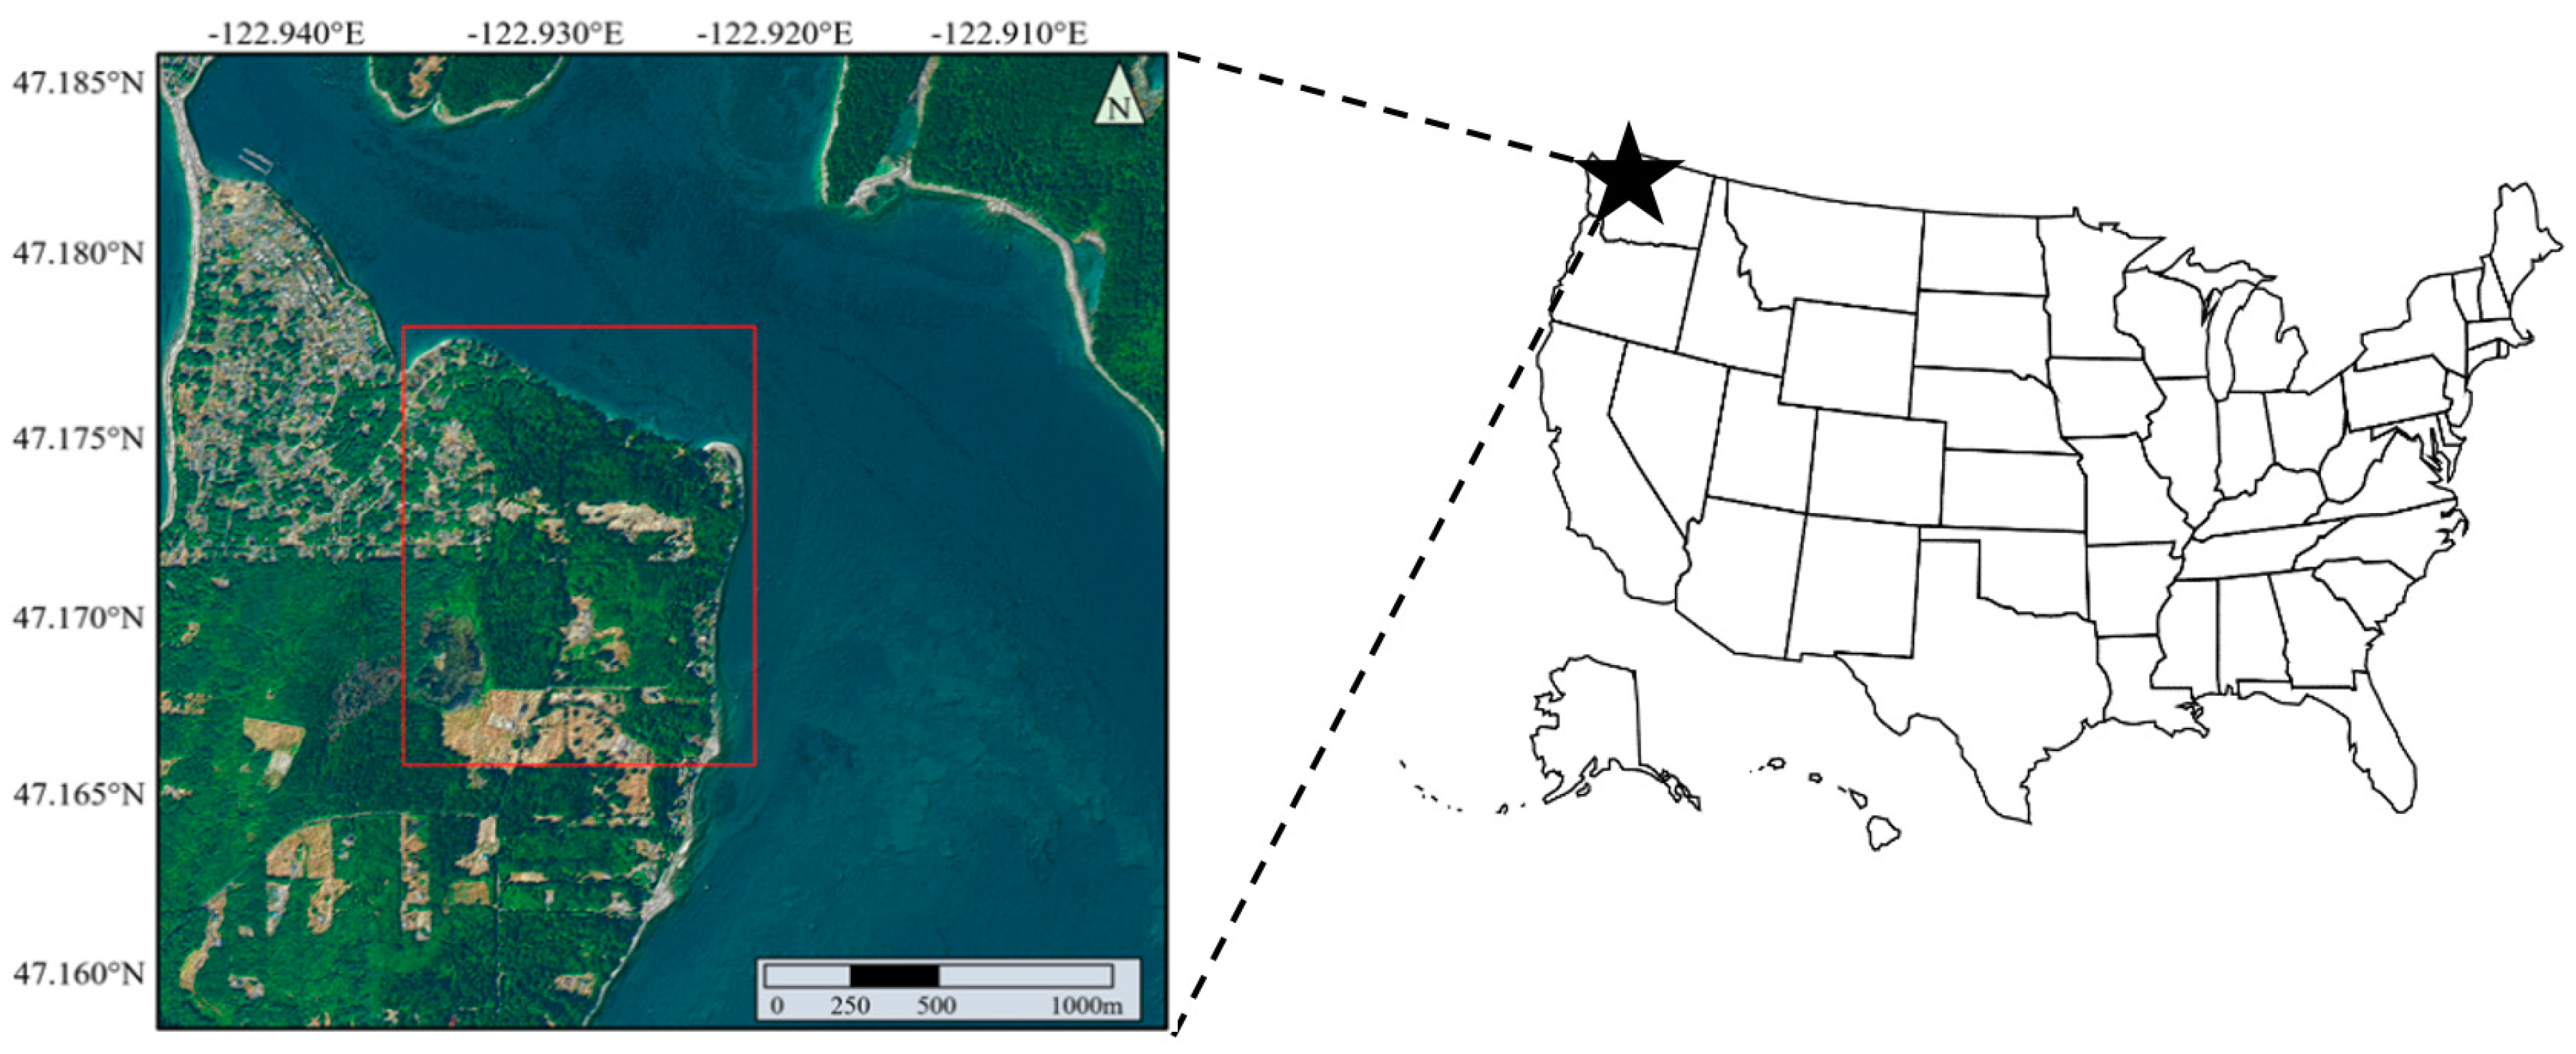
Figure 1. Vicinity map of the study area in Carlyon Beach, Washington. Part of the figure is from [10].
Geosciences 09 00221 g001
Figure 2. LiDAR-derived hillshade map of the Carlyon Beach Peninsula study area is shown on the left. The independently compiled landslide inventory map on the right shows the landslide (red) and unfailed (blue) terrain.
Geosciences 09 00221 g002
Figure 3. General unsupervised classification workflow to detect and map landslide surface features.
Geosciences 09 00221 g003
Figure 4. Gaussian mixture model (GMM) clustering by applying 5 classes and the local topographic range feature extractor. (a) Represents the results from the feature extractor; (b) GMM clustering results; (c) final landslide area estimate regenerated from *(b)* where red presents landslide and blue represents non-landslide; (d) comparison map between *(c)* and the landslide inventory map where grey areas are similar and black areas are different.
Geosciences 09 00221 g004
Figure 5. K-means clustering by applying 3 classes and the roughness feature extractor. (e) Represents the results from the feature extractor; (f) k-means clustering results; (g) final landslide area estimate regenerated from *(f)* where red presents landslide and blue represents non-landslide; (h) comparison map between *(g)* and the landslide inventory map where grey areas are similar and black areas are different.
Geosciences 09 00221 g005
Table 1. Confusion matrix results for GMM clustering method.
FeatureNO. ClustersAccuracy (%)True Positive (%)False Positive (%)True Negative (%)False Negative (%)Precision (%)
Roughness283.7095.3525.3474.664.6574.48
382.8295.5827.0872.924.4273.25
486.8491.8617.0682.948.1480.68
586.9291.4316.5883.428.5781.05
Slope243.69100.0100.000.0000.0043.69
384.3681.7513.6186.3918.2582.33
485.6390.9818.5381.479.0279.21
585.8188.6916.4283.5811.3180.73
Local Topographic Range282.8295.7927.2372.774.2173.18
385.6394.3021.0978.915.7077.62
486.3093.2719.1180.896.7379.11
586.5092.6918.3081.707.3179.71
Local Topographic Variability243.69100.0100.000.0000.0043.69
378.7990.4930.2869.729.5169.86
484.8977.159.1188.3122.8586.79
584.7180.0611.6987.5619.9484.16
Table 2. Confusion matrix results for k-means clustering method.
FeatureNO. ClustersAccuracy (%)True Positive (%)False Positive (%)True Negative (%)False Negative (%)Precision (%)
Roughness287.1987.9113.3786.6212.0983.60
386.2893.7019.4780.536.3078.87
487.0986.8112.6987.3113.1984.14
586.9891.1616.2683.748.8481.30
Slope254.5499.4280.2719.730.5849.00
383.8079.9813.2486.7620.0282.41
485.4591.5519.2880.728.4578.65
585.4786.0514.9485.0613.9581.72
Local Topographic Range287.2087.9613.3786.6112.0483.59
386.0093.8920.1379.876.1178.35
487.2288.2213.5576.4511.7883.47
586.7091.9219.3682.648.0880.43
Local Topographic Variability284.1281.0713.5186.4918.9382.31
372.2796.2946.3853.623.4261.69
484.0273.637.9292.0826.3887.83
585.0378.9310.2489.7621.0785.68