Abstract
In 2009, the European Guideline for Flexible Rockfall Protection Kits European Technical Approval Guideline 027 (ETAG 027) became valid. The aim of the guideline was to approve and certify steel barriers available on the market according to a common standard. In 2018, ETAG 027 was replaced by a so-called European Assessment Document (EAD). This contribution summarizes results and experiences that were obtained through the type testing, approval and assessment procedures of 66 protection systems evaluated between 2009 and 2018. Apart from the common main task of the barriers to stop falling blocks successfully, the different test conditions and constructions of barriers result in different performance characteristics. Some of these characteristics follow certain trends, whereas others show a wide range without any trend. In such a case, this contribution helps to classify a single system compared to the others.
1. Introduction
Today, flexible rockfall protection systems are efficient and effective solutions for protection from this natural hazard. However, this has not always been the case. In 1958, the first protection systems against rockfall were developed and brought to market [1]. In the following decades, the systems were increasingly accepted because they provided efficient protection while requiring only minor installation work in the field and having a low environmental impact.
Figure 1 illustrates a typical installation of a flexible rockfall protection system. The fence-like structure consists of steel posts that are kept in place through either clamped support or by upslope ropes. A mesh structure mostly made from steel is spanned between the posts along so-called longitudinal ropes. Special elements with pre-defined plastic deformational behaviors (so-called brake elements) are integrated into the ropes and absorb parts of the impacting block’s kinetic energy. Although the sketch in Figure 1 describes the principal setup of almost any system, the systems available on the market strongly differ regarding both their single components (posts, ropes, nets, energy-absorbing elements, etc.) and their composition. Generally, it can be stated that not a single system resembles any other. Therefore, we only can try to evaluate or compare all systems regarding some significant performance characteristics.
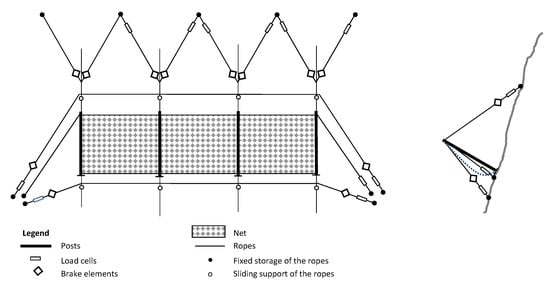
Figure 1.
Schematic structure of a flexible rockfall protection system spanning three fields (frontal and side view).
Special testing series on flexible rockfall fence structures strengthened the general trust in such systems [1,2,3,4,5]. On the other hand, the reported field tests showed that, for several reasons, it is not always possible to predict or guarantee the performance of such barriers. Nature delivers highly variable rockfall impacts regarding block mass, block shape, impact velocity, rotational velocity, and impact height. This variability makes it difficult to set up a system that fulfills all requirements. Even if some setups can be tested satisfactorily, others cannot be evaluated/assessed sufficiently and/or have to be left out. Further, testing is a difficult task because the intended impact of an artificially-released block on a slope is not easy to assess or predict. For many years the effectiveness of rockfall protection systems relied on simple testing or on empirical design [6].
1.1. History of Standardized Barrier Testing
With the increasing application of flexible rockfall protection systems, it became necessary to test the performance of the different available systems reliably and to ensure that their effectiveness was at least somewhat comprehensible and maybe even comparable. In this way, the ordering and installation of such structures can follow the standards of public procurement functions. Further, it is important to measure the loads accurately that act on the anchorage system that supports the net system, which in turn allows a sufficient design of the anchorages. Therefore, standardized testing procedures were needed.
In 2001, a guideline [7] was published in Switzerland that represented the first attempt worldwide of an official certification of a flexible rockfall protection system. The guideline managed to simplify the variability of natural rockfalls to a set of standard load cases with a fixed impact velocity, changing only the impacting mass to obtain different impact energies. The first experiences of using the guideline were described in [8,9], as well as in [10]. All type testing of barrier systems was conducted by the Swiss Federal Institute for Forest, Snow and Landscape Research (WSL) at the request of the Swiss Commission for Avalanches and Rockfall (EKLS). Testing took place at WSL’s testing site in Walenstadt, Switzerland. After successful testing, a certificate was issued by the Federal Office for the Environment (FOEN) and listed on the FOEN’s website [11], grouped into Energy Classes 1–9 according to the tested maximum impact energy ranging from 100–5000 kJ. In total, 28 different barrier systems were certified between 2001 and 2018. The Swiss guideline was withdrawn in Spring 2018, owing to the transition to the European guideline (see below).
Following the Swiss guideline, the European Union published the European Technical Approval Guideline 027 (ETAG 027 [12]), which became valid in 2008. The European technical approval, according to the Construction Products Directive (CPD 89/106/EEC [13]), realized a technical assessment of the fitness for use of a construction product and the technical specification of the assessed product, This served as basis for the CE marking of this product if a harmonized standard according to the Directive was not available. The testing procedures and first experiences following the implementation of ETAG 027 were described in [14]. Until the end of the validity of the CPD in 2013, a total of 39 barrier systems were approved for Energy Classes 0–8, ranging from 100 to more than 4500 kJ as the maximum impact energy. The aim of the approval process was to harmonize assessment methods for a given system. Several institutions were involved in the process: after successful type testing and factory production control, conducted by a testing body and an inspection body, respectively, a Technical Approval Body (TAB) issues a European Technical Approval (ETA) after the draft ETA has circulated among all other EOTA members and has been accepted by them. A notified body then checks whether all requirements are fulfilled so that a manufacturer can label a product with a CE mark. The ETA is valid for five years.
In 2011, the Construction Product Regulation (CPR [15]) replaced the CPD and became valid on 1 July 2013. The construction products that are not covered by harmonized standards are now assessed instead of approved. Successfully-assessed systems still obtain an ETA, but now “A” stands for “Assessment” instead of “Approval”. The underlying guidelines are called European Assessment Documents (EAD). ETAssessments have an unlimited validity duration. ETApprovals with a five-year validity can be converted to ETAssessments. To the authors’ knowledge, in total, 28 ETApprovals have been converted into ETAssessments. In the following sections of this article, this contribution often relates to both approved and assessed barriers; for brevity, the word “tested” is used instead of “approved/assessed”, unless only one of the two variants is appropriate.
Because of the lack of a special EAD for flexible rockfall protection kits, ETAG 027 was still used for this purpose until November 2018. In total, 27 rockfall protection kits were assessed between 2013 and 2018. In 2018, the EAD 340059-00-0106 [16] finally was published by the European Commission and came into force, replacing ETAG 027.
In comparison to ETAs issued according to the CPD, those issued according to the CPR only stand for a successful assessment of so-called essential characteristics of a product; the product has to comply with its so-called declaration of performance. Former approvals according to CPD likewise contained some information for designers or clients, such as how to deal with changes to installations for individual situations in the field or how to design foundations.
At first glance, the technical contents of the testing procedures described in the Swiss and European guidelines look rather similar. However, a detailed comparison reveals some differences. For example, examinations according to the Swiss guideline register the work power that is needed to restore a barrier after a test with 50% of the maximum impact energy level and check the documentation regarding whether the installation of a system is feasible and can be completed error-free. The European guideline prescribes two sequential impacts (33% of maximum energy level) onto the same net position and demands a factory production control to ensure the consistency of product performance. Barrier testing according to the Swiss guideline requires vertically-free-falling blocks impacting a barrier mounted to a (nearly) vertical rock face, whereas the European guideline also allows inclined and horizontal impacts. The common features and differences between the Swiss and the European guidelines are presented in [17].
1.2. Scope and Contents
As written above, all ETA drafts are circulated among the EOTA members during a so-called commenting period. Often, not only the ETAs are sent around, but also so-called Evaluation Reports (ER). The latter contain some more testing results and details on the testing procedures as listed in an ETA. This circulation procedure allows a TAB (= member of EOTA) to extract and collect individual significant characteristics of a tested protection system. If done for all the 66 systems successfully tested between 2009 and 2018, the resulting dataset can be used in a statistical analysis, such as that presented by [10] regarding barriers that were tested according to the Swiss guideline. Such datasets are kept confidential unless a company publishes its ETAs. However, in some cases, the large amount of data hides the details of single systems, and data privacy can therefore be maintained.
The various tested systems and their testing conditions are summarized in the following section. In Section 3, the overall performance of the systems is evaluated. Section 4 consists of a discussion of some (known) issues regarding the current test procedures, which might be worth considering for future developments in standardized testing of flexible barrier systems. If one considers [14] as a kind of introduction to ETAG 027, this article can be seen as the corresponding summary of the conclusions about the ETAG 027 period. It shows the outcomes that are obtained if a guideline sets certain boundary conditions. It further gives an impression to clients of what characteristics a product has with respect to the original guideline. In addition, as pointed out in Section 4 and Section 5, this article helps clients understand future offers of flexible rockfall protection systems according to the new EAD 340059-00-0106 [18] that became valid in November 2018.
2. Overview of Tested Systems
All valid ETAssessments of the 66 flexible rockfall protection systems tested according to ETAG 027 are listed on the EOTA website [19]. It is known that there are more protection systems available on the market, but that do not have a valid ETA.
During the period when ETAG 027 was used for approval or assessment, ten different manufacturers/producers of flexible rockfall protection systems obtained approval or assessment. This means that, on average, 6.6 different systems per manufacturer were tested. Some manufactures had a single system tested, whereas the maximum number of tested systems from a single manufacturer was 17.
When speaking of tested systems, the mentioned tests are usually related to the impact of a single block within the center of the middle field of a barrier consisting of three fields, as sketched in Figure 1. The block’s shape, density, size, and minimum impact speed are defined in the corresponding regulations. A test usually is quantified by the level of the kinetic energy of the impacting block. The ETAG 027 distinguishes between a Maximum Energy Level (MEL) and a Service Energy Level (SEL). The SEL test foresees two subsequent impacts of the same block without any repair works in between. The classification of the tested systems into the energy classes defined in ETAG 027 are shown in Figure 2. Most of the systems have an MEL of 500 kJ. The energy class “>4500 kJ” has 12 members because it covers a wide energy spectrum with different impact MELs, ranging from 5040 kJ to 10,400 kJ. There is no system listed in the class “4500 kJ” because, on the one hand, no manufacturer asked for an assessment of its barrier within this class and, on the other hand, as soon as the MEL is even slightly greater than 4500 kJ, the system can be listed within the highest energy class “>4500 kJ”. Therefore, the class “4500 kJ” has been rated in this context as non-existent and there are, on average, 8.3 systems tested per energy class. This gives an impression of the large variety of systems the market offers to the clients.
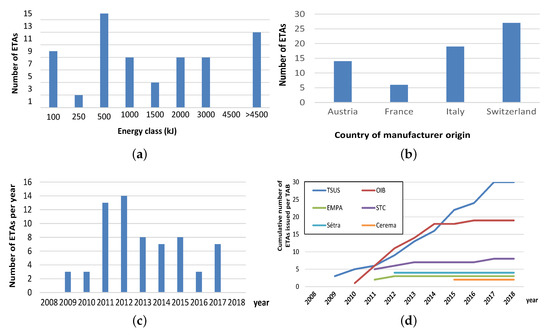
Figure 2.
Issued ETAs (a) sorted according to their energy class, (b) sorted according country of origin, (c) sorted per reference year (year of ETA document number), and (d) linked to the handling Technical Approval Body (TAB) located in Slovakia (TSUS), Austria (OIB), Switzerland (EMPA), France (Setra, Cerema) and Italy (STC).
The geographical distribution of the manufacturers of the tested systems, which ranged from 6 (France) to 27 (Switzerland) per country, is shown in Figure 2b. All systems originate from only four European countries, i.e., so far, there are no barriers from overseas tested for CE marking. The years when ETAs were issued are presented in Figure 2c, where year corresponds to the official document number of the ETAs [19], in which the first two digits indicate the reference year. Most of the systems received their ETA during 2011 or 2012.
In principle, every member state of EOTA has at least one designated TAB that can issue an ETA if the TAB is nominated for product area 34 (see [9] Annex IV for a list of product areas). However, manufacturers are also free to choose TABs in other countries, and this is visible in Figure 2d: ETAs are issued by six TABs located in five countries. The “Building Testing and Research Institute” (TSUS) from Slovakia issued the most ETAs even though no manufacturer is situated there, and four of the TABs issued only a few ETAs.
Aiming for an ETA is a technical procedure that requires a large administrative effort. Therefore, a relatively long time can pass before a manufacturer receives a valid ETA even if the product itself would be ready to be sold sooner. Figure 3 features three boxplots indicating the time needed to have a first draft of an ETA ready for circulation, for all EOTA members, and the time required for the circulation and iterations. The median value for circulation is 116 days, and there are 1.35 iterations on average. A maximum of three iterations was observed. The median time between a successful MEL test and the issuing of an ETA is 371 days. The fastest approval/assessment procedure took 35 days, including four weeks for the commenting period. The longest durations were more than four years. The reason for such long periods is mostly that the MEL test took place long before the manufacturer decided to apply for an ETA for the corresponding system. Witnessing of the test by a TAB still has to be solved in such a case.
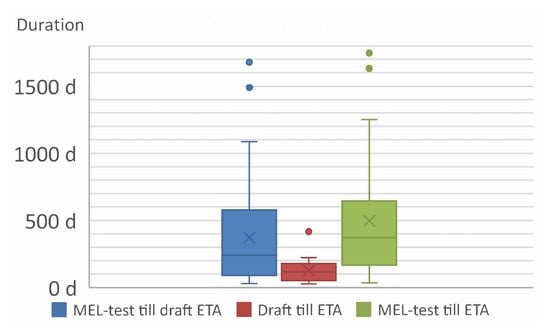
Figure 3.
Time needed for a manufacturer to obtain an ETA. MEL, Maximum Energy Level.
2.1. System Specifications
A total of 55 tested systems were set up using simply supported posts in combination with an upslope suspension, whereas 10 systems had clamped posts. Apart from a few, all systems had a length of 30 m, covering three fields and four posts. Figure 4a gives an impression of the number of energy-absorbing elements and ropes used for such a system, depending on the energy class. If the single rope lengths are estimated based on their function/position within a system, the sum of all rope lengths can be calculated; this total length ranges from about 100–1050 m, as shown in Figure 4b. The total length within a single energy class varies by up to 500%.
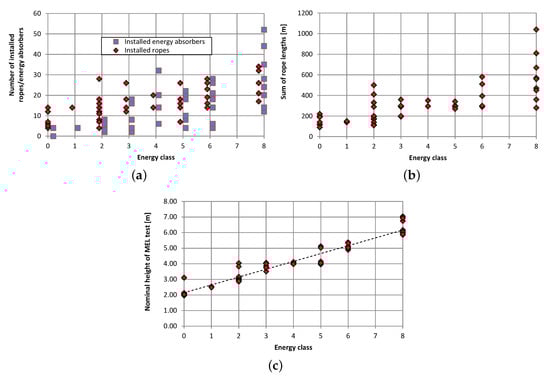
Figure 4.
Setup of tested barriers: (a) number of installed ropes and energy absorbers per system, (b) estimated total length of all ropes installed, and (c) nominal height of barriers before MEL tests.
The nominal height of a system is defined as the minimum distance of the upper net edge or support rope to the base line of the system close to the ground, projected orthogonally to a so-called reference slope upslope of the barrier. The nominal height of the barriers was between 1.97 m and 7.05 m and usually increased with increasing energy class, as shown in Figure 4c for all MEL tests. Within a single energy class, nominal height varied by up to about 1 m. The nominal height of the corresponding SEL tests (for all energy classes except Class 0) differed from the MEL nominal height maximum of 0.37 m by an average of 0.03 m. This corresponds to an average deviation of the tested SEL and MEL nominal heights of 1%.
2.2. Testing Conditions
ETAG 027 allows testing of the barriers at different angles of the block’s trajectory with respect to the horizon. Of the test setups known within this framework, a vertically free-falling test specimen was used in 74% and inclined trajectories impacted the nets in 26% of the test. If barrier inclination is defined as the inclination of the steel posts with respect to the horizon, the falling blocks entered the different barriers with an impact angle between 57 and 89 (average 73). The impacting blocks weighed between 260 and 24,900 kg, entering the barriers with impact velocities generally ranging from 25.0–30.2 m/s to achieve the necessary kinetic impact energies. Figure 5 gives an impression of which combination of block mass and impact velocity led to a certain impact energy and which combination was used for the different MEL tests.

Figure 5.
Measured impact velocities used to obtain the target impact energies for MEL tests.
The block dimensions () varied between 0.5 and 2.3 m. According ETAG 027, block density has to be between 2500 and 3000 kg/m. Density is estimated by calculating the block’s volume (V) from its average extension :
Block densities ranged from 2500–2997 kg/m, with an average value of 2741 kg/m.
3. Performance of Barriers
In this section, results about the deceleration processes of the falling blocks and the measured rope forces and residual useful heights of the barriers are presented (measured after the impact without removing the block).
As a result of the different testing conditions and different constructions of barriers, different braking distances and times occurred. Based on the impact energy, shorter braking distances were more likely for low impact energies and larger ones for higher impact energies. However, there were also differences within the individual energy classes. For example, in the energy class 500 kJ, maximum braking distances of 3.7–6.2 m were measured. This is a relatively large range and overlaps with the braking distances of 4.5–8.5 m in the 1000-kJ energy class. Minimum braking distances of 2.5 m were measured for the 100 kJ class, and a maximum of 12.5 m was measured for 5000 kJ of impact energy (Figure 6a).
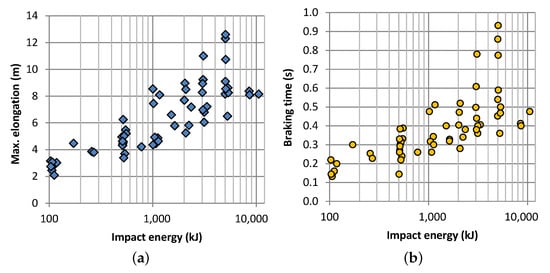
Figure 6.
Braking distance and braking time as a function of impact energy of the MEL test.
Braking time also varied widely, with values ranging from 0.13–0.22 s for the 100-kJ class and from 0.35–0.95 s for 5000 kJ of impact energy. The braking distances and braking times had much narrower ranges for 8000 kJ of impact energy, with braking distances of 8.1–8.4 m and braking times of 0.4–0.41 s (Figure 6b).
Based on the similar point distributions of braking distances and braking times in Figure 6, it seems that there is a relationship between these two variables. To examine this relationship in more detail, braking time was plotted as a function of braking distance, and the correlation was shown to be almost 90% (R = 0.898). For braking distances of 2–12.5 m, the braking times were 0.14–0.93 s (Figure 7). However, this representation of the individual values also suggests that errors have crept into the data. For example, the “normal” braking times for a braking distance of approximately 5 m were between 0.28 and 0.35 s. The value (0.14 s/5 m) does not fit into this correlation and seems to be clearly wrong, recommending a check of the corresponding testing report.
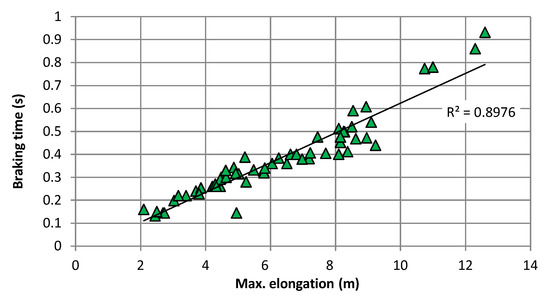
Figure 7.
The relationship between braking time and braking distance is correlated by almost 90%.
When braking a falling weight, it always experiences a braking force. This braking force is zero during free fall and reaches a maximum during the braking process. Today, such a maximum braking force and its development can be measured as for example shown in [20] or derived from a deflection-time-curve that has been extracted from video records. However, such procedures are not prescribed by the current testing guidelines for rockfall protection nets, and therefore, no such information is available for further analyses. Instead, the given braking times and distances can be used to formulate average braking forces, i.e., a braking force that is assumed to be constant during the braking process or along the braking distance. It must be clear that such an assumption of constancy does not reflect reality; especially because of the different structural behavior of each system: some of them produce a curve of the braking force over time that stays rather low for a longer time after first net contact ending up with a high peak just before standstill; others, in turn, build up a significant resistance force almost immediately after net contact with a lower maximum force. Both variants could show the same average braking force. Different thinkable evolutions of braking forces over time are discussed in [21].
For an average force , two approaches are thinkable. One calculates the magnitude based on the impact energy of the block corresponding to the work that has been done by the average braking force along the braking distance s by:
Another approach assumes the force to be constant until the block’s momentum has been absorbed during the braking time by:
Both approaches to calculate an average braking force neglect the influence of gravity. To include this correctly, the vertical component of the braking force has to be modified accordingly.
Figure 8a visualizes both and for all MEL tests. Both approaches follow a polynomial trend with increasing impact energy. As stated above, the diagrams shown in Figure 8a do not inform about the maximum peak forces to be expected, but the magnitude of the average forces. This information can be used for single manufacturers to classify the performance of their barriers to the competitors’ ones. Both approaches for deliver similar results for an averaging braking force: the relation between and mostly is between 1.0 and 1.5, as is visible in Figure 8b. The outlier visible in this figure recommends a check of the corresponding testing reports.
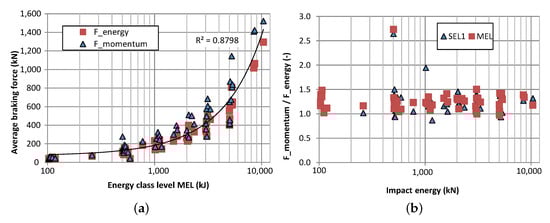
Figure 8.
(a) Average braking forces for MEL tests based on momentum and energy approach; (b) relation between momentum and energy approach for Service Energy Level 1 (SEL1) and MEL tests).
A barrier has to absorb not only the impact energy, but also the potential energy of the impacting block along its braking distance (see [22] and Figure 9). This means that a barrier absorbs more energy than represented by its energy class. The procedure for determining the magnitude of this increase and the total energy dissipated by a barrier is explained here. The potential energy directly corresponds to the braking distance for vertically-falling blocks. For inclined impact trajectories, only the vertical portion of the braking distance contributes to the potential energy. Therefore, the potential energy of the impacting block along its braking distance has to be added to the kinetic impact energy. This new value corresponds to the total work performed by the barrier with regard to the lowest position of the block in the net. A comparison of the resulting values with the nominal energy values of the individual energy classes is presented in Figure 10. This comparison indicates an average conversion factor of 1.20, which means that the barriers absorb about 20% more energy than minimally required in the respective energy class. Within the lowest energy class (100 kJ), the values are scattered over a relatively wide range of 7–24%, in contrast to in the energy class 3000 kJ, where 20–30% more energy was dissipated. Data from the energy class >4500 kJ were presented not together within a single energy line, but split into the effectively-aimed impact energies of 5000 kJ, 8000 kJ, and 10,000 kJ. It is noteworthy that in this energy class, the energy effectively absorbed at 5000 kJ increases by up to 38% relative to the impact energy.
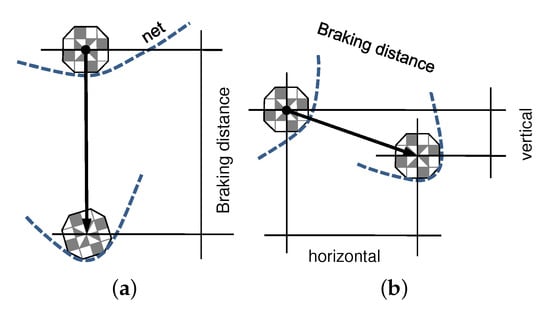
Figure 9.
The height difference between the first contact of the block with the system and its lowest position results in potential energy of the block that has to be absorbed by the system: (a) for a vertical impact, the full braking distance has to be taken into account, (b) for an inclined impact, only the vertical part of the braking distance is relevant.
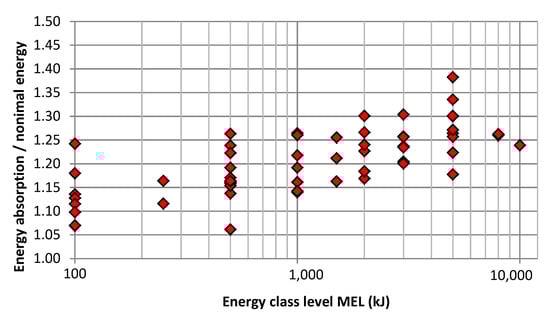
Figure 10.
Total absorbed energy in relation to the nominal energy in the individual energy classes (energy class >4500 kJ expanded to show effective impact energy).
The barriers not only have to absorb energy, but also have to comply with certain conditions regarding the position of the barrier height after a test. According to [12], the residual height, i.e., the distance between the suspension ropes projected orthogonally to the reference slope, must be at least 70% of the original nominal height after the first test with a block impacting at the service energy level (SEL1). The residual height after the MEL defines the quality class into which a barrier is categorized: if the 50% limit is exceeded in the MEL test, the barrier is assigned to Quality Class A; for values more than 30 and up to 50%, Class B; and for values equal to or less than 30%, Class C.
Because of the residual height requirement of 70% after SEL1, all tested barriers fulfil this criterion (Figure 11). For the energy class 500 kJ, a value of 90% was even measured, which means that the height of the barrier is only reduced by 10% after SEL1 impact. Values of over 80% were measured in other energy classes, as well.
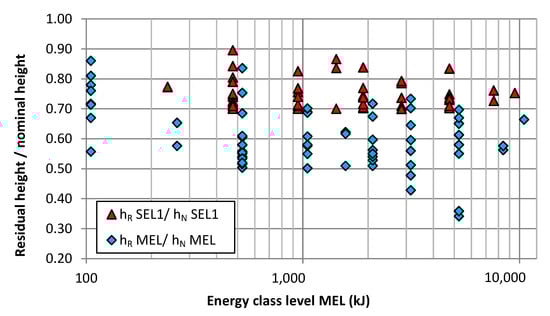
Figure 11.
Residual height (h) with different colors for SEL1 and MEL tests relative to the measured nominal height (h), distributed over the individual energy classes (energy class >4500 kJ expanded to show effective impact energy).
After the MEL test, almost all barriers reached a residual height of 50% and therefore were categorized as Quality Class A. Only the energy classes 3000 kJ and 5000 kJ each had two barriers that were classified as Quality Class B. No barrier was categorized into Class C; this might be related to the correlation prescribed in ETAG 027 between the size of the impacting block L and the minimum nominal height h, i.e., h > 3 L. In other words, if the block size is about 33% and it is assumed that the minimum residual height of the barrier is located at the impact position, the residual height automatically is greater than 30% and therefore belongs to Class B.
Overall, many barriers show residual heights of over 70% after the MEL test, especially in the low energy classes of 100 kJ and 500 kJ. This ensures continuing protection against any subsequent falling rocks.
A relatively large scatter of the data within a single energy class and among the different energy classes was also apparent for the measured rope forces. The barriers are constructed in many different ways, and thus, uniform functioning cannot be expected. Especially the different structural constellations regarding the longitudinal net supporting ropes cause differing loads on anchorages. The only components that are common to almost all systems and that were measured during the tests are upslope retention ropes and lateral suspension ropes. Therefore, only the results of the maximum forces in the upslope ropes and those in the lateral ropes are presented here and shown in Figure 12.
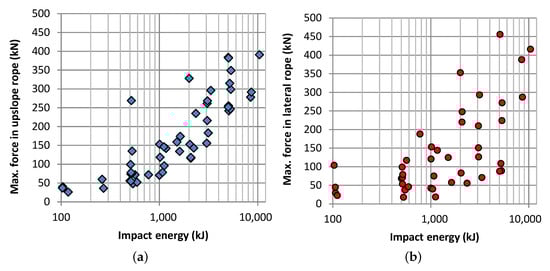
Figure 12.
Maximum forces in (a) the upslope ropes and (b) the lateral suspension ropes with respect to the impact energy classes (energy class >4500 expanded to show effective impact energy).
The maximum forces in the upslope ropes (Figure 12a) basically show strong dependence on the impact energy. With increasing energy, the forces in the upslope ropes also increase. However, these forces are decisively influenced by the presence of energy-absorbing elements (so-called braking elements). The braking elements dampen and limit the maximum force within the ropes, allowing the forces to remain at a lower level. However, this influence could not be analyzed in detail. The relatively large forces (230 kN and 330 kN) at the impact energies of 500 kJ and 2000 kJ therefore only suggest the absence of braking elements.
An increase in the maximum forces in the lateral ropes was also detected with increasing impact energy (see Figure 12b). The dispersion of the forces by a factor of 3–4 in the individual classes, however, is much greater than that observed for the upslope ropes. These data are therefore only of limited use, but further point out the existing variety of different systems regarding their performance.
In principle, one would assume that a longer braking distance reduces the loads within a system or the single ropes, respectively. However, when looking at Figure 13a, it seems to be the reverse. Here, the measured maximum forces of the upslope and lateral ropes are plotted against the braking distance. The higher the braking distance, the higher the loads are. However, Figure 13a fully neglects the different impact energies. Usually, higher impact energies result in higher braking distances, and this in turn explains the higher maximum rope forces. To propose a consideration of the impact energies, Figure 13b plots the rope forces against the braking distance divided by the impact energy. A clear trend is visible that the highest loads are measured for the lowest abscissa values, i.e., highest impact energies. The upslope force of the system with an abscissa value of about 0.012 does not follow this trend. In fact, when checking the system’s structure in the ETA, it had a clearly different structural setup compared to other systems.
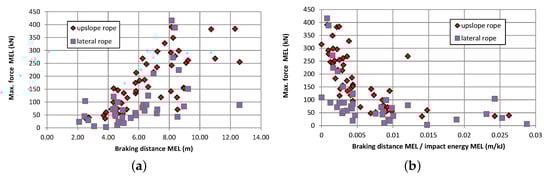
Figure 13.
Maximum measured forces in upslope and lateral ropes during MEL with respect to (a) the braking distance and (b) the braking distance divided by the impact energy.
Another approach studying the maximum forces acting within the ropes is to evaluate the different loads within the same system during the SEL1, SEL2, and MEL tests. These loads are directly comparable because they are usually measured at the same location within a barrier during all tests. If the maximum load achieved during SEL1 test serves as a reference level, the corresponding loads during the SEL2 test increased by 20% on average. This increase is usually observed because the SEL1 impact degrades all existing pre-tension within an unloaded barrier; the SEL2 impact then enters a more or less loose system, resulting in larger peak loads during braking. The loads detected during the MEL test, i.e., 300% impact energy, were 53% larger on average. The factor by which the measured loads changed in the SEL2 and MEL tests relative to the SEL1 test is displayed in Figure 14. In most cases, the load increased by a factor of less than 2.0 for the SEL2 test and less than 3.0 for the MEL test. Many loads had change factors around 1.0. In most cases, this finding is related to the existence of braking elements, which dampen and limit the rope forces transferred to the anchorage. Cases where forces for SEL2 or MEL are smaller than those for SEL1 (i.e., change factors clearly less than 1.0) can be explained by the behavior of brake elements: the activation force of some brake elements, i.e., the load at which the brake starts elongating, is not always the same. If there is a large scatter for the activation force of a brake element and an element is not activated at all during SEL1, the corresponding values of SEL2 or MEL might remain below.
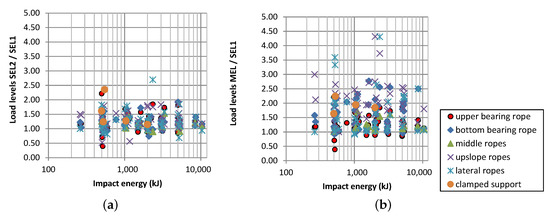
Figure 14.
Maximum measured forces during (a) SEL2 and (b) MEL relative to the load measured during SEL1 with respect to the impact energy classes (energy class >4500 expanded to show effective impact energy).
There are other post-test criteria that have to be reported in the ETA, for example how much the mesh width is reduced at the outer posts. The lateral inward movement of the mesh edge at the outer posts (lateral gaps) reached up to 2.01 m after the SEL1 test or 6.7 m after the MEL test. In the median, 0.31 m openings are observed after the MEL test. The more recently developed barriers usually show no lateral gaps after testing.
To gain insight into the residual energy-absorbing capabilities of a system after an impact (mostly after the MEL test), the potential residual capacity of the energy-absorbing elements has to be determined. If an energy absorber has been fully activated, the system has no reserves left. The maximum remaining capacity was observed to be 68%, i.e., only 32% of the barrier’s capacity have been exploited. On average, the tested barriers had a residual capacity of 19.9% after testing.
4. Evaluation and Known Issues
It can be seen from Figure 2c that a total of six TABs actively handle ETAs regarding ETAG 027. However, four of them are responsible for only a small number of ETAs, whereas two cover a continuously-increasing number of ETAs. Looking at the evolution over time, it is apparent that most of the TABs started with ETAG 027-ETAs at about the same time: around the beginning of the second decade of this millennium. However, most of them did not cover additional ETAs, and the number of institutions that handle ETAs actually declined over time. This is advantageous in that the remaining two institutions gain much experience and can guarantee consistent quality of the ETAs for the investigated product area. On the other hand, if all the other TABs do not cover new ETAs, their knowledge and expertise within this field diminishes over time. This increases the risk that they cannot sufficiently evaluate the ETAs that are sent for circulation among the EOTA members.
ETAG 027 allows barriers with different inclinations of the impacting block’s trajectory to be tested. This makes it difficult to compare the performance of different barriers within, e.g., one energy class. Volkwein [22] and Heiss [23] studied the influence of an inclined versus a vertical trajectory test setup, and both studies led to the conclusion that especially the residual height after a rockfall event is affected significantly. However, commonly-accepted methods to cover such differences do not exist. For example, it is not yet defined how barrier characteristics such as residual height or residual capacity of energy absorbers have to be adjusted if the reference slope of a tested system differs too much from the slope angle in the field.
Certainly, any standardization of construction product testing neglects the variability in product loading under (natural) field conditions, owing to differences in block shape, rotational movements, impact speed, or impact location. In particular, certain impact locations have the potential to harm a barrier more than the tested standard load cases or even cause the failure of a barrier. Further, if small blocks with high impact velocities are expected, the mesh might suffer from puncturing loads, as studied by [24,25,26]. One would hope, therefore, that market competition not only favors the least expensive systems, but also helps resolve quality issues. Numerical simulations, such as those presented in [27], might help evaluate barriers for non-standardized performance.
ETAG 027 defines reasonable boundary conditions for type testing. For example, the block’s mass, shape and density are limited. Setting a maximum density results in a minimum block size, and this in turn causes a minimum barrier nominal height within a certain energy class. Defining a minimum density prevents situations where very large blocks avoid the inverse of the “bullet effect” with smaller loads in the mesh.
Checks for corrosion protection of the barrier components are also part of the testing process. However, it has been observed that energy-absorbing elements behave differently if corrosion protection is applied. Therefore, it should be kept in mind that applying corrosion protection might influence the steel properties of a barrier component. Procedures for considering specific corrosion protection are, however, not handled consequently so far.
One drawback of following an existing guideline is that it is difficult to include new measurement procedures in the evaluation and to incorporate their results into the ETA of a system. For example, determining the deceleration of the block within the net is standard today (e.g., [20,28,29]), but is not to be included in the ETA.
5. Summary and Outlook
As elaborated in this contribution, the guideline ETAG 027 was the basis for the evaluation of a total of 66 flexible rockfall protection kits that fulfilled the guideline’s requirements. Such systems provide reliable protection in the field against rockfalls classified according to their expected kinetic energies at impact.
As of November 2018, ETAG 027 has been replaced by EAD 340059-00-0106, which is listed online at [18]. The introduction of this EAD changes the handling of such protection systems. An ETA based on this new EAD only confirms that the protection barrier fulfills some or all essential characteristics listed in the EAD. This has the following impacts on the clients of such barriers:
- The CPR foresees the formulation of new and special EADs that are not fully covered by existing EADs. This means that a client has to check carefully whether the underlying EAD of a CE-marked product is the correct one for the intended use. A simple check of whether a system has a valid ETA or CE mark is not enough.
- If the ETA or CE mark belongs to the correct EAD, it further has to be checked whether the manufacturer of the construction product declares in its declaration of performance all the essential characteristics listed in the EAD. Theoretically, construction products can be successfully assessed even if the manufacturer declares only some of the essential characteristics.
The new ETA lists only certain (measured) test results as essential characteristics. Their application to planned field installations must also be evaluated. Some examples of such additional treatments are:
- How is the braking distance defined in the ETA? Is it defined relative to a position on the ground or on the net? This influences where the system has to be placed in the field to stop impacting blocks early enough. If the braking distance is defined relative to the net, the planner has to evaluate the net’s sag and its distance to, e.g., the basis line along the system’s post bases. The net sag might depend on the inclination of the system.
- Does the reference slope of the system evaluated for the ETA correspond to the inclination of the slope in the field? If not, how should, e.g., sag or braking distance be adjusted or are reserves of the energy-absorbers large enough according to [22]?
- Are there likely to be special load cases, e.g., an impact into a lateral field, that were not assessed?
- Does the barrier successfully retain small falling stones? This requires a limited maximum size of the mesh openings. If the maximum size is kept small by the presence of an additional secondary mesh, is its retention capacity known?
- The foundation and anchorages of a system are not part of an ETA. They have to be designed separately, following the corresponding guidelines and standards.
- etc.
Answering the questions listed above will be important in the future for ensuring the installation of fully-reliable flexible rockfall protection systems in the field. To ease this evaluation process in Switzerland, a recent manual, presented in [30], meets exactly these needs. Such an approach helps keep a safe standard regarding the barriers used in practice. However, it must be clear that the handling of protection barriers described in this contribution completely neglects approaches where barriers are numerically simulated, which is possible, e.g., for flexible protection systems targeted at shallow landslides or debris flows [31].
Author Contributions
Technical approvals/assessments, G.S.; investigation and data curation, J.K. and A.V.; conceptualization, W.G. and A.V.; methodology, W.G.; validation, G.S.; formal analysis, A.V. and W.G.; resources, G.S.; writing, original draft preparation, A.V. and W.G.; writing, review and editing, A.V. and G.S.; visualization, W.G.; supervision, G.S.
Funding
This research received no external funding.
Acknowledgments
The authors are thankful to Melissa Dawes for the language check and to the reviewers of the contribution for their valuable comments.
Conflicts of Interest
The authors declare no conflict of interest.
References
- Spang, R.; Bolliger, R. Vom Holzzaun zum Hochenergienetz—Die Entwicklung des Steinschlagschutzes von den Anfängen bis zur Gegenwart; Geobrugg Schutzsysteme: Romanshorn, Switzerland, 2001. [Google Scholar]
- Duffy, J.D. Flexible Wire Rope Rockfall Nets. In Soils, Geology, and Foundations-Rockfall Prediction and Control and Landslide Case Histories (Transportation Research Record No. 1343); Transportation Research Board: Washington, DC, USA, 1992; pp. 30–35. [Google Scholar]
- Duffy, J.D.; Haller, B. Field Tests of Flexible Rockfall Barriers. In Transportation Facilities Through Difficult Terrain: Proceedings of the Conference on Transportation Facilities Through Difficult/Aspen-Snowmass/Col; Wu, J.T., Barrett, R.K., Eds.; Aa Balkema: Avereest, The Netherlands, 1993; pp. 465–473. [Google Scholar]
- Hearn, G.; Barrett, R.K.; McMullen, M.L. CDOT Flexpost Rockfall Fence Development, Testing and Analysis. In Soils, Geology, and Foundations—Rockfall Prediction and Control and Landslide Case Histories (Transportation Research Record No. 1343); Transportation Research Board, National Academy Press: Washington, DC, USA, 1992; pp. 23–29. [Google Scholar]
- Peila, D.; Pelizza, S.; Sassudelli, F. Evaluation of Behaviour of Rockfall Restraining Nets by Full Scale Tests. Rock Mech. Rock Eng. 1998, 31, 1–24. [Google Scholar] [CrossRef]
- Bergmeister, K. Bewertung und Berechnung von Steinschlagnetzen. In (Hrsg.): Tagungsband Steinschlag als Naturgefahr und Prozess, S; Hösle, B., Ed.; Institut für Wildbach- und Lawinenschutz, Universität für Bodenkultur: Wien, Austria, 1997; pp. 20–32. [Google Scholar]
- Gerber, W. Guideline for the Approval of Rockfall Protection Kits. Environment in Practice; Swiss Agency for the Environment, Forests and Landscape (SAEFL) and Swiss Federal Research Institute WSL: Berne, Switzerland, 2001; 39p. [Google Scholar]
- Gerber, W.; Böll, A. Peak Forces in Flexible Rockfall Barriers. In Proceedings of the International Congress Interpraevent 2002 in the Pacific Rim, Matsumoto, Japan, 14–18 October 2002. [Google Scholar]
- Gerber, W.; Böll, A.; Ammann, W. Flexible Rockfall Barriers—Testing and Standardisation Experiences in Switzerland. In Proceedings of the 12th Panamerican Conference on Soil Mechanics and Geotechnical Engineering, Cambridge, MA, USA, 22–26 June 2003; Culligan, P.J., Einstein, H.H., Whittle, A.J., Eds.; Verlag Glückauf GmbH: Essen, Germany, 2003; pp. 2595–2602. [Google Scholar]
- Gerber, W.; Baumann, R.; Volkwein, A. Swiss guidelines for the approval of rockfall protection kits—7 years of experience. In Interdisciplinary Workshop on Rockfall Protection; Volkwein, A., Labiouse, V., Schellenberg, K., Eds.; Eidg. Forschungsanstalt WSL: Berne, Switzerland, 2008; pp. 34–36. [Google Scholar]
- Bundesamt für Umwelt—BAFU/Federal Office for the Environment–FOEN. 2018. Available online: https://www.bafu.admin.ch/bafu/de/home/themen/naturgefahren/fachinformationen/umgang-mit-naturgefahren/naturgefahren–massnahmen/naturgefahren–technische-massnahmen/naturgefahren–typenpruefung.html (accessed on 7 November 2018).
- EOTA. ETAG 027: Guideline for European Technical Approval of Falling Rock Protection Kits; EOTA: Brusseles, Belgium, 2008; 53p. [Google Scholar]
- European Council. Construction Products Directive (CPD); European Commission, Council Directive 89/106/EEC; European Council: Brusseles, Belgium, 1988; 26p. [Google Scholar]
- Peila, D.; Ronco, C. Design of rockfall net fences and the new ETAG 027 European guideline. Nat. Hazards Earth Syst. Sci. 2009, 9, 1291–1298. [Google Scholar] [CrossRef]
- European Council. Construction Product Regulation (CPR); European Commission, Regulation 305/2011; European Council: Brusseles, Belgium, 2011; 39p. [Google Scholar]
- EOTA. List of Published European Assessment Documents. 2018a. Available online: https://www.eota.eu/en-GB/content/eads/56 (accessed on 7 November 2018).
- Volkwein, A. Vergleich der Zulassung von Schutznetzen gegen Steinschlag nach CH- und EU-Richtlinie. FAN Agenda Fachleute Naturgefahren Schweiz 2012, 2012, 15–18. [Google Scholar]
- EOTA. Falling Rock Protection Kits. EAD 340059-00-0106, 2018/C 417/07. 2018. Available online: https://www.eota.eu/handlers/download.ashx?filename=ead-in-ojeu%2fead-340059-00-0106-ojeu2018.pdf (accessed on 18 November 2018).
- EOTA. List of Published European Technical Assessments. 2018b. Available online: https://www.eota.eu/pages/etassessments/default.aspx (accessed on 7 November 2018).
- Caviezel, S.; Murri, R. Dynamische Prüfung am Geobrugg Schutzzaunsystem Spider Avalanche mit einem 3200 kg EOTA-Stein mit 500 kJ vom 08. August 2013; Technical Report; Dynamic Test Center AG: Vauffelin, Switzerland, 2013. [Google Scholar]
- Gerber, W. Naturgefahr Steinschlag—Erfahrungen und Erkenntnisse; WSL-Berichte: Birmensdorf, Switzerland, 2018. [Google Scholar]
- Volkwein, A.; Baumann, R. Vertical vs. inclined impact into flexible barriers - influence of different testing procedures according to ETAG 027. In Proceedings of the 5th Interdisciplinary Workshop on Rockfall Protection RocExs 2014, Lecco, Italy, 29–31 May 2014; Polo Territoriale di Lecco del Politecnico di Milano: Lecco, Italy, 2014. 4pAvailable online: https://sites.google.com/site/rocexs2014/home (accessed on 6 September 2018).
- Heiss, C. Überlegungen zur Sicherung von Personen und Infrastrukturbauwerken Gegen Steinschlag im Alpinen Bereich Unter Besonderer Berücksichtigung Flexibler Steinschlagschutzsysteme—Modellierung flexibler Steinschlagschutzsysteme im Labormassstab zur Beurteilung Nichtgenormter Lastfälle. Ph.D. Thesis, Montanuniversität Leoben, Leoben, Austria, 2017. [Google Scholar]
- Buzzi, O.; Leonarduzzi, E.; Krummenacher, B.; Volkwein, A.; Giacomini, A. Performance of high strength rock fall meshes: Effect of block size and mesh geometry. Rock Mech. Rock Eng. 2015, 48, 1221–1231. [Google Scholar] [CrossRef]
- Mentani, A.; Giacomini, A.; Buzzi, O.; Govoni, L.; Gottardi, G.; Fityus, S. Numerical modelling of a low-energy rockfall barrier: New insight into the bullet effect. Rock Mech. Rock Eng. 2016, 49, 1247–1262. [Google Scholar] [CrossRef]
- Volkwein, A.; Melis, L.; Haller, B.; Pfeifer, R. Protection from landslides and high speed rockfall events: Reconstruction of Chapman’s Peak Drive. In IABSE Symposium Report (Vol. 90, No. 6, 47-54); International Association for Bridge and Structural Engineering: New York, NY, USA, 2005. [Google Scholar]
- Wendeler, C.; Volkwein, A.; Biedermann, B. Eine flexible Steinschlaggalerie im Hochenergiebereich als Variante zu einer Betongalerie oder Tunnellösung—Bemessung und Anwendungsbeispiel. Wildbach Lawinenverbau 2013, 77, 90–97. [Google Scholar]
- Niklaus, P.; Birchler, T.; Aebi, T.; Schaffner, M.; Cavigelli, L.; Caviezel, A.; Magno, M.; Benini, L. StoneNode: A low-power sensor device for induced rockfall experiments. In Proceedings of the 2017 IEEE Sensors Applications Symposium (SAS 2017), Glassboro, NJ, USA, 13–15 March 2017. [Google Scholar] [CrossRef]
- Volkwein, A.; Klette, J. Semi-Automatic Determination of Rockfall Trajectories. Sensors 2014, 14, 18187–18210. [Google Scholar] [CrossRef] [PubMed]
- Baumann, R. Grundlagen zur Qualitätsbeurteilung von Steinschlagschutznetzen und deren Fundation. Bundesamt für Umwelt—BAFU/Federal Office for the Environment – FOEN. Umwelt-Wissen UW-1805-D. 2018. Available online: https://www.bafu.admin.ch/uw-1805-d (accessed on 14 November 2018).
- EOTA. Flexible Kits for Retaining Debris Flows and Shallow Landslides/Open Slope Debris Flows. EAD 340020-00-0106, OJEU 2016/C 378/08. 2016. Available online: https://www.eota.eu/handlers/download.ashx?filename=ead-in-ojeu%2fead-340020-00-0106-ojeu2016.pdf (accessed on 14 November 2018).


© 2019 by the authors. Licensee MDPI, Basel, Switzerland. This article is an open access article distributed under the terms and conditions of the Creative Commons Attribution (CC BY) license (http://creativecommons.org/licenses/by/4.0/).