Article

Plutonium Migration during the Leaching of Cemented Radioactive Waste Sludges

1
Centre for Radiochemistry Research, School of Chemistry, The University of Manchester, Manchester M13 9PL, UK
2
National Nuclear Laboratory, Chadwick House, Warrington Road, Birchwood Park, Warrington WA3 6AE, UK
3
Advanced Photon Source, Argonne National Laboratory, Argonne, IL 60439, USA
4
Radiochemistry Unit, Department of Chemistry, the University of Helsinki, A.I. Virtasen Aukio 1 (PL 55), 00014 Helsinki, Finland
5
School of Earth and Environmental Sciences and Williamson Research Centre for Molecular Environmental Science, the University of Manchester, Manchester M13 9PL, UK
*
Author to whom correspondence should be addressed.
Present address: Diamond Light Source, Harwell Science and Innovation Campus, Didcot, Oxfordshire, OX11 0DE, UK.
Present address: AWE, Aldermaston, Berkshire, RG7 4PR, UK.
Geosciences 2019, 9(1), 31; https://doi.org/10.3390/geosciences9010031
Submission received: 30 November 2018 / Revised: 21 December 2018 / Accepted: 24 December 2018 / Published: 8 January 2019

Abstract

:
One of the most challenging components of the UK nuclear legacy is Magnox sludge, arising from the corrosion of Mg alloy-clad irradiated metallic U fuel that has been stored in high pH ponds. The sludges mainly comprise Mg hydroxide and carbonate phases, contaminated with fission products and actinides, including Pu. Cementation and deep geological disposal is one option for the long-term management of this material, but there is a need to understand how Pu may be leached from the waste, if it is exposed to groundwater. Here, we show that cemented Mg(OH)2 powder prepared with Pu(IV)aq is altered on contact with water to produce a visibly altered ‘leached zone’, which penetrates several hundred microns into the sample. In turn, this zone shows slow leaching of Pu, with long-term leaching rates between 1.8–4.4 × 10⁻⁵% of total Pu per day. Synchrotron micro-focus X-ray fluorescence mapping identified decreased Pu concentration within the ‘leached zone’. A comparison of micro-focus X-ray absorption spectroscopy (µ-XAS) spectra collected across both leached and unleached samples showed little variation, and indicated that Pu was present in a similar oxidation state and coordination environment. Fitting of the XANES spectra between single oxidation state standards and EXAFS modeling showed that Pu was present as a mixture of Pu(IV) and Pu(V). The change in Pu oxidation from the stock solution suggests that partial Pu oxidation occurred during sample ageing. Similarity in the XAS spectra from all samples, with different local chemistries, indicated that the Pu oxidation state was not perturbed by macro-scale variations in cement chemistry, surface oxidation, sample aging, or the leaching treatment. These experiments have demonstrated the potential for leaching of Pu from cementitious waste forms, and its underlying significance requires further investigation.

1. Introduction

The UK’s first generation of civil nuclear reactors were fueled with natural uranium metal, clad in an Mg-based alloy (Magnox) [1]. After removal from the reactor, and before reprocessing, the fuel is stored in water-filled ponds that are maintained at high pH. In some of the facilities at the Sellafield site, Magnox fuel has been stored for several decades, and the fuel elements are now extensively corroded [2]. This has led to the accumulation of Mg-rich fine particulate sludges in the fuel ponds, which are mainly composed of brucite (Mg(OH)2), contaminated with spent fuel particles, associated actinides, and fission products [2,3].
This sludge is sufficiently radioactive to be classified as intermediate level radioactive waste (ILW; in the UK, ILW is defined as radioactive waste containing over 4 GBq tonne−1 alpha activity or 12 GBq tonne−1 beta/gamma activity, but for which the heat output need not be considered in the design of storage or disposal facilities). The total volume of sludge is around 5000 m3, and it contains a wide range of fission and activation products, including plutonium, which is released due to the corrosion of the fuel cladding [2]. The plutonium content is in the range 0.1 to 10 mg Pu g−1 sludge, which implies a total Pu inventory of up to a few tonnes [3,4].
The management of the fuel ponds and their contents is one of the most pressing tasks in the management of the UK’s nuclear legacy. Retrieval and immobilization of the sludges to create a wasteform that is suitable for storage and eventual disposal is a major challenge that is currently unresolved [5].
The intention is for UK ILW to be immobilized in cement, and packaged in stainless steel containers [6] for eventual disposal in a geological disposal facility (GDF) [7]. The GDF vault will then be backfilled with a cement-based material which is intended to maintain hyperalkaline conditions for long periods after GDF closure and groundwater inundation [8]. Further, groundwater in the GDF will likely become strongly reducing, owing to steel canister corrosion, and the combination of low redox potential and high pH is expected to restrict the mobility of most radionuclides, including Pu [9].
In the longer-term (>5000 years), the actinides are substantial contributors to the radiological impact of such a repository, and Pu is perceived to be among the more hazardous components of the waste [10]. In the post-closure GDF safety case, no credit is taken for the waste packages, so the backfill and the geosphere are the principal barriers restricting the return of radionuclides to the biosphere [11]. In practice, however, the waste packages will contribute significantly to limit radionuclide release, and the retention of radionuclides within the waste matrix will be an additional significant safety function [12]. To date, the behavior of Pu in Mg-rich, Pu-containing, cemented wasteforms has not been evaluated. As the Mg-rich cement may serve to lessen Pu release into the backfill and geosphere (thus reducing overall Pu migration risk from the GDF), here, we evaluate the performance of this material in Pu leach tests, making use of micro-focus X-ray absorption spectroscopy to determine Pu location and speciation in the cement during aging and leaching.

2. Materials and Methods

2.1. Safety

The possession and use of radioactive materials is subject to statutory controls. Radioactive materials should only be used in appropriate facilities by suitably qualified and experienced personnel, after appropriate risk assessment.

2.2. Preparation of Plutonium Solutions

242Pu was supplied by AEAT Harwell as PuO2 powder. This was dissolved in 0.2 M HF/8 M HNO3. Fluoride was masked by complexation with Al3+, followed by the conditioning of Pu to Pu(IV) with 5 mg solid NaNO2 and anion exchange purification (adsorption on to BioRad AG1-X8 resin, followed by washing with 8 M HNO3, conversion to Cl form with 12 M HCl and elution of Pu as Pu(III) with 0.2 M HI/11.8 M HCl). This procedure also eliminated 241Am, generated in situ by 241Pu decay, which would interfere with radiometric measurement. The Pu was then evaporated to dryness, dissolved in 6 M HCl, and conditioned to Pu(IV) with a trace of concentrated HNO3. The Pu was precipitated by addition of a small excess of 0.1 M NaOH, and re-dissolved in a small excess of 1.5 M HCl. The oxidation state was confirmed as Pu(IV) by UV-Vis-NIR spectroscopy, by the identification of characteristic optical absorption bands at 470 and 630 nm [13], and an absence of characteristic absorption bands for Pu(V) or (VI). The final molar Pu concentration of the stock solution was 0.12 M in 0.1 M HCl. Due to the presence of small amounts of other Pu isotopes, notably 238Pu, the specific α-activity of the stock was ~ 185 MBq g−1 Pu. 239Pu was supplied by LEA-CERCA (Pierrelatte, France) as a certified solution of 800 kBq mL−1 in 3 M HNO3. This was conditioned to Pu(IV), precipitated, and re-dissolved in a small excess of 0.1 M HCl, as described above.

2.3. Cement Preparation

For leaching experiments, four cement samples were prepared by blending brucite (Mg(OH)2) (Sigma-Aldrich), Ordinary Portland Cement (OPC), blast furnace slag (BFS) and water, and then spiked with 43 µg 239Pu (in 0.1 M HCl) to give a mass concentration of 21.5 µg g−1 239Pu. Prior to leaching, each of the samples was allowed to cure for 13 or 130 days, as summarized in Table 1. The OPC and BFS are both commercial products used in radioactive waste immobilization in the UK [8]. The elemental composition of the OPC and BFS (as determined by XRF analysis) is detailed in the supplementary materials (Table S1). The BFS/OPC mixtures were prepared by blending Mg(OH)2:OPC:BFS:water in the mass ratios 4:4:12:7, and the pure OPC samples by blending Mg(OH)2:OPC:water in the mass ratios 1:4:2. The acidity of the Pu solutions added was sufficiently small, such that it did not significantly perturb the pH of the cement mixture, and the volume of liquid added with the Pu was taken into account in defining the cement blend. The cement samples were cast into cylindrical pellets (~12 mm diameter × 8 mm high) in a polythene mold.
A further four OPC samples (two samples with duplicates) with higher Pu concentrations, to allow for spectroscopic study, were prepared in the same way. 242Pu was used to reduce potential hazards. Each sample contained 3.1 mg 242Pu to give a mass concentration of 1550 µg g−1 242Pu. As for the 239Pu samples for the leaching study, each set of duplicate samples were cured for either 13 or 130 days before leaching, as summarized in Table 1. Inactive samples, identical except for the absence of Pu, were also prepared for stable element leaching.

2.4. Leaching Experiments

Leaching experiments were carried out based on a modified dynamic tank test [14]. This test is semi-dynamic, with periodic replacement of the contact solution. The cement samples were suspended in 100 mL of de-ionized water by a nylon thread, and kept dark and at a constant 20 °C, to maintain constant reaction rates and to limit biological activity. A 1 mm hole in the lid of each leaching vessel, and several cm of headspace allowed for an exchange with atmosphere. At each sampling point (0.25, 1, 2.25, 4, 9, 16, 32, 64, 98, 152 and 322 days), each sample was removed and placed in a fresh solution with the leaching solution and vessel retained for analysis. Whenever the cement was contacted with a fresh leaching solution, the pH rose to 11–11.5 over ~ 24 hr. The leaching experiments were conducted for up to 322 days.
The activity of Pu in solution and Pu associated with precipitates and the surface of the leaching vessel were measured independently. Pu in solution was measured by carefully decanting the leachate, acidifying to avoid further precipitation, and analyzed by low background α-,β-liquid scintillation counting. Pu associated with precipitates and fixed to the surface of the leaching container was recovered by acid washing the vessel with 5 mL of 1 M HNO3, and analyzed by low background α-,β-liquid scintillation counting. Results were added together to obtain the total Pu leached per sampling point.
Leaching of stable elements was measured in identical, non-active experiments. These samples also covered a wider range of compositions (pure OPC, 3:1 BFS/OPC and 9:1 BFS/OPC blends containing 0, 20 and 40 wt % Mg(OH)2), and were characterized by X-ray diffraction (Cu Kα radiation, 2θ range 5–70°, step size 0.02°, 1 s step−1) (see Supplementary Materials Figure S1a–i) and environmental scanning electron microscopy (FEI XL30 ESEM with a field emission gun, operating at 20 keV, with a PGT EDS system incorporating a large field Be window with a Ge crystal).

2.5. Micro-Focus X-Ray Fluorescence (XRF) and X-Ray Absorption Spectroscopy (XAS)

To provide a suitable surface for micro-focus XRF (μ-XRF) and micro-focus XAS (μ-XAS) analysis, one side of samples 1–4 (Table 1) was ground ‘flat’ by using a series of progressively finer abrasives. In the leached specimens, a pale colored alteration layer (leached zone) surrounding a darker core (unleached zone) was clearly visible in the prepared samples (Figure 1).
The samples were placed in air-tight, double-contained cells with Kapton windows, and analyzed by using an X-ray microprobe on beamline 20-ID-XOR of the Advanced Photon Source, USA [15]. The beamline was configured to use a fixed-exit Si(111) double crystal monochromator. Final focus and harmonic rejection was achieved with the use of Rh-coated Kirkpatrick-Baez (K-B) mirrors operated at 3 m rad. All data were collected in fluorescence geometry with the sample at 45° to the incident beam and the detector. In this geometry, the size of the incident beam on the sample was 1.5 μm vertical × 2.5 μm horizontal. Multi-element synchrotron X-ray fluorescence (XRF) maps (see Supplementary XRF maps 1–18) were recorded by using an incident energy of 22.3 keV and a 7 element Ge detector (Canberra), which was windowed to collect scalar values from Fe Kα (6403 eV), Mn Kα (5899 eV), Ca Kα (3692 eV), As Kα (10,544 eV)/Pb Lα (10,551 eV), Sr Kα (14,165 eV), Pu Lβ1 (14,279 eV), and Pu Lβ2 (14,084 eV) fluorescence lines. Due to the overlap of the Pu Lα and Sr Kα fluorescence lines, the Pu Lβ1 and Pu Lβ2 lines were used for Pu mapping. Micro-focus Pu LIII edge (18,057 eV) X-ray absorption spectroscopy was carried out following XRF mapping, with the monochromator operated in step scan mode. Energy calibration was performed using a Zr foil with the K-edge position defined as 17,996 eV. Between one and four spectra were collected at each sample location (see Supplementary XRF maps). XAS spectra were analyzed using the Demeter package [16] with energy calibration, background subtraction and linear combination fits performed using Athena. Samples were compared to standards of aqueous Pu(IV) [17] and Pu(V) [17], both in 1 M HClO4. EXAFS were fit in the Artemis program using paths calculated with FEFF v8.0. [18].

3. Results and Discussion

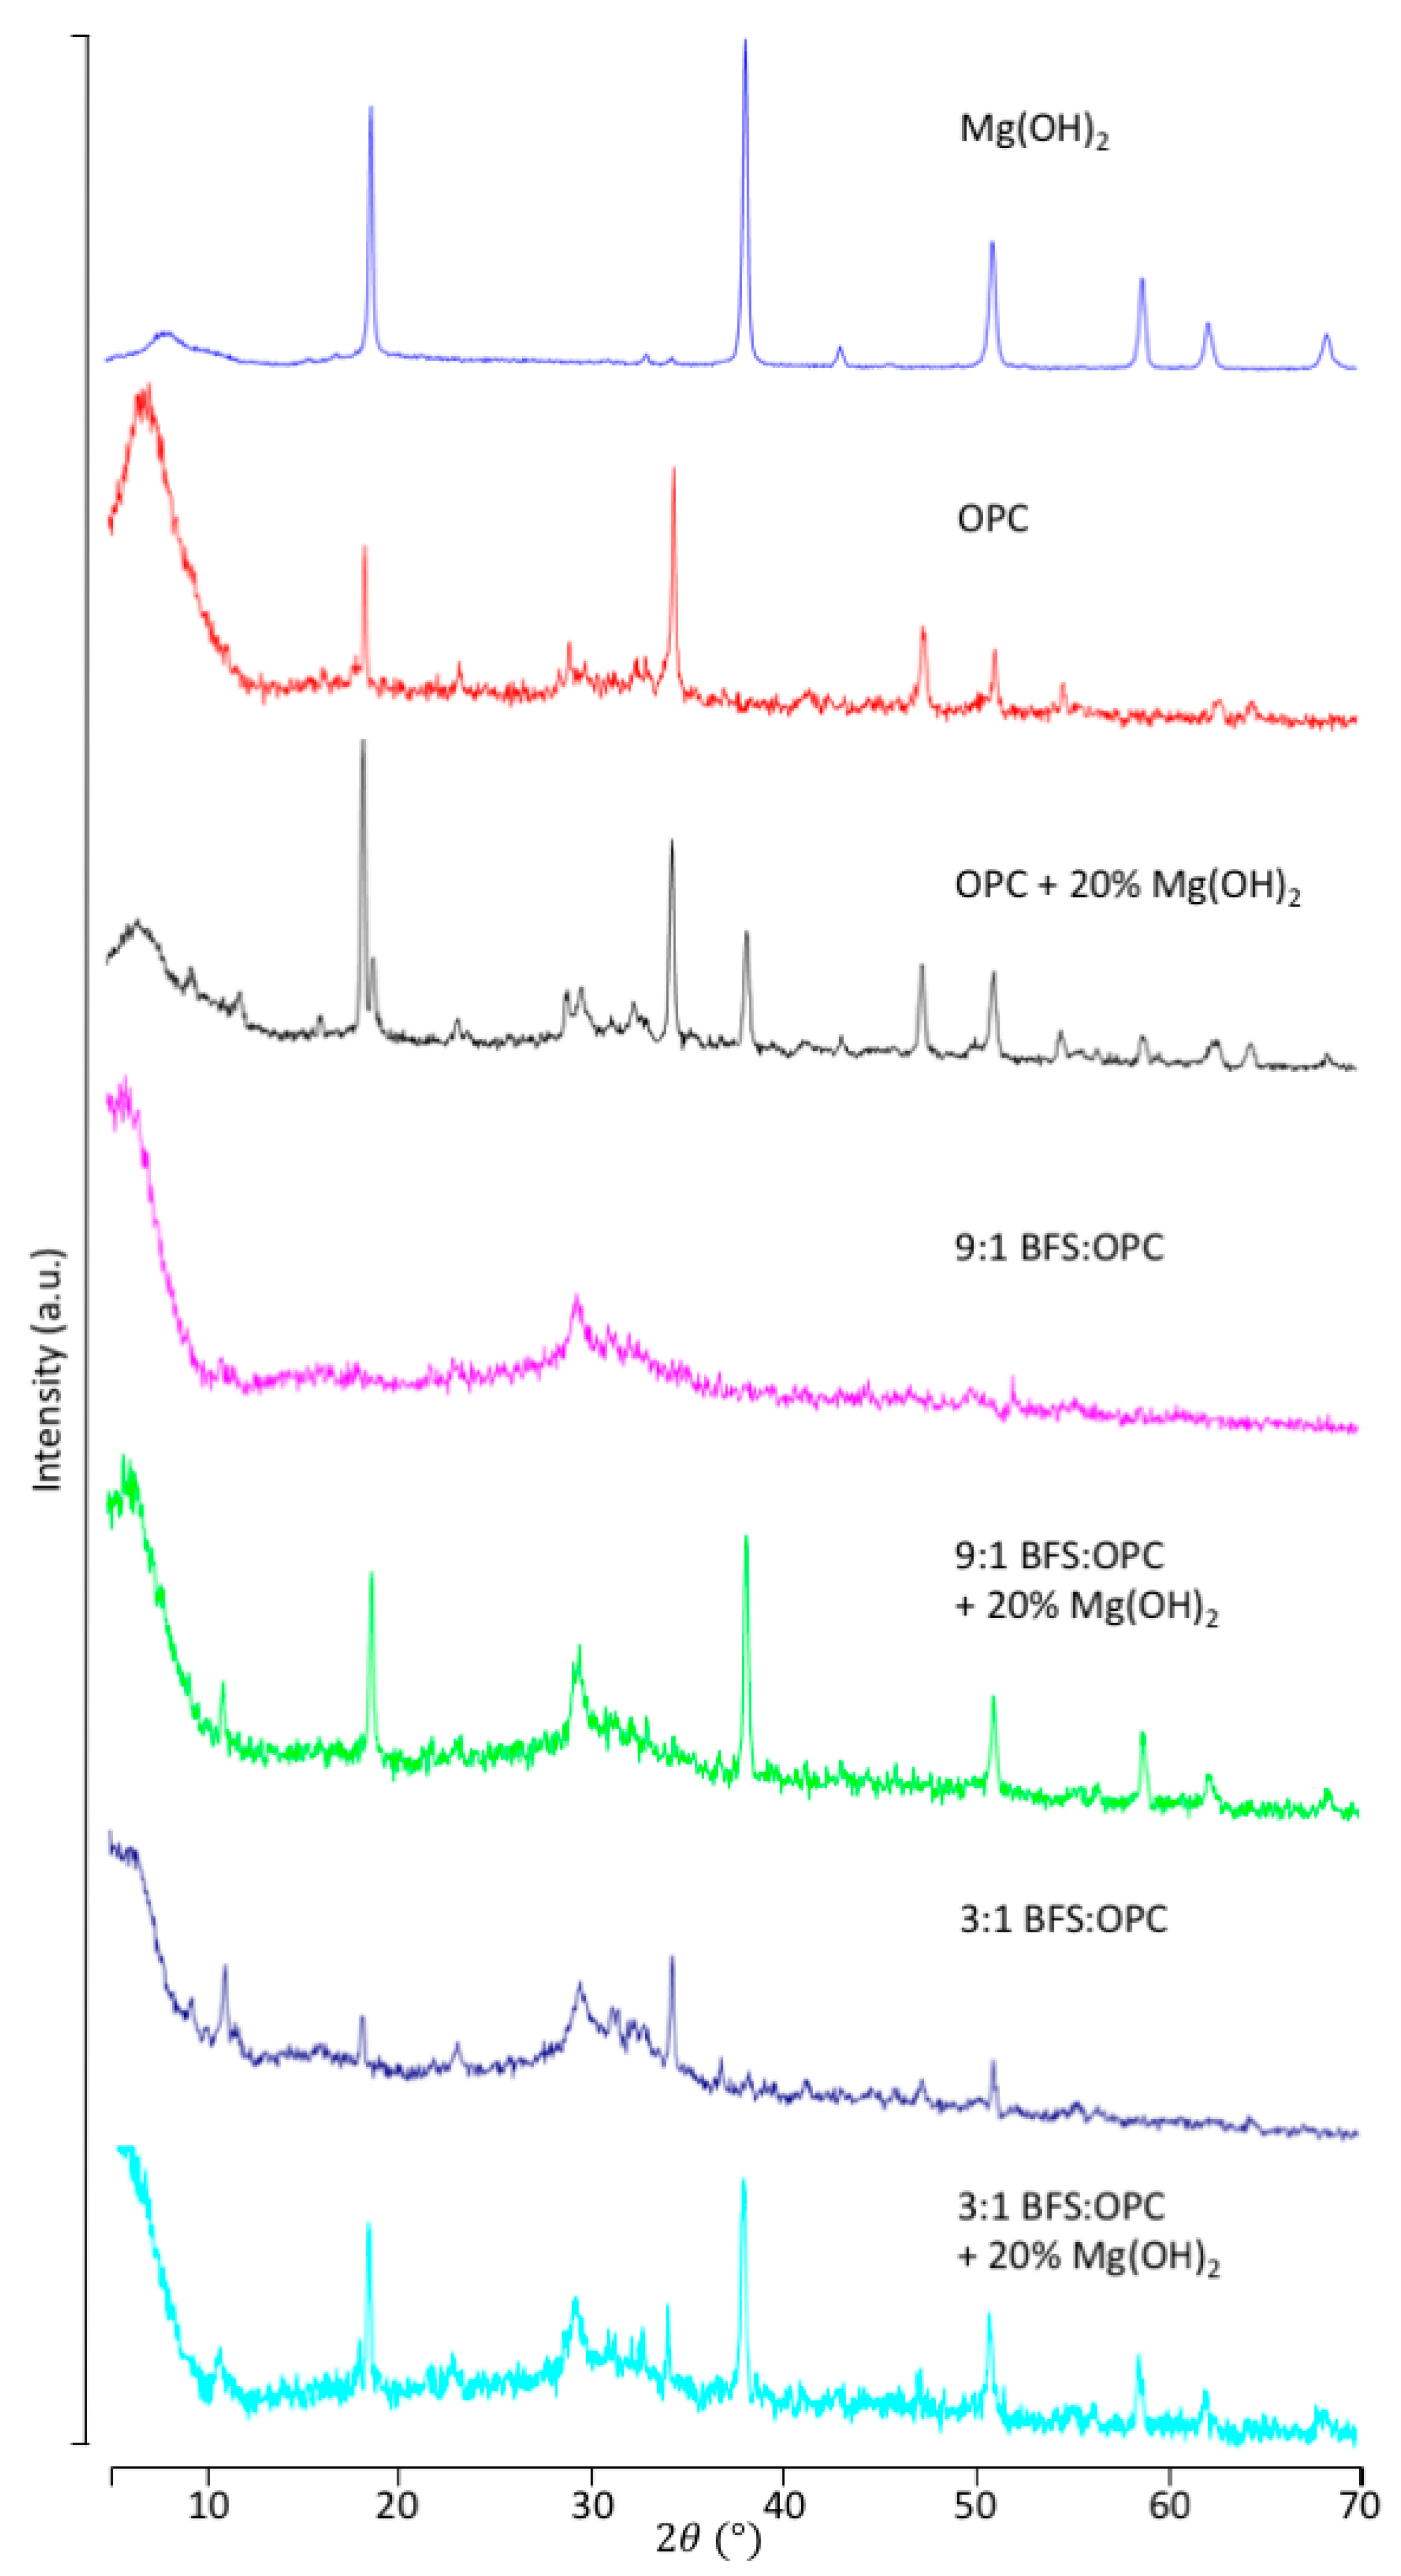
3.1. Incorporation of Mg(OH)2 in the Cement

Figure 2 shows X-ray diffraction patterns for Mg(OH)2, hydrated samples of OPC, 3:1 and 9:1 BFS:OPC and samples incorporating 20% Mg(OH)2 (additional patterns are presented in Supplementary Materials Figure S1). No reaction was observed between the cement matrix and the Mg(OH)2. Clear reflections from unaltered Mg(OH)2 were observed at 18.8, 37.9, 50.5, 58.4, 61.9, 68.0 °2θ, and reflections from the typical cement phases portlandite (Ca(OH)2) and quartz (SiO2) were observed at 34.1, 47.1, 50.8 and, 23.6, 29.7, 41.5, 43.6 ° 2θ, respectively. Reference patterns for brucite, portlandite, and quartz were taken from the ICDD database with the reference codes 00-001-1169, 00-001-1079, and 01-081-0069, respectively. These results concur with the findings of Caldwell et al. [19], and Collier and Milestone [20], that the Mg(OH)2 becomes encapsulated within the cement matrix rather than chemically bound and immobilized.

3.2. Leaching Behavior

3.2.1. OPC Versus BFS

Stable elements (Ca, Na, K) were more readily leached from the 100% OPC samples than the OPC/BFS blended samples (Figure 3), suggesting the pure OPC cement samples had greater permeability, as previously observed [21]. The addition of BFS to cement matrices lowers the heat of hydration and decreases permeability [20,22]. Though the concentration of these elements was significantly higher in the pure OPC samples (Supplementary Materials Table S1), the similarity of stable elements leached from the 3:1 and 9:1 BFS:OPC samples, with a 3-fold reduction in OPC concentration, suggests that permeability was the dominant controller over the leach rate, rather than the effect of relative concentration. Comparison of the leach rates from the 3:1 BFS:OPC and 9:1 BFS:OPC samples was in agreement, with lower leaching rates with increasing BFS concentration. This difference in permeability could be explained with the ingrowth of calcium aluminum silicate hydrate (C-A-S-H) cement phases in the BFS cements in place of more soluble Ca(OH)2 in the OPC cements [22].

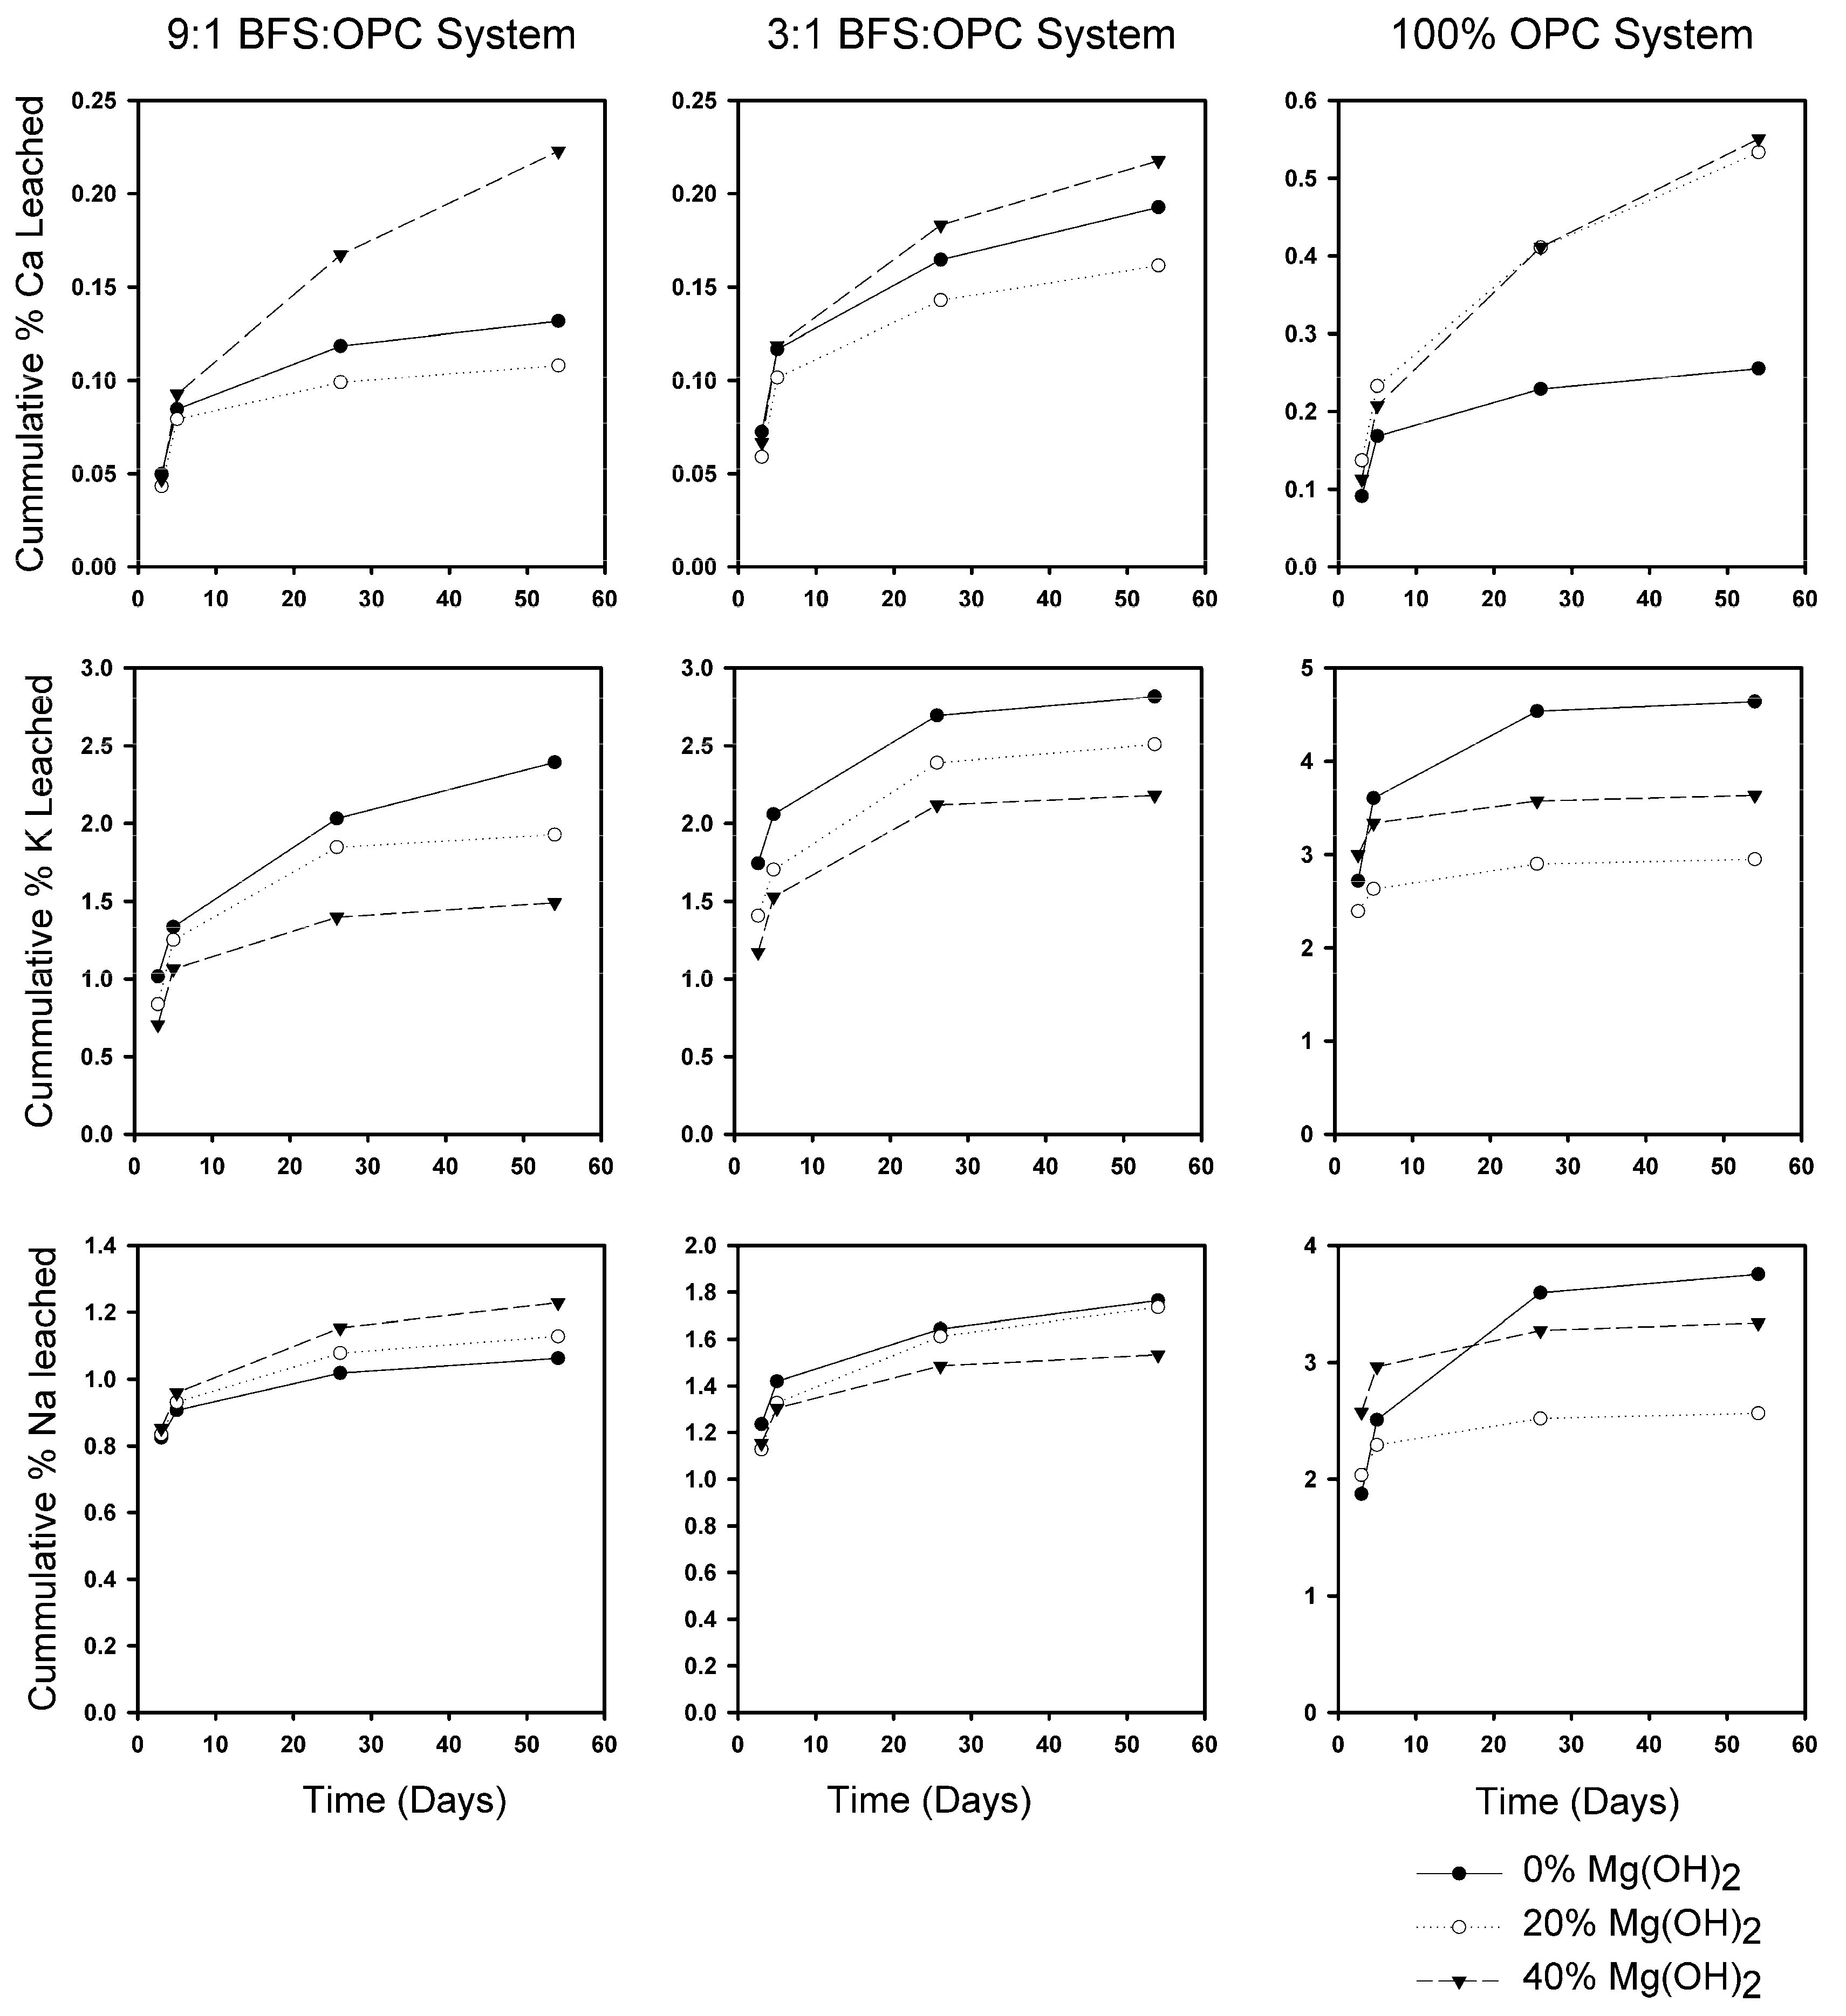
3.2.2. Effect of Mg(OH)2 on Leaching

Ca leaching was enhanced with the addition of 40% Mg(OH)2 (Figure 3). This increase was significant, with over double the quantity of Ca leached from several samples. This enhanced Ca leaching contrasted with leaching of Na and K from the same samples (with one exception, 9:1 BFS:OPC), where the most Na and K was leached from samples containing no Mg(OH)2.
The difference in the range of stable elements leached with different Mg(OH)2 loading was also interesting, with a large difference in Ca leaching rates, with a comparatively small range of leaching rates for Na and K.
As no reaction was observed between the Mg(OH)2 and the cement (Figure 2), the changes in leaching rates are proposed to be due to Mg(OH)2 physically modifying the permeability of the samples. We anticipate that there will be an optimal loading capacity of Mg(OH)2; however, further investigation was beyond the scope of this study.

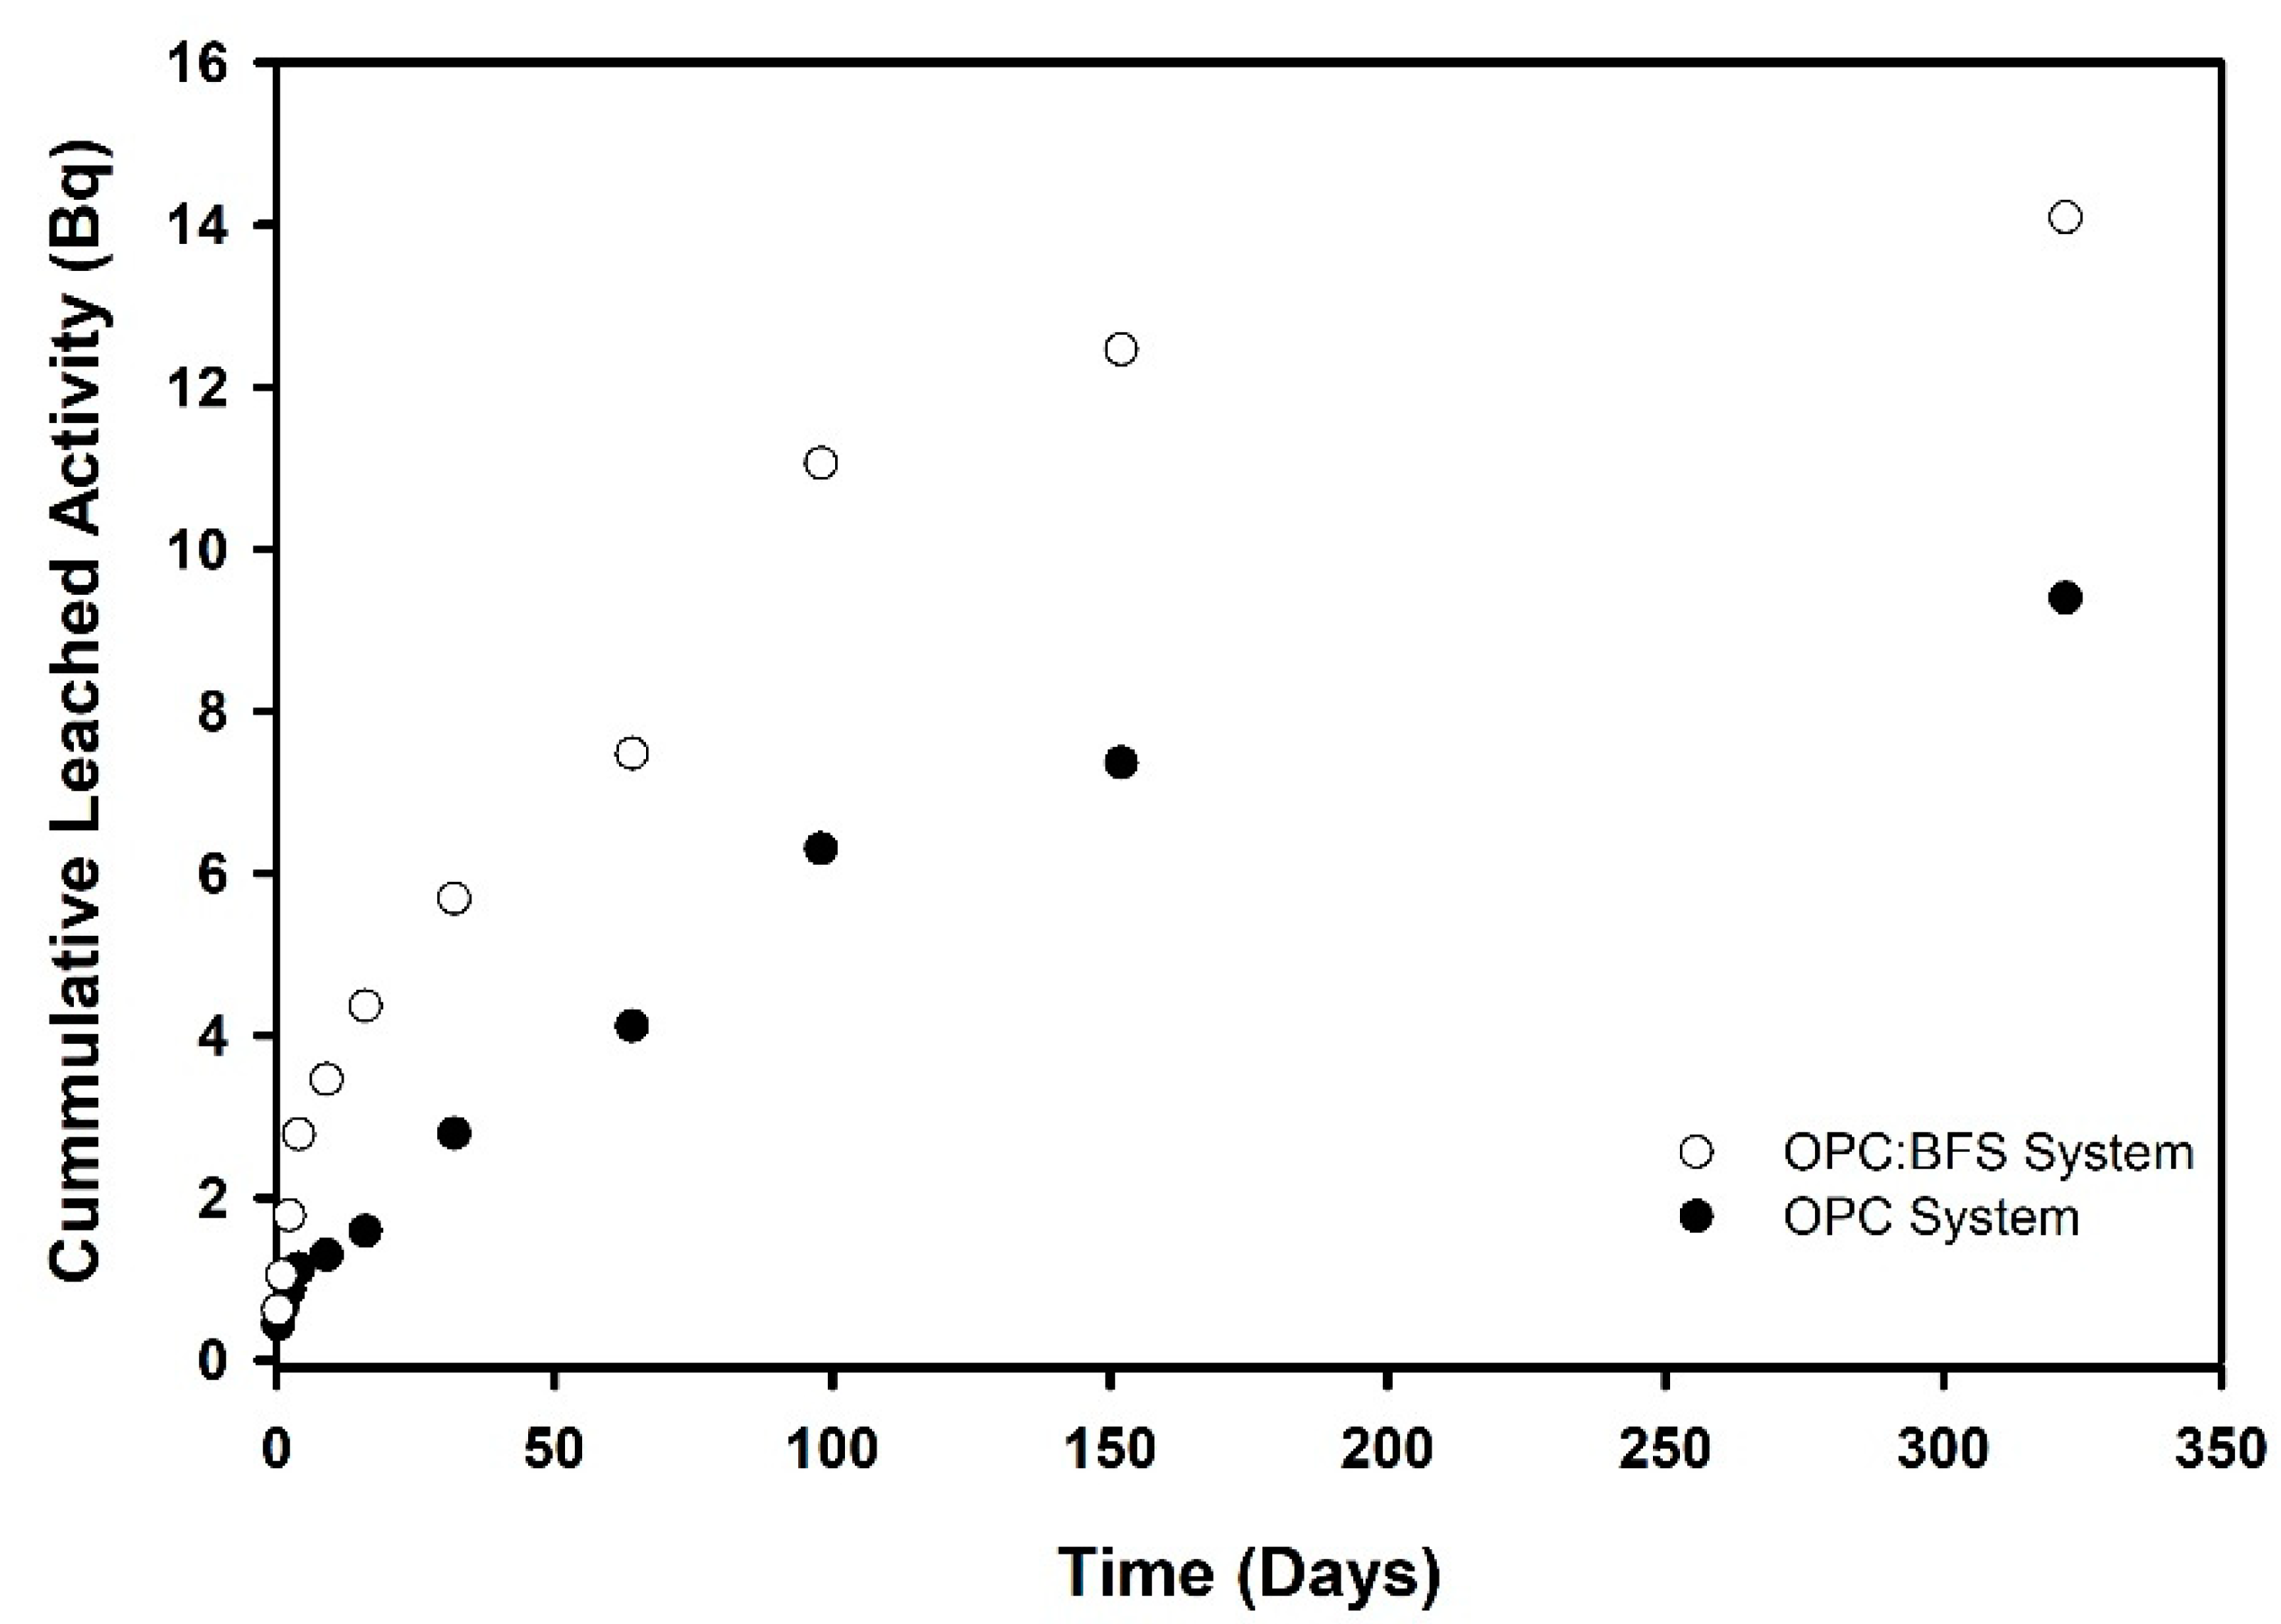
3.2.3. Leaching Rates

The Ca, Na, and K leaching rates showed rapid release for ~6 days, followed by a slower release over a further 35 days, and finally an attainment of a steady state. The initial rate likely involved rapid dissolution from the high surface area virgin sample, and surface alteration (dissolution, re-crystallization, secondary phase formation, and precipitation) before the establishment of an exchange equilibrium at the sample surface, with further dissolution following a diffusion-controlled mechanism. Due to the hyperalkaline conditions in the cement pore solutions, Pu might be expected to be relatively insoluble, due to the ease of Pu(IV) hydrolysis [23], but a very small fraction of the total Pu in the material (an average of 8.6 × 10⁻⁵ relative to the total Pu), was leached (Figure 4). Leaching rates from the Pu samples were initially relatively high, and then slowed down as the experiment progressed (Table 2). The rates are remarkably consistent between the different samples. From analysis of the precipitates and leachates, the majority of Pu was retained in these secondary precipitates found on the cement surface and in the leachate. These secondary phases could act as a diffusion barrier [24], reducing the leach rate, and is most likely due to the ambient atmospheric conditions allowing leached Ca to undergo carbonation and precipitate as calcite [25], and Pu co-precipitating with it. Pu colloids were probably also present; however, the nature of the samples and the secondary deposits precluded any colloid analysis.

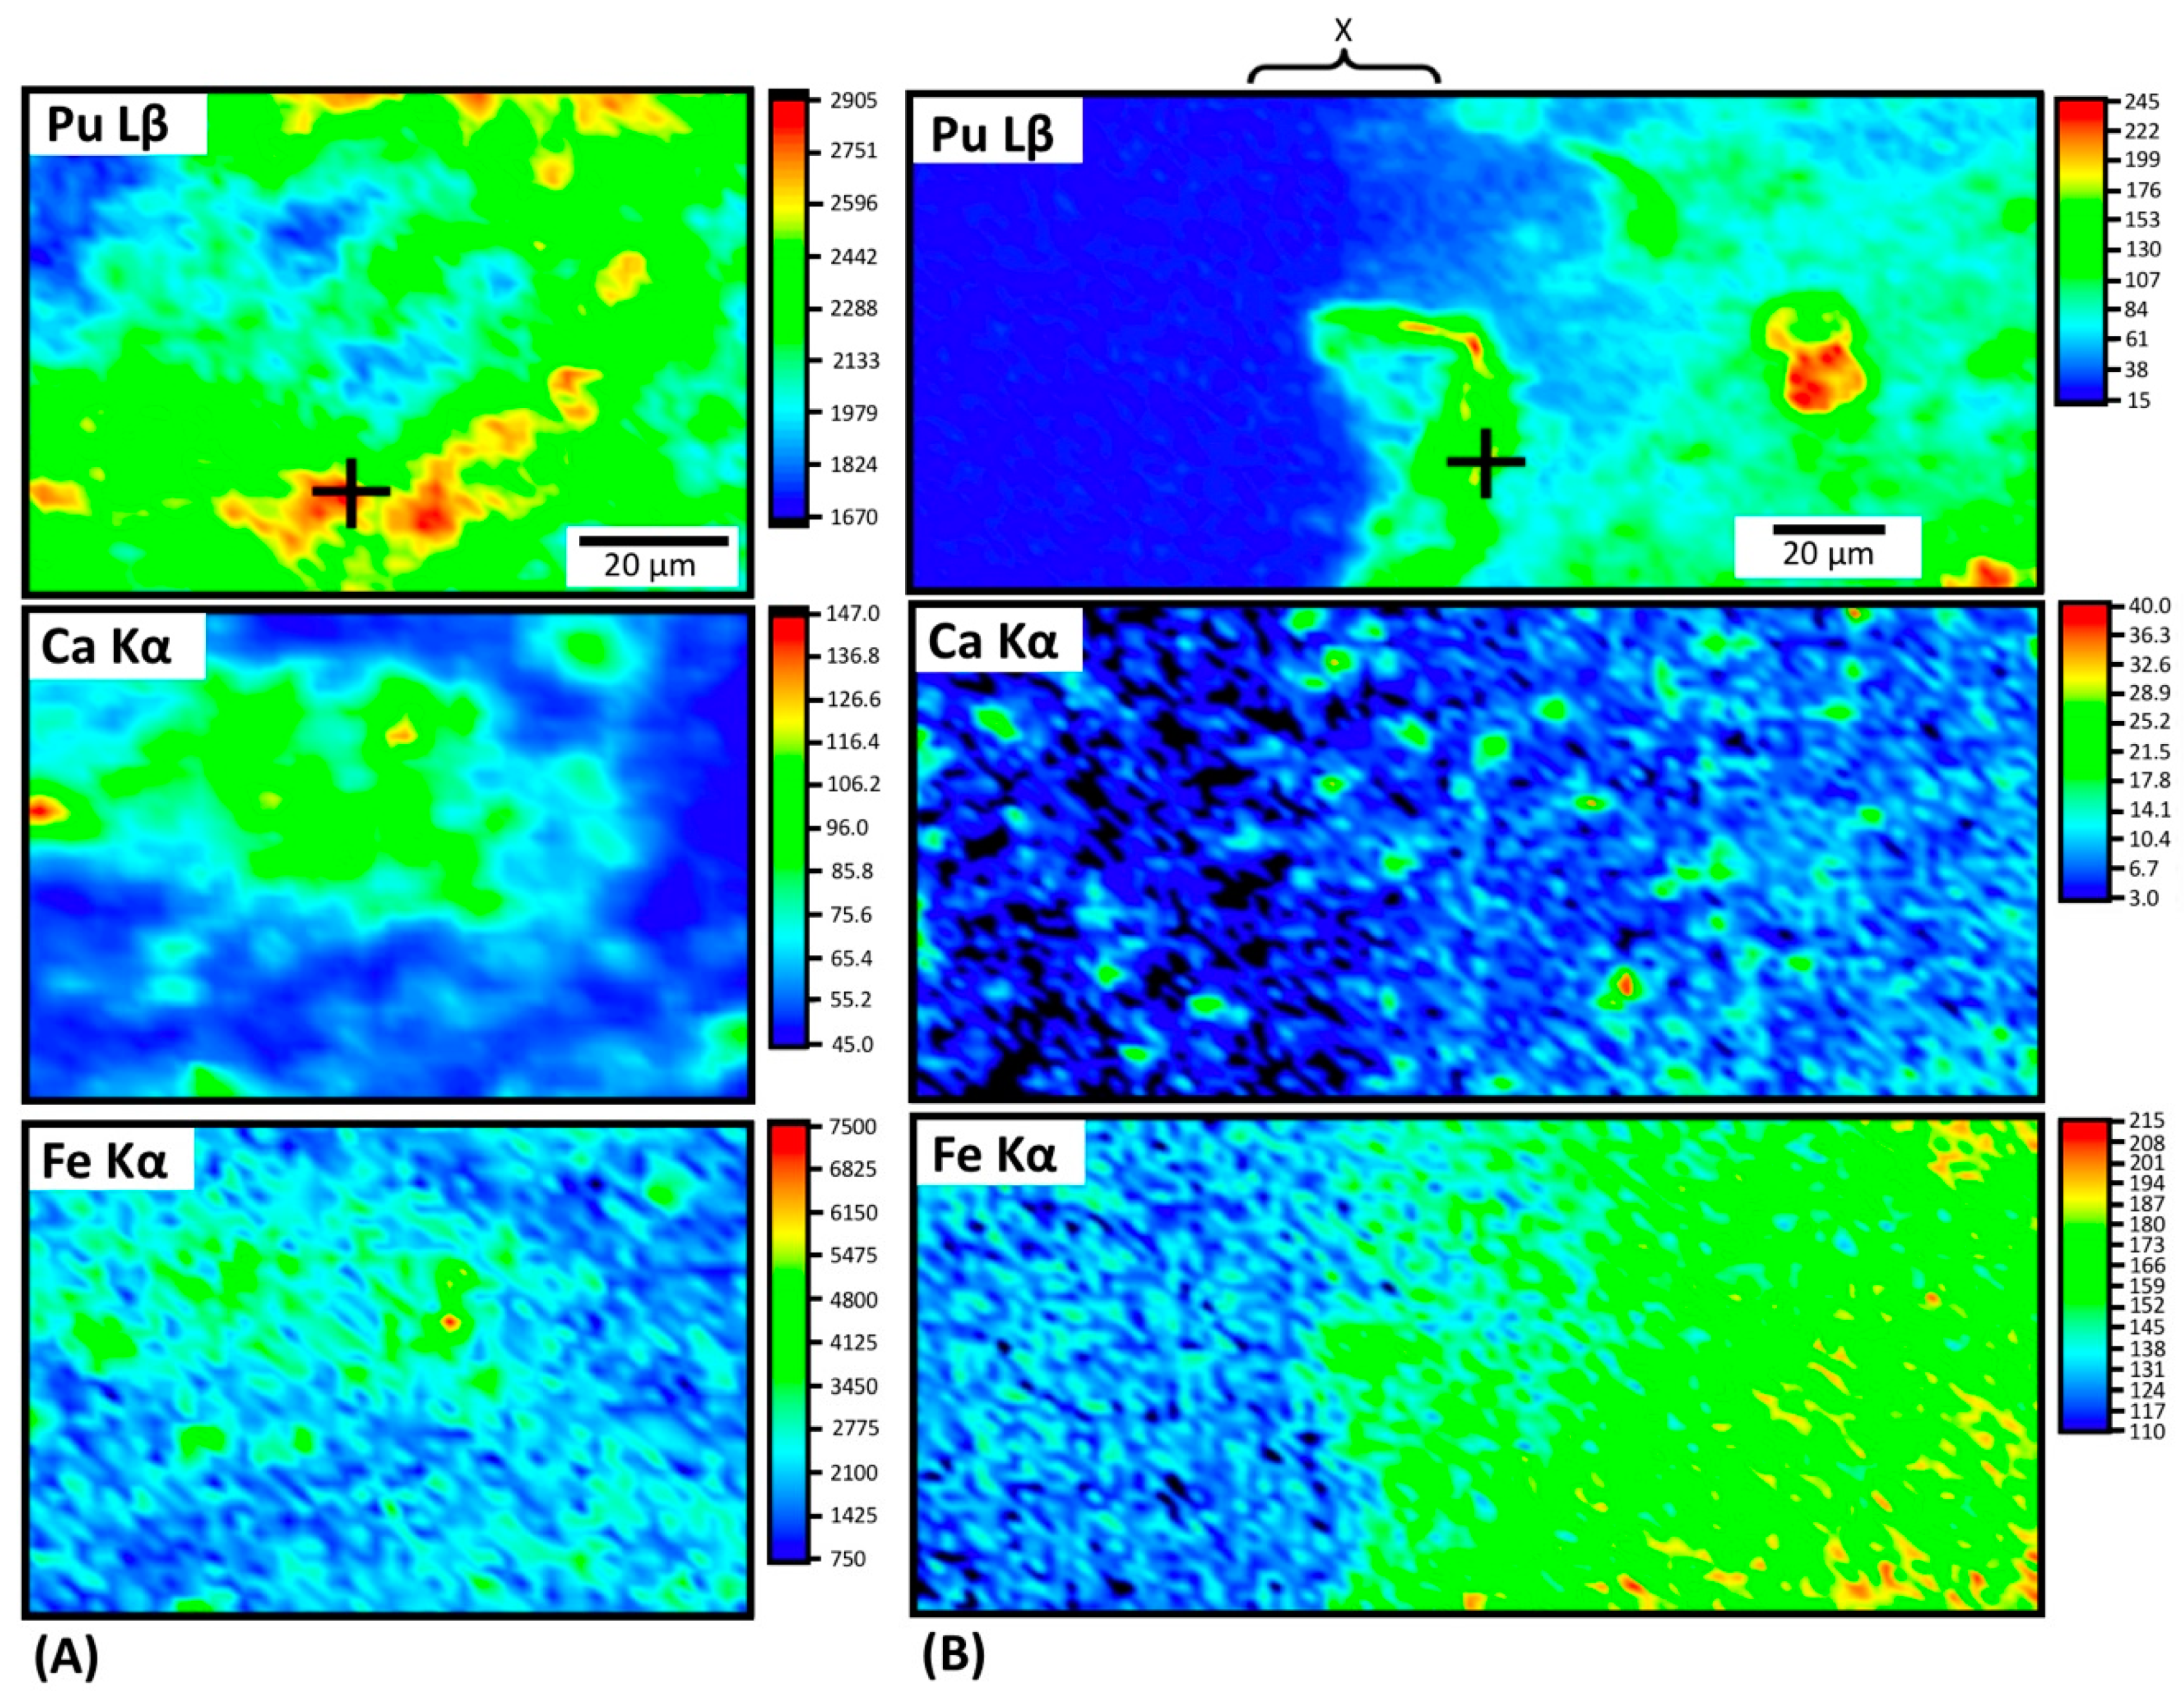
3.3. Characterization of Pu in Altered Cements—Plutonium Distribution and Speciation in Cements

In order to understand the processes controlling Pu behavior, the 242Pu samples were analyzed using synchrotron micro-focus techniques. Synchrotron μ-XRF mapping was used to determine the spatial distribution of Pu relative to the cement-forming phases and leached zones, to identify from which areas of the cement Pu had been removed. The μ-XRF maps were also used to identify spots within the samples where the Pu chemistry could be probed by using μ-XAS.
Only OPC samples were prepared for synchrotron analysis, because the OPC matrix contained fewer potential interfering elements. The XRF spectra showed Ca, Mn, Fe, Ni, Sr, and Pu; As/Pb was also detected, but it could not be resolved, due to peak overlap. μ-XAS spectra were collected from regions of high, medium, and low Pu concentrations, from sites with different local chemistry, from multiple sites along a linear path from the sample surface into the bulk, and from multiple sites along a linear path crossing the interface of the visibly leached zone into the unleached core of the samples. Schematics of the samples with map locations are presented in the Supplementary Material.

X-Ray Fluorescence (XRF) Mapping

XRF mapping of the unleached samples (samples 1 and 4, Table 1, Figure 5A, and Supplementary Materials XRF maps 5–11) showed that the elemental distribution was largely homogenous, although some elements (Pu, Fe, Ca, and Sr) did show preferential accumulation in some areas, most likely due to unreacted OPC minerals with Pu-rich inclusions in the interstitial pores. There was no obvious change in Pu concentration or spatial distribution, due to the macroscale cement chemistry. This indicates that Pu was only controlled by mechanical mixing during sample preparation, as expected from the high pH of the cement pore fluid, which should lead to rapid hydroxylation and precipitation of Pu as Pu(OH)4.
Similar elemental distributions and concentrations were observed in the visibly unaltered cores of the leached samples (Supplementary Materials XRF maps 3, 12, and 17). However, XRF mapping across the interface between the unaltered core and the visibly altered leached zone (Figure 5B and Supplementary Materials XRF maps 1 and 18) revealed substantial depletion of Pu, Ca, and Fe from the leached zone. While the leached layer still contained some Pu, there were no longer any Pu-rich inclusions.

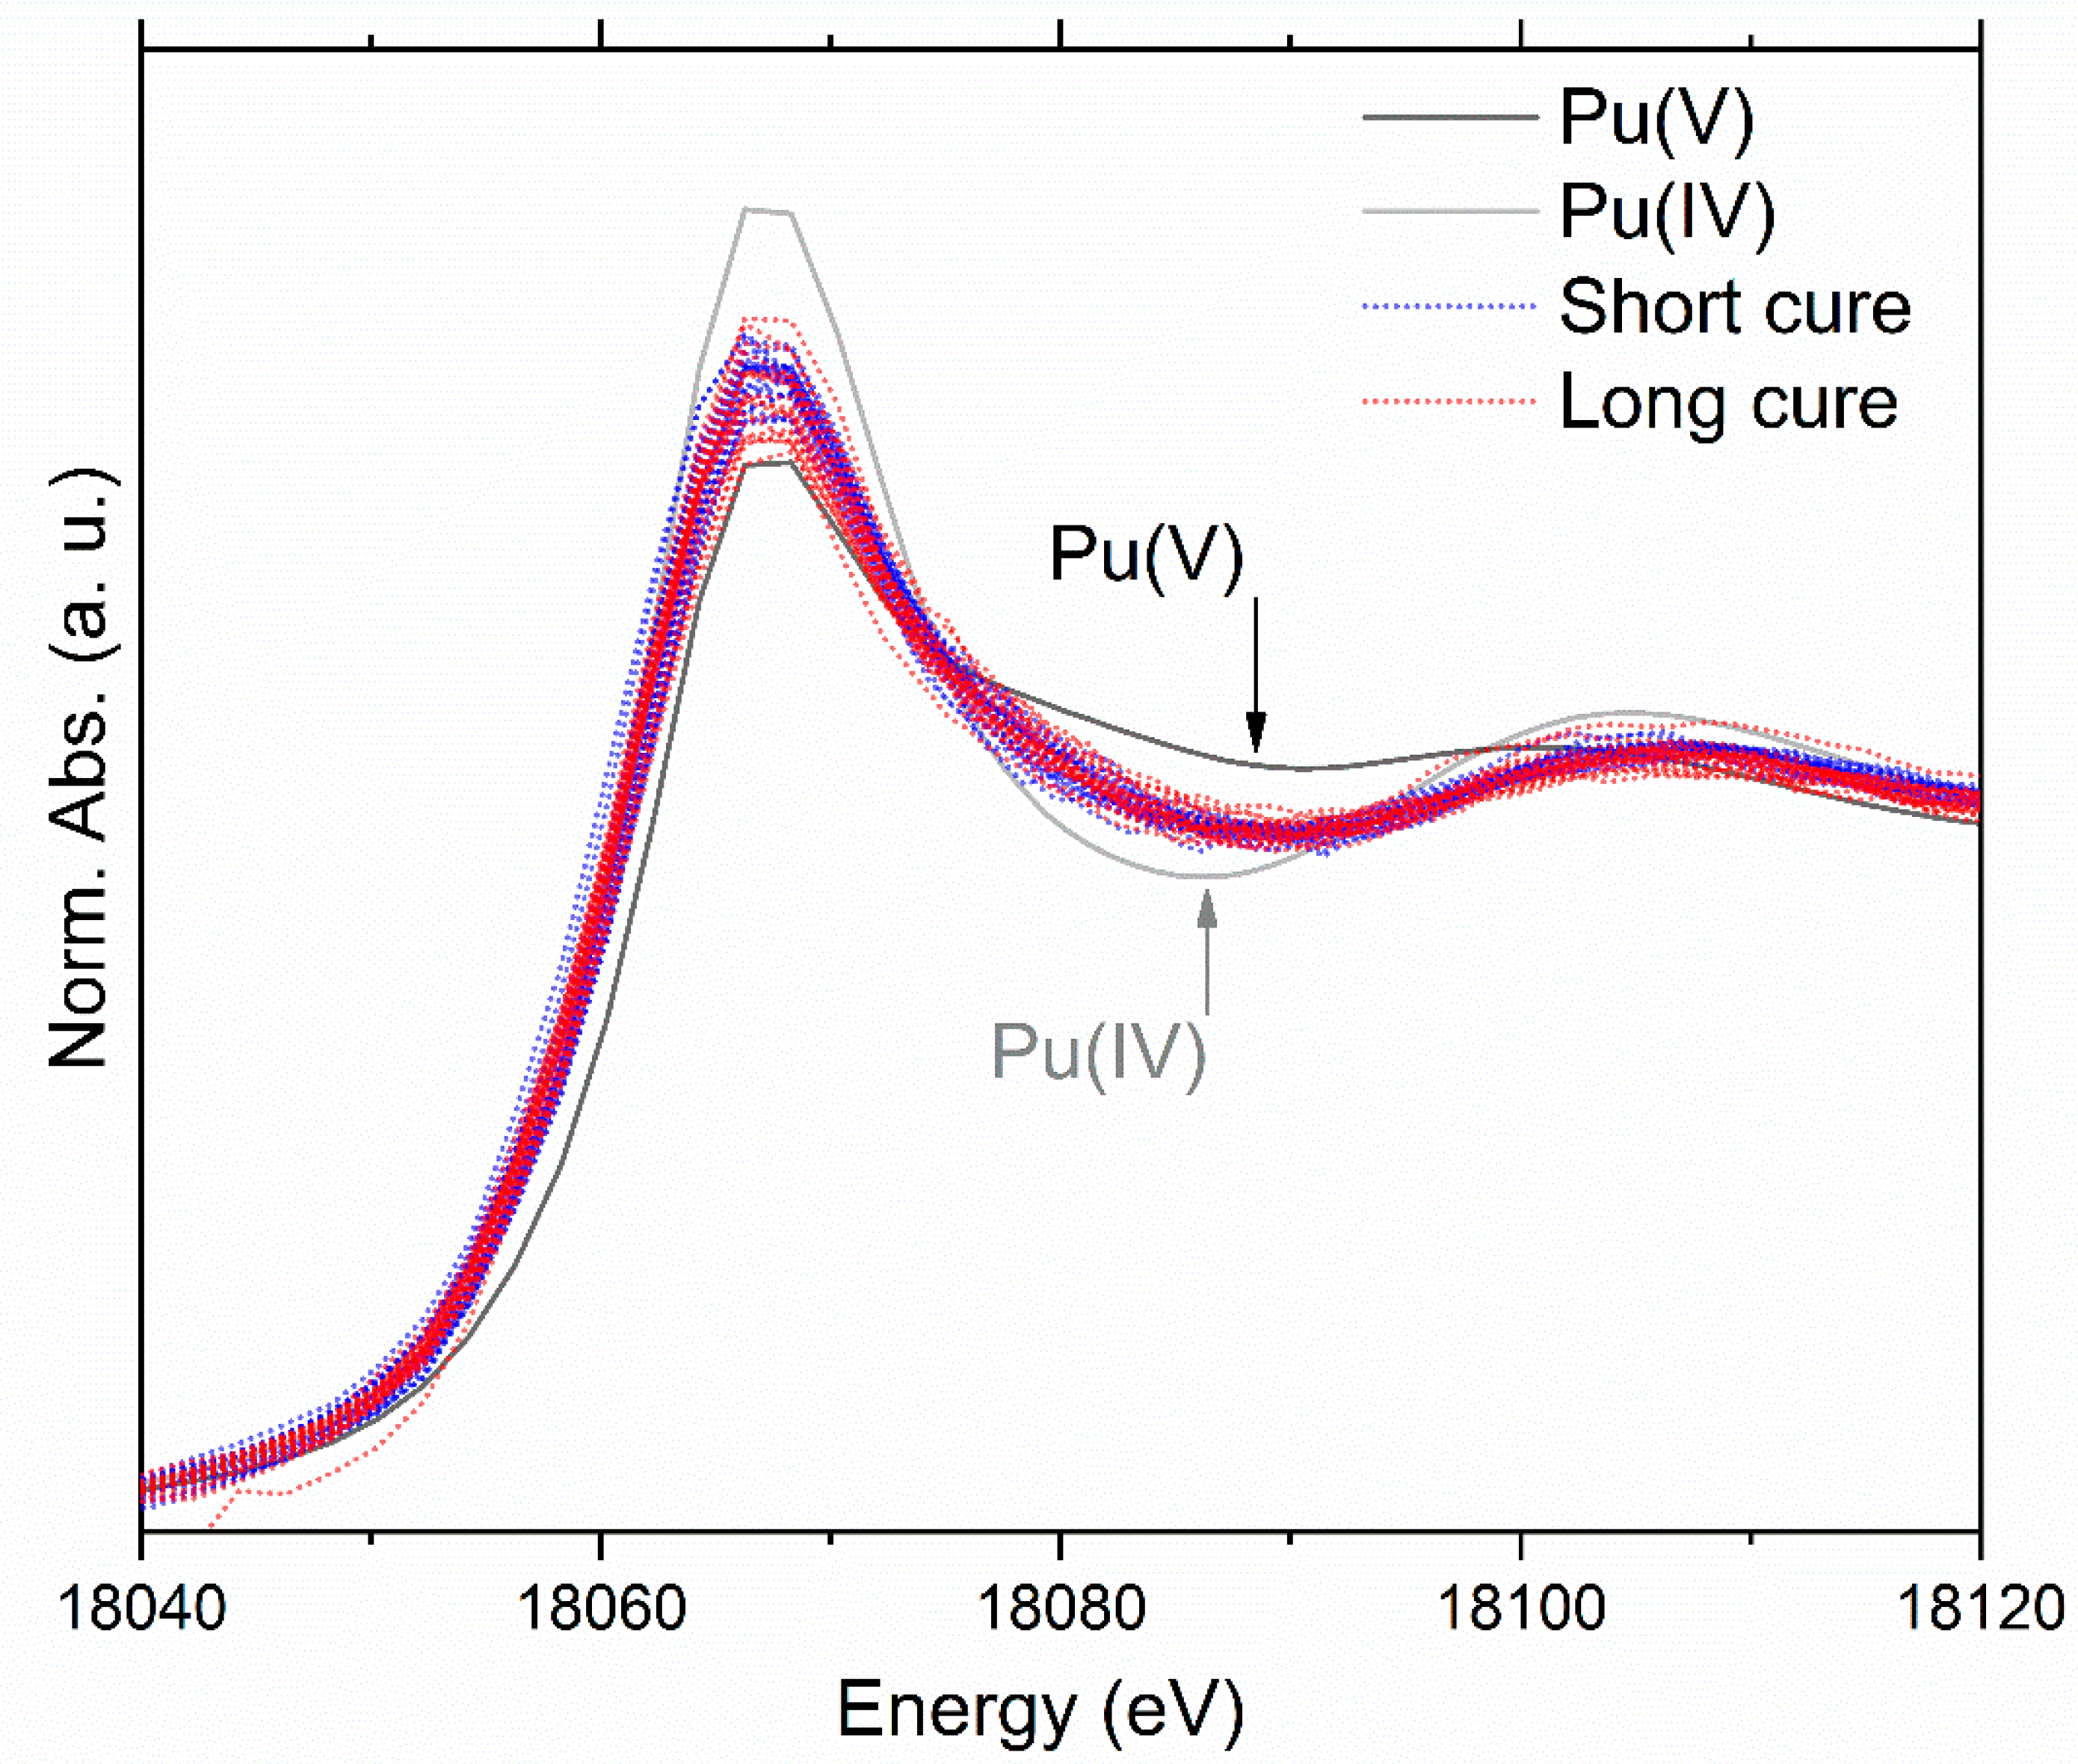
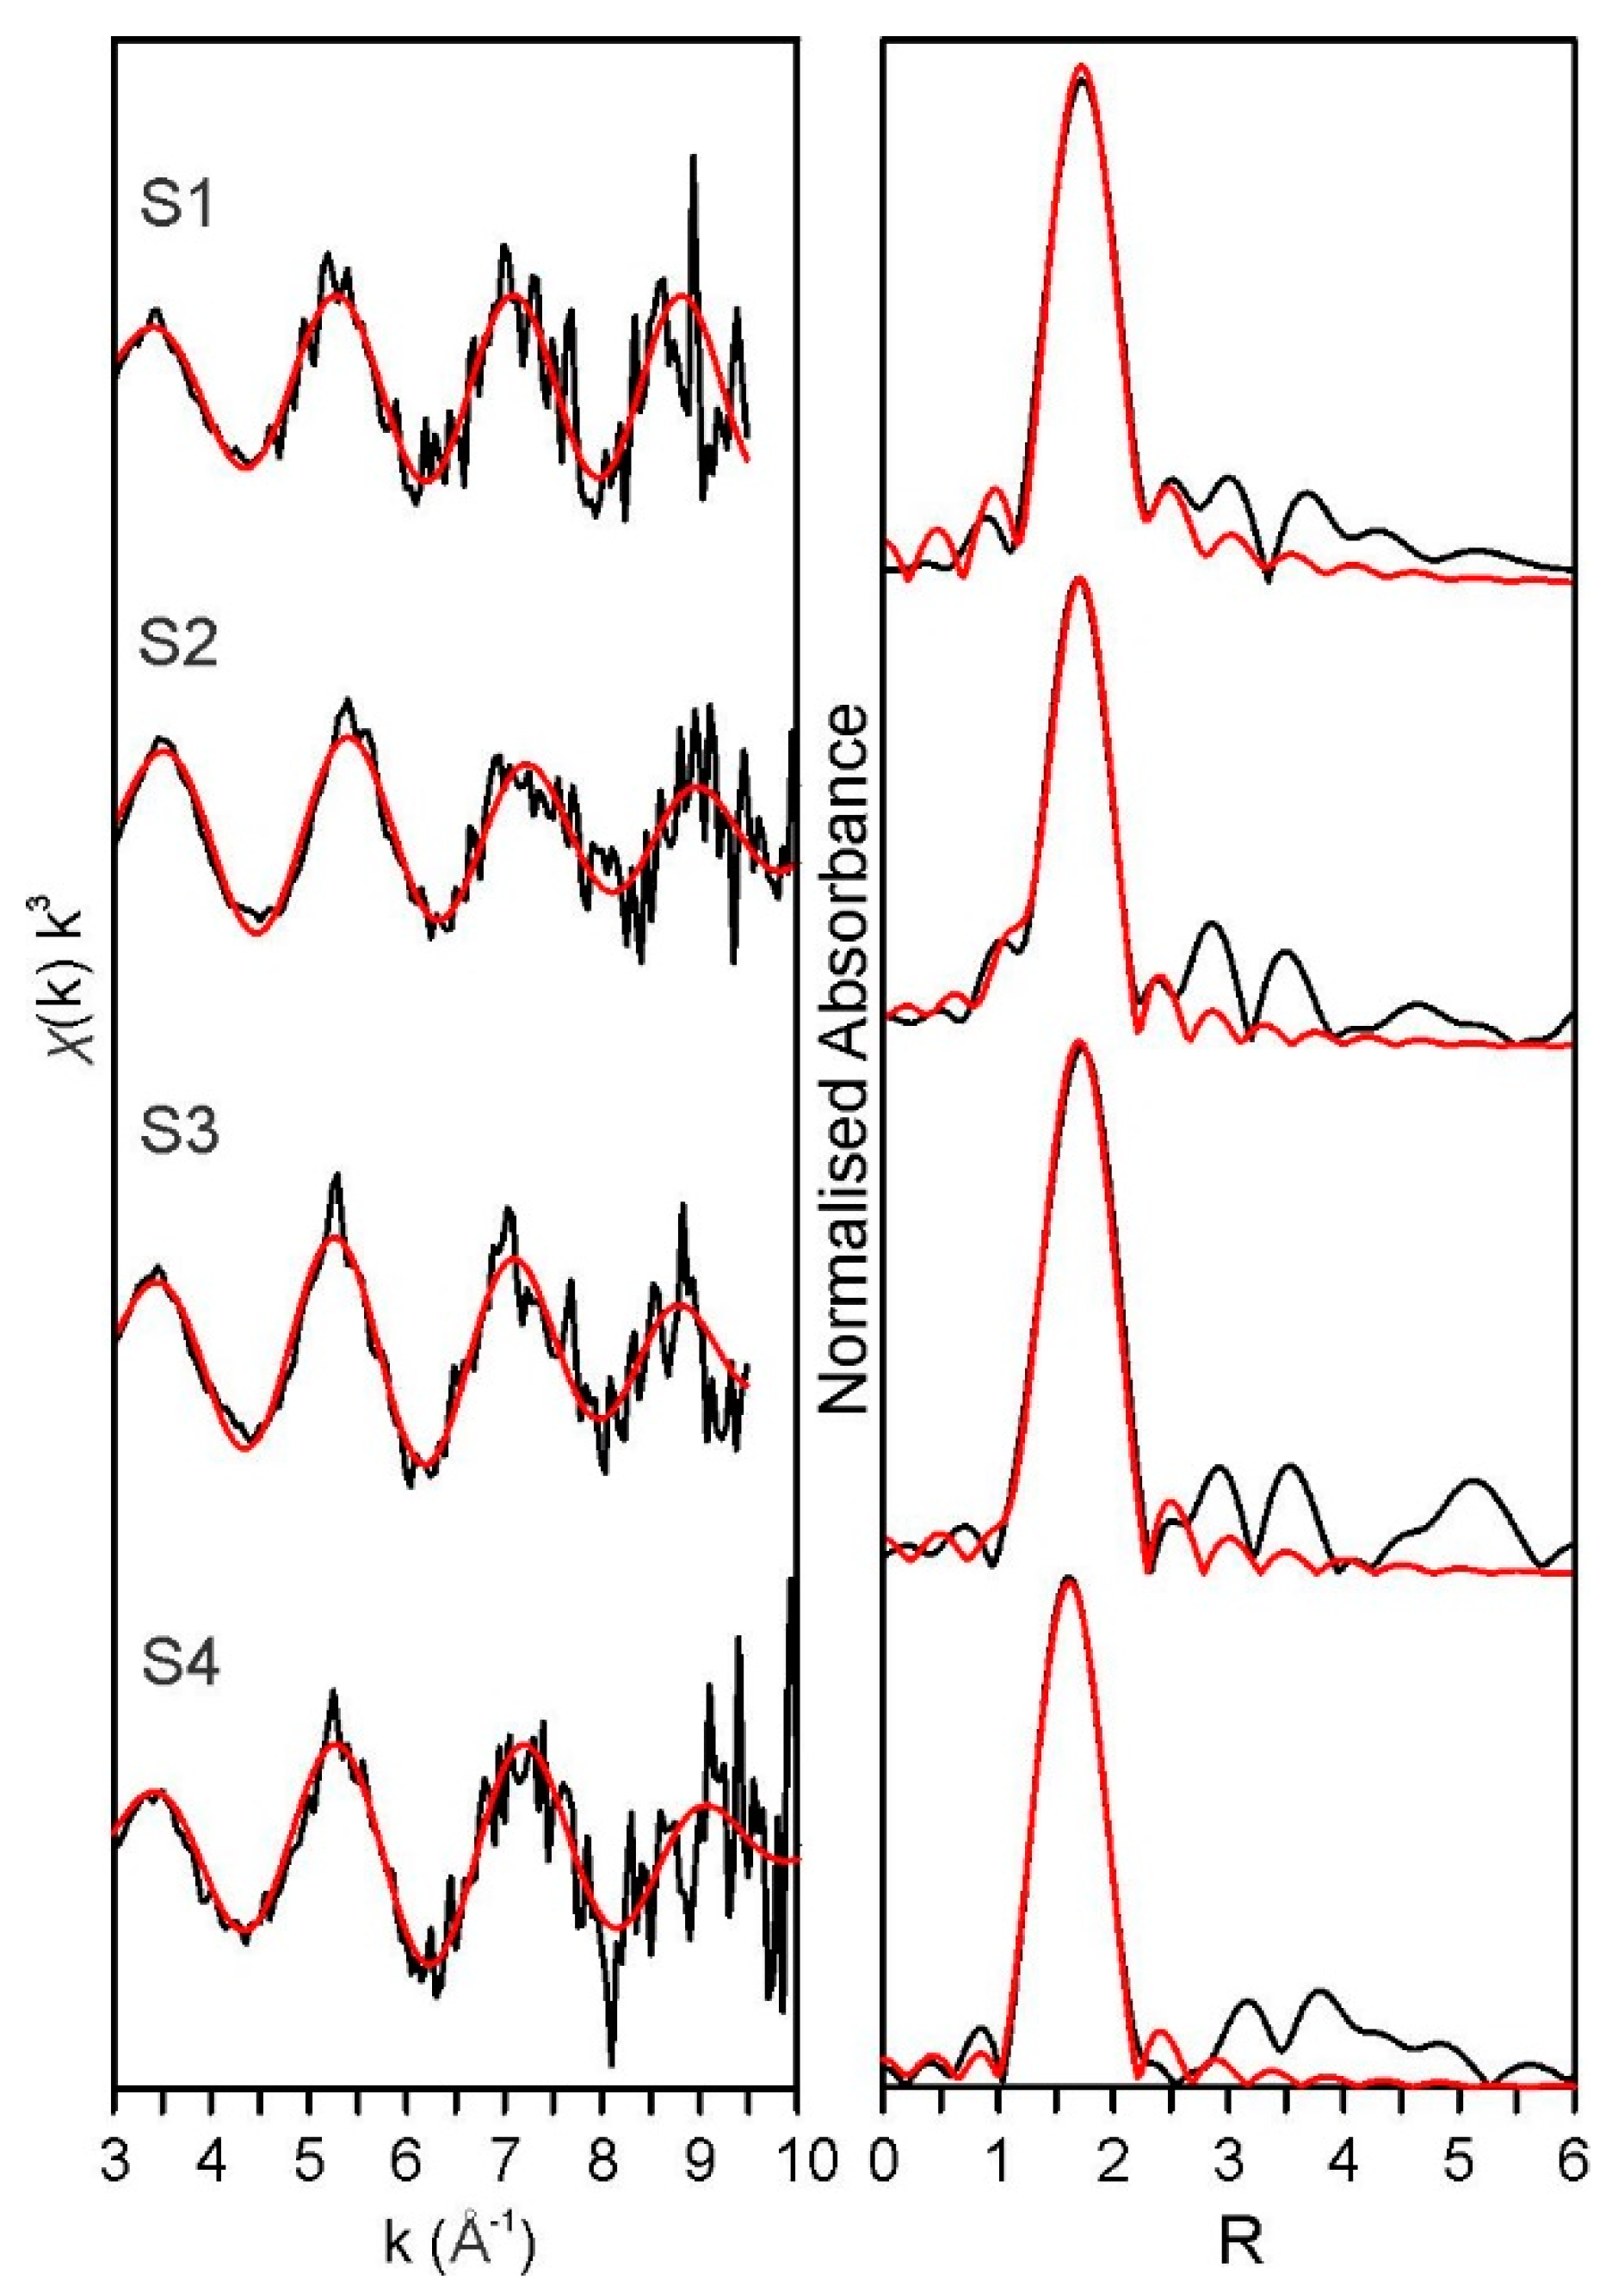
3.4. X-ray Absorption Spectroscopy Discussion

The XANES from all samples (Figure 6) showed little variability, indicating no major change in Pu speciation or the co-ordination environment between samples. A comparison to standards of Pu(IV)aq and Pu(V)aq indicated that the Pu was present as a mixture of the two oxidation states. Linear combination fitting using these standards suggested a slightly higher contribution from Pu(V) to the spectra from the long cure samples (3 & 4, average = 56 ± 3% Pu(V)) compared with the short cure samples (1 & 2, 45 ± 3% Pu(V)), although this was likely not to be beyond the uncertainty in the method (See Supplementary Materials Table S2 for full LCF results). Minor differences between the leached and unleached samples, the leached surface and the unleached core, and the short and long cure samples suggests that oxidation of the Pu occurred during sample preparation (or very shortly after) and continued as the sample aged. Previous studies have shown Pu(IV) to be readily oxidizable, especially at a pH > 1.5 [23], which may explain the mixed Pu oxidation state observed in this study.
Summed micro-focus EXAFS spectra, collected from multiple points across each of the four samples (maps and sample schematics with map locations are shown in the Supplementary Material) are displayed in Figure 7. The result of shell-by-shell fitting for each spectrum is presented in Table 3. Short-cure samples 1 and 2 were best fit with a single equatorial O shell of 5.5–6 atoms (S1 = 2.27 ± 0.01 Å; S2 = 2.25 ± 0.02 Å). In the long-cure samples (3 and 4), the addition of an axial oxygen shell (CN = 0.6 at ~ 1.80 Å) to the fitting models yielded a slight improvement to the overall fit, similar to previous studies [26,27]. Shell addition was verified using an f-test, yielding an 85% (Sample 3) and a 99% (Sample 4) confidence level that the addition of an axial oxygen shell was statistically relevant (for comparison, the addition of an axial O in sample S1 yielded only 17% confidence, and was therefore excluded). Coordination numbers have been fixed in all cases; however, shell occupancy refinement via EXAFS typically has an uncertainty of ±1.0. Whilst LCF of the summed XANES suggested up to a 45–56% contribution from the Pu(V) standard, EXAFS data quality prevented the confident fitting of Pu(V) axial contribution in certain samples. There is no discernible difference between leached (Samples 1 and 4) and unleached (Samples 2 and 3) cement samples, which could both be modeled by using contributions from Pu(V). It is worth noting that in all samples, equatorial oxygen distances were shorter than expected for Pu(IV) (2.34 Å [27]); thus, the average path-length may also indicate a contribution from oxidized Pu. The high levels of noise precluded attempts to fit additional shells, including longer range oscillations, in the data to any reliable degree, although additional fits (including the results of fitting a long-range Pu–Pu shell) are presented in the Supplementary Materials (Table S3) for completeness.

4. Conclusions

The reaction of cement phases with water is well understood. The Mg(OH)2-containing cements used in this study leach readily on contact with water, and results show that the addition of Mg(OH)2 can affect permeability and leaching behavior. The behavior of the cemented Mg(OH)2 powder in this study is consistent with understanding of the incorporation of Mg(OH)2 into a cement matrix. The Pu associated with cemented Mg(OH)2 is present as a mixture of Pu(IV) and Pu(V), and a small proportion of the Pu is leached from the cemented Mg-containing materials on contact with water.
The leaching protocol used here is relatively aggressive, so that the leach rates observed are likely to be higher than will be encountered in a geological disposal facility. The changes in groundwater chemistry encountered in a geological disposal facility over time will also require consideration. Nevertheless, these experiments have demonstrated the potential for the leaching of Pu from cementitious wasteforms, and this underlying significance requires further investigation.

Supplementary Materials

The following are available online at https://www.mdpi.com/2076-3263/9/1/31/s1, Table S1: Composition of Ordinary Portland Cement and Blast Furnace Slag, determined by XRF. Figure S1: Supplementary XRD Patterns. Figure S2: Release of 239Pu from cement samples over square root time. Table S2: Results of Linear Combination Fitting (LCF) using Athena for each of the spectra collected in the study. Table S3: Additional EXAFS fitting parameters and statistics for select samples. Supplementary XRF maps and sample schematics.

Author Contributions

Conceptualization, K.A.L., S.P. and F.R.L.; Data curation, K.A.L., S.P. and S.M.H.; Formal analysis, K.A.L., S.P., A.J.F., W.R.B. and G.T.W.L.; Funding acquisition, F.R.L.; Investigation, K.A.L., S.P. and D.K.; Methodology, S.P.; Resources, N.D.B., L.O. and F.R.L.; Software, S.L.H.; Supervision, N.D.B., G.T.W.L. and F.R.L.; Writing—original draft, K.A.L., S.P. and F.R.L; Writing—review and editing, K.A.L., S.P., N.D.B., S.L.H., A.J.F., W.R.B., G.T.W.L. and F.R.L.

Funding

This work was carried out as part of the UK EPSRC programme, Keeping the Nuclear Option Open under grant EP/C549465/1.

Acknowledgments

We are grateful to the Advanced Photon Source for beamtime, and to the UK NERC Envirosynch programme for support. G.T.W.L and F.R.L also acknowledge funding support from NERC (NE/M014088/1). Use of the Advanced Photon Source, an Office of Science User Facility operated for the U.S. Department of Energy (DOE) Office of Science by Argonne National Laboratory, was supported by the U.S. DOE under Contract No. DE-AC02-06CH11357. We are grateful to AcReDaS [28] for archiving and supply of the XANES standard spectra used in this manuscript.

Conflicts of Interest

The authors declare no conflict of interest.

References

  1. Jones, S.R.; Gray, J.; Smith, A.D. Discharges to the environment from the Sellafield site 1952–1992. J. Radiol. Prot. 1995, 15, 99–131. [Google Scholar]
  2. Gregson, C.R.; Goddard, D.T.; Sarsfield, M.J.; Taylor, R.J. Combined electron microscopy and vibrational spectroscopy study of corroded Magnox sludge from a legacy spent nuclear fuel storage pond. J. Nucl. Mat. 2011, 412, 145–156. [Google Scholar] [CrossRef]
  3. NDA; RWMD. The 2007 UK Radioactive Waste Inventory; NDA/RWMD/004; NDA: Moor Row, UK, March 2008.
  4. Gregson, C.R.; Hastings, J.J.; Sims, H.E.; Steele, H.M.; Taylor, R.J. Characterisation of plutonium species in alkaline liquors sampled from a UK legacy nuclear fuel storage pond. Anal. Methods 2011, 3, 1957–1968. [Google Scholar] [CrossRef]
  5. Nuclear Decommissioning Authority Strategy 2011; Nuclear Decommissioning Authority: Moor Row, UK, March 2011.
  6. Palmer, J.D.; Fairhall, G.A. Properties of cement systems containing intermediate level wastes. Cem. Concr. Res. 1992, 22, 325–330. [Google Scholar] [CrossRef]
  7. Managing Radioactive Waste Safely—A Framework for Implementing Geological Disposal; Department of Environment, Food and Rural Affairs: London, UK, 2008.
  8. Baldwin, T.; Chapman, N.; Neall, F. Geological Disposal Options for High-Level Waste and Spent Fuel; Nuclear Decommissioning Authority: Moor Row, UK, 2008.
  9. Chambers, A.; Gould, L.; Harris, A.; Pilkington, N.; Williams, S. Evolutions of the Near Field of NIREX Disposal Concept; Nirex: Harwell, Oxfordshire, UK, 2003. [Google Scholar]
  10. Generic Repository Studies—Generic Post Closure Performance Assessment; Report N/080; Nirex: Harwell, Oxfordshire, UK, 2003.
  11. Generic Repository Studies—Generic Waste Package Specification; Volume 1—Specification; Report N/104; Nirex: Harwell, Oxfordshire, UK, 2007.
  12. NDA. Waste Package Specification and Guidance Documentation. WPS/906: Guidance on the Packaging of Closed Sources; Number 10157950; NDA: Moor Row, UK, February 2009.
  13. Clark, D.L.; Hecker, S.S.; Jarvinen, G.D.; Neu, M.P. Plutonium. In The Chemistry of the Actinide and Transactinide Elements, 4th ed.; Morss, L.R., Edlestien, N.M., Fruger, J., Eds.; Springer: Dordrecht, The Netherlands, 2010; Volume 2, pp. 813–1264. [Google Scholar]
  14. Leaching Characteristics of Moulded or Monolithic Building and Waste Materials: Determination of Leaching of Inorganic Components with the Diffusion Test; EA NEN 7375; UK Environment Agency: Bristol, UK, 2005.
  15. Heald, S.M.; Cross, J.O.; Brewe, D.J.; Gordon, R.A. The PNC/XOR X-ray microprobe station at APS sector 20. Nucl. Instrum. Methods Phys. Res. A 2007, 582, 215–217. [Google Scholar] [CrossRef]
  16. Ravel, B.; Newville, M. Athena, Artemis, Hephaestus: Data analysis for X-ray absorption spectroscopy using IFEFFIT. J. Syncotron Radiat. 2005, 12, 537–541. [Google Scholar] [CrossRef] [PubMed]
  17. Di Giandomenico, M.V.; Le Naour, C.; Simoni, E.; Guillaumont, D.; Moisy, P.; Hennig, C.; Conradson, S.D.; Den Auwer, C. Structure of early actinides (V) in acidic solutions. Radiochim. Acta 2009, 97, 347–353. [Google Scholar] [CrossRef]
  18. Ankudinov, A.L.; Ravel, B.; Rehr, J.J.; Conradson, S.D. Real-space multiple-scattering calculation and interpretation of x-ray absorption near-edge structure. Phys. Rev. B 1998, 58, 7565–7576. [Google Scholar] [CrossRef]
  19. Caldwell, R.J.; Rawlinson, S.; Butcher, E.J.; Godfrey, L.H. Characterisation of full-scale historic inactive cement-based intermediate level nuclear wasteforms. In Stabilisation/Solidification Treatment and Remediation, Advances for S/S in Waste Contaminated Land; Al-Tabbaa, A., Stegemann, J.A., Eds.; Taylor and Francis: London, UK, 2005; pp. 139–148. [Google Scholar]
  20. Collier, N.C.; Milestone, N.B. The encapsulation of Mg(OH)2 sludge in composite cement. Cem. Concr. Res. 2010, 40, 452–459. [Google Scholar] [CrossRef]
  21. Jain, J.; Neithalath, N. Analysis of calcium leaching behavior of plain and modified cement pastes in pure water. Cem. Concr. Comp. 2009, 31, 176–185. [Google Scholar] [CrossRef]
  22. Gorce, J.-P.; Milestone, N.B. Probing the microstructure and water phases in composite cement blendes. Cem. Concr. Res. 2007, 37, 310–318. [Google Scholar] [CrossRef]
  23. Neck, V.; Kim, J.I. Solubility and hydrolysis of tetravalent actinides. Radiochim. Acta 2001, 89, 1–16. [Google Scholar] [CrossRef] [Green Version]
  24. Schwotzer, M.; Scherer, T.; Gerdes, A. Protective or damage promoting effect of calcium carbonate layers on the surface of cement based materials in aqueous environments. Cem. Conc. Res. 2010, 40, 1410–1418. [Google Scholar] [CrossRef]
  25. Dow, C.; Glasser, F.P. Calcium carbonate efflorescence on Portland cement and building materials. Cem. Conc. Res. 2003, 33, 147–154. [Google Scholar] [CrossRef]
  26. Dardenne, K.; Seibert, A.; Denecke, M.A.; Marcquardt, C.M. Plutonium (III, IV, VI) speciation in Gorleben groundwater using XAFS. Radiochim. Acta 2009, 97, 91–97. [Google Scholar] [CrossRef]
  27. LoPresti, V.; Conradson, S.D.; Clark, D.L. XANES identification of plutonium speciation in RFETS samples. J. Alloy. Compd. 2007, 444–445, 540–543. [Google Scholar] [CrossRef]
  28. Rossberg, A.; Scheinost, A.C.; Schmeisser, N.; Rothe, J.; Kaden, P.; Schild, D.; Wiss, T.; Daehn, R. AcReDaS, an Actinide Reference Database for XAS, EELS, IR, Raman and NMR Spectroscopy. Available online: https://www.hzdr.de/acredas (accessed on 30 November 2018).
Figure 1. Leached 242Pu containing cement pellet (12 mm diameter), showing the altered leached layer around the darker, unaltered unleached interior.
Geosciences 09 00031 g001
Figure 2. XRD patterns of Mg(OH)2, with OPC, 3:1 BFS/OPC, and 9:1 BFS/OPC with and without 20 wt % Mg(OH)2. No phases from reaction of Mg(OH)2 with cement samples can be identified in the patterns. Ancillary XRD patterns are supplied in the Supplementary Materials Figure S1.
Geosciences 09 00031 g002
Figure 3. Stable element leaching data for 9:1 BFS:OPC, 3:1 BFS:OPC, and OPC systems with varying levels of Mg(OH)2.
Geosciences 09 00031 g003
Figure 4. Release of 239Pu from cement samples over time. Samples are 100% OPC and 3:1 BFS:OPC. For comparison, this figure is shown as cumulative leached activity vs √time in Supplementary Materials Figure S2.
Geosciences 09 00031 g004
Figure 5. μ-XRF maps showing Pu, Ca, and Fe across two cement samples. (A) μ-XRF maps of Pu, Ca, and Fe from the unaltered core of sample 4 (unleached, long cure). XAS spectra were collected from the area marked with cross hairs. (B) XRF maps from sample 3 (leached, long cure) showing the interface of the leached zone into the unleached area (interface marked with an X). XAS data were collected from the spot marked with cross hairs on the boundary with the leached horizon. This probed Pu chemistry at the front of the advancing dissolution zone where the Pu- and cement- elements (Ca, Fe) were depleted.
Geosciences 09 00031 g005
Figure 6. Pu L3 edge XANES from all sampling points with comparative standards of Pu(IV)aq (grey) and Pu(V)aq (black) [17]. Spectra in blue dots are from samples 1 and 2, (short 13-day cure) and spectra in red dots are samples 3 and 4 (long 130-day cure).
Geosciences 09 00031 g006
Figure 7. Summed Pu L3 edge EXAFS spectra from the four cement samples (see Table 1 for sample details) with their corresponding fits (red lines). Data are presented as k3 alongside non-phase-corrected Fourier transforms.
Geosciences 09 00031 g007
Table 1. Summary of Pu-containing sample preparation and pre-treatment. Samples containing 239Pu were used for leaching experiments, while those containing 242Pu were used for spectroscopic studies. Leached and unleached examples of the 242Pu-containing samples were prepared.
SampleSample IDPu SpikeCure Time (Days)LeachedSpectroscopy
BFS/OPC Short cureA100 kBq 239Pu13Yes—322 daysNo
BFS/OPC Long cureB100 kBq 239Pu130Yes—322 daysNo
OPC Short cureC100 kBq 239Pu13Yes—322 daysNo
OPC Long cureD100 kBq 239Pu130Yes—322 daysNo
OPC Short cure1460 kBq 242Pu13NoYes
OPC Short cure2460 kBq 242Pu13Yes—98 daysYes
OPC Long cure3460 kBq 242Pu130Yes—64 daysYes
OPC Long cure4460 kBq 242Pu130NoYes
Table 2. Initial and long-term leach rates of 239Pu from cement samples.
SampleSample IDInitial Leach Rate
% Pu per Day
Long Term Leach Rate
% Pu per Day
BFS/OPC Short CureA6.0 × 10−41.8 × 10⁻⁵
BFS/OPC Long CureB1.0 × 10−32.9 × 10⁻⁵
OPC Short CureC6.5 × 10−42.9 × 10⁻⁵
OPC Long CureD1.0 × 10−34.4 × 10⁻⁵
Table 3. EXAFS fitting parameters and statistics for the four analyzed samples. Here, S02 denotes the amplitude reduction factor, N denotes coordination number (shell occupancy), R denotes interatomic distance, σ2 denotes the Debye–Waller factor and the ‘r-factor’ denotes the least squared residual for the overall fit. Parameters marked ‘*’ were fixed during the fitting process. Numbers in brackets are the number of spectra summed to provide the dataset for fitting. ‘ax’ and ‘eq’ denote the axial and equatorial oxygen shells, respectively. Sampling locations are shown in the Supplementary Materials XRF Maps 1–18.
SamplePathS02Error ±NRError ±σ2Error ±r-Factor
S1 (4)Pu—Oeq0.800.105.5 *2.270.010.0020.0020.009
S2 (3)Pu—Oeq0.930.116.0 *2.250.020.0090.0030.013
S3 (4)Pu—Oax0.90 * 0.6 *1.810.040.0020.0070.017
Pu—Oeq 6.0 *2.290.020.0060.001
S4 (3)Pu—Oax 0.90 * 0.7 *1.80.010.0020.0030.008
Pu—Oeq 6.0 *2.250.020.0090.001

