1. Introduction
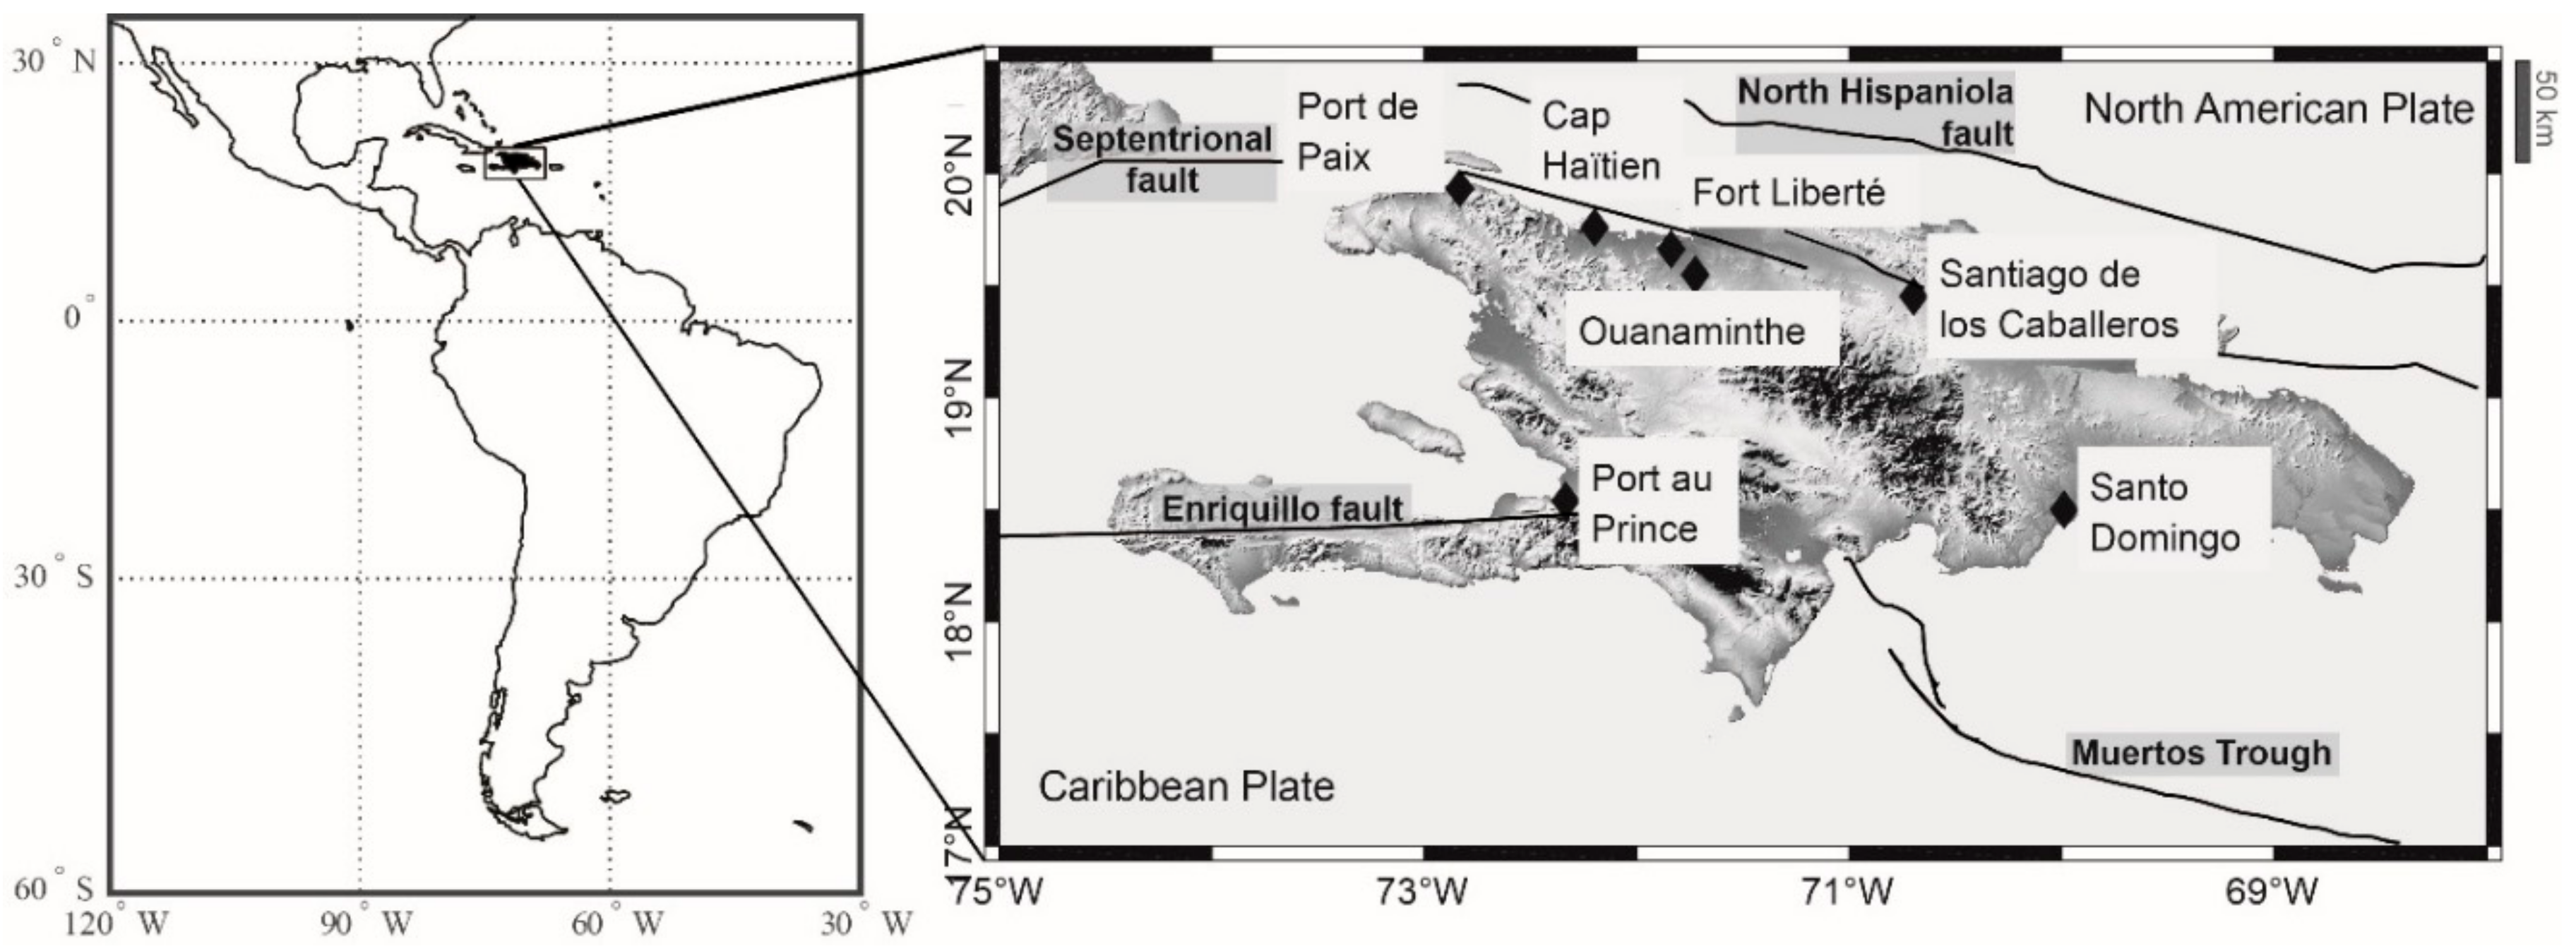
After the great disaster caused by the January 2010 Mw 7.1 Haiti earthquake in the region of Port-au-Prince, the evaluation of the seismic hazard in the whole Hispaniola Island became an imperative need. The movements of the Caribbean and North American plates are responsible for significant seismic activity, and the northern part of the island is also exposed to the activity of a major fault, the Septentrional fault, whose location is shown in
Figure 1. The January 2010 Haiti earthquake is associated with the Enriquillo–Plantain fault system on the west of the island, whereas the Muertos Trough has generated events with significant impact on the southeastern cities [
1,
2,
3]. In response to these newly recognized scenarios of high seismic hazard, significant investigation efforts have been directed to characterize the distribution and intensity of ground motion on Hispaniola Island; however, they have been focused mainly on the most recently affected area, Port-au-Prince. A study of the tectonic setting of the Port-au-Prince metropolitan area led to new maps of active faults and geological structures [
4]. As no shaking histories of the 2010 Haiti earthquake have been publicly available, several authors used numerical simulations and modeled the source process to study the ground-motion characteristics generated by the event [
5,
6]. Other authors [
7,
8] used aftershocks to study the amplification effects of topography or geological surficial layering. In order to propose levels of seismic action to be considered for reconstruction projects in Port-au-Prince, a seismic macrozonation map of the city was produced in the year following the earthquake [
9] based on measurements of
, using the method of multichannel analysis of surface waves (MASW). More recently, site effects at Port-au-Prince were studied [
10] using numerical simulations and spectral ratios from weak events, finding moderate amplification at most sites. In the case of the other main urban areas in Hispaniola, the level of knowledge and resolution of the local seismic hazard is relatively low. Lack of seismological, geophysical, and geotechnical data creates uncertainty in characterizing the different kind of soils on which cities are growing. The NATHAT program [
11] has provided some local hazards maps of site effects and liquefaction for the whole country of Haiti, but they cannot be used directly for seismic microzonation, which is generally performed at finer scales (for example, 1/25,000), more appropriate to be used in urban regions. Given the exposure to strong seismic events of most cities in Hispaniola, there is a need to update local soil information at a scale compatible with an urban-area scale.
Between 2011 and 2016, the governments of Haiti and the Dominican Republic launched programs of seismic microzonation for important cities. As a result of these programs, the Bureau de Recherches Géologiques et Minières (BRGM) has finalized microzonation studies for seven cities in La Hispaniola, five in Haiti and two in the Dominican Republic, as indicated in
Figure 1. In this paper, we focused on some results and aspects of the methodology that were found important during these studies for the cities of Santo Domingo, Santiago de los Caballeros, Cap-Haïtien, and Port-au-Prince. Even though we found significant site effects for the seven cities considered for microzonation, we selected the four cities where geological conditions permit a better illustration of the relevant aspects of the methodology we implemented. In the case of Santo Domingo, zones of homogeneous seismic behavior could be identified with the implementation of a multidisciplinary approach that builds upon borehole explorations, MASW measurements, and ambient-noise recordings. For the city of Cap-Haïtien, where high peak ground acceleration at firm rock was calculated [
12], site effects had to be estimated with soil columns having nonlinear properties. In the final part, we present the approach adopted to define new design spectra resulting for the microzonation study in Port-au-Prince in lieu of the seismic demands defined in the national Building Code. The order of the paragraphs thus follows the common process of site-effect evaluation, from site characterization to geodynamic simulation and spectra definition, although they do not focus on a single case study.
2. Site Characterization—Examples from Santo Domingo and Santiago de Los Caballeros
To map site effects, the first step in microzonation studies is to identify areas that are expected to have homogeneous seismic response. Such identification is based on a combined analysis of available geological, seismic, geotechnical, and geophysical information, a process we refer to as site characterization. In this section, we provide examples of site-characterization campaigns for the two biggest cities in the Dominican Republic: Santo Domingo and Santiago de los Caballeros. The complete details of the information collected and processed during the Santo Domingo study can be found in the BRGM’s technical report [
13].
Our method started with the geological mapping of surficial formations for the vast Santo Domingo metropolitan area, a region of approximately 260 km
2. The existing 1:50,000 scale map, prepared during the SYSMIN II project [
14], was reassessed at the 1:25,000 scale in order to characterize surficial deposits [
15]. Santo Domingo is built on calcareous materials (Pliocene–Pleistocene formations) of biogenic origin (limestone and calcareous marls), as well as on Quaternary formations related to fluvial activity. The calcareous formations can locally be altered due to an important karstification suffered by the materials (red clays, karstic collapse, great dolines). To characterize the properties of the different surficial deposits, we collected geotechnical borehole data comprising Standard Penetration Test perforations and laboratory tests (e.g., granulometry, Atterberg limits, and volumetric weight). Borehole drillings were performed at 63 locations in Santo Domingo [
16], with the deepest reaching 80 m (where the bedrock has not been reached).
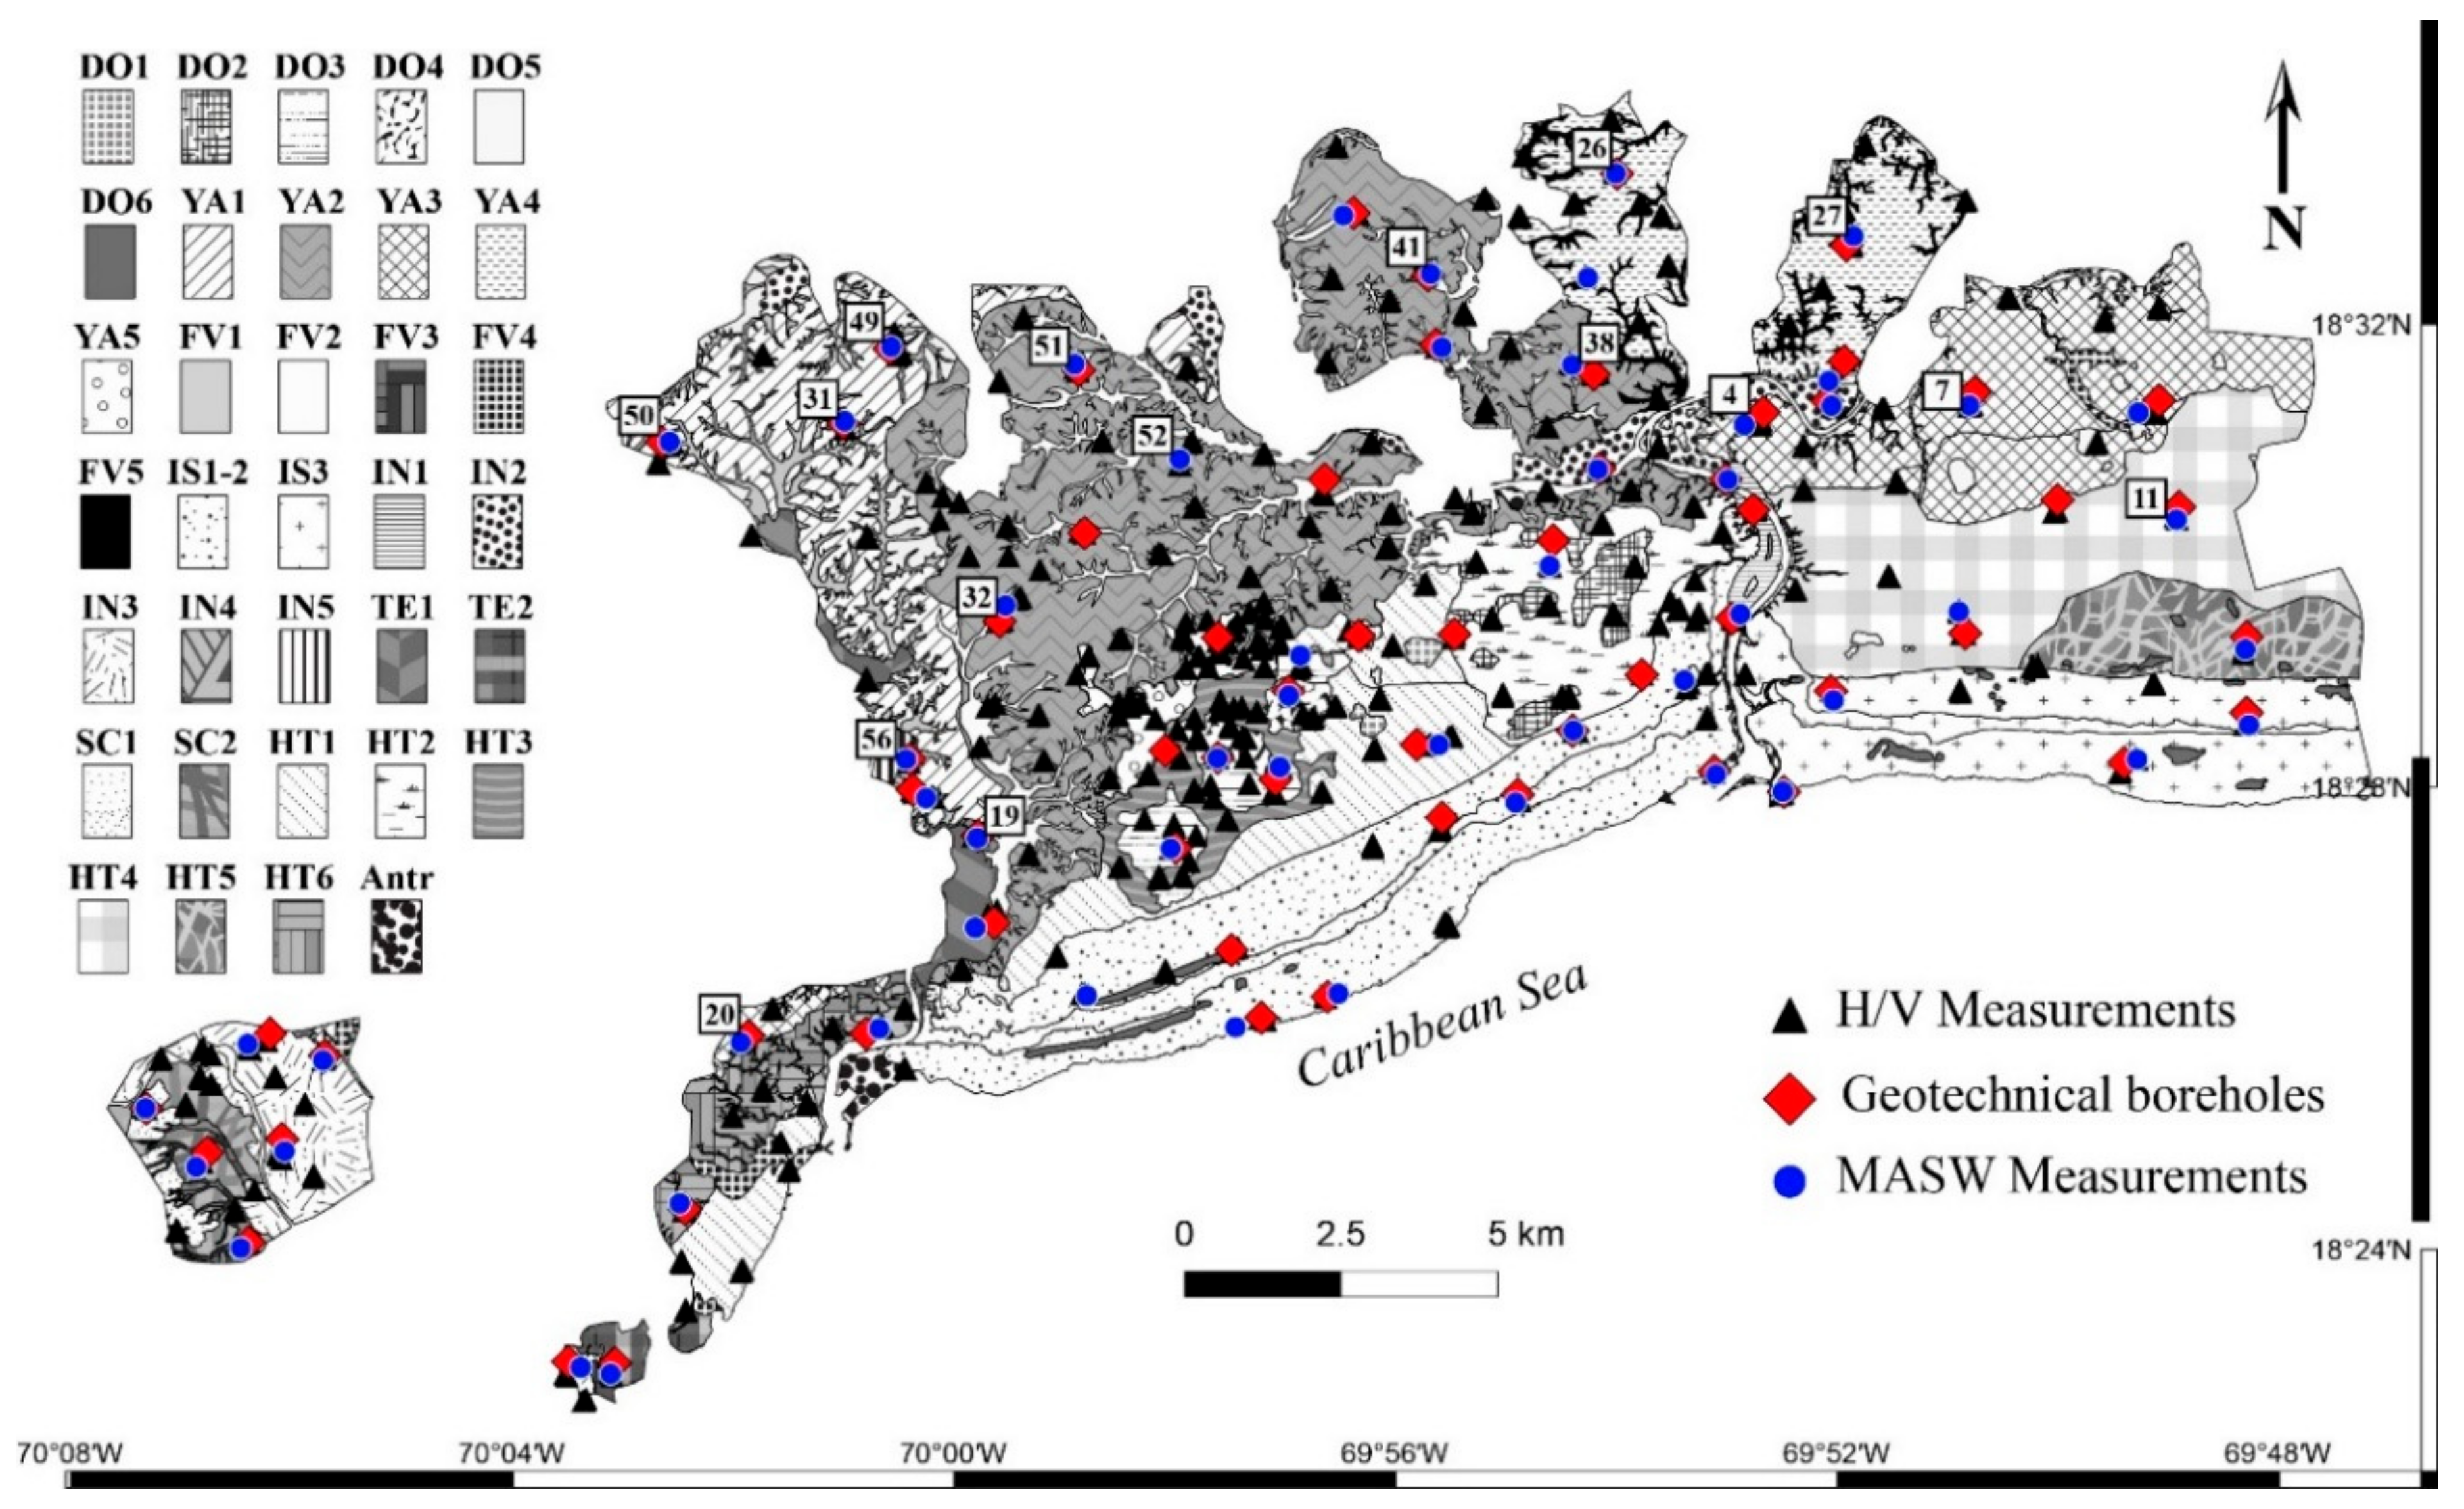
Figure 2 shows the location of the current geotechnical boreholes (with rhombus) made in this study. This dataset was then complemented by an analysis of geotechnical drilling profiles conducted under some previous projects.
In addition, geophysical campaigns were conducted to estimate the characteristics of the delimited geological units, such as thickness, shear wave velocity
, and fundamental frequency. Conventionally, these characteristics of the subsurface geological structure were obtained by combining different types of surface measurements (see, for instance, Reference [
17]): (i) the Horizontal-to-Vertical Spectral Ratio (HVSR) technique, based on ambient-noise measurements; and (ii) the MASW method, based on seismic prospecting. In general, the HVSR method is capable of providing an estimate of the fundamental frequency of the site, corresponding to a peak value in HVSR as a function of frequency [
18,
19]. The MASW method allows constructing the subsurface Vs profile based on the inversion of surface-wave dispersion curves (i.e., frequency-dependent characteristics of Rayleigh waves, and its distribution with depth). For the current study, we computed single-station HVSR from noise measurements at 257 locations, and Vs profiles from active MASW measurements at 57 locations. Although few noise recordings were made with a 24-bit CityShark-II digitiser coupled to a 3-component Lennartz LE-3D 5s seismometer, most of the ambient-noise acquisitions were made using a Tromino velocimeter. Time series of 30 min length were recorded using a sampling rate of 128 Hz and processed through the standard HVSR technique mostly based on the SESAME best-practice guidelines [
20]. On sites where the environment was “noisy” (e.g., road traffic nearby, bad weather), duration of acquisition was set longer than 30 min. The signal was divided into individual time windows of 30 s (when not enough time windows could be extracted, the window length was reduced to 20 s). For each window, the Fourier spectra were smoothed using a Konno–Ohmachi logarithmic filter with the bandwidth parameter fixed to 40. All of the MASW surveys performed for this study were completed using a Geometrics Geode seismic recorder coupled to a 24-channel linear array of vertical 10 Hz geophones with a receiver spacing of at least 2 m (total array length of at least 50 m). The seismic source was an impact of a 10 kg mass accelerated against a plastic plate on the ground. Signals from at least five impacts were averaged at each source location to improve signal-to-noise ratios. Three shots were made at each site: at array midpoint and from both side of the deployment. In several sites, it was possible to double the deployment and use 48 traces, that is, a larger maximum source–geophone distance, and thus the best estimation of the phase velocities.
In order to compare the MASW and HVSR methods, we opted for the sites where accurate borehole data was available. The location of all the measurement sites within the Santo Domingo area is indicated in
Figure 2. In
Table 2, we list the number of the different geotechnical and geophysical tests performed in Santo Domingo, as well as in the other six cities where microzonation studies were performed.
Once all the geological, geotechnical, and geophysical data were gathered, a combined analysis allowed a preliminary delimitation of zones, each of them being later described by a representative soil column. In the case of Santo Domingo, out of the eight initial geological formations, the analysis led to the identification of 34 areas (shown in
Figure 2) with similar enough characteristics to suspect a homogeneous site-effect signature. A brief summary describing those areas is given in
Table 1.
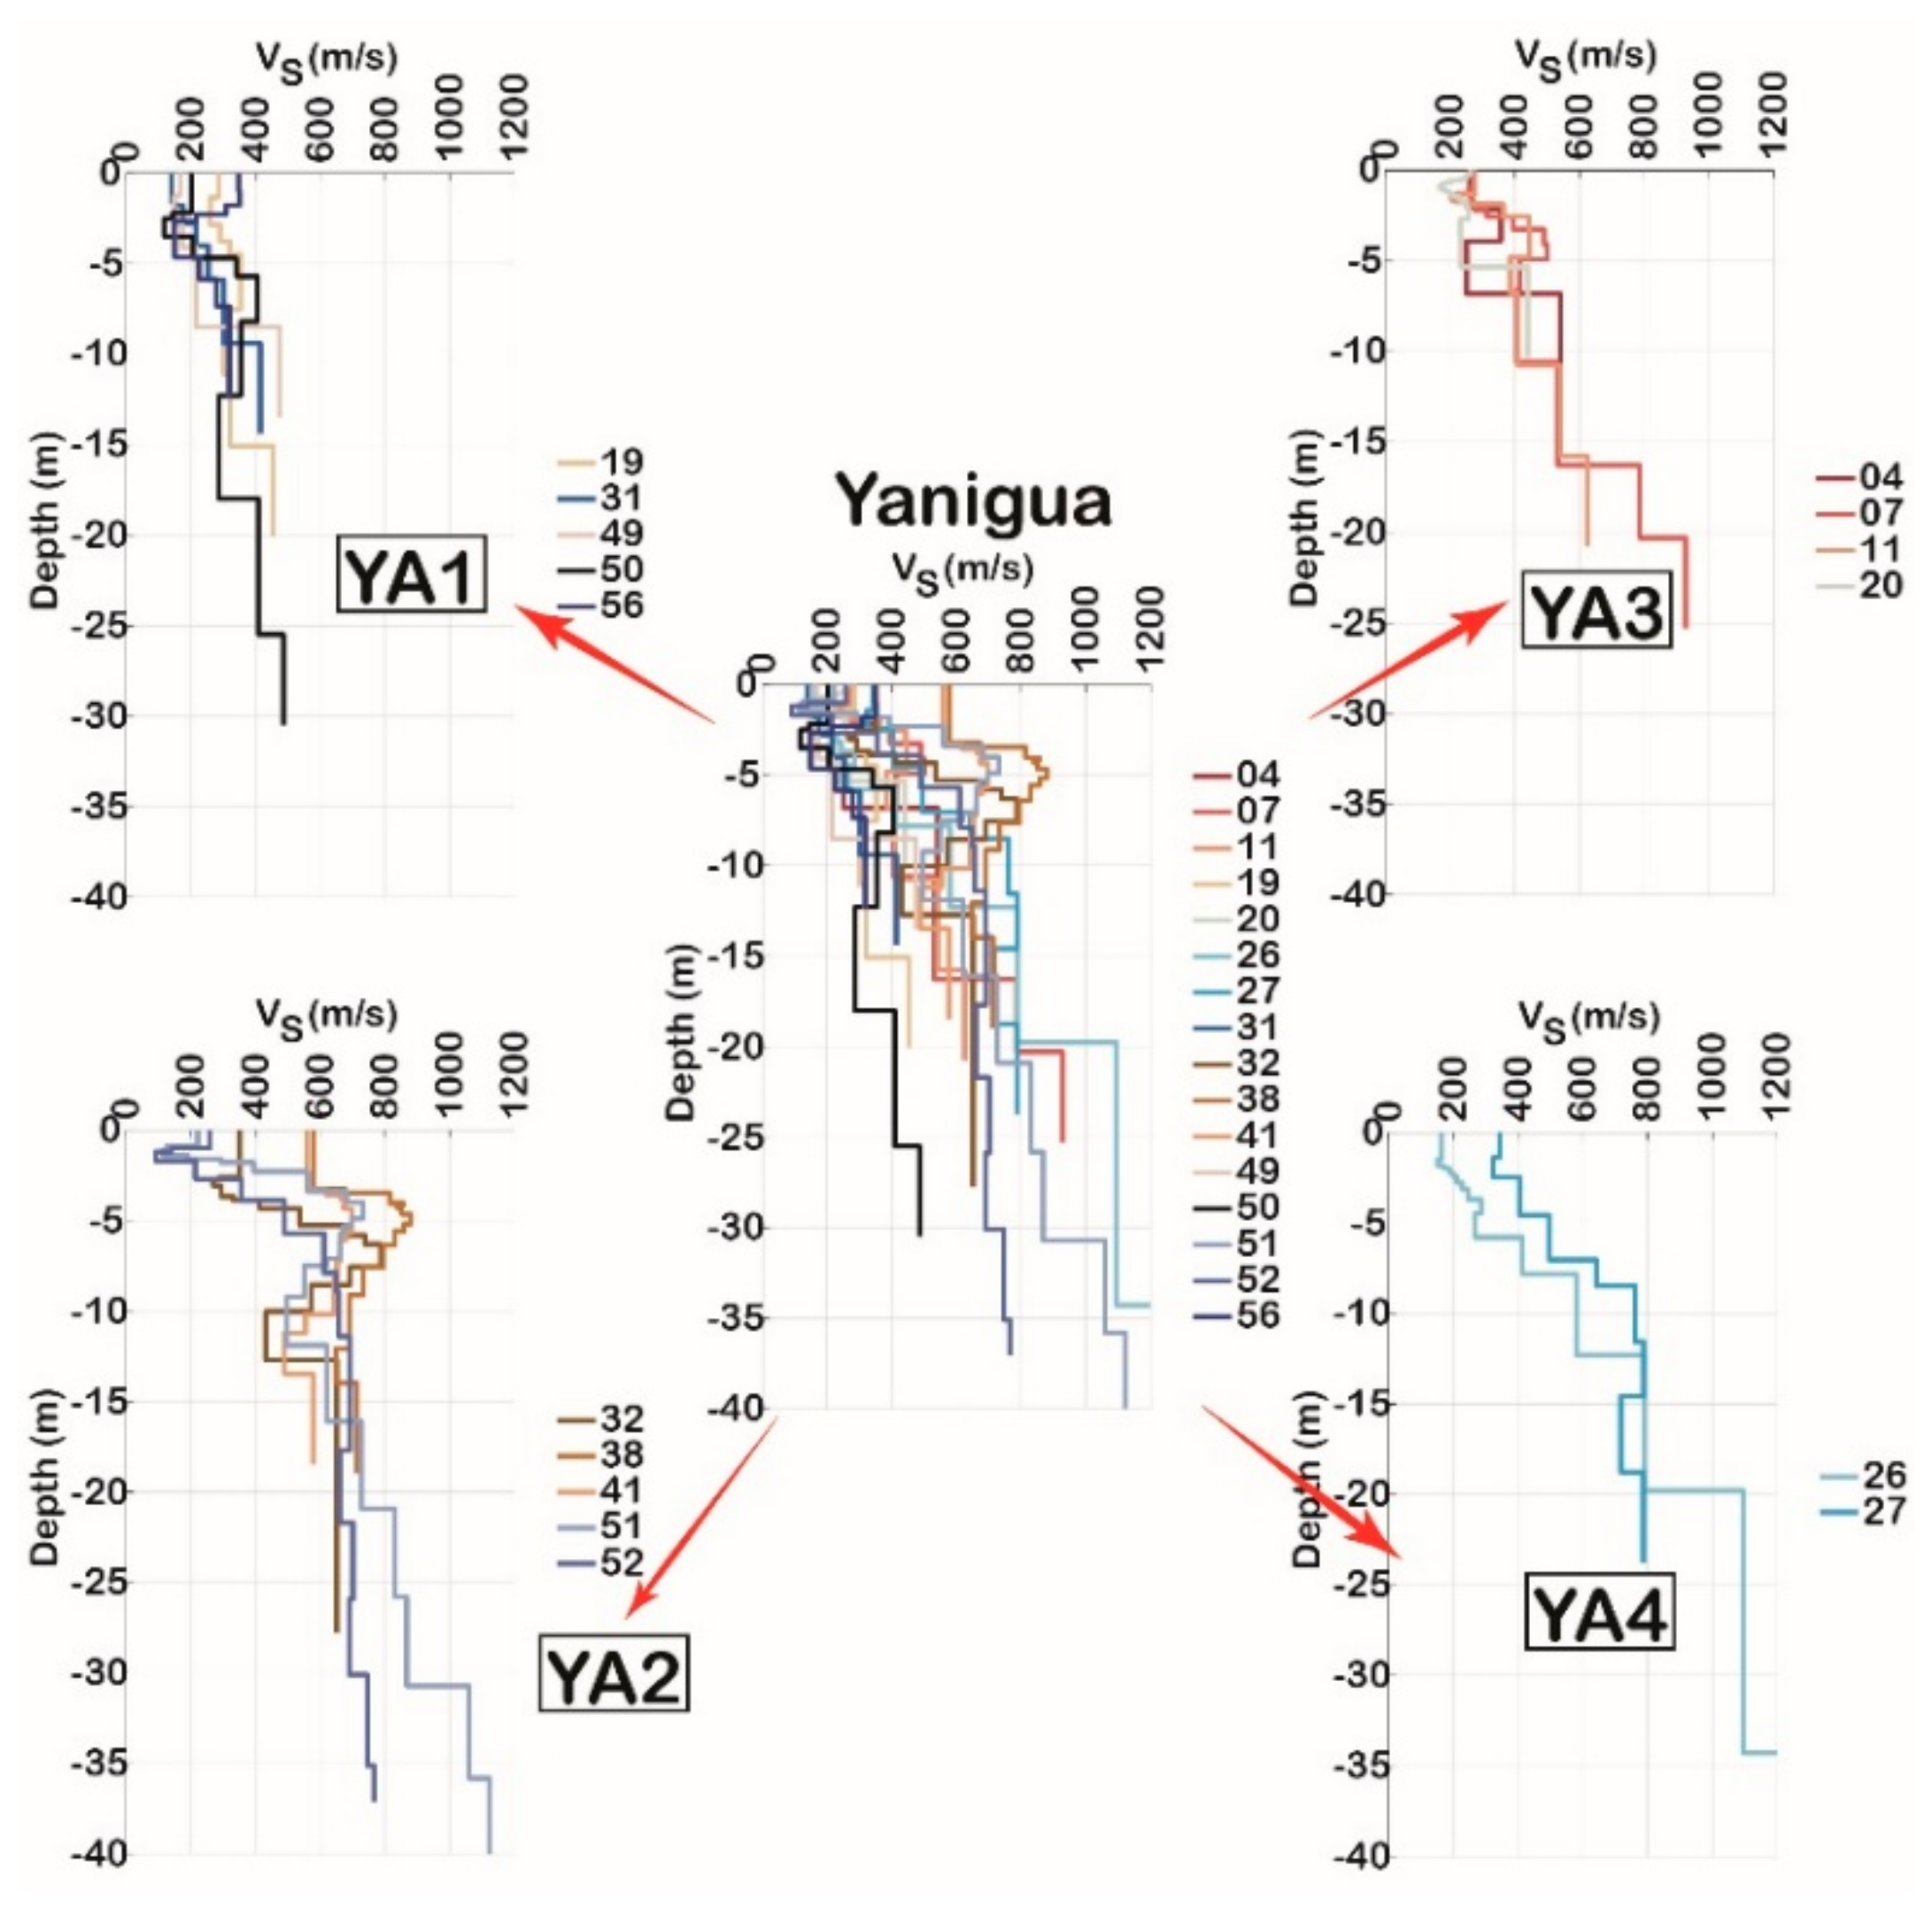
This paragraph describes, through the example of the Yanigua formation (YA), the analysis and characteristics that have led to the subdivision of each of the eight geological units (
Table 1). Among the different surface geological formations present in Santo Domingo, Yanigua covers the largest area. It consists of Pliocene and Pleistocene sediments, with yellowish marls as the main component, and intercalations of calcarenites and limestones. The Yanigua formation has a very heterogeneous character and it has been observed that lithology and geotechnical characteristics can vary a lot with location, and not only due to its great extension: data sources such as metro-line boreholes show the rapid horizontal variation of the alteration profiles of the Yanigua formation. Before looking in detail at the lithology obtained from geotechnical boreholes, a preliminary zonation was performed regrouping by visual inspection similar Vs profiles among those carried out in the Yanigua formation. As illustrated in
Figure 3, four subzones were identified in this way: YA1, YA2, YA3, and YA4. These profile groupings allowed to obtain a geographical subdivision of the Yanigua formation.
The HVSR technique allowed us to further confirm the geographical limits of the identified subzones (shown in
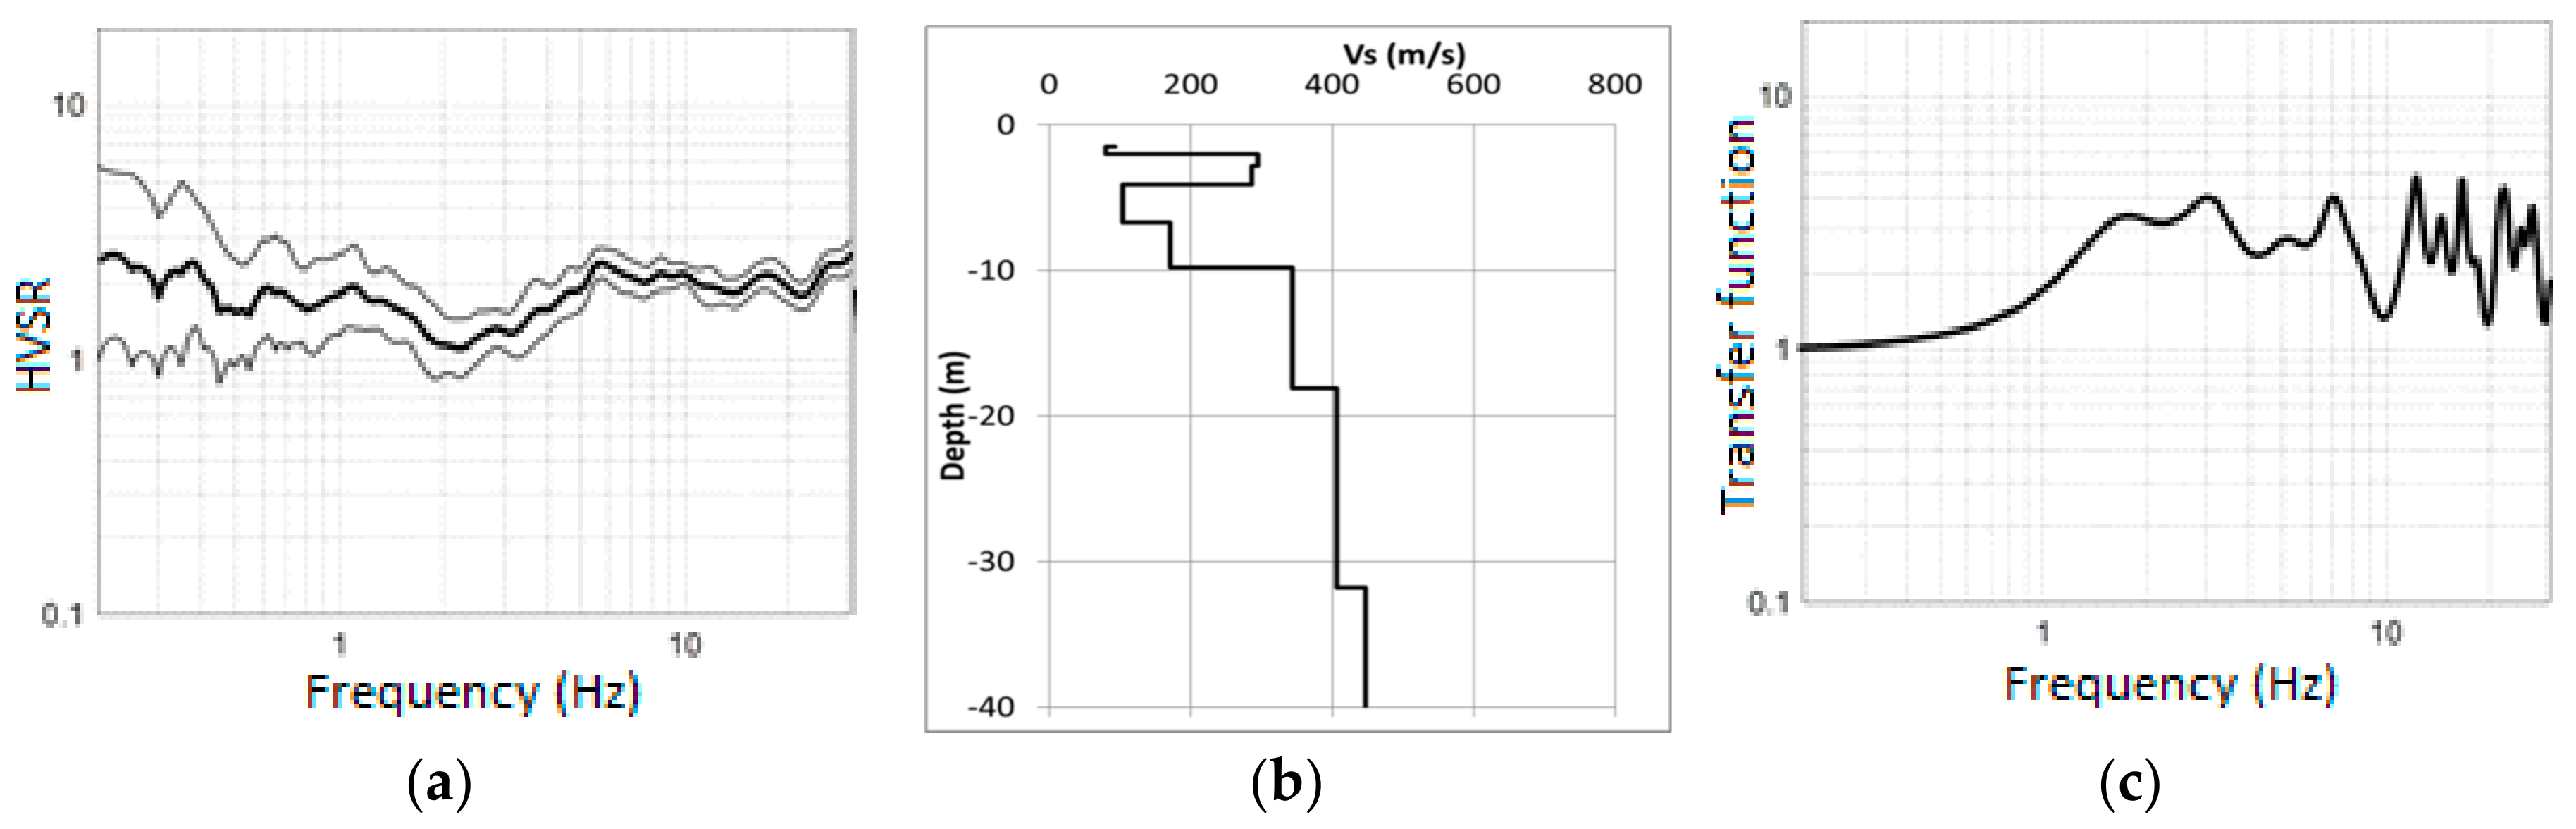
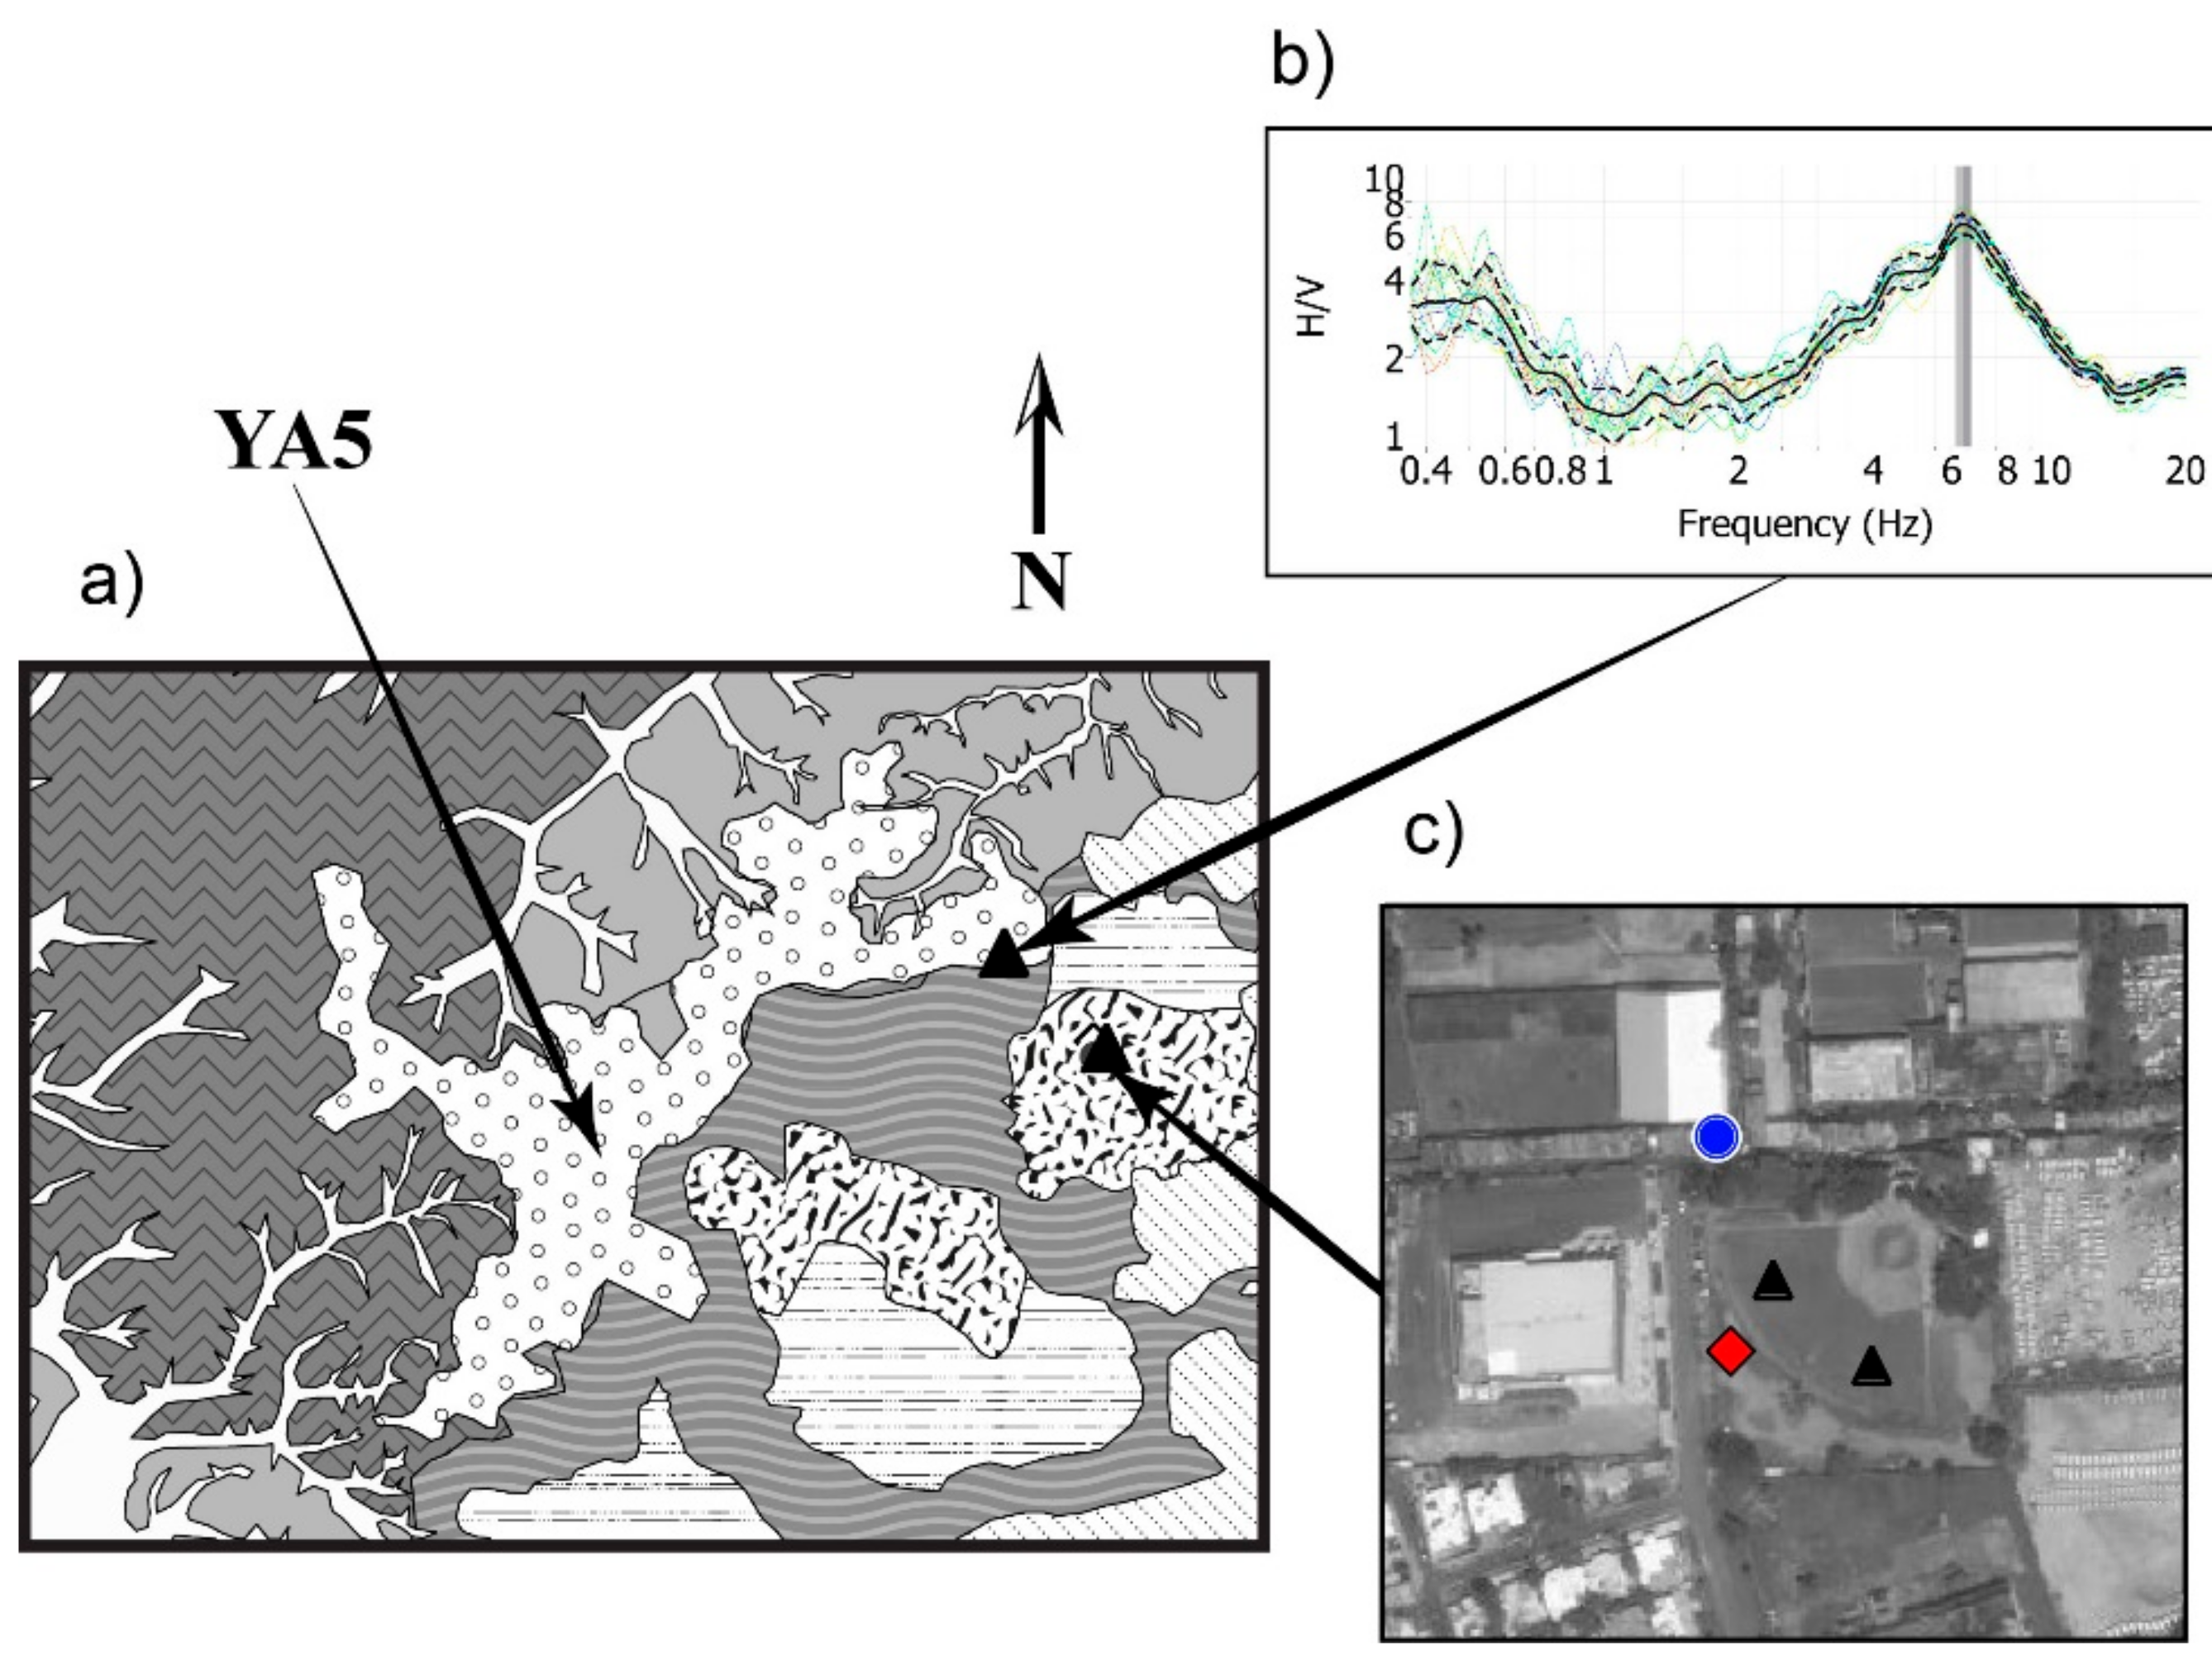
Figure 2). In particular, on the western end (subzone YA1), the resonant frequencies provided by the HVSR curves range between 1 and 2.3 Hz, whereas elsewhere in the unit the frequencies appear to be smaller (between 0.4 and 1 Hz). Above all, with interpretations of HVSR curves, we could identify a subarea in YA4 (marked as YA5 in
Figure 2 and
Figure 4), since its response was marked by a clear resonance between 4 and 6 Hz, as shown in
Figure 4b. No other measurements were able to detect this subarea. This example illustrates the relevance of combining the HVSR technique with geotechnical and geophysical measurements to better distinguish zones having different site effects.
Figure 4c illustrates a baseball field near YA5 where the three types of measurements were performed.
Conversely, it may have happened that evidence of site effects were not detected by the HVSR technique, as it was the case in Santiago de los Caballeros [
21]. The microzonation study in this city was conducted in collaboration with the Instituto Geológico y Minero de España (IGME) and Informes y Proyectos S.A. (INYPSA). For a particular type of soil within Santiago, our study revealed discrepancies among information obtained from different experimental techniques. A possible explanation could be the lack of strong velocity contrasts in the surficial layers of the city. The eastern part of Santiago is founded on stiff and highly plastic clays over a thickness of several tens of meters, fashioned by alteration of calcareous rocks. The HVSR curves obtained for those clayey soils in Santiago are quite homogeneous to each other; they are relatively smooth with no clear peak indicating the fundamental frequency (
Figure 5a shows an example). The increase at low frequencies (<1.0 Hz) of the HVSR mean and standard deviation cannot be judged as particularly significant because it is due to the window length for signal processing, which was not large enough to resolve the low frequencies [
20]. On the other hand, MASW profiles indicated low shear-wave velocities at surface (150 m/s), which increases gradually with depth (up to about 400 m/s at 30 m depth) (
Figure 5b). These values of shear-wave velocity coincide with those obtained from correlations with SPT perforations.
Figure 5b shows the profile associated to the same measurement point as
Figure 5a. A possible explanation could be the lack of strong velocity contrasts in the surficial layers of the city. The transfer function simulated from such a gradual velocity profile shows a noticeable amplification around 2 and 3 Hz, not visible on the experimental HVSR curve (
Figure 5c). The presence of a regular velocity gradient in these Quaternary clays, characterized by poor mechanical properties (a shear-wave velocity of 240 m/s), may explain the inability of the HVSR method to detect significant site effects. Moreover, the probable low velocity contrast between this clayey formation at depth and the bedrock, expected at around 100 m [
22], may explain underestimation of the HVSR peak amplitude, as suggested in previous studies using the HVSR technique [
23,
24,
25]. Modeling the ambient-noise wavefield, Reference [
24] have observed that the amplitude of HVSR peaks also depends on the relative contribution of different types of seismic waves (body and surface waves). Other reasons behind the nonexistence of a significant peak could be the case of significant lateral heterogeneity giving rise to 2D/3D effects [
25], or effects of sea-wave motion and strong winds [
26]. Even if these factors may play a role, the resulting almost-flat HVSR may be attributed to the low velocity contrast considering the sedimentary sequence in the eastern part of Santiago de los Caballeros.
These examples have illustrated the usefulness of the HVSR technique for delineating zones of homogeneous seismic behavior. However, in some cases, it seems to be inadequate to assess the expected site effects. Therefore, when used alone, the HVSR method might not provide the most reliable estimates; complementary approaches, combined with geological descriptions and geotechnical investigations, are recommended for characterizing different soil configurations.
3. Simulations of Site Response—Example for Cap-Haïtien
After site characterization, the next phase of our methodology is site-response simulation. In this section, we discuss some of the results obtained for the city of Cap-Haïtien in Haiti (details of the complete study can be found in the report [
27]). Cap-Haïtien is a city with high concentration of population, which, because of its proximity to seismic sources, is exposed to a high seismic hazard. According to the reference seismic hazard map for Haiti [
12], the peak ground acceleration (PGA) for firm-rock conditions expected for Cap-Haïtien is 0.40 g. As in Frankel et al. [
12], we adopted the same definition of firm rock (
Vs30 of 760 m/s) that was used for the national seismic hazard maps in the United States. To define the input motion for the simulations, we needed to collect a set of accelerograms that match the bedrock spectrum as well as possible, ideally from past recordings in the study area. Since such recordings were unavailable in Cap-Haïtien, we selected a set of four accelerograms (horizontal components) recorded at rock sites from the PEER Ground Motion Database [
28]. The accelerograms were selected according to the following criteria: (i) they were recorded in the free field; (ii) they were generated by strike-slip earthquakes; (iii) the moment the magnitude of the earthquakes was in the range 6.7 ≤ Mw ≤ 7.7; (iv) the focal distance was less than 25 km; and (v) their response spectra had to fit to the rock spectrum of Cap-Haïtien, after scaling to a PGA of 0.40 g. The selected ground motions were generated by earthquakes that took place in Tabas (Iran), Northridge (California), Loma Prieta (California), and Kocaeli (Turkey).
An important aspect of the site-response evaluation is the choice of the model for material behavior of the soil layers. Linear-equivalent approaches are usually considered appropriate when soil deformations (strains) are expected to be small. However, considering the high values of PGA provided by the regional seismic-hazard study for rock sites, we expect that in our analyses of site response, the soft sediments would undergo large strains; therefore, we adopted truly nonlinear “elastoplastic” models for the soil layers in Cap-Haïtien. We simulated the response of ten 1D soil columns subjected to the four ground-motion recordings (selected as explained above) with a full nonlinear elastoplastic model implemented in CyberQuake software [
29]. The soil columns were characterized with the available geotechnical data and a preliminary subdivision of the area obtained with the same procedure we implemented for Santo Domingo and explained in the previous section. The elastoplastic model, derived from Hujeux’s model [
30] and later adapted to seismic studies [
31], takes into account diverse soil behavior such as evolving plasticity, dilatancy–contractance, softening–hardening, and cyclic hysteretic behavior. The stress–strain cyclic hysteretic behavior of the model can be validated with laboratory curves available in the literature [for example, Darendeli, 2001 for clayey soils] since the curves for shear modulus degradation
and damping ratio
are provided by CyberQuake. Furthermore, the method implemented in CyberQuake allows the estimation of plasticity parameters that are not directly measurable from simply obtained data, such as Atterberg limits and overconsolidation ratios for clays, and void ratios for sands [
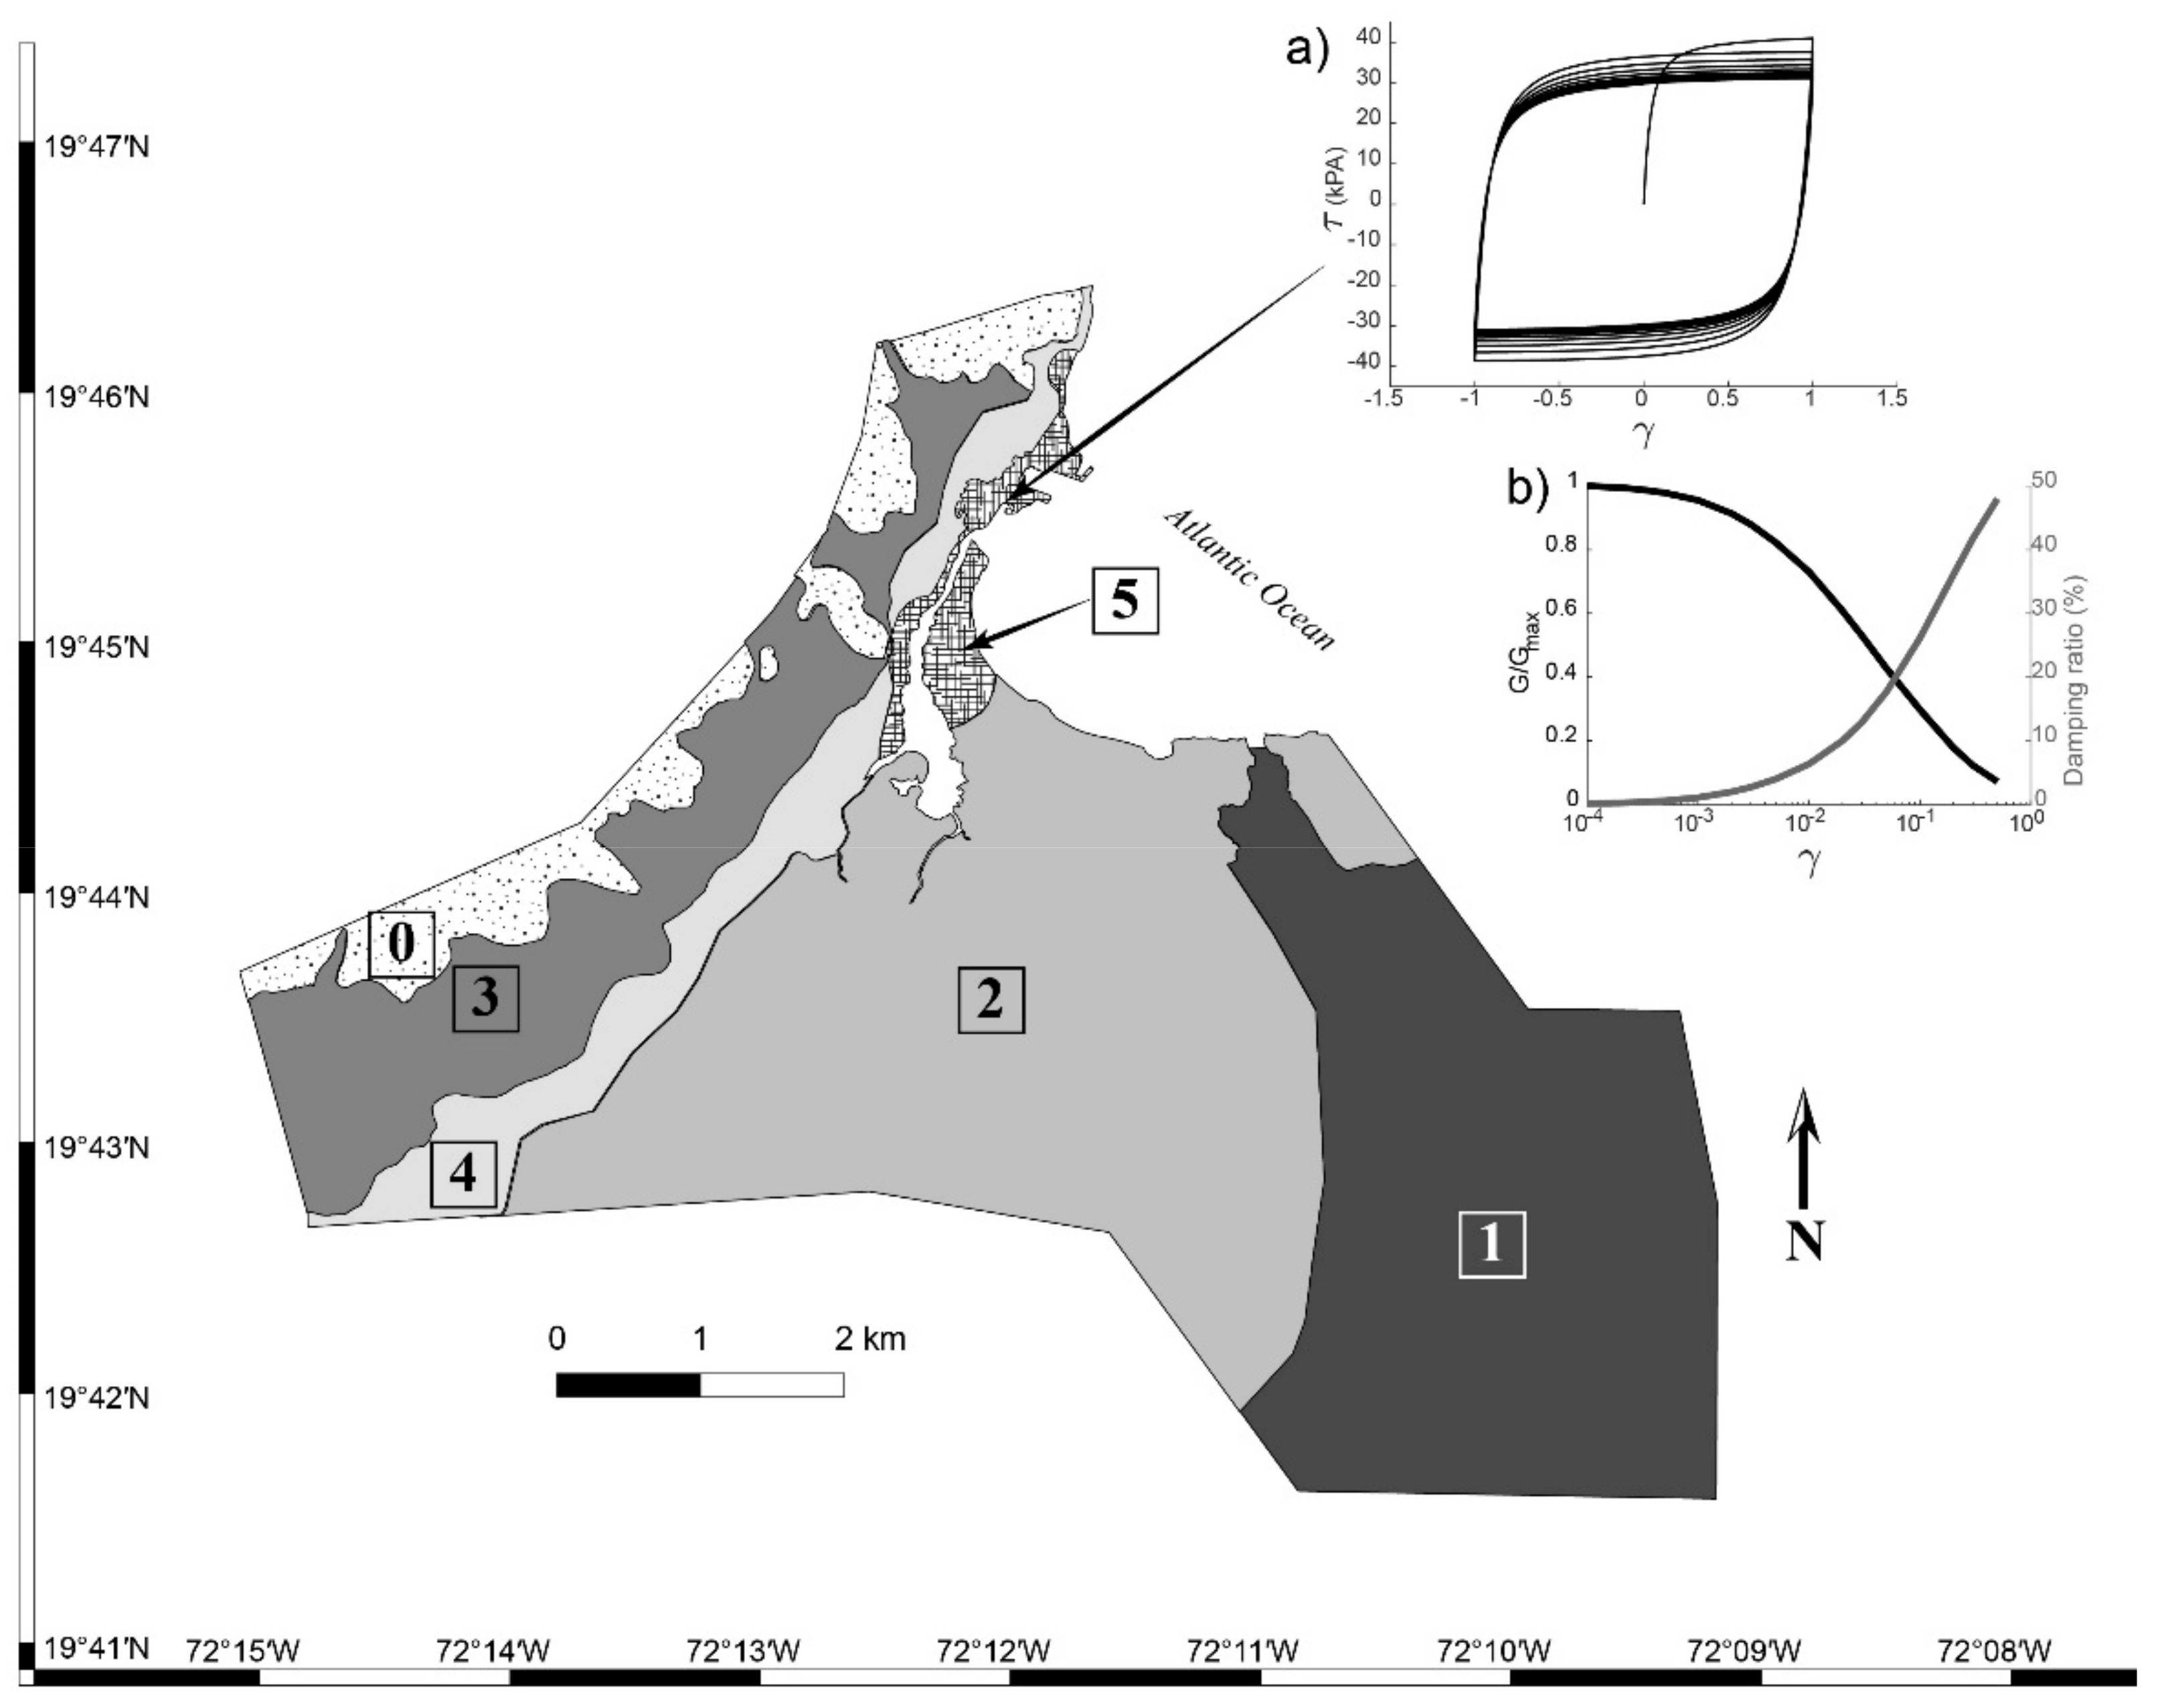
32]. Together with the seismic microzonation map for Cap-Haïtien,
Figure 6 illustrates the degradation curves
and
, at the free surface, for a site characterized by anthropogenic backfill and river-mouth deposits.
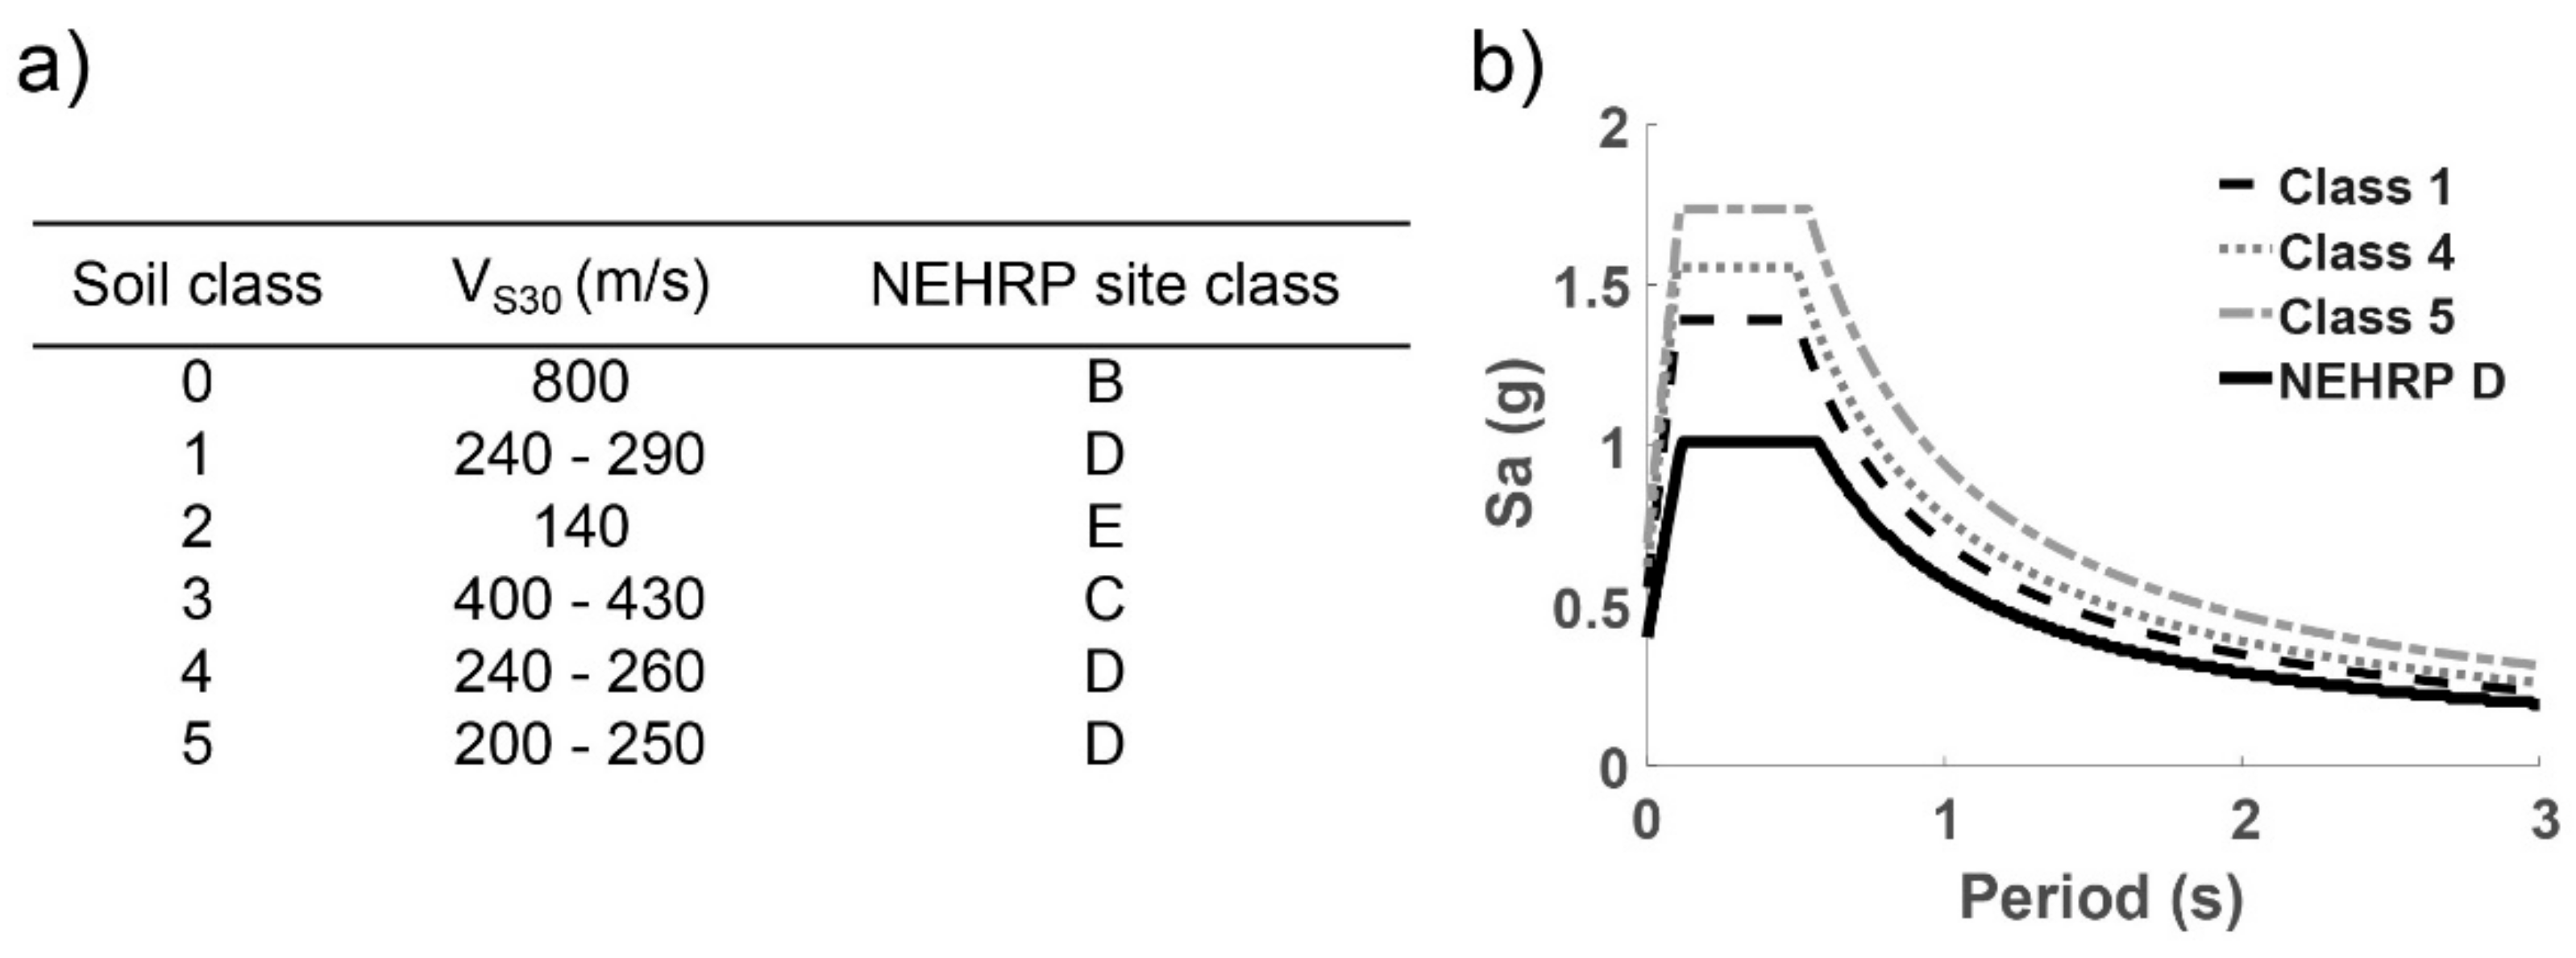
Our microzonation study has revealed that the main part of the urban area in Cap-Haïtien is located on soft soils or very soft soils with strong site effects. Furthermore, with our methodology we identified diverse soil classes (as illustrated in
Figure 6), such as the eastern alluvial plain (assigned to soil class 1), the backfill-colluviums deposits (soil class 4), and the backfill and river-mouth deposits (soil class 5). While all those soil types would be classified in the same class D (as shown in
Figure 7a) by the 2009 provisions of the National Earthquake Hazards Reduction Program (NEHRP) [
33] (which are based solely on the
parameter), our microzonation study was capable of better characterizing the variability of local seismic response. Furthermore, in
Figure 7b we compared the design spectra for those three soil classes (1, 4, and 5) with the NEHRP spectrum for soil class D. More details on how the spectra were computed are given in the following section. We can observe in
Figure 7b not only that spectral accelerations differ among the different soil classes, but also that the spectral accelerations we obtained in our study are higher than those of the NEHRP spectrum. This example illustrates the importance (and the impact on code-based seismic design) of detailed microzonation studies to better characterize the seismic hazard for exposed urban areas, as in the case of Cap-Haïtien. On the other hand, as other investigations had already reported [
34], this study made evident that under conditions of strong ground motion, soil-nonlinearity parameters are important factors to take into account when calculating specific response spectra. However, usually these specific parameters are not acquirable through conventional geotechnical investigations. Sensitivity studies on these poorly constrained parameters are desirable because of their significant impact on the evaluation of soil seismic response.
4. Design Spectra—Example from Port-au-Prince
The final objective of a microzonation effort is the definition of associated specific design spectrum, which provides the intensity level of the seismic hazard at a particular site. In this section, we discuss important aspects that we identified during the construction of design spectra for the Port-au-Prince metropolitan area. The complete data used for the microzonation of Port-au-Prince and detailed steps can be found in the report of Belvaux et al. [
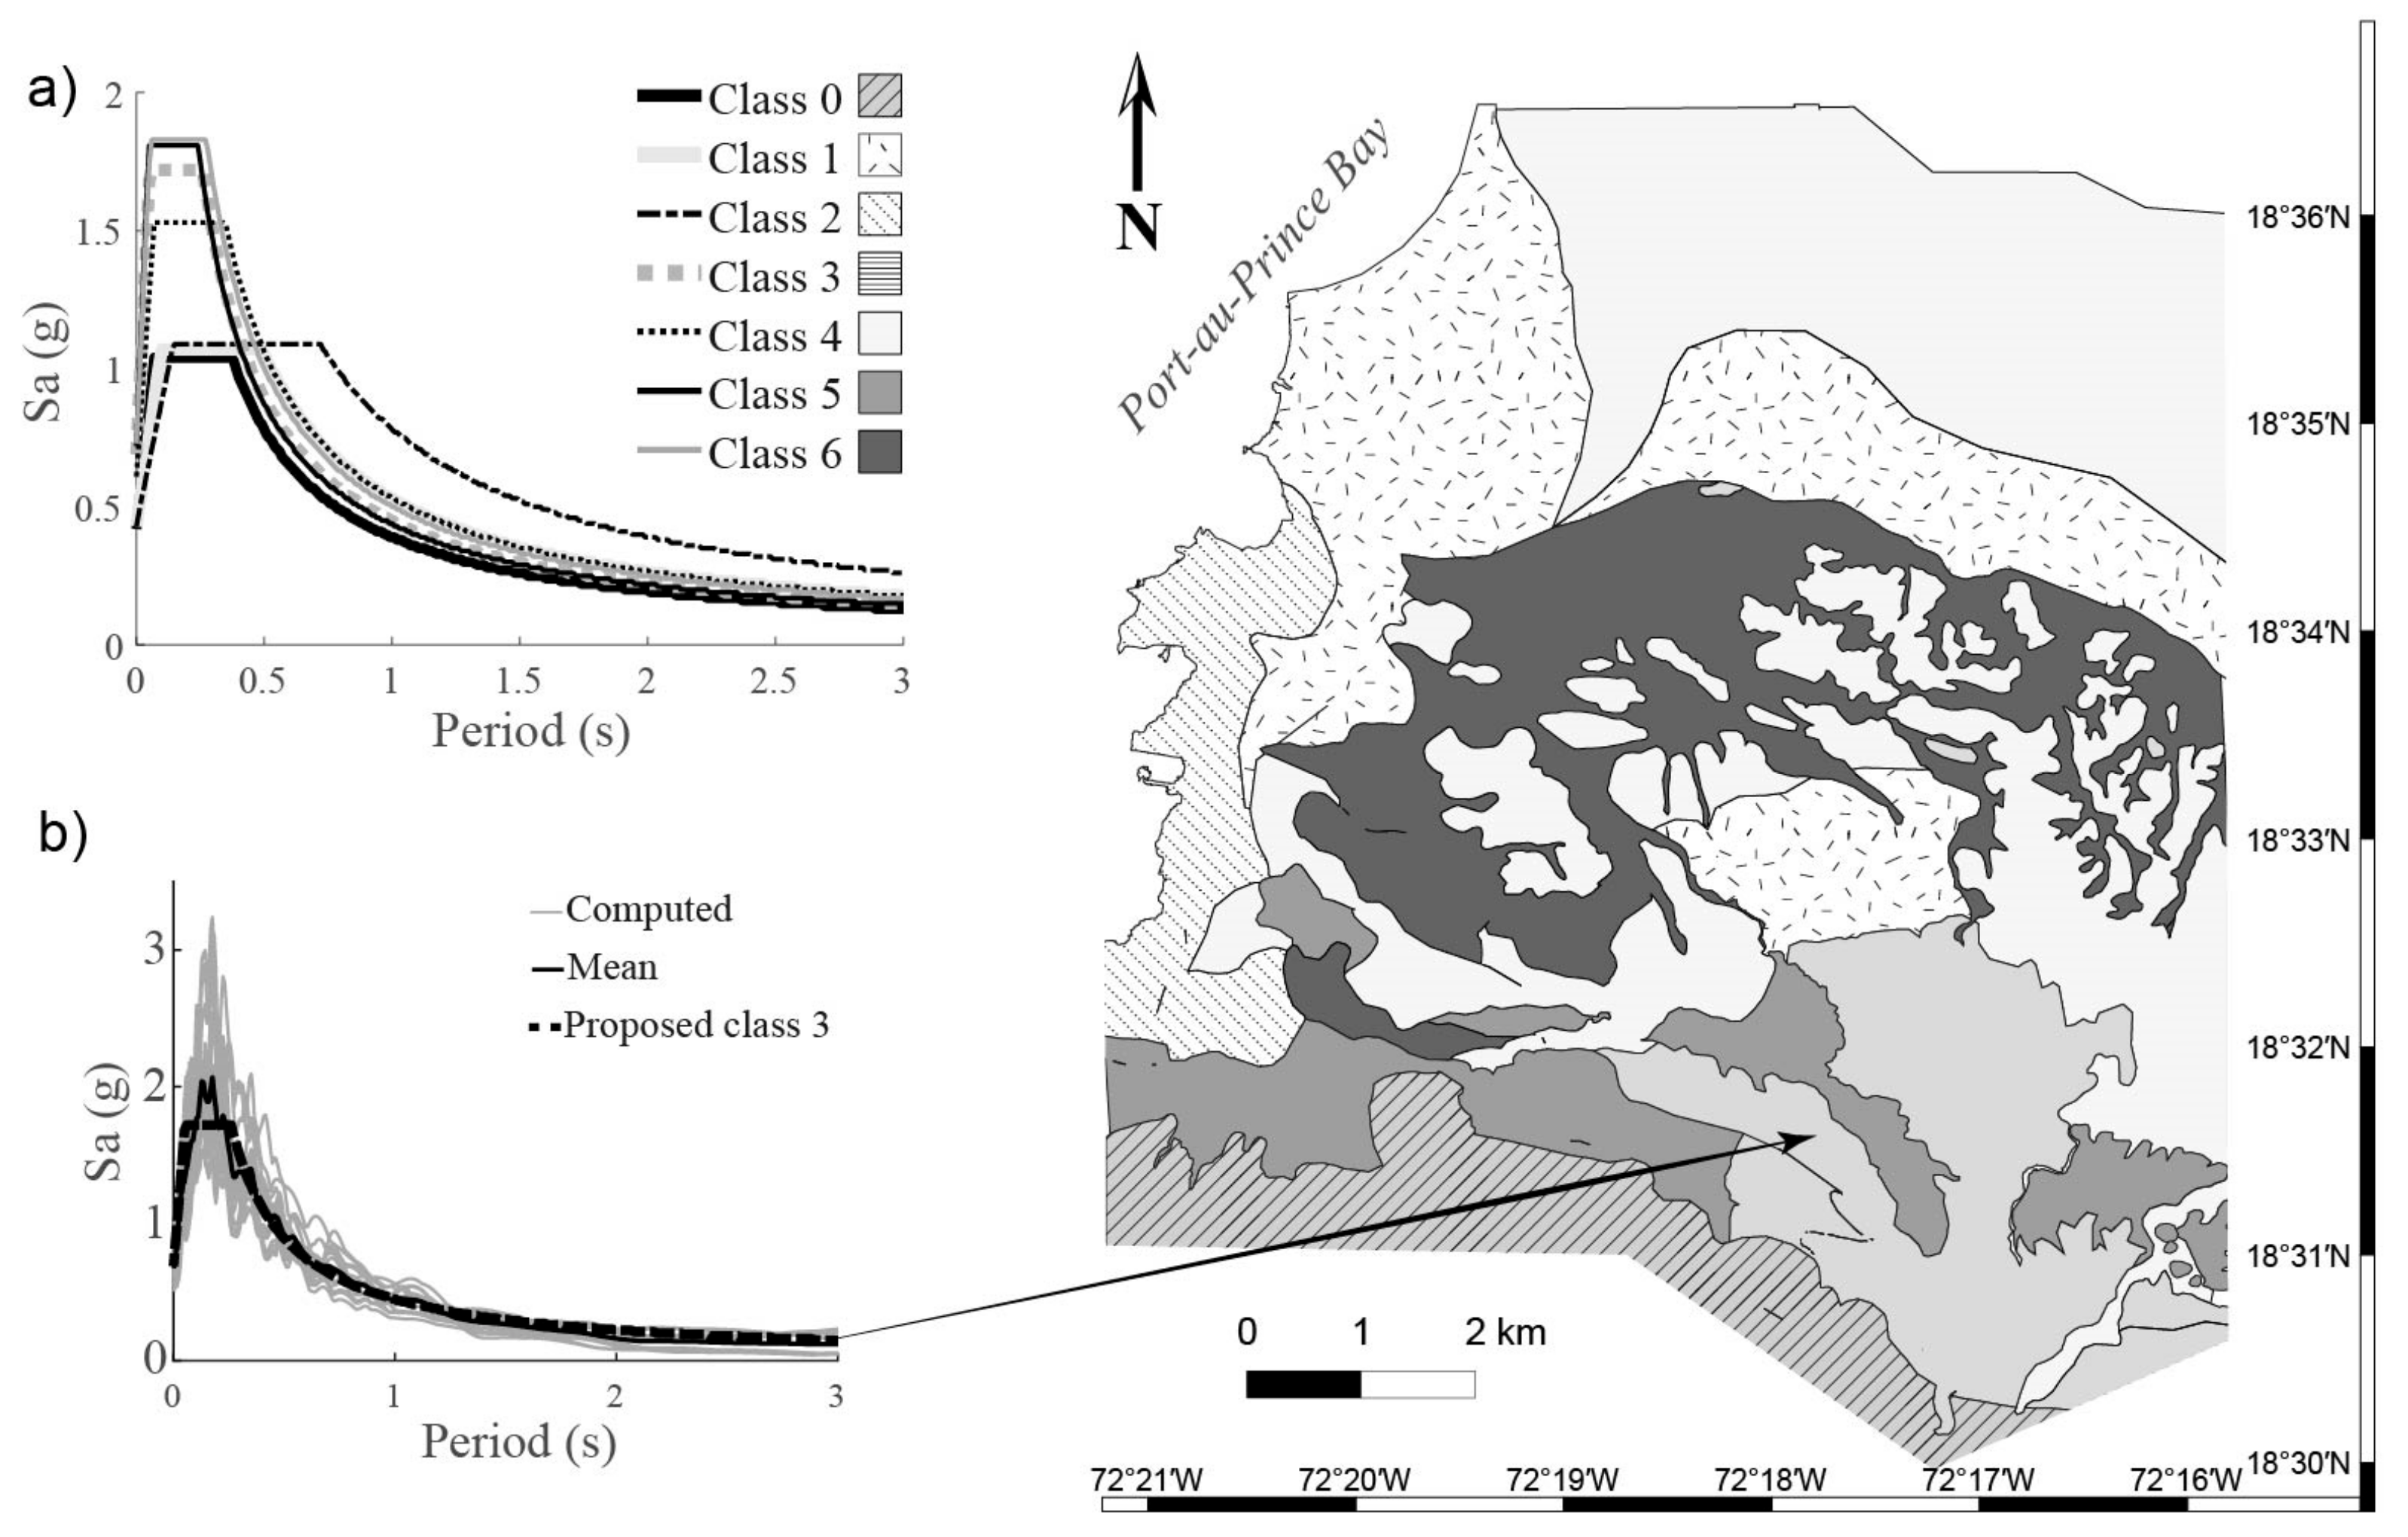
35]. The individual 5% damping response spectra, obtained from 1D simulations (four input accelerograms) on all soil columns, were collected on a single graph to evaluate their similarity and to regroup zones by visual inspection in case of equivalent seismic responses. Consequently, the microzonation map for Port-au-Prince resulted in seven specific soil classes or zones (
Figure 8). In
Figure 8b, we show the response spectra obtained for soil class 3, mainly composed of limestone conglomerates and marls.
The process of converting the results of the simulations of soil response into piecewise linear design spectra is often done through expert analysis by proposing an envelope spectrum. However, our examples from Hispaniola required a new approach. Because the microzonation was intended to be incorporated in the Haitian and Dominican building codes, we implemented a simplified approach to define specific design spectra compatible with the local building codes. For each zone or soil class, we defined a spectral shape (
Figure 8a) that could fit the mathematical functions used by the standards of the American Society of Civil Engineers (ASCE) [
36] and recommended by the International Building Code [
37]. We show in
Figure 8b that strong ordinates of spectral acceleration are observed at short periods (between 0.05 and 0.30 s) with amplitudes as high as 2.5 g. The final mean spectra in
Figure 8a imply considerably high demands for seismic design in the city, especially at short periods. The disadvantage of this approach is that, because of the overly simplified spectral shape, in some cases it is not possible to adequately reproduce the soil response for certain frequencies.
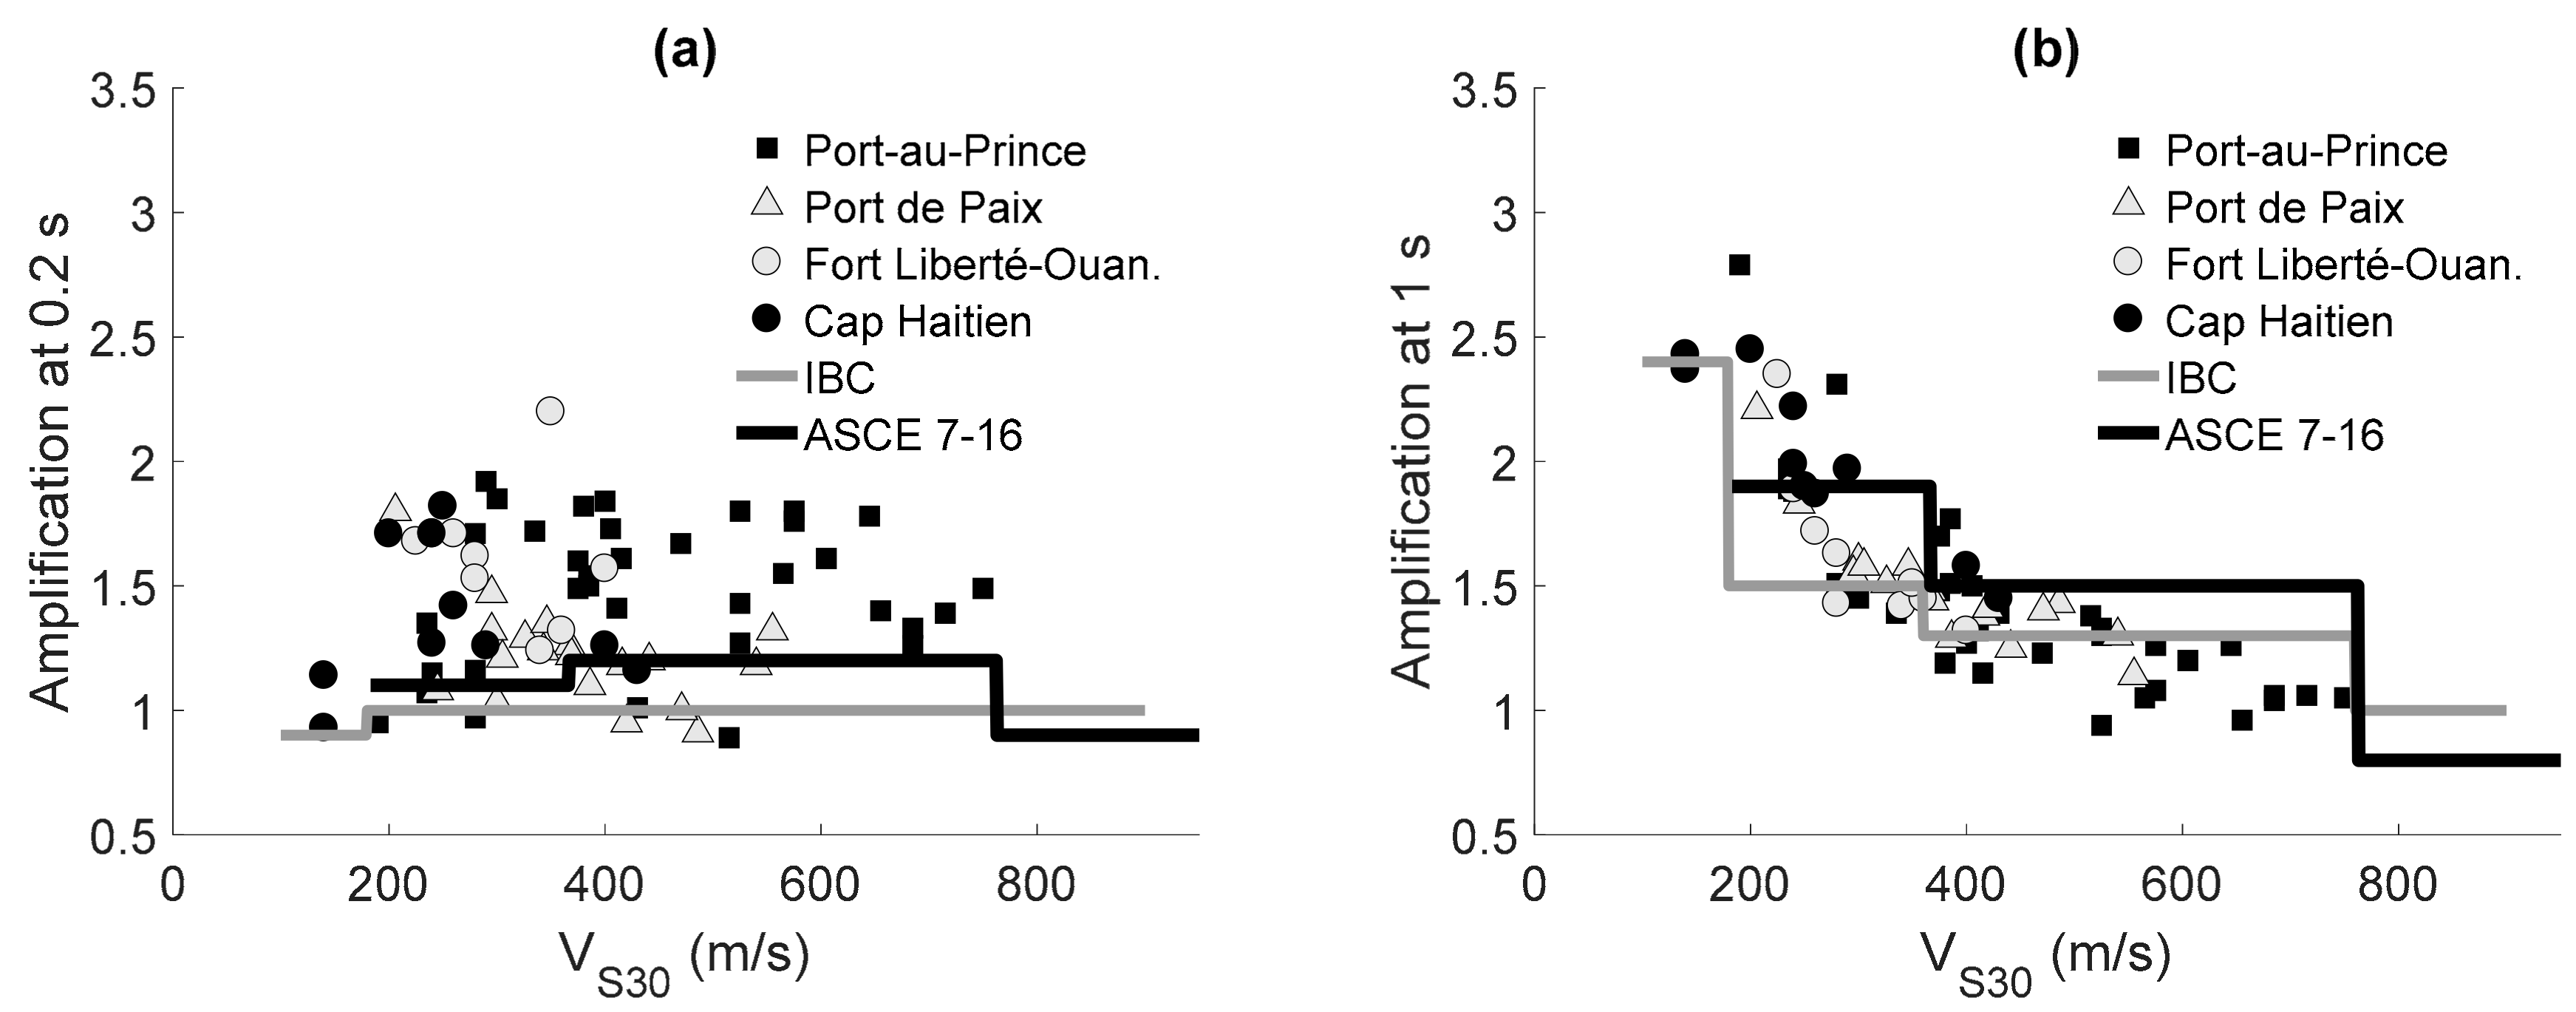
Finally, we investigated the variation of the two site coefficients,
for short periods (0.2 s), and
for long periods (1 s), in terms of the measured mean shear velocity over 30 m depth,
. Upon fitting the computed response spectra of the soil columns to the International Building Code (IBC) spectral shapes, we estimated the values of the site amplification coefficients,
and
. In order to compare them, we put together the results obtained from all soil classes of Port-au-Prince with the results obtained in a similar manner for four other cities in Haiti (Port de Paix, Fort Liberté, Ouanaminthe, and Cap-Haïtien). Thus, in
Figure 9 we show amplification factors that correspond to 73 columns in total, covering a range of
values between 140 m/s and 750 m/s. As shown in
Figure 9, a clear decreasing trend is observed for the coefficient
as the shear velocity
increases, whereas a rather weak correlation can be found between
and
. Furthermore, when comparing with the site coefficients prescribed by the IBC, the values
that we obtained are close to those prescribed by the IBC. However, if we compare with the site coefficients prescribed by the 2016 ASCE document “Minimum design loads for buildings and other structures” [
36], we found that, for
higher than 300 m/s, the amplification values
obtained in our studies are below those of the latest ASCE. On the other hand, for the coefficient
we found that both the IBC and ASCE 7-16 prescribe values close to 1.0 that are below most of those we observed in our study. These results suggest that the IBC and ASCE 7-16 criteria for soil characterization and site effects might not be well-adapted for the studied Haitian cities. Several researchers [
38,
39] have already observed in different areas of the world (Korea, United States, Australia, China, and India) that the coefficients
and
can be underestimated by the NEHRP provisions when the depth of the bedrock is shallow. This might explain the underestimating by the NEHRP recommendations of the coefficient
for sites in Haitian cities, where the bedrock often lies at shallow depths. Nevertheless, for the convenience of local engineers that are familiar with the spectral shape of the IBC 2009 (on which the Haitian Building Code is based), we proposed site-specific design spectra that are constructed preserving the same spectral shape and adjusting the spectral amplitudes with the coefficients
and
. Another advantage of this choice is that if the regional hazard changes in the future, the design spectra can be easily updated without requiring new site-response simulations.
5. Conclusions
In this paper, we described how the combined analysis of lithological, geotechnical, and geophysical data can be implemented to improve (i) the identification of zones with different geomechanical properties, (ii) the spatial distribution of the local soils, and (iii) the construction of specific design spectra for a site based on adapted amplification coefficients and . Through the examples of Santo Domingo, Santiago de los Caballeros, Cap-Haitïen, and Port-au-Prince, we illustrate that a complete methodology allows us to distinguish some soil characteristics that normative classifications cannot. This distinction is especially important in high-stakes regions such as capitals and zones exposed to high seismic hazard. All cities we studied in Hispaniola are heavily exposed to seismic risk because of their proximity to seismic sources, high vulnerability of existing infrastructure, large concentration of population, as well as poor quality of soils. Furthermore, we show that the HVSR method alone is inadequate to identify site effects. The standard IBC amplification coefficients (particularly ) are not able to reflect a precise estimation of site response for many of the encountered case studies, particularly in the case of soft soils surmounting shallow bedrock, implying the necessity of further evolution of these standards.
In the case of the city of Cap-Haïtien, where the level of hazard is high, our study outlined the importance of considering diverse soil parameters that are not necessarily provided by standard soil tests, but are needed to perform simulations with an elastoplastic model. Because of the impact those parameters might have on the resulting design spectra, they need to be constrained with more geotechnical surveys and sensitivity studies.


