A Mathematics Inspired Notation of Scales in the Climate System
Abstract
1. Introduction
The concept of scale considers the typical size and lifetime of a phenomenon. Since the atmosphere exhibits such a large variety of both spatial and temporal scales, efforts have been made to group various phenomena into scale classes. The class describing the largest and longest-lived of these phenomena is known as the planetary scale. Such phenomena are typically a few thousand kilometres in size and have lifetimes ranging from several days to several weeks.
2. Basic Terms and Mathematical Concept
2.1. Agents, Rules, Phenomena—Basic Terms
- 1.
- A fluid parcel may have attributes density, temperature, pressure, etc.
- 2.
- Individuals in a population may be agents. may be all kinds of attributes, like income, vulnerability, societal status, etc. depending on the scope of investigation.
- 3.
- Companies in an economy may be agents, where may be a characterization like revenue, number of employees, etc.
- 4.
- Cars in a traffic situation may be agents, with being attributes like speed, value, size, etc.
- 5.
- Groups of species in an ecosystem may be agents with attributes characterizing their size, role (predator/prey), etc.
- 1.
- If the agent is a fluid parcel λ with density ρ as one of the attributes, then fluid flow can be a process, described by the Navier-Stokes equations. Basically, these are a mathematical formulation of the balance of forces acting on the fluid parcel, influencing for example the density.
- 2.
- If the agents are individuals ι in a population, then a process can for example describe the way, how this individual generates income. This may well be comprised by several rules. If the individual is a university professor, then there may be a rule that describes how knowledge is gained, another rule describes the way, how knowledge is transferred to other individuals, a third rule may describe how this transfer is accounted for in terms of salary, and thus the composition of all three rules establishes the process of generating income.
- 3.
- If companies η are the agents, then a process may describe how a company generates revenue, or how a company uses resources in order to generate products, etc.
- 4.
- If the agents are cars γ in a traffic situation, then a process may describe how they move in accordance to the traffic rules with stops at red lights, etc.
- 5.
- If we consider our agents as groups of species σ in an ecosystem, then a process can describe how these species depend on each other and how they grow or perish in dependence of each other (the simplest mathematical model being a predator-prey system of differential equations).
- 1.
- The attributes of a fluid parcel are space, time, density (among others), where the density function depends on time and space. The corresponding domain is an area (a pipeline system, a riverine system, an atmospheric section, etc.) and a certain time interval. Density is a positive constituent, therefore the domain is non-negative. Depending on the problem setting, we might consider other attributes like total energy, vorticity, or enstrophy.
- 2.
- The attributes of an individual in a society are again its location at any time and a range of societal indicators: income range, social class and the like. The domain may be a city or a country, for the spatial domain, a categorized income scale (where we mean scale in the sense of several different pre-defined classes), etc.
- 3.
- A company’s attribute list may again have a space and time component, though usually these will be rather static. Additional attributes may be the range of revenues, the range of numbers of employees, etc. where the corresponding domains are given by finite minimum and maximum numbers.
- 4.
- The attributes of a car include its location in time and additional ones like speed range, or gas consumption, with again minimum and maximum values as their corresponding domain.
- 5.
- For species the location in time is characterizing as well as additionally, attribute ranges like population size.
- is its location in space ( dimension),
- is its status in time,
- is the list of attributes ( number of attributes).
- 1.
- For a fluid flow problem a typical phenomenon would be a vortex. The process leading to a vortex is given by the thermodynamic processes (manifested in the Navier-Stokes equations) and the phenomenon is one with arbitrary location and time but a positive vorticity above a certain threshold:where we have denoted by ζ the vorticity as an attribute of the fluid parcel λ and θ as the threshold.
- 2.
- We can describe the phenomenon of poverty in a population of individuals by the subset of individuals ι with an income attribute $ below a certain threshold θ. The corresponding process is the generation of income, which modifies the attribute $, (more or less) independent of space and time:
- 3.
- The phenomenon of bankruptcy of a company with liquid assets I and immediate liabilities to pay O can be defined as:
- 4.
- The phenomenon of a traffic jam can be characterized by cars with velocity , which are not parked ():
- 5.
- The phenomenon of extinction of a species can be characterized by the fact that its population size ♯ becomes zero:
2.2. Measuring Size—Metrics
- 1.
- ;
- 2.
- for a scalar α;
- 3.
- .
2.3. Definition of Scale
2.4. Scale Separation in Processes
3. Application of the Concept
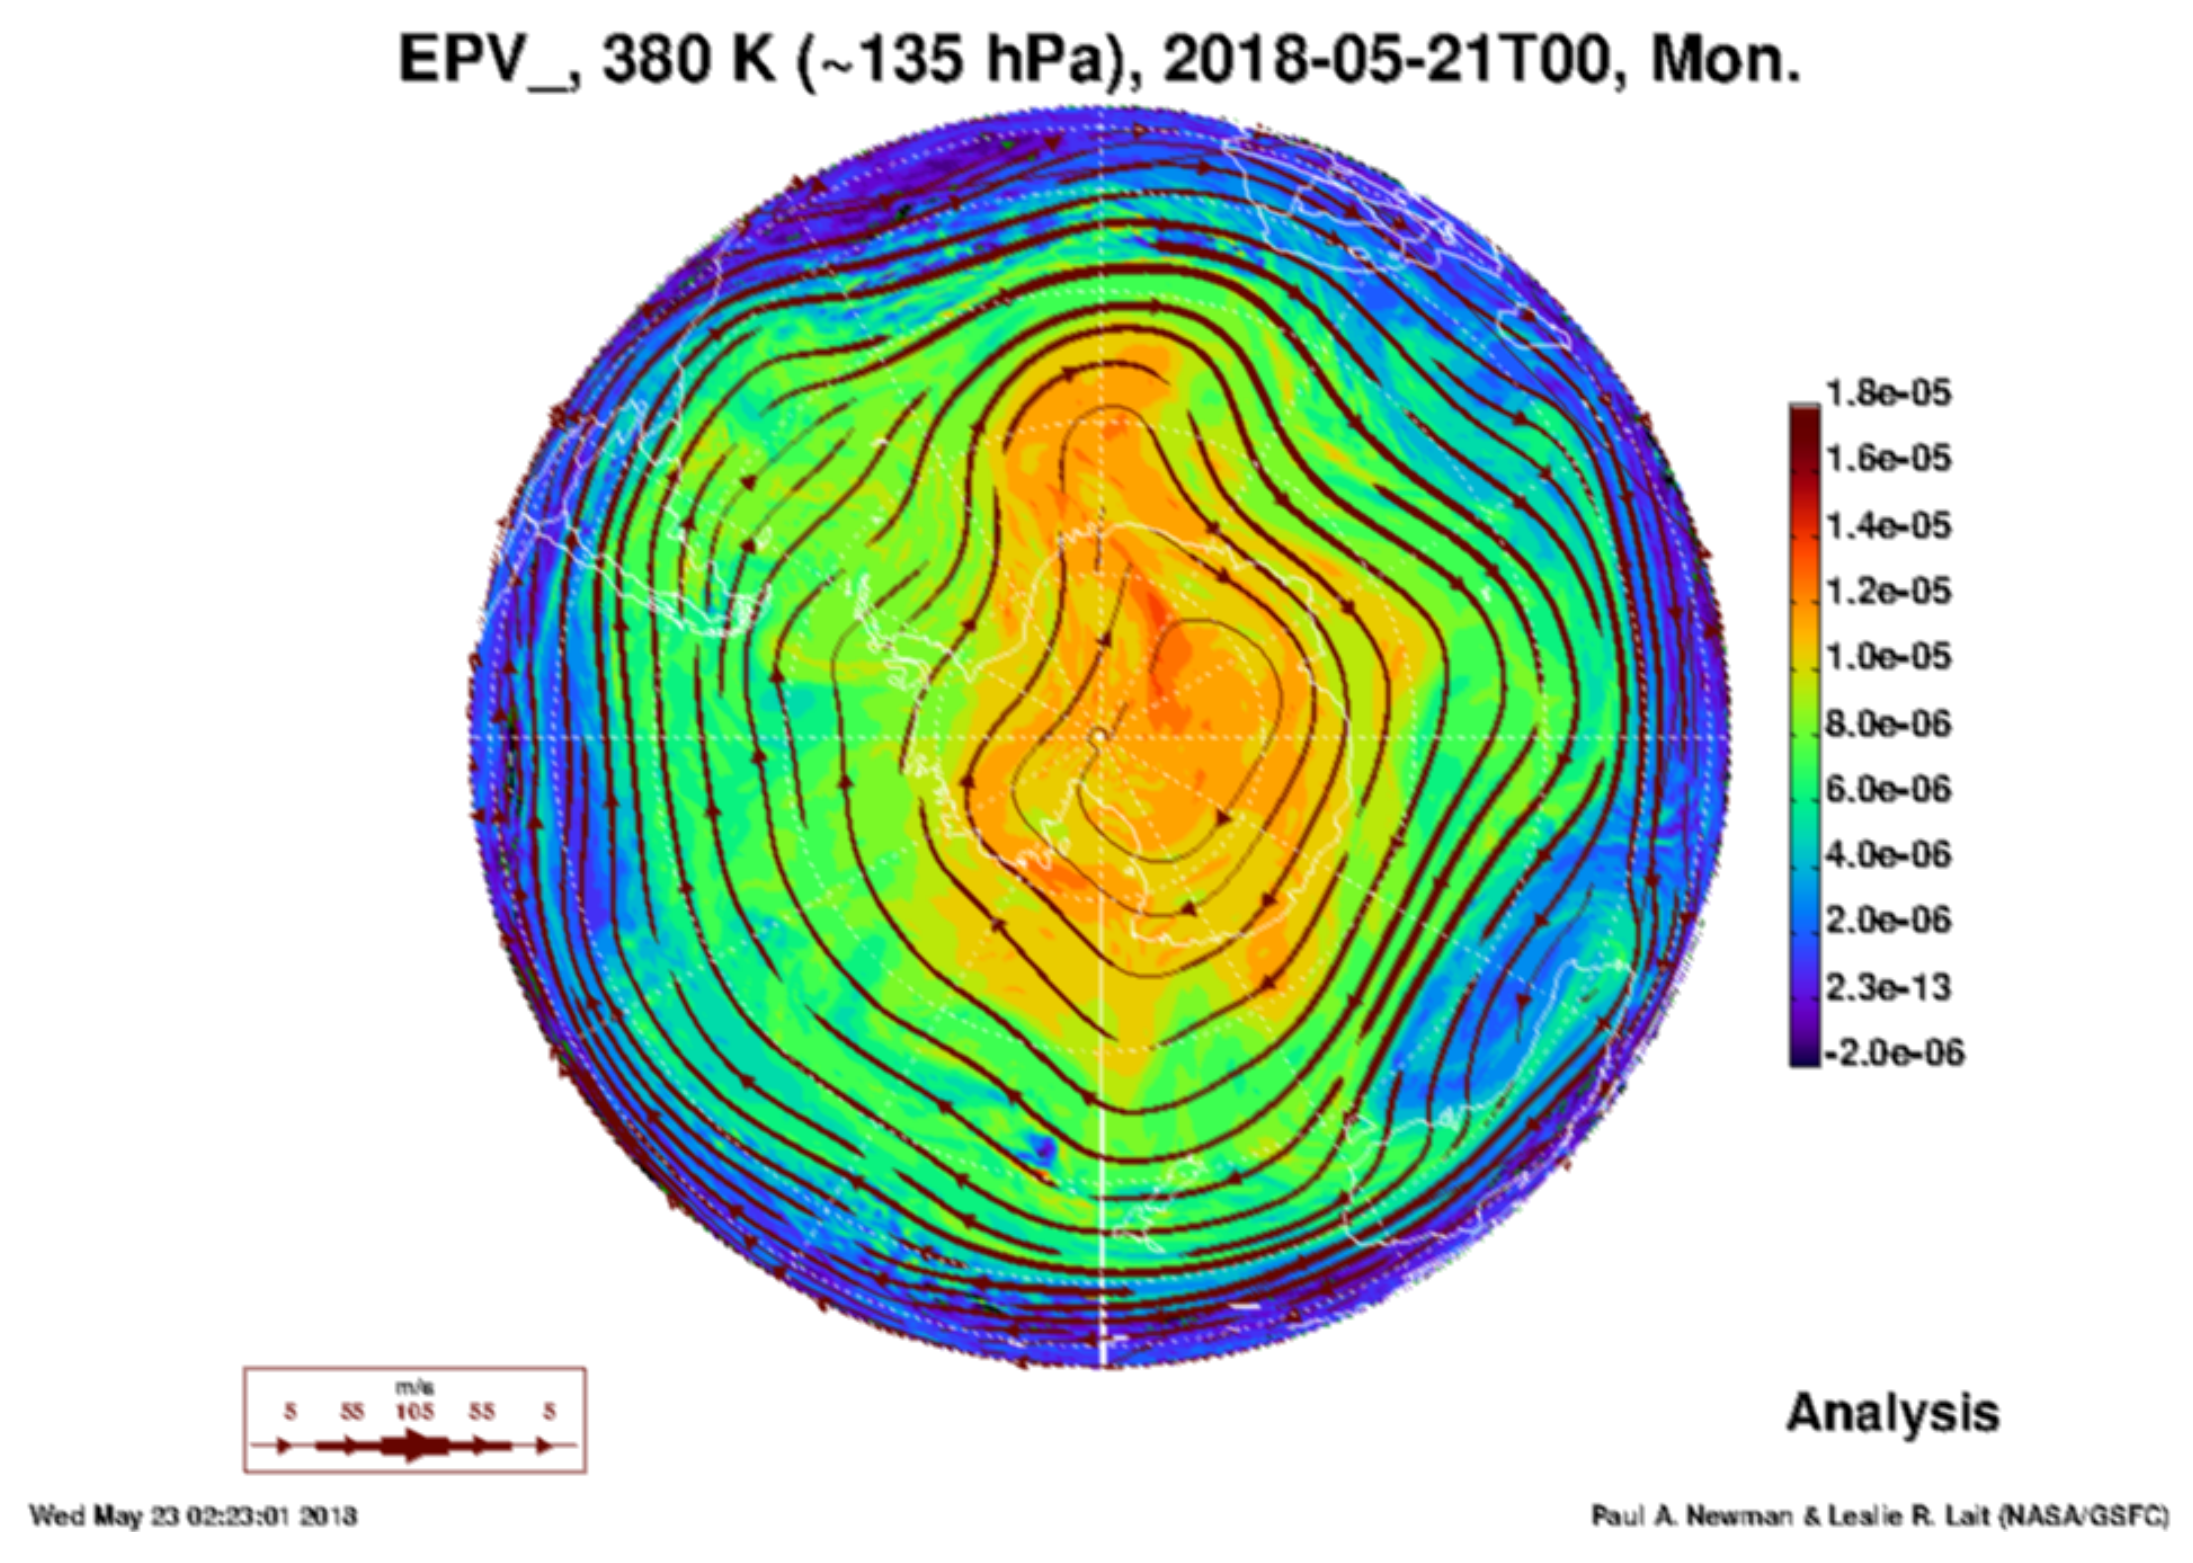
3.1. Antarctic Polar Vortex Phenomenon
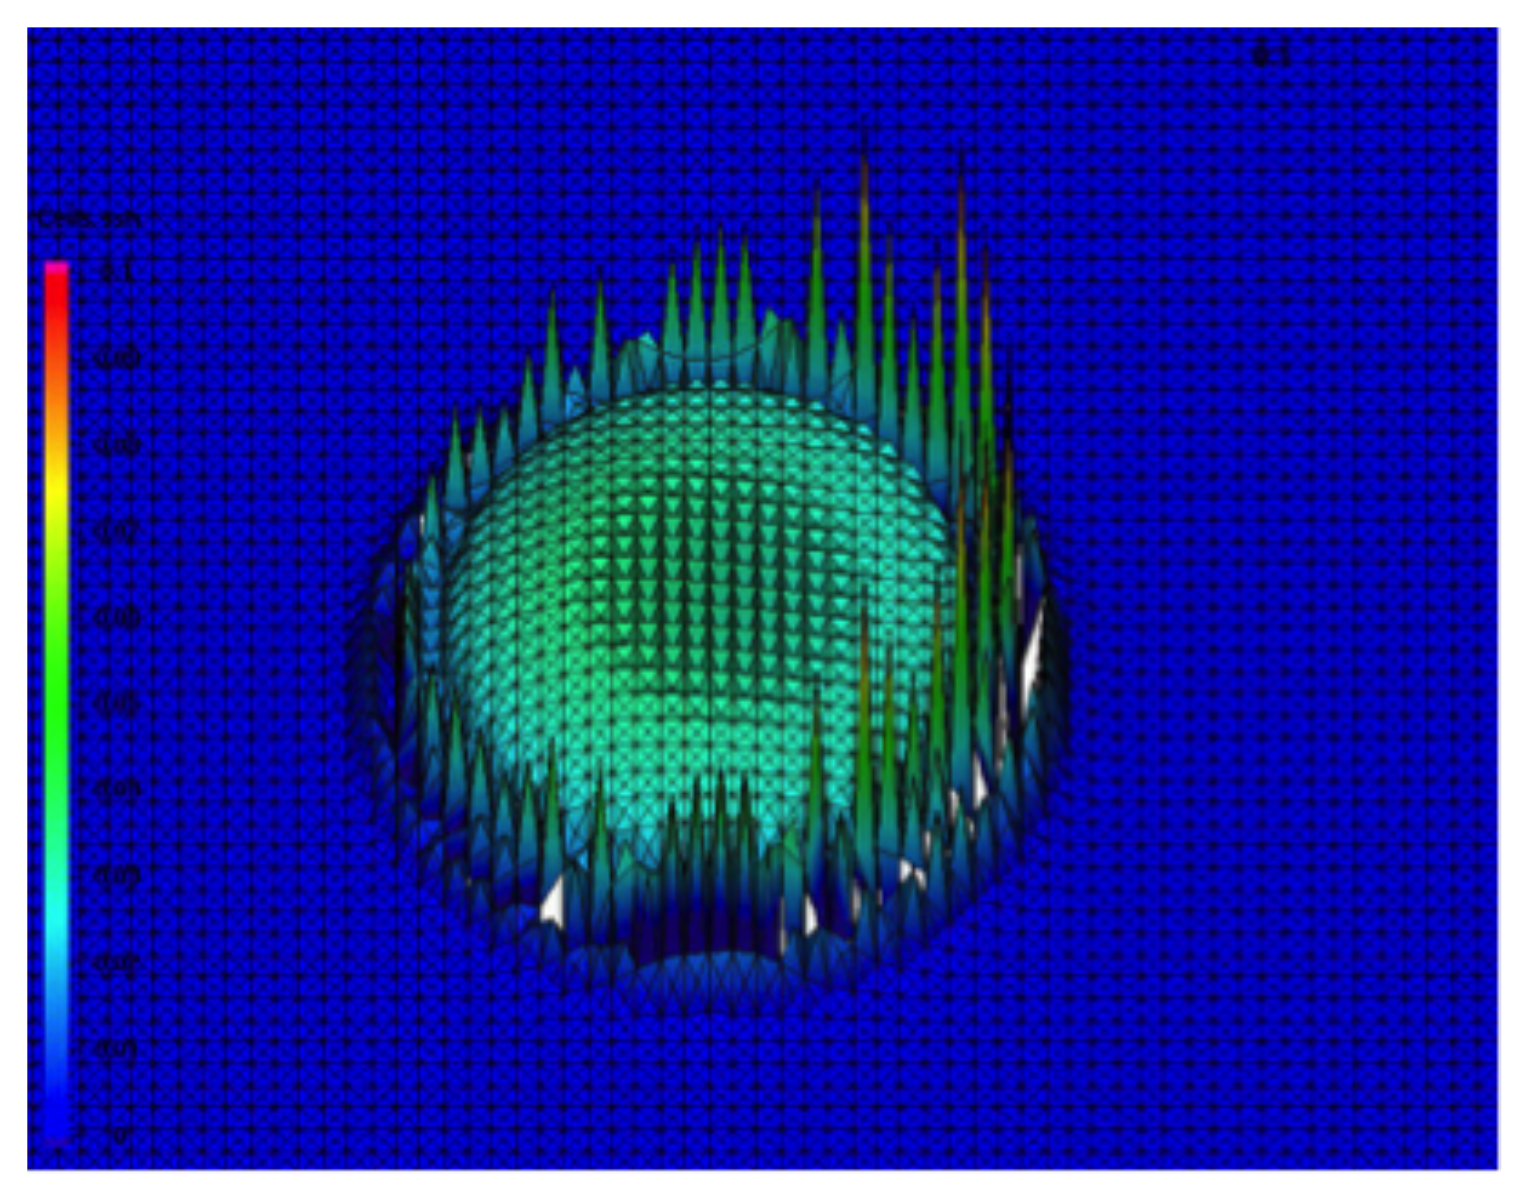
3.2. Unstable Numerical Model Phenomenon
4. Discussion and Outlook
4.1. Interaction of Scales
- El Niño Southern Oscillation (ENSO) is a phenomenon that occurs every five to ten years, characterized by a certain pattern of tropical Pacific sea surface temperature (see [17]). In principle the sea surface temperature in the tropical Pacific is oscillating with the seasonal cycle yielding warm surface waters in Summer and colder temperatures in Winter. Every now and then a strong anomaly in this pattern occurs such that the surface temperature in a large region is up to C warmer than normal, triggering a whole cascade of subsequent processes commonly called the El Niño Phenomenon or El Niño Southern Oscillation (ENSO). As a side remark the reader may notice that this phenomenon is linked to the seasonal oscillation of sea surface temperature and therefore only occurs around November/December, a reason it is called el Niño—the Spanish expression for the (Christ) Child.
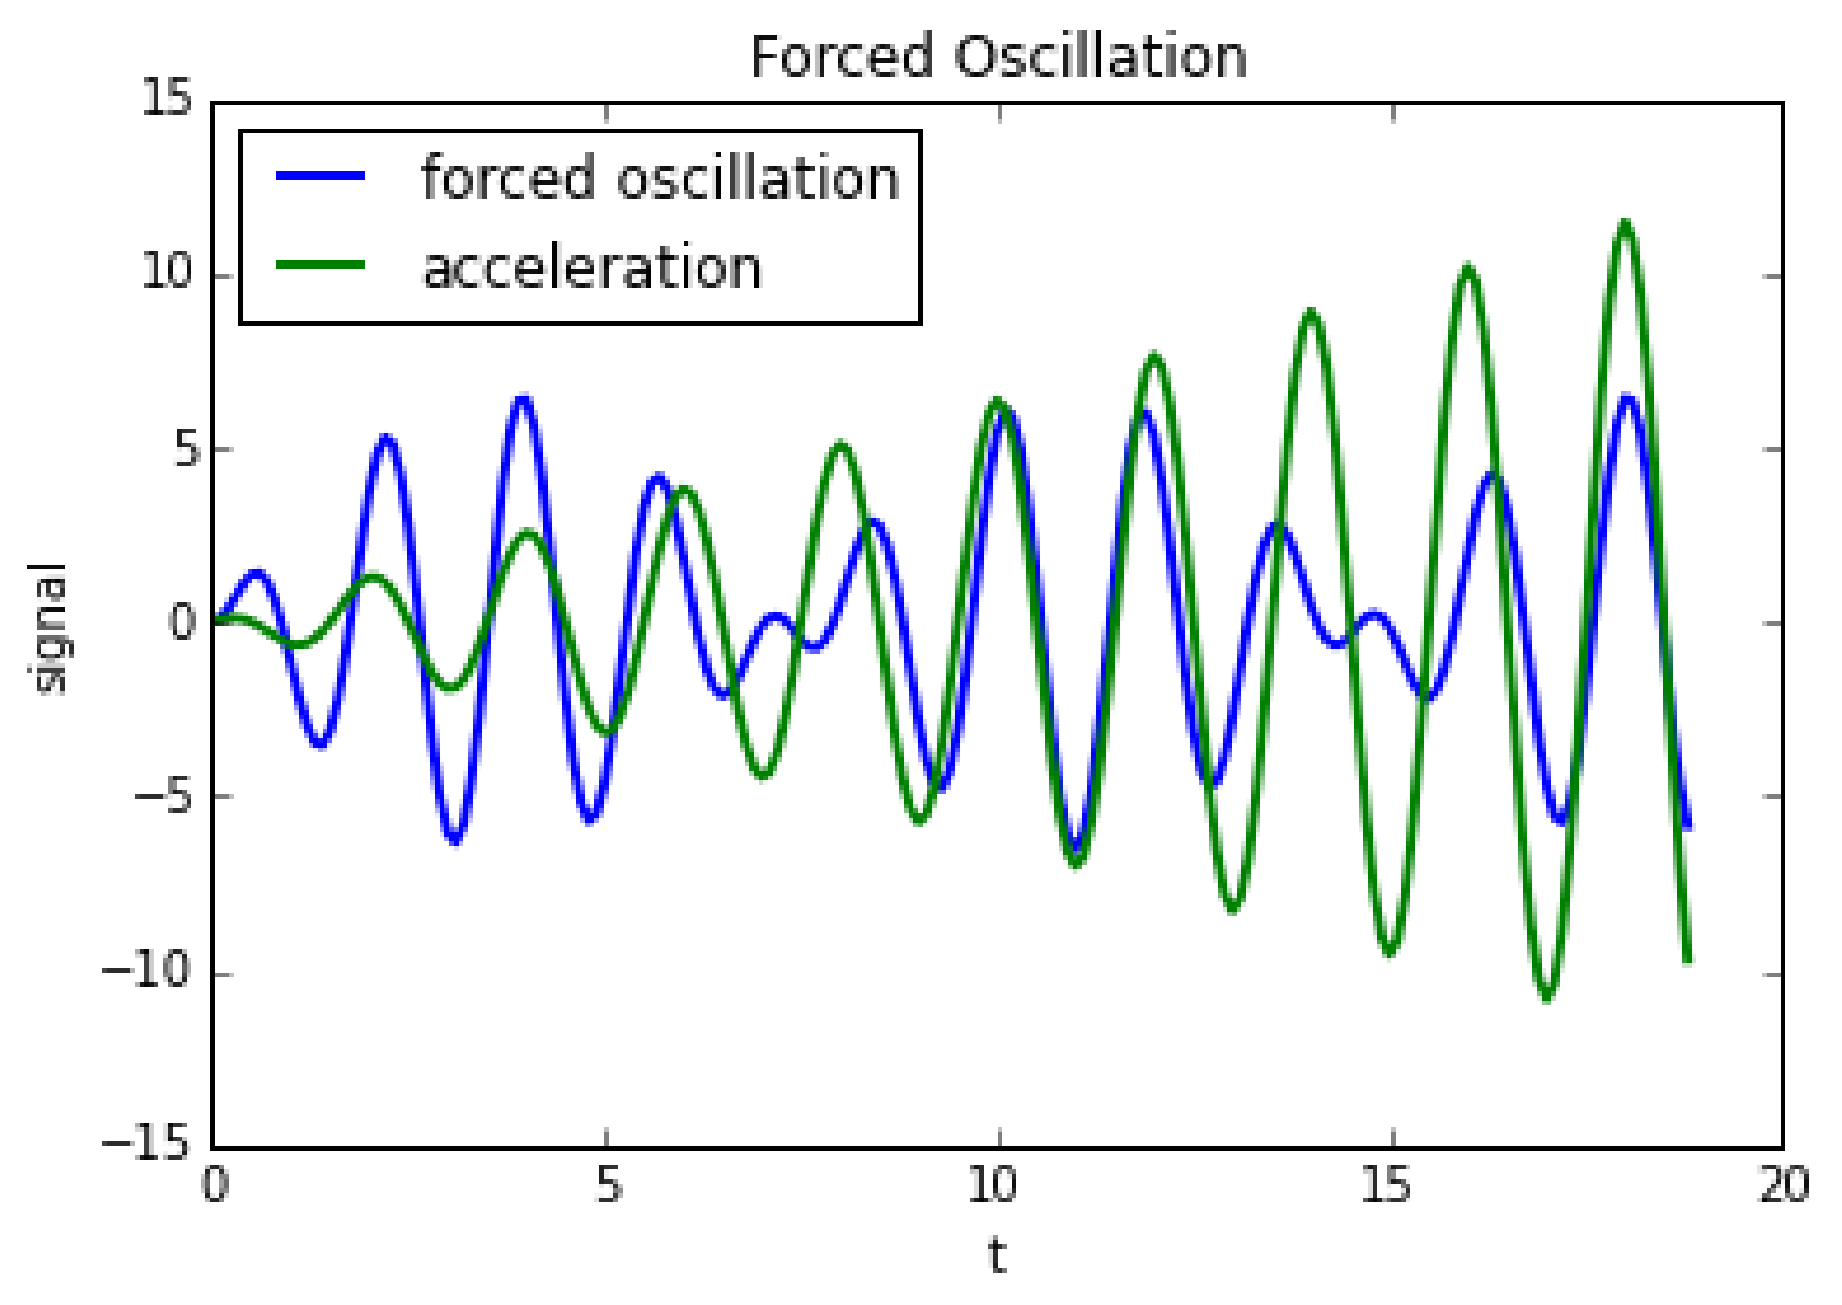
- A children’s swing or rather the phenomenon of a swinging child is characterized by a child sitting on an especially designed pendulum, which is triggered by a deliberate movement of legs and arms of a child at the eigenfrequency of that pendulum. The child is swinging, if the pendulum deviates from its balanced state by a certain amount.
- For , , and , and initial conditions , we obtain the solution .
- For (normalized mass), , and we obtain a system that is forced with its eigen frequency. In this case, the solution can be given as .
4.2. Limitations
- One assumption that was exposed during intense discussions in several interdisciplinary interactions is the reliance on quantifiable entities. This was felt to be a severe limitation by scholars representing a qualitative research direction in social sciences who could not cope with this approach.
- A second cause for confusion was the inability of this approach to analyze or detect causalities. It is a purely descriptive approach. Therefore, the expectation that this formulation could reveal new knowledge about a multi-scale system is false.
- A third implicit assumption that the notation in mathematical terms automatically clarifies confusion may not be true. The mathematically educated scholar may find the presentation not rigorous enough, while the non-mathematician may need a while to digest and understand the material. This is an experience taken from the courses taught on the topic of scales.
5. Conclusions
Funding
Acknowledgments
Conflicts of Interest
References
- Encyclopaedia Britannica. Climate—Scale Classes, Contributor Smith, P.J. Available online: https://www.britannica.com/science/climate-meteorology/Scale-classes (accessed on 10 June 2018).
- Adger, W.N.; Arnell, N.W.; Tompkins, E.L. Successful adaptation to climate change across scales. Glob. Environ. Chang. 2005, 15, 77–86. [Google Scholar] [CrossRef]
- Meehl, G.A.; Lukas, R.; Kiladis, G.N.; Weickmann, K.M.; Matthews, A.J.; Wheeler, M. A conceptual framework for time and space scale interactions in the climate system. Clim. Dyn. 2001, 17, 753–775. [Google Scholar] [CrossRef]
- Matthews, A.J. A multiscale framework for the origin and variability of the South Pacific Convergence Zone. Q. J. R. Meteorol. Soc. 2012, 138, 1165–1178. [Google Scholar] [CrossRef]
- Emanuel, K.A. On the dynamical definition(s) of “mesoscale”. In Mesoscale Meteorology—Theories, Observations, and Models; Lilly, D.K., Gal-Chen, T., Eds.; NATO ASI Series, Series C, Mathematical and Physical Sciences; Springer: Dordrecht, The Netherlands, 1982; Volume 114. [Google Scholar]
- Hurrell, J.; Meehl, G.A.; Bader, D.; Delworth, T.L.; Kirtman, B.; Wielicki, B. A Unified Modeling Approach to Climate System Prediction. Bull. Am. Meteor. Soc. 2009, 90, 1819–1832. [Google Scholar] [CrossRef]
- Lovejoy, S.; Crucifix, M.; de Vernal, A. Scale and Scaling in the Climate System. Pag. Mag. 2016, 24, 33. [Google Scholar] [CrossRef]
- Pasini, A.; Lorè, M.; Ameli, F. Neural Network Modelling for the Analysis of Forcings/Temperatures Relationships at Different Scales in the Climate System. Ecol. Model. 2006, 191, 58–67. [Google Scholar] [CrossRef]
- Ionescu, C.; Klein, R.J.T.; Hinkel, J.; Kavi Kumar, K.S.; Klein, R. Towards a Formal Framework of Vulnerability to Climate Change. Environ. Model. Assess. 2009, 14, 1–16. [Google Scholar] [CrossRef]
- SICSS. School of Integrated Climate System Sciences—Homepage. Available online: http://www.sicss.de (accessed on 10 June 2018).
- Baehr, J.; Behrens, J.; Brüggemann, M.; Frisius, T.; Glessmer, M.S.; Hartmann, J.; Hense, I.; Kaleschke, L.; Kutzbach, L.; Rödder, S.; et al. Teaching Scales in the Climate System: An example of interdisciplinary teaching and learning. Geophys. Res. Abstr. 2016, 18, EGU2016-10680. [Google Scholar]
- Looney, D.; Hemakom, A.; Mandic, D.P. Intrinsic Multi-Scale Analysis: A Multi-Variate Empirical Mode Decomposition Framework. Proc. R. Soc. A 2015, 471, 20140709. [Google Scholar] [CrossRef] [PubMed]
- Vallis, G.J. Atmospheric and Oceanic Fluid Dynamics; Cambridge University Press: Cambridge, UK, 2006. [Google Scholar]
- Waugh, D.W.; Sobel, A.H.; Polvani, L.M. What is the Polar Vortex and How does it Influence Weather? Bull. Am. Meteor. Soc. 2017, 98, 37–44. [Google Scholar] [CrossRef]
- Newmann, P.A. GSFC Meteorological Plots for the Antarctic—GMAO GEOS 5.7 products. Available online: https://acd-ext.gsfc.nasa.gov/Data_services/Current/antarctic/index.html (accessed on 10 June 2018).
- Higham, N.J. Accuracy and Stability of Numerical Algorithms; SIAM: Philadelphia, PA, USA, 2002. [Google Scholar]
- Trenberth, K.E. The Definition of El Niño. Bull. Am. Meteor. Soc. 1997, 78, 2771–2777. [Google Scholar] [CrossRef]


© 2018 by the author. Licensee MDPI, Basel, Switzerland. This article is an open access article distributed under the terms and conditions of the Creative Commons Attribution (CC BY) license (http://creativecommons.org/licenses/by/4.0/).
Share and Cite
Behrens, J. A Mathematics Inspired Notation of Scales in the Climate System. Geosciences 2018, 8, 213. https://doi.org/10.3390/geosciences8060213
Behrens J. A Mathematics Inspired Notation of Scales in the Climate System. Geosciences. 2018; 8(6):213. https://doi.org/10.3390/geosciences8060213
Chicago/Turabian StyleBehrens, Jörn. 2018. "A Mathematics Inspired Notation of Scales in the Climate System" Geosciences 8, no. 6: 213. https://doi.org/10.3390/geosciences8060213
APA StyleBehrens, J. (2018). A Mathematics Inspired Notation of Scales in the Climate System. Geosciences, 8(6), 213. https://doi.org/10.3390/geosciences8060213


