Abstract
The safety of historic buildings heritage is an important task that becomes more substantial when it is directed to educational purposes. The present study aims at evaluating the dynamic features of the Benedettini complex, a historic monastery located in downtown Catania, which is at present the headquarters of the humanistic studies department of the University of Catania. Both the building’s complex response to a seismic input and the soil-structure interaction were investigated using ambient noise recordings. The results point out a multiple dynamic behaviour of the monastery structure that shows several oscillation modes, whereas the identification of a single natural frequency can be observed in some sites where the structure can more freely oscillate. This observation is also confirmed by the variability of computed damping values that appear linked to the different rigidity of the structure, as a function of the either the longitudinal or transversal orientation of the investigated structural elements. Moreover, the comparison between the building’s fundamental period and spectral ratios frequencies, which were obtained from free field ambient noise measurements located outside the monastery, outline the presence of potential resonance effects between the site and structure during a seismic event. Numerical modelling of the local seismic response confirms the obtained experimental site frequencies, setting into evidence that higher amplification factors are reached in the same frequency range characterizing the building.
1. Introduction
Cultural heritage safeguarding has become increasingly important in recent times due to its economic and social significance. The downtown area of a city is usually the most vulnerable part, since several historic buildings are mostly located there. These valuable constructions often undergo reduced structural capacity due to deterioration phenomena and damages suffered in the past. Geophysical surveys are normally adopted as a tool for cultural heritage restoration and protection plans [1,2,3,4,5]. Moreover, cultural heritage buildings were typically built without considering seismic actions, and therefore are potentially susceptible to earthquake damage. It is, indeed, well known that the level of building damage and its distribution during an earthquake is due to the combined effect of local site response, based on subsurface ground conditions, and the dynamic features of the structure itself.
Seismic site effects are caused by significant contrasts in the seismic wave impedance of different lithotypes and/or the irregular geometry of the surface, resulting from the presence of canyons, valleys, or hills [6,7,8]. These effects imply variations in the amplitude and frequency content of seismic waves that ultimately need to be taken into account since they affect earthquake hazard estimates. In the frequency domain, they can be estimated through several spectral ratio methods, which effectively reveal how near surface geological structures modify the spectral content of seismic waves. The most common technique for the local seismic response estimation is the Standard Spectral Ratio (SSR), which compares earthquake recordings at two sites. One of these is a “reference site”, which is usually located on solid bedrock, and considered to be devoid of significant site effects [9]. Another widespread technique that does not need a reference station is based on the Horizontal-to-Vertical Spectral Ratio (HVSR) using noise recordings (i.e., microseismic or ambient vibrations). This method was originally introduced by Nakamura [10] to characterize the transfer function of subsurface geological units. It has become widely used over the past two decades, since it has been shown to provide a reliable estimate of the predominant frequency of ground motion response at the surface of soft soil deposits [11,12,13,14]. This method applied to horizontal shear wave recordings by Lermo and Chavez-Garcia (1993) was shown to be consistent with results obtained using the SSR technique, especially in the frequency range around the fundamental frequency. In recent years, many authors have also successfully tested the reliability of HVSRs in estimating local effects linked to the presence of different morphological conditions such as landslides, faults, etc. [15,16,17,18,19,20]. Moreover, being a non-invasive technique, it can be used in cultural heritage sites [21,22,23].
The period (T) and the damping (D) of a building play an important role regarding the amplitude and duration of a seismic action. The period of a building can be assumed to be similar to that of a damped harmonic oscillator, having a mass M and a rigidity K:
Building height, structural typology, damage state, and regularity/irregularity in plan and elevation can also significantly influence such parameters. In order to assess T, several numerical methods, such as for instance the finite element method or the boundary element method, are widely used.
Empirical relationships provided by seismic codes [24], correlating T with the height (H) in meters, represent another way to determine the building period:
where Ct and a are parameters that are linked to the type of structures. These relationships often are not able to define an accurate T value of studied buildings. For this reason, in order to estimate the building’s dynamic properties, many researchers frequently adopt experimental techniques based either on the use of forced vibrations [25,26] or earthquake inputs [27,28], as well as on ambient vibrations [29,30]. Among the experimental techniques, the ambient vibrations method became widely used very quickly, since it was easy and quite inexpensive. However, it is important to remember that a comparison between the T estimated on undamaged buildings by using the ambient vibrations are 10–30% lower than periods estimated using more energetic seismic inputs [31,32].
In the present study, we used ambient vibrations processed through HVSR techniques in order to evaluate the seismic site effects in the Benedettini complex, which is located in the Catania (Italy) urban area (Figure 1a,b). In addition, the spectral ratios between the ambient vibrations Fourier spectra of horizontal components (HHSR), which are evaluated at the base and the different building levels, were used to determine the dynamical properties of this structure. These kinds of studies are important in investigating the possible soil-structure resonance effects that can arise when the fundamental frequency of a building shares the same range as that observed in the foundation soil [33,34,35].
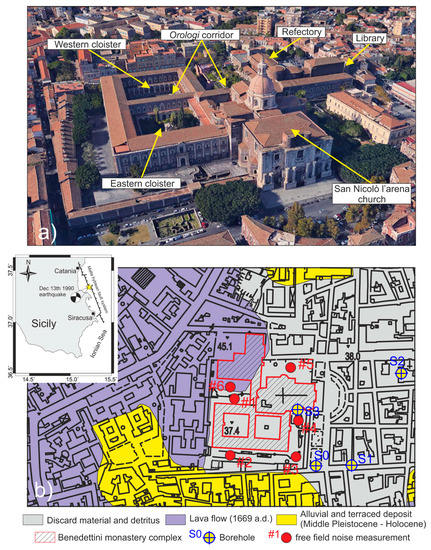
Figure 1.
Aerial view (a) and lithological sketch (b) of the investigated area. The inset shows the location and focal mechanism of the 1990 M5.7 earthquake.
2. Benedettini Complex History
The Benedettini monastery complex is located in downtown Catania, which is one of the higher seismic hazard Italian cities. The seismic history of Eastern Sicily has been characterised by large events with a moment magnitude ranging from 6.2 to 7.3 [36,37].
The construction of the Monastery complex began in 1558. However, its original structure was modified by two natural calamities that struck the city of Catania, which had a key role in its future development. Following the Etnean eruption of 1669 and the 1693 M7.0 earthquake, the monastery was harshly destroyed and then rebuilt, becoming a tally example of the addition of different architectural historical periods. Originally, the monastery had a square floor plan with an inner cloister called the “marble cloister” (now renamed Western cloister). The original church that was attached to it, at present named San Nicolò l’Arena, was destroyed by the 1669 lava flow. The shape of the area surrounding the Benedettini monastery was fully modified after the eruption, since part of the complex was surrounded by a 12-m thick lava flow. The reconstruction of the church started in 1687, and continued until 1693, when a powerful earthquake almost destroyed the monastery. It was rebuilt and grew larger, with respect to its original plan, in 1702 when the eastern cloister was added to the western one, together with an additional area, aimed at the library and the refectory, on the northern side. The construction work on the church of San Nicolò l’Arena was resumed, but its façade remained incomplete. From 1868, the monastery was reused for civil purposes—mostly for schools and an astrophysics laboratory, including a laboratory of meteorology and geodynamics—with deep and sometimes irreversible changes to its structure. Most of the frescos were cancelled, the corridors were divided, and other divisions were added to create offices, training rooms, and toilets. Notwithstanding, it was recognized as a national monument immediately after the Italian Unification. During 1977, in as part of a renaissance project of downtown Catania, the municipality donated the monastery to the University of Catania, which used it as the location of their Humanities department. Furthermore, in 2002, UNESCO (United Nations Educational, Scientific and Cultural Organization) included the monastery in the World Heritage List, as a site that was representative of the late Baroque of southeastern Sicily.
Subsequently to the M5.7 earthquake that struck southeastern Sicily in 1990 [38,39], some structural elements of the San Nicolò l’Arena Church and the eastern cloister were damaged, and several vertical cracks were detected. The extensive investigation on the masonry structure that was performed pointed out the presence of two different construction typologies. Namely, a solid stonework that was built by large and regular blocks, filled with rubble masonry, and made with rather strong mortar; and a highly inhomogeneous stone masonry bounded by a cover (about 300-mm thick) that was made with tile fragments and stones having rather weak mortar, and was locally called incoccio [40,41]. Often, the two architectural typologies are present in the same structural elements, with the second one mainly used as a repair technique. Eventually, in recent times, the masonry structure was modified by implanting reinforced concrete elements. It can therefore be easily inferred that such a structural mixture deeply affects the seismic behaviour of the whole structure.
3. Geologic Setting
The present geologic features of the Catania area (Figure 1b) are the result of tectonic uplift, sea level changes, and lava flows originating from Etna eruptions. The area shows a complex setting with lateral heterogeneities at a local scale, due to the presence of volcanic and sedimentary units [42]. The sedimentary substratum of the urban area is formed by a sequence of Quaternary clays, up to 600 m thick, overlain by several tens of meters of sands, which extensively outcrop in the southwestern boundary of the city, and within some areas protected from lava invasions. Sands are also included inside the clay horizons as thin layers that become predominant proceeding upwards in the succession, and gradually switch to sandy clays. Sands, conglomerates, and silty clays that are several meters thick also lie in discordance on the clayey basement, and mostly outcrop in the southern part of Catania. The city area is characterized by a series of predominantly flat marine terraces, which were covered by several meters of lava flows in prehistoric and historic times. Such processes are the result of the late Quaternary dynamics [42] in which the terraces represent marine deposits of the transitional environment, resulting from changes in the sea level that occurred during the Quaternary glaciations. The lava flows are the most extended lithotype outcropping in the urban area, covering almost the entire city substratum and deeply changing the original morphology. Borehole data have highlighted the heterogeneous nature of this formation, which is characterized by alternating compact and scoriaceous levels that are extremely variable in thickness [43,44]. Moreover, the presence of pyroclastic levels is observed in the sedimentary sequence of sand and sandy clays. Finally, in the historic core of the city, the upper stratigraphic horizon consists of several meters of rubble, which largely resulted from the destruction of buildings caused by the 1693 earthquake.
A detailed lithological sequence of the investigated area was settled through boreholes information (see locations in Figure 1b) coming from the microzoning studies of Catania [45] and a geotechnical characterisation of the monastery subsoil performed by Grasso et al. [46]. The area is characterised by the presence, at a depth of about 40 m, of a Quaternary clay bedrock overlaid by a l0–15-m thick historic (~693 BC) basaltic lava [42]. This lava formation is covered, respectively in the northern and in the southern area of the monastery, by 5–10 m of the 1669 fractured lavas, and by 15–20 m of terraced deposits (fine sand). Finally, detritus with a thickness of about 5–10 m cover all of the monastery area (Figure 2).
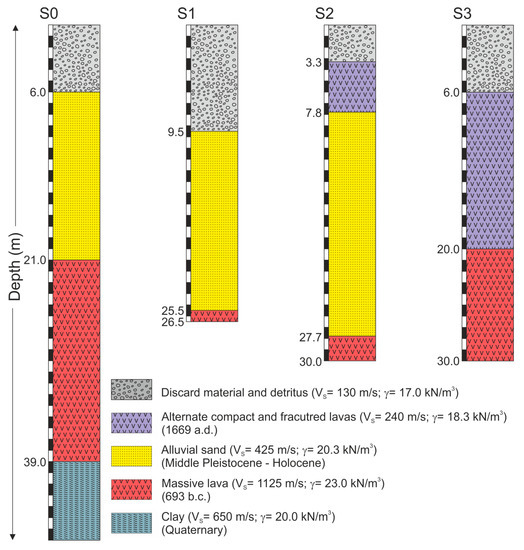
Figure 2.
Litho-stratigraphic sequences from boreholes data (see Figure 1b for the location).
4. Experimental and Numerical Data Processing
4.1. Ambient Vibration Measurements
Ambient noise measurements were performed in all of the monastery areas owned by the University of Catania, which therefore did not include the buildings held by the Catania municipality (San Nicolò l’Arena church and the public library). Three-component velocimeters (Tromino), sampling the signal at a frequency of 128 Hz, were used. Inside the building, 21 sites were chosen near the main structural elements (Figure 3), and ambient vibrations were recorded for axes at different levels of the construction. On the whole, 50 measurements were performed in the western and eastern cloisters, deploying the measurements in each floor (basement, ground, first, second, and attic floors). Similarly, 17 measurements were allocated to each floor (ground, first, second, and roof floors) of the refectory. Furthermore, six sites were selected in the free field outside of the building, as remote as possible from the surrounding structures (see location in Figure 1b). The velocimeters, both inside and outside the structure, were settled with the north–south component oriented transversally to the 214-m long orologi corridor, which crosses the entire monastery and represents its maximum length (see Figure 3).
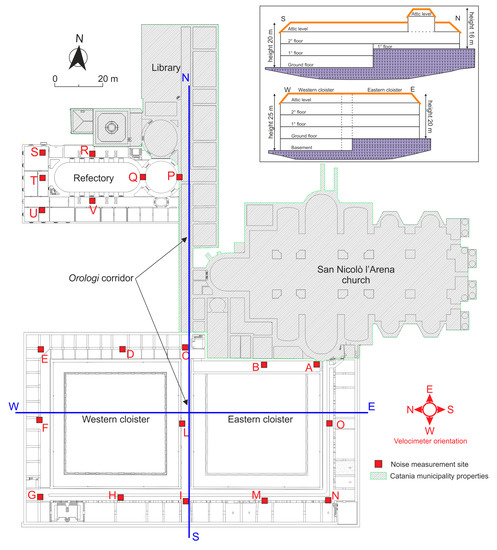
Figure 3.
Monastery layout with the location of noise recording sites. The inset shows the north–south (NS) and east–west (EW) simplified sketches pointing out the different levels and number of floors existing in the Benedettini complex.
The recorded ambient vibrations measurements were processed using the Geopsy (http://www.geopsy.org) package, which puts together several tools aimed at processing ambient vibrations for site and buildings characterization. The data processing procedure for each measurement consists in subdividing the recorded signal into time windows of 20 s, selecting the most stationary part and not including transients associated to very close sources. Fourier spectra were then calculated in the frequency band 0.5–20.0 Hz and smoothed using a Konno and Ohmachi [47] filter with b = 40 (bandwidth coefficient 0 ≤ b ≤ 100). Taking into account that a strong smoothing is usually obtained with a small b value whereas, a large b value leads to a low smoothing. Subsequently, the Geopsy tool “structure spectrum” was used to process data concerning the measurement sites located inside the buildings. It consists in computing the spectral ratio. Hence, the spectral ratios between the ambient vibrations Fourier spectrum of horizontal components, which were recorded on the various building floors, and the same components as sampled in the free field, were computed (Figure 4, Figure 5, Figure 6 and Figure 7). The resulting function, named HHSR (Horizontal to Horizontal Spectral Ratio), is then the system transfer function, which was obtained through a simple deconvolution method based on the spectral ratio between the output (the recording at the different building levels) and input signals (ground motion at the base) [48,49]. Site #1 (see Figure 1b for the location) was used as the reference site. The Figure 4, Figure 5, Figure 6 and Figure 7 show the HHSR results of measurements performed on the same vertical for each building site.
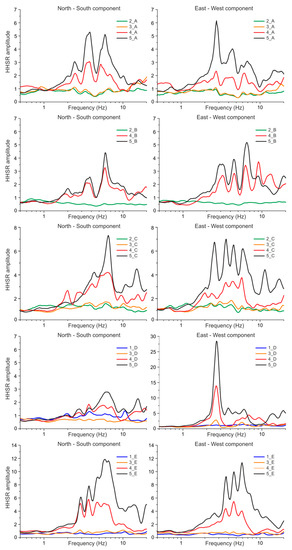
Figure 4.
Horizontal-to-horizontal spectral ratio (HHSR) plots obtained from noise recordings performed at floors one (basement) to five (roof) for the sites A, B, C, D, and E.
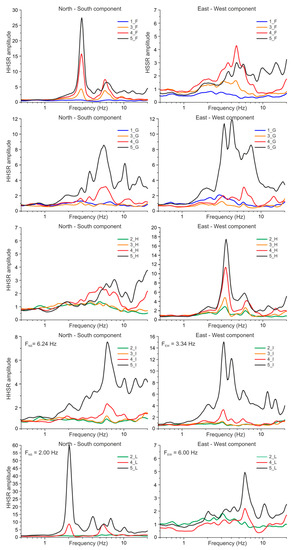
Figure 5.
HHSR plots obtained from noise recordings performed at floors one (basement) to five (roof) for the sites F, G, H, I, and L.
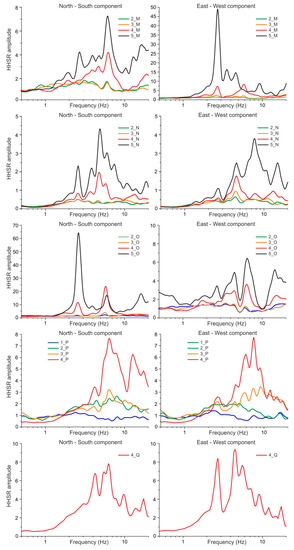
Figure 6.
HHSR plots obtained from noise recordings performed at floors one (basement) to five (roof) for the sites M, N, O, P, and Q.
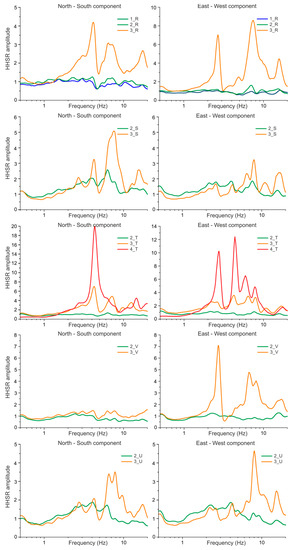
Figure 7.
HHSR plots obtained from noise recordings performed at floors one (basement) to five (roof) for the sites R, S, T, U, and V.
The HHSR results set into evidence the complex dynamic behaviour of the Monastery structure. It can indeed be observed that most of the spectral ratios do not enable the identification of a single natural frequency but, they show several oscillation modes (see Figure 4, Figure 5, Figure 6 and Figure 7) in the frequency range 2.0–10.0 Hz. These results can be interpreted as a consequence of several factors such as the structural complexity of the whole edifice (masonry building with the presence of reinforced concrete elements), irregular plan shape and the presence of adjacent structures. Local modes near the measurement points can indeed be ascribed to floor tiling, floating floors, piping, out-of-plane movements of detached walls and stairwells detached from the frame of the building. In the Monastery all these elements are present as a consequence of the changes made over the years to adapt the structure to its different use. However, in some places of this complex building, where the influence of the above listed elements is lower (e.g., sites D, F, H, L, M, O and T in Figure 3), the presence of dominant fundamental frequencies can easily be detected in the HHSRs. In such cases pronounced dominant peaks are observed in the frequency interval 2.0–5.0 Hz (Figure 4, Figure 5, Figure 6 and Figure 7), emphasizing that, besides the lack of homogeneity of the complex map, the role played by the different heights of the various portions of the building is not negligible (see inset in Figure 3). Moreover, it is interesting to observe that the HHSR dominant frequencies and their amplitude appear related to the location of the different recording sites. It is in fact evident that in the corners of the Western and Eastern cloisters (e.g., sites E and N) the HHSRs show an increase in the predominant frequency values and a decrease of its amplitude with respect to the spectra obtained from measurements located along the cloisters corridors (e.g., sites F and O) (see Figure 4, Figure 5 and Figure 6). In our opinion, this behaviour can be related to the different stiffness of the various portion of the building. Therefore, sites located at the building corners, having a more constrained swinging in both NS and EW directions, show less pronounced dominant peaks at higher frequency values. On the other hand, HHSRs from measurements located halfway along the side walls (e.g., sites F and O) show lower dominant frequencies with pronounced peak amplitude especially in the direction where the side walls can more freely oscillate (NS).
The HVSR technique was instead applied to the recording sites located outside the building, computing the Fourier spectra (FFT) through the above described procedure. In this case, the ratio of the geometric averaged horizontal-to-vertical frequency spectrum is used to determine the fundamental site resonance frequency (Figure 8). Following the criteria suggested by SESAME [50], only the HVSR peaks reaching an amplitude that was greater than two units were considered as significant. The comparison between building and site frequencies was then used as a tool to put into evidence the potential presence of resonance between site and structure during a seismic event. It has to be remembered that the presence of lava flows at the surface could imply the existence of possible velocity inversions with the underlying soft sediments, which could give rise to a HVSR amplitude lower than one unit [51,52,53]. Panzera et al. [44] tested the influence of lava thickness on the HVSR amplitude, in the frequency range 1.0–10.0 Hz. The authors observed that the amplitude of the spectral ratio peaks decayed, reaching values lower than one, when massive lava with a thickness higher than 20 m overlaid sedimentary terrains. In the Benedettini monastery area, compact lavas did not outcrop, but the geologic sequence was made by 20–30 m of detritus, fractured lavas, and/or terraced deposits with lower shear wave velocities (see Figure 2). The HVSRs depict significant peaks, with amplitude between 2 and 5 units, in the frequencies range 3.0–6.0 Hz (Figure 8). The influence of the 1669 AD lava layer on spectral ratio amplitude is quite evident. Indeed, the highest spectral ratio amplitudes are observed in site #2 (see Figure 1 and Figure 8) where such lava layer is not present and a decrease in amplitude is observed as the thickness of the lava increases (see #1, #3, #6 in Figure 1 and Figure 8). In the #4 and #5 (see Figure 1 and Figure 8), where the 1669 AD lava overlays the 693 BC lava, the HVSRs show a broadband distribution of frequencies, due to the existence of alternating compact and scoriaceous layers having different velocities. These outcomes confirm that the Monastery is founded on different stratigraphic sequences.
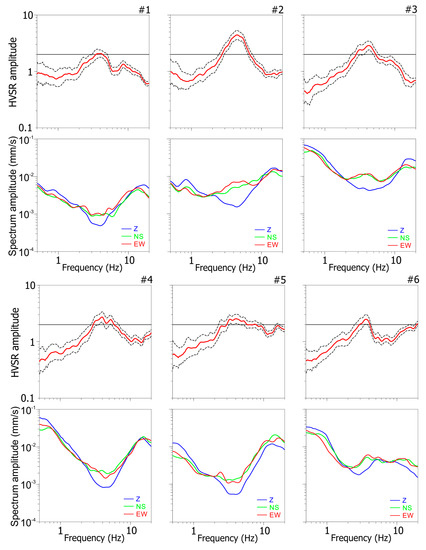
Figure 8.
HVSR plots and corresponding Fourier spectra obtained from ambient noise recordings performed outside the Benedettini monastery (see Figure 1b for the locations).
The reliability of the observed HVSR peaks was tested by inspecting the shape of the Fourier spectra (FFT). As described by Castellaro and Mulargia [52], the existence of a geologic discontinuity is identified in the Fourier spectra by the presence of a “eye-shaped” feature with a local minimum of the vertical component. Conversely, the presence of three individual spectral peaks is usually related to disturbances such as those induced by nearby structures. The FFT spectra related to our experimental HVSRs, clearly show the presence of the “eye-shaped” feature, therefore excluding the influence of disturbances (Figure 8). It is also important to point out that the comparison between the buildings and the site frequencies put into evidence the existence of potential site-to-structure resonance during a seismic event. Such outcome can explain the moderate damage observed in the San Nicolò l'Arena church and in the Eastern Cloister as a consequence of the 1990 earthquake.
The amplitude of a building’s shaking due to an earthquake is also related to its structural damping. In the present study, we adopted the Random Decrement Method (RDM) [54], which is one of the most used methodologies for assessing the damping on structures. A building can be assumed as a single degree of freedom oscillator whose motion equation is:
where, is the externally applied force as a function of time; m, c, and k are respectively the mass, the damping coefficient, and the stiffness of the system; x is the displacement, and and are the velocity and the acceleration. The basic assumption of the RDM is that the input is the sum of a random signal and an impulse response function, as described by Equation (3). Then, by averaging several time windows (N) with the same initial conditions (initial displacement to be zero), the random component tends to disappear, while the response of the structure is enhanced. This procedure provides an estimate of the system free-vibration decay, , which can be obtained as:
where s is the ambient vibration window of duration τ, and ti is the time verifying the initial conditions, in which ambient vibrations remain stationary, and the impulse response of the structure is revealed. In the present study, we estimated the damping values using ambient noise records, and through the RDM technique [55], which was implemented in Geopsy (http://www.geopsy.org/). The use of the RDM requires that the mode under analysis is well detectable [56]. Then, considering the Benedettini monastery as a complex structure characterized by several oscillation modes, we applied this technique only on measurement sites showing well separated modes (e.g., F, M, T). In particular, the RDM was applied on the first mode of vibration, which usually has the largest contribution to the structure’s motion [57]. In order to properly apply the RDM on the chosen frequency, the signal was processed using a band pass butterworth filter with an order of 3 in a range of ±10% around the fundamental mode, and taking into account windows containing 20 times the considered period. Figure 9 shows examples of the computation performed for some selected locations in the topmost part of the studied structures. Although the damping values obtained through a weak motion input (ambient noise) must be handled with caution, significant information can be gained. Most seismic codes assume a 5% constant value of damping without correlating it with the fundamental period of the structure. In a recent study, Salameh et al. [58] demonstrated that the damping is related to the soil foundation and the building geometry. In our study it appears also evident a variability linked to the different rigidity of this complex structure as a function of the longitudinal or transversal orientation of its structural elements. The examples in Figure 9 set into evidence that damping values change, between 1% and 5%, when measurements are performed in either NS or EW oriented parts of the structure.
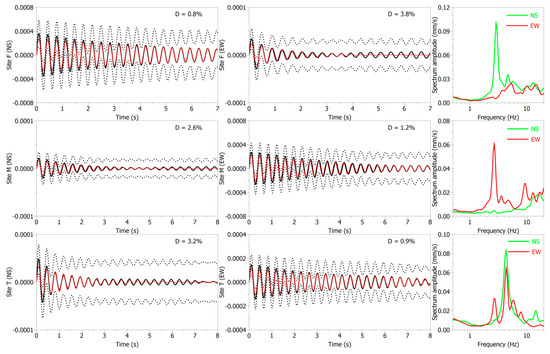
Figure 9.
Examples of damping curves obtained using the random decrement method (RDM) and corresponding Fourier spectra (FFT) for selected sites. The continuous black line corresponds to the mean of the random decrement, the dashed lines correspond to the standard deviation, and the solid red line corresponds to the fitted exponentially decreasing function.
4.2. Modelling 1D Amplification Function
The scientific community agrees on the reliability of the fundamental frequency peak achieved through HVSR, whereas it has frequently questioned the existence of a simple direct correlation between HVSR amplitude values and the actual site amplification e.g., [13,59]. Catania is characterized by alternating outcrops of sediments and basaltic lavas, with the presence of possible lateral and vertical heterogeneities, but several authors [43,44,60] used one-dimensional (1D) modelling to reproduce the seismic site effects on the outcropping lithology, with sound results. For this reason, having no earthquake recordings for the investigated site, a numerical modelling was carried out using the code STRATA (https://nees.org/resources/strata). It computes the seismic site response of a 1D soil column using the equivalent-linear (EQL) approach or the frequency-dependent equivalent linear (F-EQL) analysis. The F-EQL approach was chosen in this study to overcome the limitations of EQL analysis in predicting site amplification at high frequencies when the induced strains are large e.g., [61]. The analysis is performed considering a horizontally polarized shear wave vertically propagating through horizontal layers. This code requires a geologic profile specifying the unit of weight (KN/m3), the thickness (m), and the shear wave velocity (m/s) for each layer down to the bedrock. In particular, the bedrock was considered as an elastic half-space with a unit of weight 20 kN/m3 and 2% damping. Moreover, for the F-EQL response analysis, other key geotechnical parameters required include the normalised shear modulus decay G(γ)/Gmax and the damping versus strain curves D(γ) for each layer. The input stratigraphic sequence (see Figure 2) was modelled using the elastic parameters of the main geological formations, as characterized in the CNR-GNDT (Consiglio Nazionale della Ricerche–Gruppo Nazionale Difesa dai Terremoti) “Catania Project” [62]. The used experimental curves of the G(γ)/Gmax and the D(γ) are shown in Figure 10a. They were taken from Carrubba and Maugeri [63] for cohesive soils (clay) and from Cavallaro et al. [64] for weathered lava and non-cohesive soils (sand). These curves were obtained by performing the resonant column test (RCT) on specimens collected in Catania urban area. As regards the compact lava, strain-dependent damping and shear modulus degradation curves were taken from Seed and Idriss [65], according to Bessason and Kaynia [66], which estimated site amplification in lava rock on soft sediment sites.
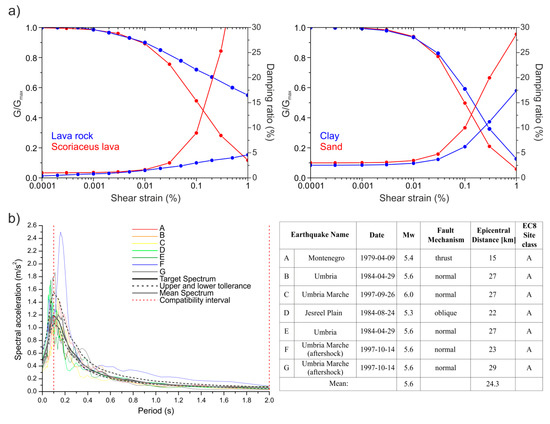
Figure 10.
(a) Shear modulus (G) and damping factor (D) dependent on shear strain (γ) used in this study; (b) compatible combination of the acceleration response spectra (5% damping) found for the considered earthquake scenario.
As a reference earthquake, we choose the M5.7 earthquake that struck southeastern Sicily in 1990, producing slight damage to the structural elements of the Church of San Nicolò l’Arena and in the eastern cloister. This strike slip event, located on Malta–Hyblean escarpment about 25–30 km from the city of Catania (see the epicentre location in the inset map of Figure 1b), can be considered as a moderate scenario for Catania e.g., [60]. The magnitude (MW), the hypocentre distance, and the focal mechanism stand for the input of the Cauzzi et al. [67] attenuation law in order to define the target spectrum. The ground motion model, considering a strike slip mechanism and an Eurocode 8 [24] site class A, is defined by the following relationship:
where the terms and are:
in which c1, m1, m2, r1, r2, r3, and fSS (strike slip fault mechanism) are numerical coefficients determined by the authors through regression analyses. The RRUP is the rupture distance, which for the magnitude minor or equal to 5.7, the authors considered equivalent to the hypocentre distance [67]. This ground motion prediction equation is defined for the 5% damping displacement response spectrum (DRS) in cm, considering the period (T) range 0.01–10 s. This relationship is also defined for the peak ground acceleration (PGA) in cm/s2 and for the peak ground velocity (PGV) in cm/s. Pseudo-spectral acceleration (PSA) values can therefore be computed from DRS by using the formula:
The dataset used to calibrate such an attenuation model encloses more than 3600 accelerometer records from 98 global earthquakes with moment magnitudes ranging from 4.5 to 7.9. The PSA obtained for the chosen reference earthquake was then used to select seven strong motion accelerograms from the European strong motion database (ESD) [68] through the REXEL software [69] (Figure 10b). In the first step, the code selects the records contained in the ESD that fall into the magnitude and distance bins specified by the user for a specific site class. Afterwards, the user specifies the period range and the tolerance limits within which the average spectrum of the N selected accelerograms should be included. The search is in this case performed by selecting N = 7 records that match the design spectrum in the period interval 0.1–2.0 s, considering a 30% (upper) and a 10% (lower) tolerance. Figure 10b shows the results of the performed analysis.
The STRATA code provides, among the outputs, the mean acceleration response spectra (Sa) at the chosen critical damping, the mean amplification function (AF), which was obtained as the ratio between Sa at the surface and at the bedrock (rock condition Eurocode 8 [24] site class A in our study), and the mean peak ground acceleration profile. In particular, the mean values are obtained by averaging the site response results evaluated through each of the selected seven accelerograms (Figure 11). The results, obtained in terms of acceleration response spectra at 2% and 5% damping, point out that the highest spectral acceleration peaks fall in the range of the Monastery main oscillation periods with maximum PSA values between 0.3g and 0.6g. The AFs (Figure 11) show shapes similar to those of HVSRs (see Figure 8), reaching amplification values between 2.5 and 4.0. In particular, the AF amplitudes are slightly higher than those obtained through HVSRs, but they share the same frequencies. These results confirm the HVSR capturing ability of the soil fundamental frequencies, highlighting also the limitation in determining the accurate amplification values. The comparison between AFs and HVSRs further support our assumption that in the Benedettini area the main amplification effects are mostly linked to the local lithostratigraphic sequences. The peak ground acceleration profiles (Figure 11) highlighted that the main amplification effects took place at a depth lower than 10 m. This can be related to the presence of a discard material and a detritus layer originating from the ruins of past earthquakes.
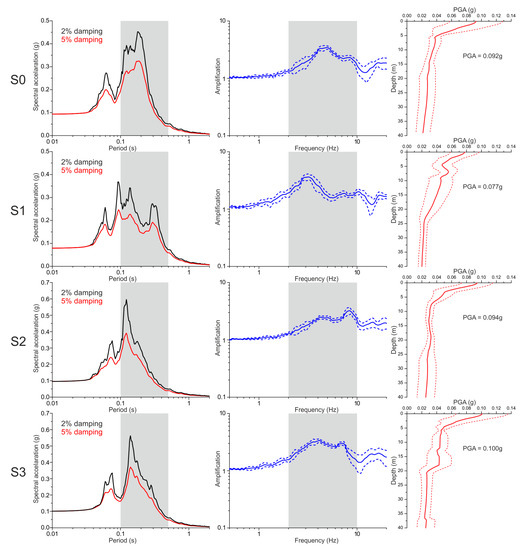
Figure 11.
STRATA 1D modelling results in term of: mean acceleration response spectra for the 2% (black lines) and the 5% (red lines) damping respectively (left panels); mean amplification functions (blue lines) and corresponding standard deviation (dotted blue lines) (central panels); mean PGA profile (red line) and corresponding standard deviation (dotted red lines) (right panels).
Finally, we tried to use the PGA values obtained at the surface to estimate a mean Mercalli–Cancani–Sieberg macroseismic intensity (IMCS) for the area. The scientific literature reports several relationships correlating IMCS and PGA, such as that proposed by Locati et al. [70]:
It was then possible to estimate an IMCS value of about VI-VII for the study area, which is sufficient to explain the observed damage to the Monastery.
5. Concluding Remarks
This study aims at investigating the dynamic properties of the Benedettini monastery structure. In order to inspect possible soil-structure resonance effects, the natural frequencies experimentally obtained for the different portions of the complex building were compared with the ones measured in the free field area close to the monastery. As previously specified, the San Nicolò l’Arena church and the public library were excluded from this study, since they are not easily accessible due to being owned by the Catania municipality. However, their dynamic properties were studied by Valente and Zigone [71]. The main results of this study can be summarized as follow:
- The HHSR results point out several oscillation modes (see Figure 4, Figure 5, Figure 6 and Figure 7) in the frequency range 2.0–10.0 Hz, that we correlate to the structural complexity of the Monastery. However, in some places, where the influence of the irregularities is lower, the presence of dominant fundamental frequencies was easily detected.
- The RDM was used to quantify the buildings damping. In particular, this method was applied only on sites showing a well detectable first mode of vibration. This means that for more specific damping estimates, operational mode analysis and/or finite element method could help in determining more accurate values for the investigated structure. However, although the performed analysis is quite simple, it allowed us to set into evidence an extreme variability of the building damping values.
- The soil fundamental frequencies, obtained from measurements performed outside the Monastery (Figure 8) range in the interval 3.0–6.0 Hz, highlighting an important role of the stratigraphic sequence on the site effects. Moreover, we observed that HHSRs and HVSRs share in many case the same frequency band, therefore pointing out possible site-to-building resonance effects.
- The spectral accelerations and amplification functions coming out from numerical modelling obtained by using the code STRATA, are consistent with the HVSR results and the estimated macroseismic intensity is tightly linked with the damage observed in the Monastery during the 1990 earthquake ground shaking.
It is worth noting that in the present study, through a detailed ambient vibration survey and a 1D site response modelling it was possible to highlight the main soil and structure properties. The approach followed points out how the structural complexity and the local seismic response play an important role on buildings damage. These findings can therefore represent useful clues for further numerical modelling and additional engineering investigations aiming at reducing the seismic risk.
Acknowledgments
This study was performed in the frame of the agreement between the University of Catania and the Earth Science section of the Department of Biological, Geological and Environmental Sciences—University of Catania (Scientific Responsible: S. Imposa). Passive seismic surveys were carried out using the instruments belonging to the Applied Geophysical Laboratory of the Department of Biological, Geological and Environmental Sciences—University of Catania (Scientific Responsible: S. Imposa).
Author Contributions
Sebastiano Imposa and Giuseppe Lombardo conceived and designed the experiments; Francesco Panzera performed the experiments and analyzed the data; Sabrina Grassi contributed in the data analysis; Sebastiano Imposa, Giuseppe Lombardo, Francesco Panzera and Sabrina Grassi wrote the paper.
Conflicts of Interest
The authors declare no conflict of interest.
References
- Barilaro, D.; Majolino, D.; Gresta, S.; Imposa, S.; Schillaci, A.; Leone, A. Geophysics and thermographic investigations addressed to the study of the church of “S. Maria del Rosario” in Sicily (Italy). Contrib. Geophys. Geodesy 2006, 36, 239–253. [Google Scholar]
- Barilaro, D.; Branca, C.; Gresta, S.; Imposa, S.; Leone, A.; Majolino, D. Ground Penetrating radar (G.P.R.) surveys applied to the research of crypts in San Sebastiano’s church in Catania (Sicily-Italy). J. Cult. Herit. 2007, 8, 73–76. [Google Scholar] [CrossRef]
- Imposa, S. Infrared thermography and Georadar techniques applied to the “Sala delle Nicchie” (Niches Hall) of Palazzo Pitti, Florence (Italy). J. Cult. Herit. 2010, 11, 259–264. [Google Scholar] [CrossRef]
- Imposa, S.; Mele, G.; Coco, G.; Corrao, M.; Battaglia, G. Characterization of decay in the wooden roof of the S. Agata church of Ragusa Ibla (southern Sicily) by means of sonic tomography and resistograph penetration tests. Int. J. Archit. Herit. 2014, 8, 213–223. [Google Scholar] [CrossRef][Green Version]
- Imposa, S.; Grassi, S. Georadar survey inside the Santa Maria Maggiore Church of Ispica (Sicily-Italy). Environ. Earth Sci. 2015, 73, 1939–1949. [Google Scholar] [CrossRef]
- Bard, P.-Y.; Bouchon, M. The two-dimensional resonance of sediment-filled valleys. Bull. Seismol. Soc. Am. 1985, 75, 519–541. [Google Scholar]
- Faccioli, E. Seismic amplification in the presence of geological and topographic irregularities. In Proceedings of the 2nd International Conference on Recent Advances in Geotechnical Earthquake Engineering and Soil Dynamics, St. Louis, MO, USA, 11–15 March 1991; pp. 1779–1797. [Google Scholar]
- Naganoh, M.; Kagami, H.; Muratami, H. Effects of surface and subsurface irregularities. In Earthquake Motions and Ground Conditions; The Architectural Institute: Tokyo, Japan, 1993; Section 3.3. [Google Scholar]
- Borcherdt, R.D. Effects of local geology on ground motion near San Francisco Bay. Bull. Seismol. Soc. Am. 1970, 60, 29–61. [Google Scholar]
- Nakamura, Y. A Method for Dynamic Characteristics Estimation of Sub Surface Using Microtremor on the Ground Surface; Railway Technical Research Institute: Tokyo, Japan, 1989; Volume 30, pp. 25–33. [Google Scholar]
- Lermo, J.; Chavez-Garcia, F.J. Site effect evaluation using spectral ratios with only one station. Bull. Seismol. Soc. Am. 1993, 83, 1574–1594. [Google Scholar]
- Seekins, L.C.; Wennerberg, L.; Marghereti, L.; Liu, H.P. Site amplification at five locations in San Fransisco, California: A comparison of S waves, codas, and microtremors. Bull. Seismol. Soc. Am. 1996, 86, 627–635. [Google Scholar]
- Haghshenas, E.; Bard, P.-Y.; Theodulidis, N.; SESAME WP04 Team. Empirical evaluation of microtremor H/V spectral ratio. Bull. Earthq. Eng. 2008, 6, 75–108. [Google Scholar] [CrossRef]
- Panzera, F.; Lombardo, G. Seismic property characterization of lithotypes cropping out in the Siracusa urban area, Italy. Eng. Geol. 2013, 153, 12–24. [Google Scholar] [CrossRef]
- Imposa, S.; Coco, G.; Corrao, M. Site effects close to structural lineaments in eastern Sicily (Italy). Eng. Geol. 2004, 72, 331–341. [Google Scholar] [CrossRef]
- Imposa, S.; Grassi, S.; De Guidi, G.; Battaglia, F.; Lanaia, G.; Scudero, S. 3D subsoil model of the San Biagio ‘Salinelle’ mud volcanoes (Belpasso, SICILY) derived from geophysical surveys. Surv. Geophys. 2016, 37, 1117–1138. [Google Scholar] [CrossRef]
- Imposa, S.; Grassi, S.; Fazio, F.; Rannisi, G.; Cino, P. Geophysical surveys to study a landslide body (north-eastern Sicily). Nat. Hazards 2017, 86, S327–S343. [Google Scholar] [CrossRef]
- Panzera, F.; Lombardo, G.; Rigano, R. Evidence of topographic effects through the analysis of ambient noise measurements. Seismol. Res. Lett. 2011, 82, 413–419. [Google Scholar] [CrossRef]
- Panzera, F.; Lombardo, G.; Monaco, C. New evidence of wavefield polarization on fault zone in the lower NE slope of Mt. Etna. Ital. J. Geosci. 2016, 135, 250–260. [Google Scholar] [CrossRef]
- Burjànek, J.; Moore, J.R.; Molina, F.X.Y.; Fäh, D. Instrumental evidence of normal mode rock slope vibration. Geophys. J. Int. 2012, 188, 559–569. [Google Scholar] [CrossRef]
- Imposa, S.; Barone, F.; Chiavetta, F.; Coco, G.; Corrao, M.; Chisari, D. A preliminary study of the subsoil of the Roman Amphitheatre of Catania (Sicily) through integrated geophysical and stratigraphic data. Il Nuovo Cimento C. 2007, 30, 577–586. [Google Scholar]
- Imposa, S.; Motta, E.; Capilleri, P.; Imposa, G. HVSR and MASW seismic survey for characterizing the local seismic response: A case study in Catania area (Italy). In Proceedings of the 1st IMEKO TC-4 International Workshop on Metrology for Geotechnics, Benevento, Italy, 17–18 March 2016; IMEKO-International Measurement Federation Secretariat: Budapest, Hungary, 2016; Volume 1, pp. 97–102. ISBN 978-929900750-1. [Google Scholar]
- Castellaro, S.; Imposa, S.; Barone, F.; Chiavetta, F.; Gresta, S.; Mulargia, F. Georadar and Passive Seismic Survey in the Roman Amphitheatre of Catania (Sicily). J. Cult. Herit. 2008, 9, 357–366. [Google Scholar] [CrossRef]
- Eurocode 8 Design of Structures for Earthquake Resistance—Part 1: General Rules, Seismic Actions and Rules for Buildings; European Committee for Standardization (CEN), EN 1998-1; CEN: Brussels, Belgium, 2004; Available online: www.eurocodes.jrc.eceuropa.eu/ (accessed on 6 November 2017).
- Trifunac, M.D. Comparison between ambient and forced vibration experiments. Earthq. Eng. Struct. Dyn. 1972, 1, 133–150. [Google Scholar] [CrossRef]
- Di Tommaso, R.; Parolai, S.; Mucciarelli, M.; Eggert, S.; Sobiesiak, M.; Zschau, J. Monitoring the response and the back-radiated energy of a building subjected to ambient vibration and impulsive action: The Falkenhof Tower (Potsdam, Germany). Bull. Earthq. Eng. 2010, 8, 705–722. [Google Scholar] [CrossRef]
- Michel, C.; Guéguen, P. Time–frequency analysis of small frequency variations in civil engineering structures under weak and strong motions using a reassignment method. Struct. Health Monit. 2010, 9, 159–171. [Google Scholar] [CrossRef]
- Todorovska, M.I. Soil-structure system identification of millikan library north–south response during four earthquakes (1970–2002): What caused the observed wandering of the system frequencies? Bull. Seismol. Soc. Am. 2009, 99, 626–635. [Google Scholar] [CrossRef]
- Gallipoli, M.R.; Mucciarelli, M.; Vona, M. Empirical estimate of fundamental frequencies and damping for Italian buildings. Earthq. Eng. Struct. Dyn. 2009, 38, 973–988. [Google Scholar] [CrossRef]
- Panzera, F.; D’amico, S.; Lombardo, G.; Longo, E. Evaluation of building fundamental periods and effects of local geology on ground motion parameters in the Siracusa area, Italy. J. Seismol. 2016, 20, 1001–1019. [Google Scholar] [CrossRef]
- Celebi, M. Comparison of damping in buildings under low-amplitude and strong motions. J. Wind Eng. Ind. Aerodyn. 1996, 59, 309–323. [Google Scholar] [CrossRef]
- Trifunac, M.D.; Todorovska, M.I.; Manić, M.I.; Bulajić, B.Đ. Variability of the fixed-base and soil-structure system frequencies of a building—The case of Borik-2 building. Struct. Control Health Monit. 2010, 17, 120–151. [Google Scholar] [CrossRef]
- Mucciarelli, M.; Gallipoli, M.R.; Ponzo, C.F.; Dolce, M. Seismic waves generated by oscillating building. Soil Dyn. Earthq. Eng. 2003, 23, 255–262. [Google Scholar] [CrossRef]
- Cornou, C.; Guéguen, P.; Bard, P.-Y.; Haghshenas, E. Ambient noise energy bursts observation and modeling: Trapping of harmonic structure-soil induced–waves in a topmost sedimentary layer. J. Seismol. 2004, 8, 507–524. [Google Scholar] [CrossRef][Green Version]
- Gallipoli, M.R.; Mucciarelli, M.; Ponzo, F.; Dolce, M.; D’Alema, E.; Maistrello, M. Buildings as a Seismic Source: Analysis of a Release Test at Bagnoli, Italy. Bull. Seismol. Soc. Am. 2006, 96, 2457–2464. [Google Scholar] [CrossRef]
- Azzaro, R.; Barbano, M.S. Analysis of seismicity of Southeastern Sicily: Proposal of a tectonic interpretation. Ann. Geofis. 2000, 43, 1–18. [Google Scholar]
- Panzera, F.; Lombardo, G.; Rigano, R. Use of different approaches to estimate seismic hazard: The study cases of Catania and Siracusa, Italy. Bollettino di Geofisica Teorica e Applicata 2011, 52, 687–706. [Google Scholar]
- Locati, M.; Camassi, R.; Rovida, A.; Ercolani, E.; Bernardini, F.; Castelli, V.; Caracciolo, C.H.; Tertulliani, A.; Rossi, A.; Azzaro, R.; et al. DBMI15, the 2015 Version of the Italian Macroseismic Database; Istituto Nazionale di Geofisica e Vulcanologia: Rome, Italy, 2016. [Google Scholar] [CrossRef]
- Rovida, A.; Locati, M.; Camassi, R.; Lolli, B.; Gasperini, P. CPTI15, the 2015 Version of the Parametric Catalogue of Italian Earthquakes; Istituto Nazionale di Geofisica e Vulcanologia: Roma, Italy, 2016. [Google Scholar]
- Binda, L.; Saisi, A. Non Destructive Testing Applied to Historic Buildings: The Case of Some Sicilian Churches. Available online: http://www.csarmento.uminho.pt/docs/ncr/historical_constructions/page%2029-46%20_Binda_.pdf (accessed on 10 December 2017).
- Saisi, A.; Binda, L.; Zanzi, L. Diagnostic investigation of the stone pillars of S. Nicolò l’Arena, Catania. In Proceedings of the 9th Canadian Masonry Symposium “Spanning the Centuries with Masonry”, Fredericton, NB, Canada, 4–6 June 2001. [CD-ROM]. [Google Scholar]
- Monaco, C.; Catalano, S.; De Guidi, G.; Gresta, S.; Langer, H.; Tortorici, L. The geological map of the urban area of Catania (Eastern Sicily): Morphotectonic and seismotectonic implications. Mem. Soc. Geol. Ital. 2000, 55, 425–438. [Google Scholar]
- Lombardo, G.; Coco, G.; Corrao, M.; Imposa, S.; Azzara, R.; Cara, F.; Rovelli, A. Results of microtremor measurements in the urban area of Catania (Italy). Bollettino di Geofisica Teorica e Applicata 2001, 42, 317–334. [Google Scholar]
- Panzera, F.; Lombardo, G.; Monaco, C.; Di Stefano, A. Seismic site effects observed on sediments and basaltic lavas outcropping in a test site of Catania, Italy. Nat. Hazards 2015, 79, 1–27. [Google Scholar] [CrossRef]
- UniCT Seismic Microzonation Working Group. Microzonazione sismica (MS) di Livello 1. D.D.G. n. 219 del 08/07/2014. Available online: http://sit.protezionecivilesicilia.it/ (accessed on 6 November 2017).
- Grasso, S.; Massimino, M.R.; Maugeri, M. Evaluation of a design spectrum at Saint Nicola alla Rena Church in Catania (Italy). In Proceedings of the 13th World Conference on Earthquake Engineering, Vancouver, BC, Canada, 1–6 August 2004; Paper No. 1432. 13WCEE: Vancouver, BC, Canada, 2004. [Google Scholar]
- Konno, K.; Ohmachi, T. Ground-motion characteristics estimated from spectral ratio between horizontal and vertical components of microtremor. Bull. Seismol. Soc. Am. 1998, 88, 228–241. [Google Scholar]
- Snieder, R.; Safak, E. Extracting the building response using seismic interferometry: Theory and application to the Millikan Library in Pasadena, California. Bull. Seismol. Soc. Am. 2006, 96, 586–598. [Google Scholar] [CrossRef]
- Castellaro, S.; Mulargia, F. How far from a building does the ground motion free field start? The cases of three famous towers and of a modern building. Bull. Seismol. Soc. Am. 2010, 100, 2080–2094. [Google Scholar] [CrossRef]
- SESAME Guidelines for the Implementation of the H/V Spectral Ratio Technique on Ambient Vibrations: Measurements, Processing and Interpretation. SESAME European Research Project WP12, Deliverable D23.12 2004. Available online: http://sesame.geopsy.org/SES_Reports.htm (accessed on 6 November 2017).
- Di Giacomo, D.; Gallipoli, M.R.; Mucciarelli, M.; Parolai, S.; Richwalski, S.M. Analysis and modeling of HVSR in the presence of a velocity inversion: The case of Venosa, Italy. Bull. Seismol. Soc. Am. 2005, 95, 2364–2372. [Google Scholar] [CrossRef]
- Castellaro, S.; Mulargia, F. The Effect of Velocity Inversions on H/V. Pure Appl. Geophys. 2009, 166, 567–592. [Google Scholar] [CrossRef]
- Panzera, F.; Lombardo, G.; Muzzetta, I. Evaluation of building dynamic properties through in-situ experimental techniques and 1D modelling: The example of Catania, Italy. Phys. Chem. Earth 2013, 63, 136–146. [Google Scholar] [CrossRef]
- Cole, H.A. On-Line Failure Detection and Damping Measurement of Aerospace Structures by Random Decrement Signatures; NASA CR-2205; NASA: Washington, DC, USA, 1973.
- Dunand, F.; Bard, P.-Y.; Chatelain, J.L.; Gueguen, P.; Vassail, T.; Farsi, M.N. Damping and frequency from randomec method applied to in-situ measurements of ambient vibrations: Evidence for effective soil structure interaction. In Proceedings of the 12th European Conference on Earthquake Engineering, London, UK, 9–13 September 2002; Paper No. 868; Elsevier Science Ltd.: Amsterdam, The Netherlands, 2002. [Google Scholar]
- Tamura, Y. Amplitude dependency of damping in buildings and critical tip drift ratio. Int. J. High-Rise Build. 2012, 1, 1–13. [Google Scholar]
- Kareem, A.; Gurley, K. Damping in structures: Its evaluation and treatment of uncertainty. J. Wind Eng. Ind. Aerodyn. 1996, 59, 131–157. [Google Scholar] [CrossRef]
- Salameh, C.; Guillier, B.; Harb, J.; Cornou, C.; Bard, P.-Y.; Voisin, C.; Mariscal, A. Seismic response of Beirut (Lebanon) buildings: Instrumental results from ambient vibrations. Bull. Earthq. Eng. 2016, 14, 2705–2730. [Google Scholar] [CrossRef]
- Mucciarelli, M. Reliability and applicability of Nakamura’s technique using microtremors: An experimental approach. J. Earthq. Eng. 1998, 2, 625–638. [Google Scholar] [CrossRef]
- Panzera, F.; Rigano, R.; Lombardo, G.; Cara, F.; Di Giulio, G.; Rovelli, A. The role of alternating outcrops of sediments and basaltic lavas on seismic urban scenario: The study case of Catania, Italy. Bull. Earthq. Eng. 2011, 9, 411–439. [Google Scholar] [CrossRef]
- Assimaki, D.; Kausel, E. An Equivalent Linear Algorithm with Frequency-and-Pressure-Dependent Moduli and Damping for Seismic Analysis of Deep Sites. Soil Dyn. Earthq. Eng. 2002, 22, 959–965. [Google Scholar] [CrossRef]
- Faccioli, E.; Pessina, V. The Catania Project: Earthquake Damage Scenarios for High Risk Area in the Mediterranean; CNR—Gruppo Nazionale per la Difesa Terremoti: Rome, Italy, 2000; p. 225. [Google Scholar]
- Carrubba, P.; Maugeri, M. Determinazione delle proprietà dinamiche di un’argilla mediante prove di colonna risonante. Rivista Italiana di Geotecnica 1988, 22, 101–113. [Google Scholar]
- Cavallaro, A.; Grasso, S.; Maugeri, M. A dynamic geothechnical characterization of soil at Saint Nicola alla Rena Church damaged by South Eastern Sicily Earthquake of 13 December 1990. In Proceedings of the 15th International Conference on Soil Mechanics and Geotechnical Engineering, Satellite Conference “Lessons Learned from Recent Strong Earthquake, Istanbul, Turkey, 25 August 2001; pp. 243–248. [Google Scholar]
- Seed, H.B.; Idriss, I.M. Soil Moduli and Damping Factors for Dynamic Response Analyses; Report No. EERC-70-10; University of California: Berkeley, CA, USA, 1970. [Google Scholar]
- Bessason, B.; Kaynia, A.M. Site amplification in lava rock on soft sediments. Soil Dyn. Earthq. Eng. 2002, 22, 525–540. [Google Scholar] [CrossRef]
- Cauzzi, C.; Faccioli, E.; Vanini, M.; Bianchini, A. Updated predictive equations for broadband (0.01–10 s) horizontal response spectra and peak ground motions, based on a global dataset of digital acceleration records. Bull. Earthq. Eng. 2015, 13, 1587–1612. [Google Scholar] [CrossRef]
- Luzi, L.; Puglia, R.; Russo, E.; ORFEUS WG5. Engineering Strong Motion Database, version 1.0; Istituto Nazionale di Geofisica e Vulcanologia, Observatories & Research Facilities for European Seismology: Rome, Italy, 2016. [Google Scholar] [CrossRef]
- Iervolino, I.; Galasso, C.; Cosenza, E. REXEL: Computer aided record selection for code-based seismic structural analysis. Bull. Earthq. Eng. 2010, 8, 339–362. [Google Scholar] [CrossRef]
- Locati, M.; Gomez Capera, A.; Puglia, R.; Santulin, M. Rosetta, a tool for linking accelerometric recordings and macroseismic observations: Description and applications. Bull. Earthq. Eng. 2017, 15, 2429–2443. [Google Scholar] [CrossRef]
- Valente, G.; Zigone, G. Methodology and techniques for seismic protection of the monumental patrimony. In Seismic Prevention of Damage a Case Study in Mediterranean City; Maugeri, M., Ed.; WIT Press: Southampton, UK, 2005; pp. 313–332. [Google Scholar]


© 2018 by the authors. Licensee MDPI, Basel, Switzerland. This article is an open access article distributed under the terms and conditions of the Creative Commons Attribution (CC BY) license (http://creativecommons.org/licenses/by/4.0/).