Article

Influence of Load Frequency on Cohesive Soil Respond

1
Water Centre-Laboratory, Faculty of Civil and Environmental Engineering, Warsaw University of Life Sciences-SGGW, 02-787 Warsaw, Poland
2
Department of Geotechnical Engineering, Faculty of Civil and Environmental Engineering, Warsaw University of Life Sciences-SGGW, 02-787 Warsaw, Poland
*
Author to whom correspondence should be addressed.
Geosciences 2018, 8(12), 468; https://doi.org/10.3390/geosciences8120468
Submission received: 21 September 2018 / Revised: 23 November 2018 / Accepted: 3 December 2018 / Published: 10 December 2018

Abstract

:
The mechanism of cohesive soils response to cycling loading is less investigated compared to cohesionless soils. Multiple load-unload cycles cause significant changes in the structure of cohesive soils, which result in complex behaviour under the given load. The aim of the paper was to investigate and study the influence of load frequency on cohesive soil reaction. In order to obtain results, tests were conducted using the cyclic triaxial apparatus. Three cyclic tests were carried out, each for different frequency −0.5 Hz, 1.0 Hz, 2.0 Hz and one static triaxial test. The maximal value of deviator stress qmax, used in the cyclic tests, was set to 40 kPa. Afterwards samples were unloaded to qmin = 30 kPa. Cyclic loading triaxial tests were performed in a consolidated-undrained (CU) one-way loading manner, a sinusoidal waves were used. After the cycling loading was completed, a static triaxial shear test was conducted. Changes in the cohesive soil responses depending on cycling load frequency were presented in the paper. Differences in the accumulation of plastic strains were noticed, as well as changes of degradation index values, resilient degradation index values and differences in the excess pore water pressure development.

1. Introduction

Analysis of the influence of cyclic load acting on a soil is a common geotechnical problem nowadays. The increasing economy creates the demand for a new transportation network. In the last decades, the repeating loading problem was limited to the issue which includes the studies on dynamic load bearing capacity of foundations, the reaction of machine foundations subjected to dynamic loads, the interaction between soil and surrounding constructions loaded by earthquake-generated seismic waves and the strength of dams and embankments during an earthquake [1,2,3]. Most of the technical design standards do not include the rules concerning the behaviour of cohesive soils subjected to cyclic load [4]. Multiple load-unload cycles cause significant changes in soil structure, which affects its behaviour [5,6]. The most unpleasant occurrence of cyclic loading impact on soil subgrade is long-term settlement [7,8]. Natural sources (water waves, earthquakes, storms, etc.) and human activity (machinery vibration, wind power plants, construction operations, traffic loads and many others) are known to be the sources of this particular type of load. Proper identification of load characteristics has a special importance when reconstructing the load conditions in the laboratory [8].
In this paper, the attention is focused on so-called ‘quasi-static’ loadings. This term describes the repeating loading in which the inertia forces are not considered or are negligible. The conditions of quasi-static loading must not exceed a certain value of frequency and amplitude. The quasi-static loading occurs when the acceleration of the loaded soil particles is significantly lower than the gravitational acceleration [9].
The behaviour of cohesive soils subjected to the cyclic load has not been sufficiently recognized and described [10,11,12]. So far, focus of the researches starts to turn on the problem of cohesive soils under cyclic loads, when compared to non-cohesive soils, for which the literature is known to be more extensive [13,14,15,16,17,18]. Due to its nature, the cohesive soil may be subjected to many load-unload cycles before the destruction of soil occurs [19,20]. However, in cohesionless soils, less resistance to cyclic loads is observed, which may lead to liquefaction of the soil [21,22].
One of the interesting topics in the subject of cohesive soils cyclic loading is cyclical degradation of clays. This particular subject has been studied by Idriss et al. and others for over 40 years [19,20,23,24,25,26]. The cyclic degradation is an important problem since the results of this type of loading can be dangerous for human life. One of the examples was given by Yamanouchi and Yasuhara [27] where the case history of highway embankment was presented. The embankment was founded on soft cohesive soil, namely alluvial Ariake Clay and the subgrade exhibited large settlement after being opened do traffic. The settlement was equal to nearly 2 m and was observed on the length of 1700 m. The soft soil term in this article refers to a clayey soils with high plasticity and low stiffness which is caused usually by high water content.
The cohesive soil respond to cyclic loading depends on many factors, among which most important are confining pressure, void ratio, strain amplitude, temperature, overconsolidation ratio and anisotropic stress [28]. What is more, the plasticity index and permeability of cohesive soils, which may lead undrained conditions, have a significant impact.
One of the factors that has been given less attention is frequency of loading. The triaxial tests, which were conducted on cohesive soils, led so far to a few conclusions. Generally, there exists the impact of the loading frequency on soil respond. Nevertheless, this impact tends to vanish with the number of cycles. The same effect was observed in case of deviator stress amplitude. Another interesting conclusion concerning frequency impact is when the soil is loaded at lower frequencies, the sample maintain higher cyclic strength. What is more, the tests have shown that the lower frequency is applied the larger shear strains are accumulated and the larger pore pressure is generated [25,28,29,30,31,32].
The cyclic triaxial tests performed by Lei et al. [20] on Tianjin Binhai clay covered investigation on the frequency and cyclic stress ratio impact on the creep behaviour of soil subjected to cyclic loading. The results of the tests lead to the conclusion that cyclic loads produce greater compaction than static loads and the Tianjin Binhai clay creeps more under the repeating loading compared to static constant stress. The analysis of frequency impact has shown a presence of a specific frequency and a safe load under which, the strain of the soft clay increases very slowly. It was found that greater frequency produces more rapid soil failure.
This paper presents results of cyclic triaxial tests where impact of cyclic loading on cohesive soil response was studied. The objective of this study was to investigate the frequency impact on the strength degradation of cohesive soil samples. The primary goal was to determine the cohesive soil responses to repeating loading in terms of deformation which was described by Idriss [26] conception of degradation modulus. The secondary goal was to determine how ultimate strength after cyclic loading in different frequencies is changing. The knowledge about these effects is important for evaluation of cohesive soils strength properties for analyses of the cyclic responses of the soil deposits.

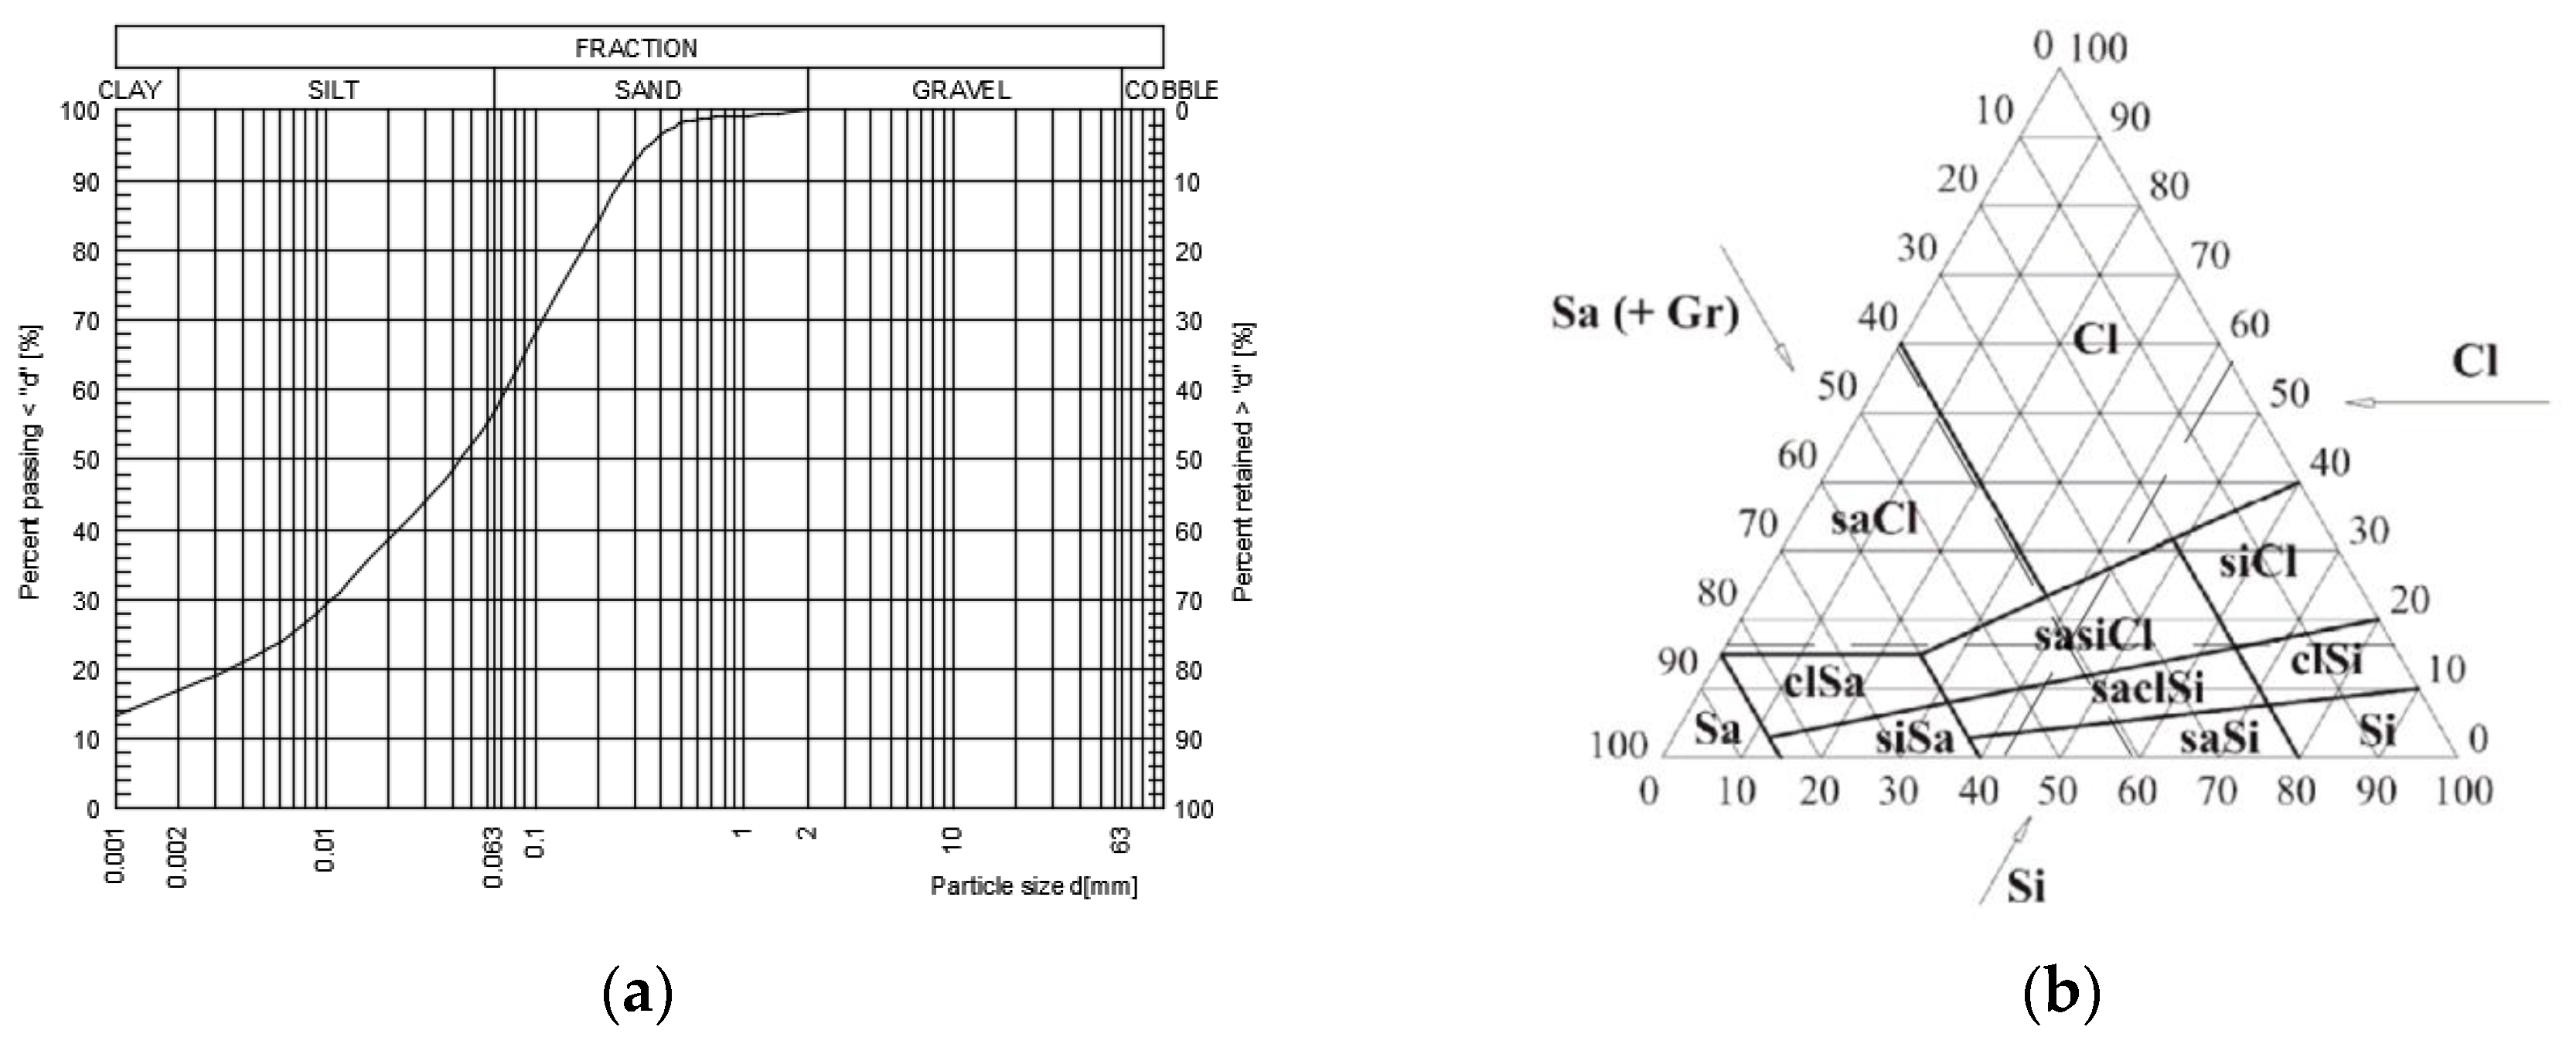
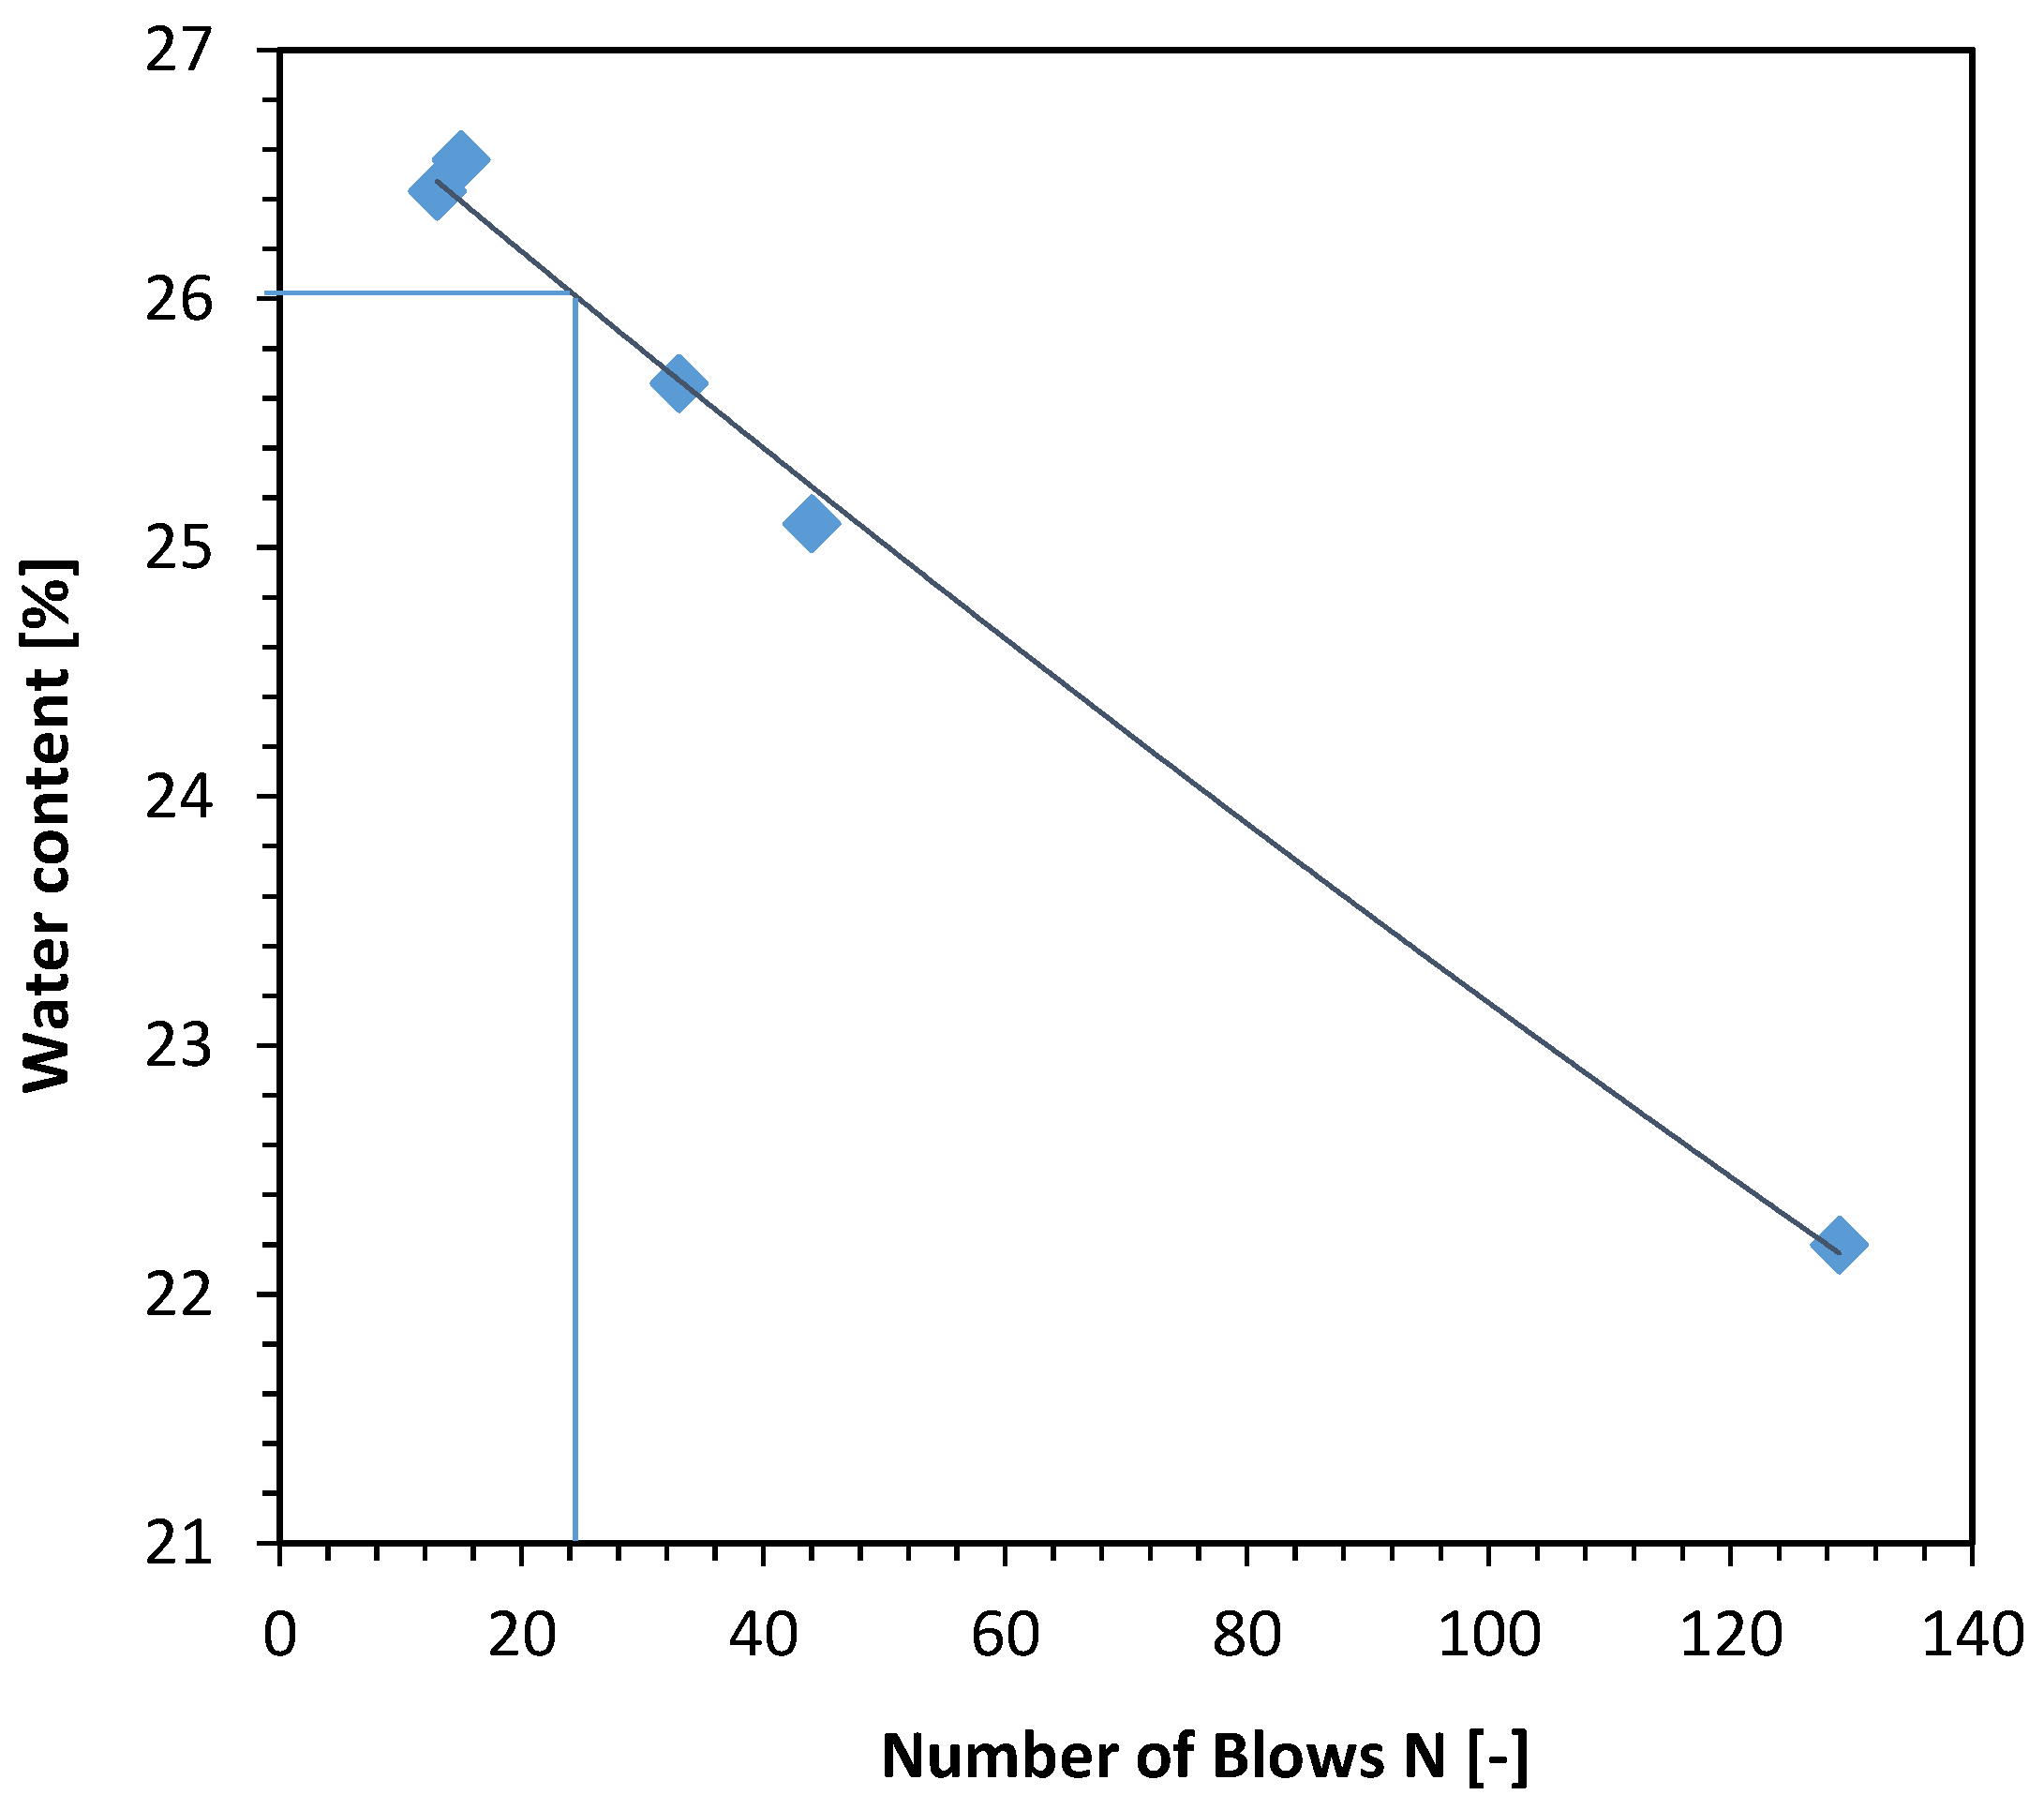
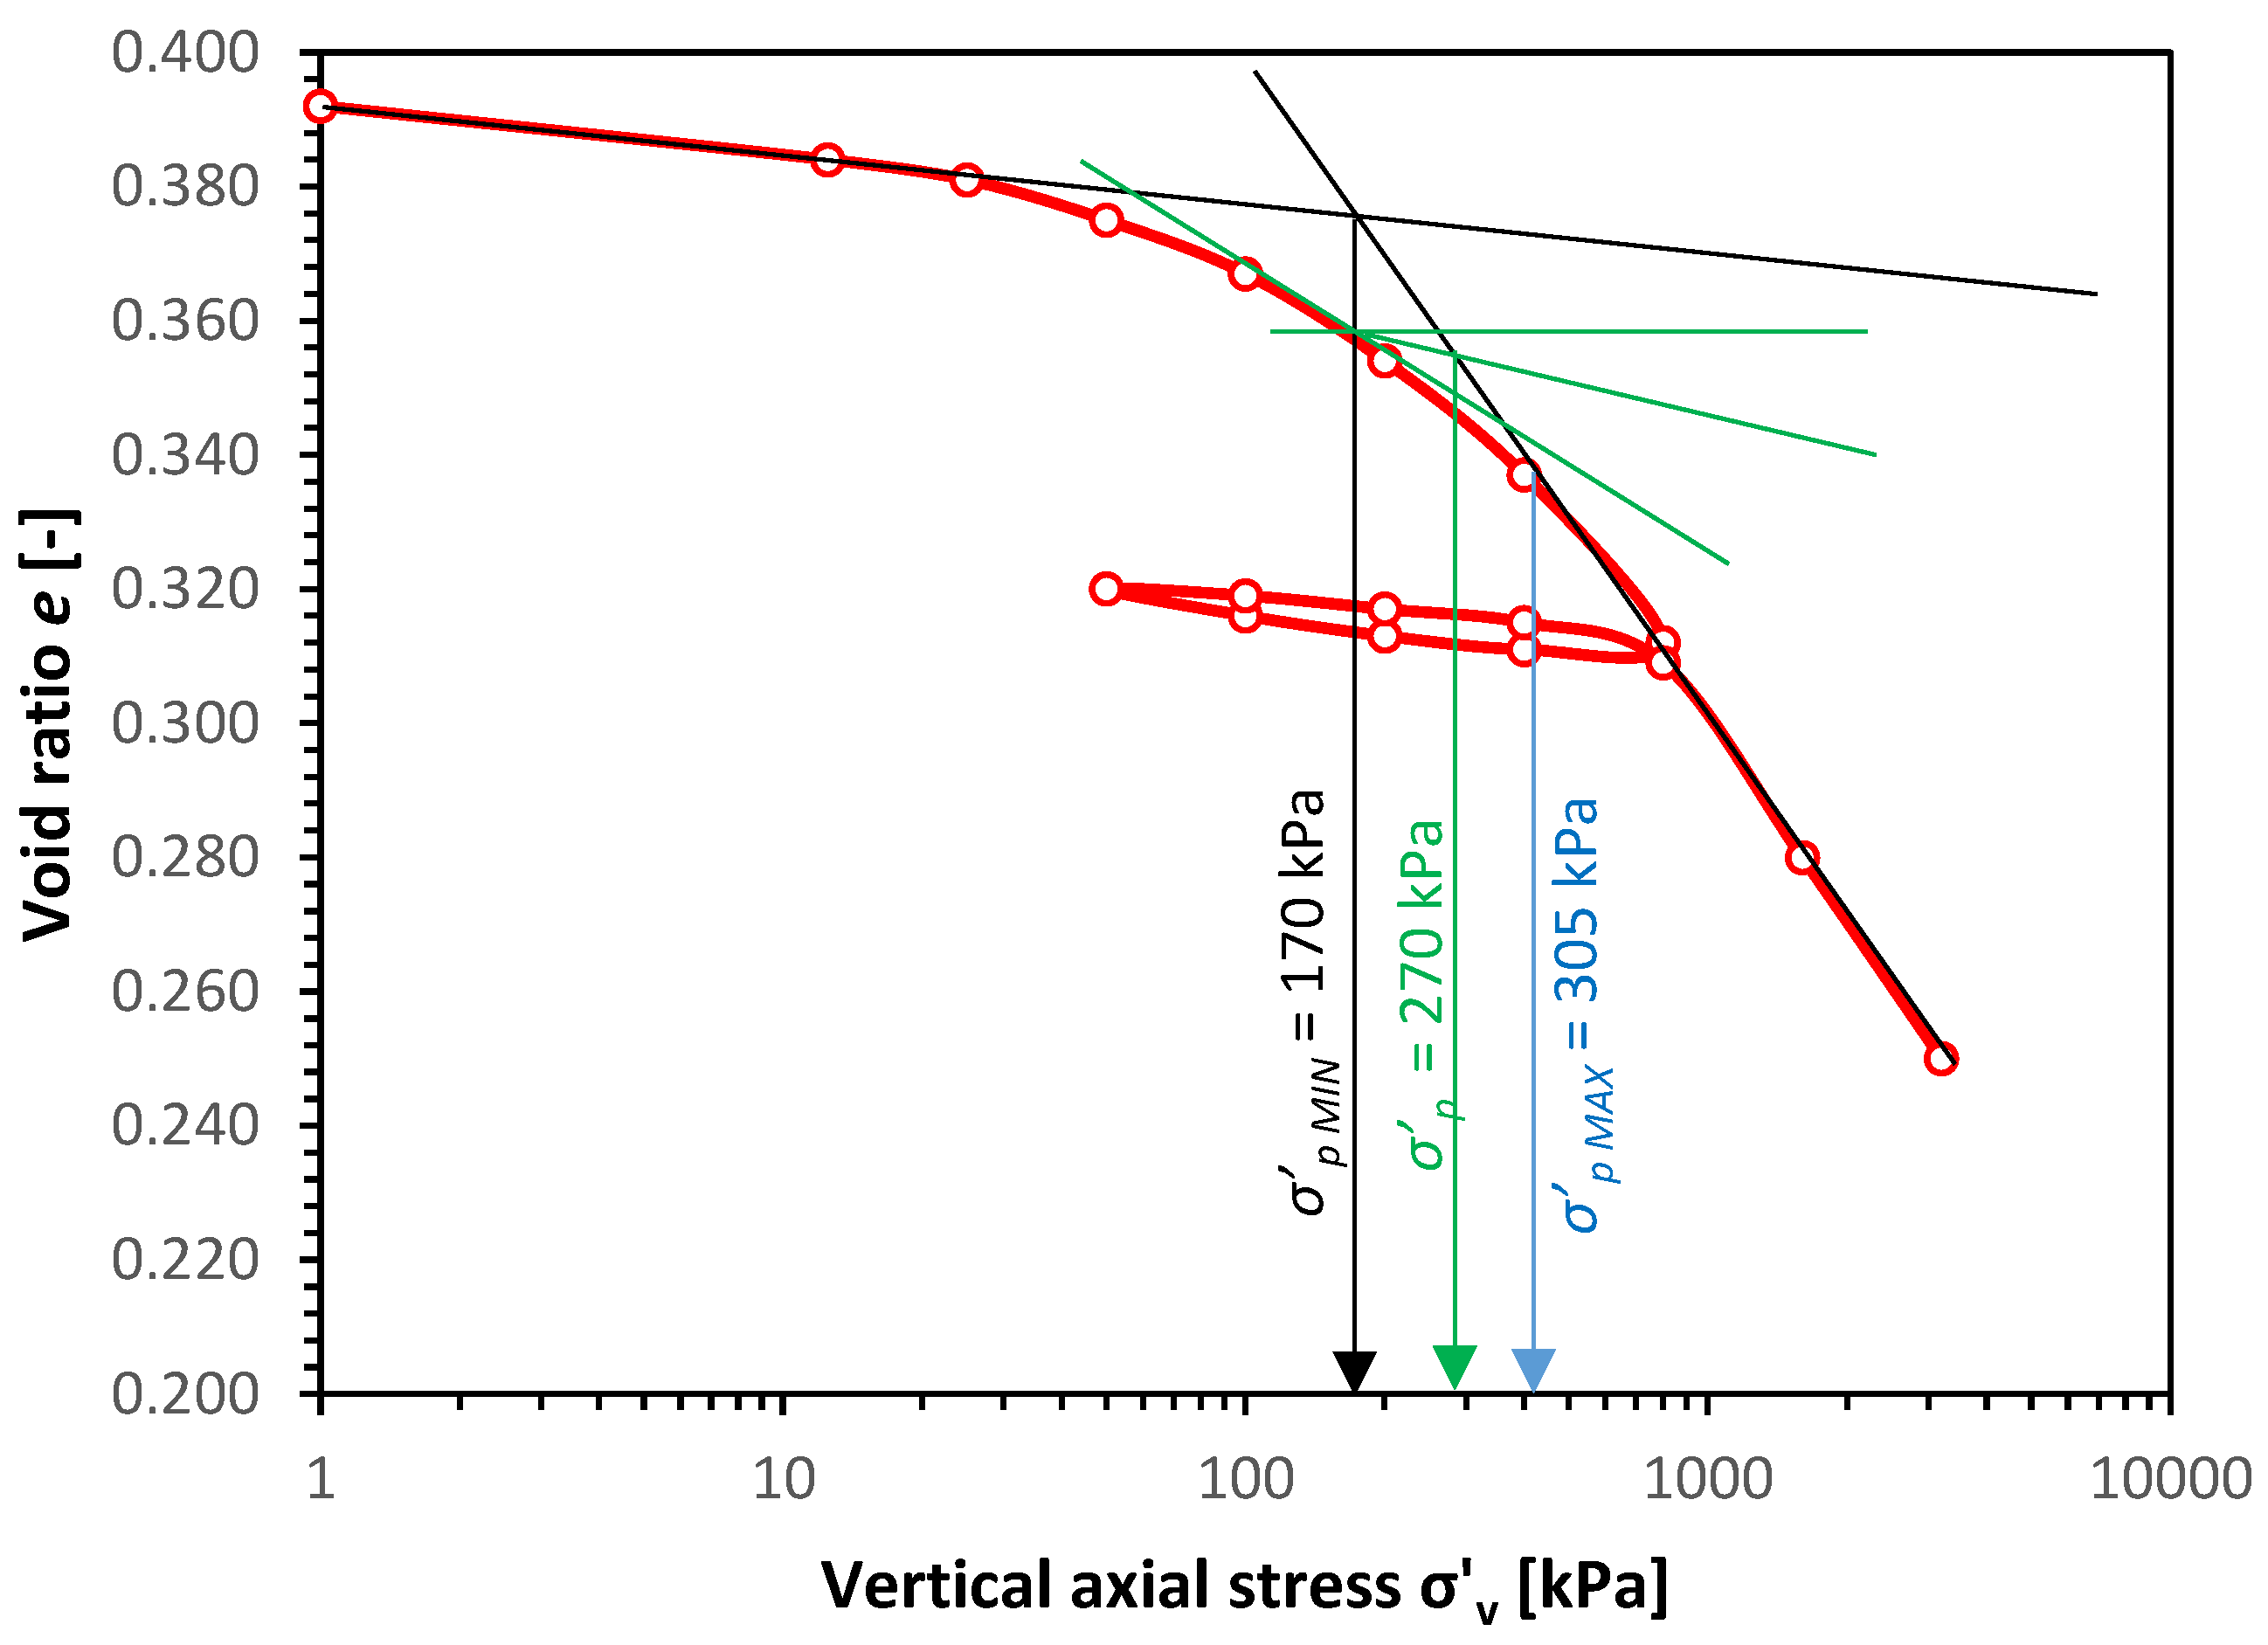
2. Material Characterization

The soil specimens used in this article were cohesive soils taken from the road construction project sites in Warsaw, Poland. The cohesive soil was deposited in a glacial erosion conditions. To characterize the sample, a number of test were conducted that have been described below.
In order to determine granular composition, the aerometric method was applied. Based on granular structure, determined by the aerometric method, the soil was classified as sasiCl (sandy silty clay, according to PN-EN ISO 14688:2006 [33] standard, based on international standards). The results of the gradation analysis tests are presented Figure 1.
In the next step, the Atterberg limits were examined. Plastic limit was determined by rolling a portion of soil into a ball with 7 mm diameter. Afterwards, sample should be rolled into a thread with 3 mm diameter. When cracks were observed, sample’s weight was tested and then sample was dried in 105 °C for 24 h to determine moisture content. Examined soil sample’s plastic limit (PL) equals 13.71%. Liquid limit (LL) was examined using Casagrande cup and equals around 26.0% (Figure 2). The plasticity index (PI) of this soil is equal to 12.29%.
Optimal moisture content and maximum dry intensity was defined in the Proctor compaction test, which has been chosen due to typical engineering application preservation. Nine samples were prepared and examined with different moisture content. Compaction in this particular test requires 0.59 J of energy to be transferred to 1.0 cm3 of soil specimen. In order to prepare a proper sample for triaxial test, a part of soil was compacted in 5 layers, each blown 40 times with a compactor. The optimum moisture content equals around 11.6%, while maximum dry density is equal to 1.97 g/cm3. The results of Proctor test are presented on Figure 3.
The oedometric test was also conducted in order to find the yield stress. The results presents Figure 4. Based on Casagrante’s method, the yield stress or pre-consolidation stress σ’p was estimated. Three points were specified namely the minimum pre-consolidation stress σ’pMIN, the maximum pre-consolidation stress σ’pMAX and σ’p. Such procedure is important since the compacted soils have the pre-consolidation stress but the exact value is hard to find. The value of σ’pMIN is equal to 170 kPa, the value of σ’p = 270 kPa and the value of σ’p MAX is equal to 305 kPa. The conclusion can be drown, that the compacted cohesive soil in optimal moisture content with respect to Proctor’s method have pre-consolidation stress and therefore, the soil tested in this article in σ’3 = 45 kPa conditions is in pre-consolidated state.

3. Triaxial Test Procedure

The tests were conducted in a cyclic triaxial apparatus for which soil specimens are required to have diameter equal 7 cm and height of 14 cm. The soil samples were preliminary compacted with respect to the Proctor method with energy of compaction equal to 0.59 J/cm3. Investigations were carried out with the samples fully saturated (measurement was concluded to guarantee that the degree of saturation was greater than 97% for all specimens). This type of compacted cohesive soil is different from the soils tested in previous works concerning soft soils. High density, low void ratio and low moisture content characterizes rather strong cohesive soils.
After the saturation stage was completed, specimens were subjected to isotropic effective confining pressure of 45 kPa, which led to specimen’s consolidation. Table 1 presents the physical properties of soil the samples.
The first step of the test was cyclic triaxial test. The maximal value of deviator stress qmax was set to 40 kPa, afterwards samples were unloaded to qmin = 30 kPa. Cyclic loading triaxial tests were performed in a consolidated-undrained (CU) one-way loading manner, a sinusoidal waves were used (average deviator stress qm was equal to around 35 kPa and deviator stress amplitude qa was equal to around 5 kPa). The load acting on a soil was applied in a vertical direction. To determine, whether the frequency of cyclic load affects the cohesive soil reaction, tests were conducted under three frequency conditions: f = 0.5 Hz, f = 1.0 Hz and f = 2.0 Hz. The number of cycles each time was N = 20,000. During the test the initial σ’3 was equal to 45 kPa. The value of σ’3 was set based on the test results concerning horizontal stress responses of subgrade subjected to one passage of two-axle truck. The 70 cm wheel caused in this case 690 kPa. The horizontal pressure in all three cases of the test was less than 45 kPa at the distance 300 cm from pavement edge and between 40 and 60 kPa 100 cm from the pavement edge [34]. Based on this tests results we decided to set the σ’3 value to constant 45 kPa.
The frequencies which were used for this study, are typical for common frequencies observed in human environment and in nature. For example, the typical frequencies observed in soils surrounding metro train tunnels are between 0.5 to 30 Hz.
The second step was static triaxial test which was conducted immediately after cyclic triaxial loading step. For this step additional static triaxial test was conducted in order to provide a comparison of obtained post-cyclic static test results and for calculation of cyclic stress ratio.
The strain measurements was performed with use of highly precise (1 × 10⁻⁴%) electro-mechanical actuator mounted to the loading beam.

4. The Results and Discussion

The triaxial test results analysis are divided into two subsections which covers cyclic behaviour of compacted sandy silty clay, the response to cyclic loading and the post-cyclic behaviour. This division will help to describe more precisely the impact of load frequency on cohesive soil strength and deformation characteristics.

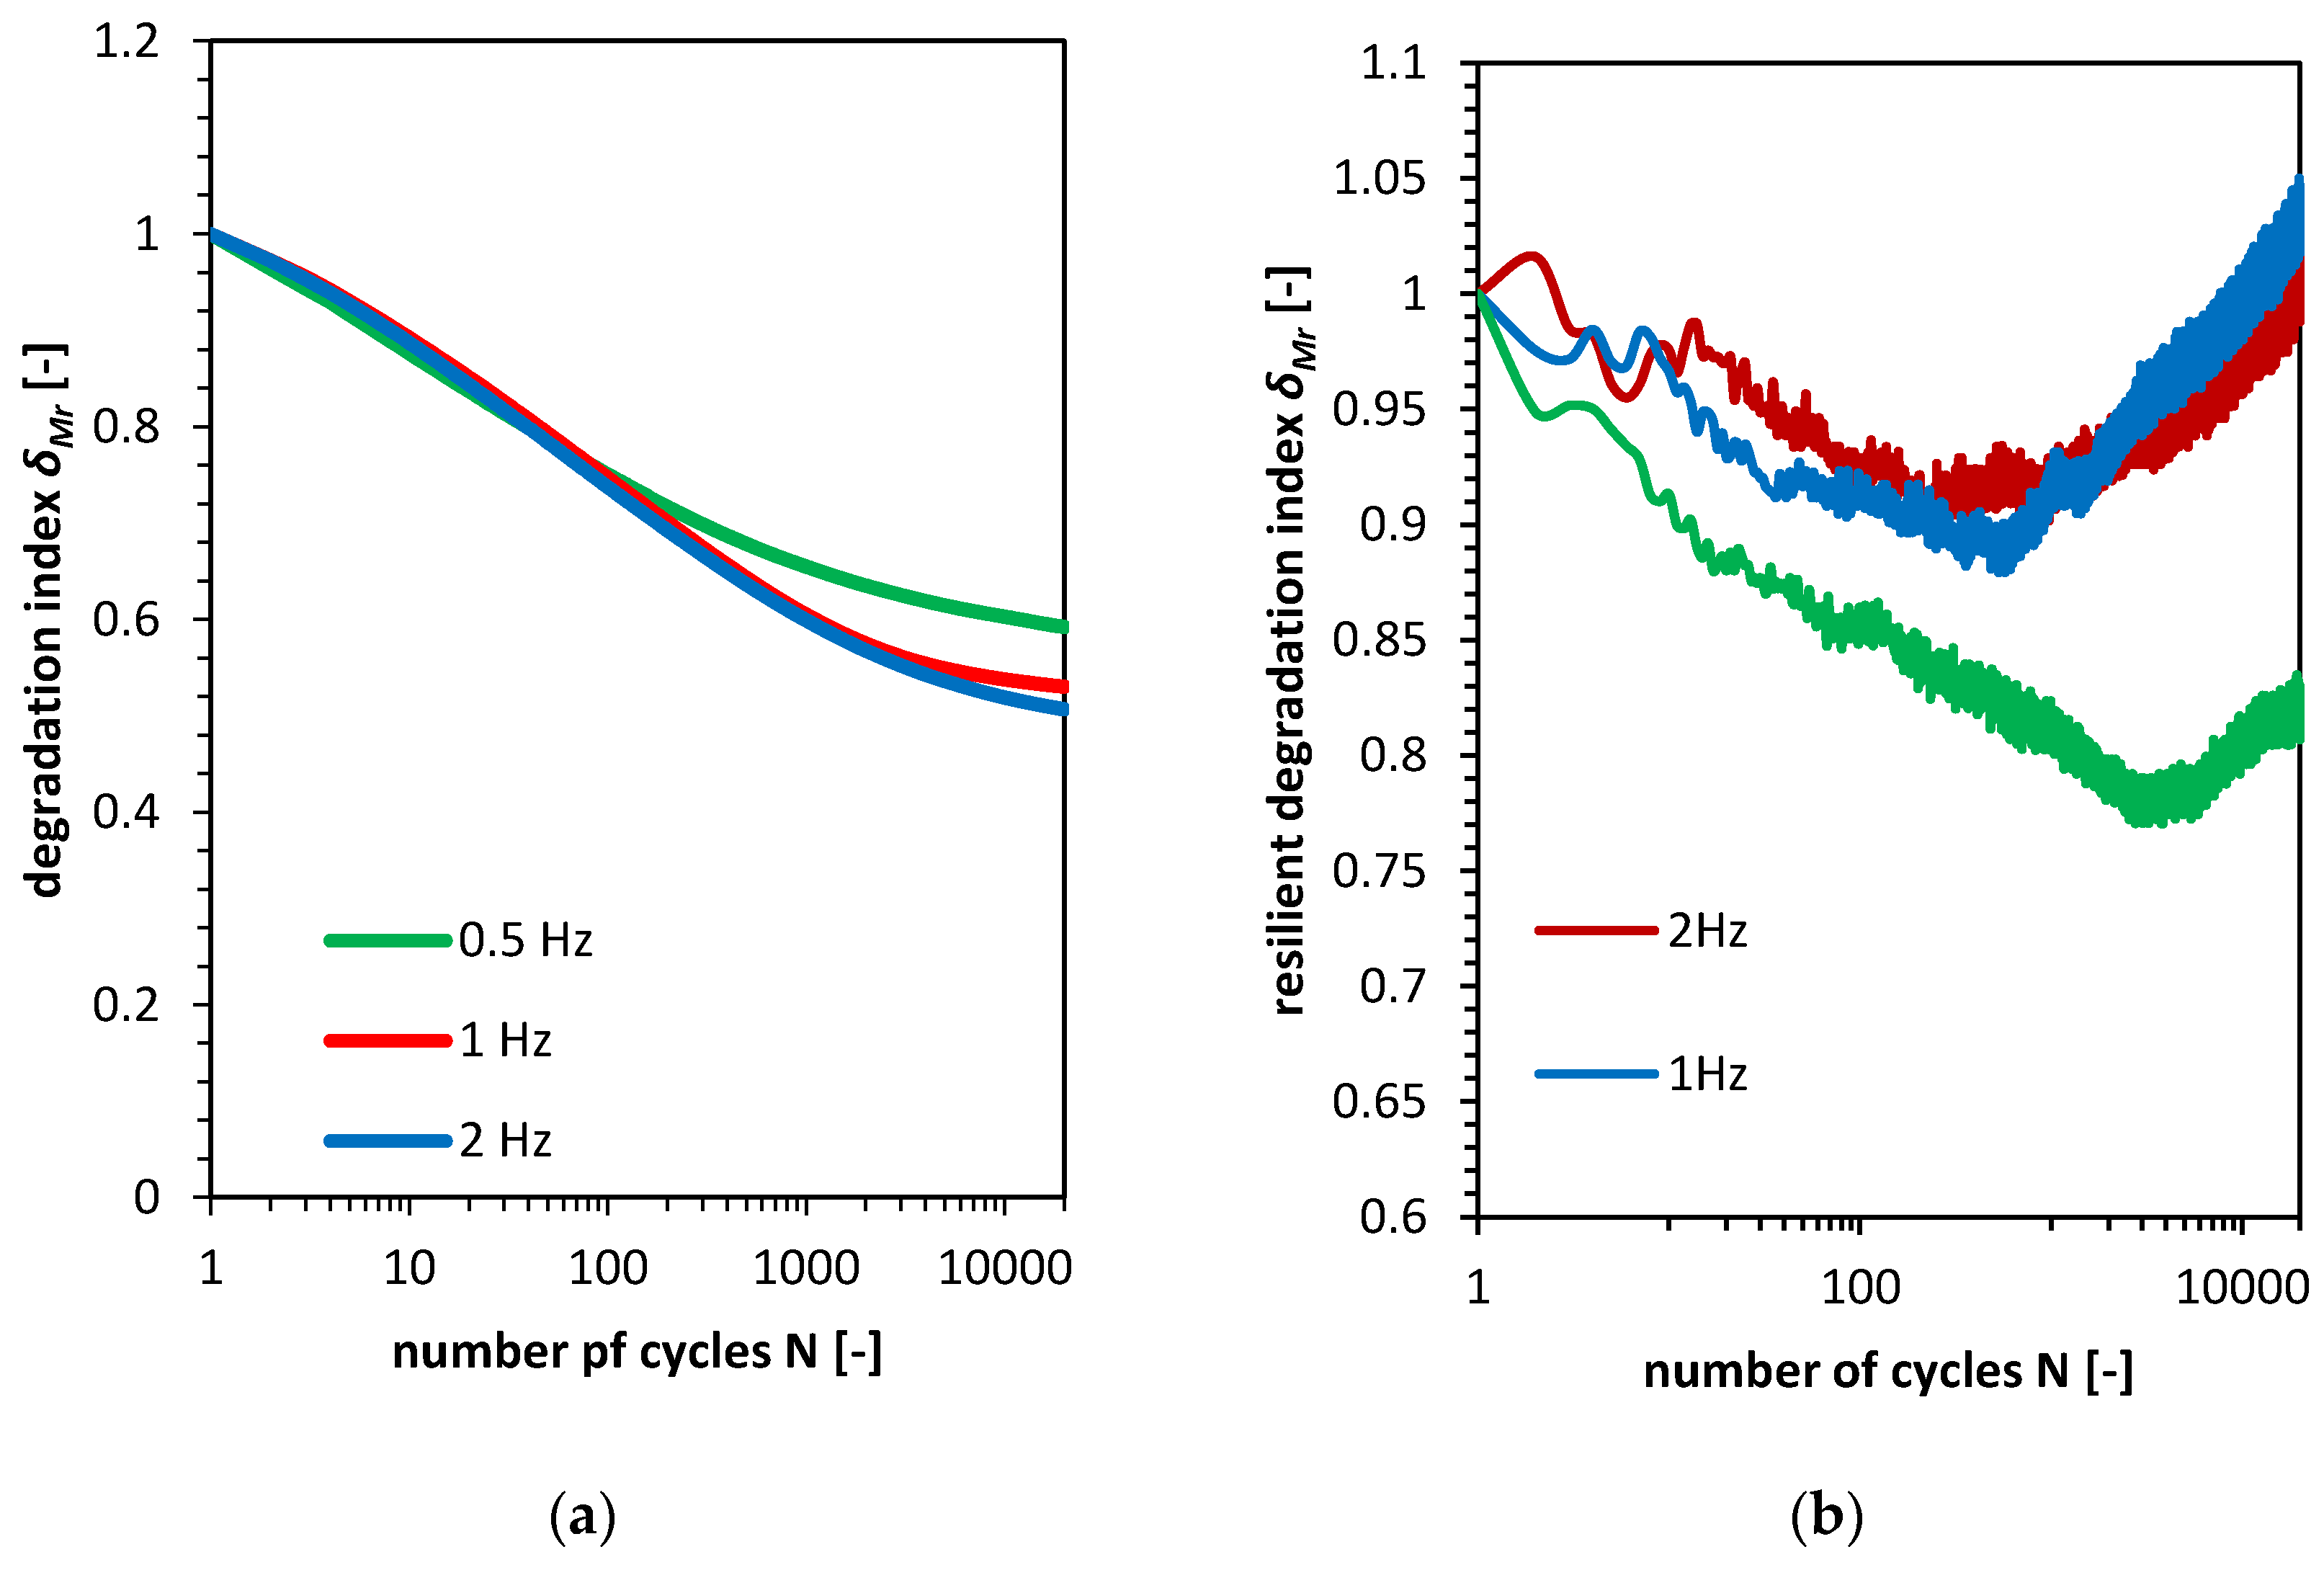
4.1. Cyclic Triaxial Loading Test Results

Three series of cyclic triaxial tests and one static triaxial test were performed to investigate the frequency impact on cohesive soil respond. Stress-controlled loading program was applied using digital control system. During the triaxial test, the data on axial vertical strain, axial stress, pore pressure and cell pressure was recorded and stored as a raw data. On Figure 5 the results of all four tests are presented. The plot shows the stress-strain characteristics. The cyclic loading in all three cases lead to accumulation of plastic strains. Largest vertical plastic strains εp were observed in first cycle of loading. For frequency equal to 0.5 Hz the plastic strain was 0.0038, for 1 Hz the εp was equal to 0.0044 and for 2.0 Hz the vertical plastic strain was equal to 0.0037. Figure 6 presents characteristics of accumulated plastic strain in following cycles.
The cyclic loading in further cycles (N > 2 and N < ~1000) was in logarithmic manner in all three cases. Next, the intermediate state was observed where the rate of plastic strain accumulation was steadily decreasing. The last stage (N > 5000) characterizes itself with lower rate of plastic accumulation and again with logarithmic increase of this phenomena. The presented number of cycles is comparative. The slight differences between total accumulated plastic strain is due to amount of plastic strain accumulated in the first cycle. This occurrence can be explained by difference between void ratio e which also refers to lower density in case of the sample tested in 1 Hz frequency conditions.
The respond of cohesive soil to cyclic loading can be examined in reference to the degradation index. The idea of parameters describing the soil degradation which can be defined by degradation index δ was presented by Idriss et al. [26]. The δ value is defined as the ratio of dynamic secant modulus in the N-th cycle to dynamic secant modulus in the first cycle [26], shown in Equation (1):
δ ( N ) = E d , N E d , 1 = σ d , N ε d , N σ d , 1 ε d , 1 ,
where, σd is maximal axial stress (in terms of triaxial test conditions the referenced stress is maximal deviator stress qmax which is equal to qmax = qm + qa) in N-th cycle and εd is axial strain at maximal stress in N-th cycle. The degradation properties of cohesive soils under repeated loading depend on axial strain amplitude. The proposed exponential model of soil properties degradation was later examined in terms of consolidation ratio [33].
Resilient modulus Mr describes the resilient respond of soil under repeating loading and can be obtained from cyclic triaxial tests. During unloading phase, the elastic strain also called resilient strain εr can be observed which shows the exact amount of recoverable deformation in the particular cycle. The resilient strain can be calculated as a difference between total strain εT in one cycle to permanent strain εP in one cycle εr = εTεP. The Equation (2) was used to calculate Mr value:
M r = σ d , N ε r , N ,
where σd,N is deviator stress in N-th cycle and εr,N is resilient strain in N-th cycle. The idea of degradation index is expanded by authors into the resilient degradation index which refers to the first resilience characteristics and is presented by Equation (3):
δ M r ( N ) = ( M r ) d , N ( M r ) d , 1 = σ d , N ε r , N σ d , 1 ε r , 1 ,
Results of calculations of the degradation index and resilient degradation index presents Figure 7.
The degradation index δ(N) can be presented as the degradation parameter t which is defined as negative quotient of common logarithm from degradation index δ(N) to common logarithm of number of cycles N, presented by Equation (4) [35]:
t = log ( δ ( N ) ) log   N ,
The Young’s modulus for a first cycle was equal to 9.84 MPa, 8.74 MPa and 10.11 MPa respectively for frequencies 0.5 Hz, 1 Hz and 2 Hz. The degradation index in all three cases in first 120 cycles was the same. After this, the degradation of sample loaded with frequency equal to 0.5 Hz slowed down. The degradation of samples for which f was equal to 1 Hz and 2 Hz went in the same way by 5000 cycles. After that, the degradation index of sample for which frequency was equal to 1 Hz was slightly smaller than for sample tested with f = 2 Hz. This phenomena corresponds with plastic strain accumulation presented on Figure 6. The degradation parameter t for the cycles from 1 to 120 was equal to 0.06 in cycle 120. The results of calculations show different response to cyclic loading of compacted cohesive soil. The soil sample loaded with frequency equal to 0.5 Hz accumulates fewer plastic strains during the cyclic loading. The degradation index confirms this behaviour. Samples loaded with frequency greater than 0.5 Hz accumulate more plastic strains and therefore the degradation index is smaller.
The resilient degradation index analysis shows that despite the fact the soil samples tested in frequencies equal to 1 Hz and 2 Hz accumulate more plastic strains, resilient modulus after 20,000 cycles will be greater than at the beginning of the test. This means that the stiffness of the soil samples in this frequencies will behave differently than in case of test in f equal to 0.5 Hz. The resilient modulus in first cycle was equal to 71.9 MPa, 70.7 MPa and 79.0 MPa respectively. In first few hundred cycles the resilient modulus decreased. The minimal Mr values were observed in cycle around 7000 for f equal to 0.5 Hz, cycle around 550 for f equal to 1 Hz and around 250 cycle for frequency 2 Hz. Based on this test results, it can be seen that the minimal resilient modulus value occurs faster with increase in frequency. The resilient degradation and stiffness degradation will be observed in greater amount in case of low frequencies.
The degradation of resilient behaviour seems to be in opposite to plastic strain accumulation phenomena. The frequency impact on soil sample respond will be observed as less stiff and with less settlement in case of lower frequencies.
In order to understand this phenomena, the pore water pressure analysis was conducted. Figure 8 presents excess pore water pressure development during the cyclic triaxial tests.
The excess pore water pressure development in all three cases had the same scenario. In the first phase, the excess pore water pressure rises to maximal value Δumax which is equal to 19.5 kPa, 27.0 kPa and 23 kPa respectively. The Δumax value was reached after around 395, 205 and 630 cycles. Further cyclic loading lead to decrease of excess pore water pressure. This behaviour lasted until cycle from 3000 to 6000. Subsequently, the excess pore water pressure reached steady characteristics and the Δu change was limited. On the Figure 8a, the Δu value is presented versus axial vertical strain development. Shape of this characteristics are close to the characteristic which was presented on Fig, 8b. This characteristic was presented in logarithmic scale of number of cycles. This means that, the excess pore water pressure characteristics have impact on the accumulation of the plastic strains. This can also explain why lower frequencies resulted in lower accumulation of vertical plastic strains. Lower value of excess pore water pressure in case of cyclic triaxial test in frequency 0.5 Hz results in lower accumulated plastic strain because the Δu value was lower in comparison to the tests in higher frequencies.
Excess pore water pressure generation phenomena is also connected with degradation index characteristics. The degradation of tested soil modulus occurs due to the occurrence of the plastic strains. Therefore, the higher generation of excess pore water pressure is the grater degradation will occur.
The resilient degradation index seems to be independent from above presented mechanism. Nevertheless, the increase of the resilient modulus occurs in the zone of steady excess pore water pressure and starts just before occurrence of Δumax value in case of the tests for f equal to 1 Hz and 2 Hz. In case of cyclic triaxial test performed in frequency equal to 0.5 Hz the increase of resilient degradation index and therefore the increase of resilient modulus starts when third stage of Δu characteristics occurs. The conclusion can be drown that, the steady value of excess pore water pressure indicates reverse of the soil respond to cyclic loading and after the phase of softening, the hardening will occur. This also means that long term cyclic loading can improve mechanical behaviour of cohesive soils if the additional settlement is accepted.

4.2. Static Triaxial Loading Test Results

Static triaxial test was performed after the cyclic loading and one additional test was conducted for soil sample without performing the cyclic loading program. The results of the static test are presented on Figure 5. The static loading was conducted with constant velocity of displacement equal 1 mm/h. The static loading stage started just after the cyclic loading test. The static triaxial test on normally consolidated sample without pre-cyclic loading shows typical for this type of soil stress-strain characteristics. The maximal deviator stress qmax during this test was hard to find due to constant increase of the stress strain characteristic. In order to find the maximal deviator stress the deviator stress—mean effective stress plot is presented on Figure 9.
The maximal deviator stress at which the failure occurs qmax,f, based on the Figure 9 for static triaxial test, is equal to around 45 kPa. Therefore the cyclic stress ratio (CSR) which is defined as (5):
C S R = q m a x q m a x , f ,
where, the qmax is maximal deviator stress during the cyclic loading which in this study was equal to around 40 kPa. Therefore, the CSR is equal to 0.89. The static loading of the pre-consolidated cohesive soil in terms of stress-strain characteristic has ductile characteristic. This type of behaviour is characteristic for soil which was artificially compacted. The pre-cyclic loading of the same type of soil results in change of the behaviour type. Now the brittle type of soil respond is observed. This behaviour type is common for naturally pre-consolidated soils. The behaviour change was caused by increase of the pore water pressure. The maximal deviator stress qmax,f was equal to 60.4 kPa, 48.1 kPa and 47.9 kPa respectively. The qmax,f value during cyclic loading increased. The reason of such behaviour is the excess pore water pressure and soil skeleton rearrangement which lead to increase of soil strength. Besides the increase of qmax,f, the change of soil mechanical parameters is not observed very well. The slope of critical state line is in all four cases more or less the same. The only exception can be seen in case of the test for 0.5 Hz but this behaviour was caused by temporary technical problems. The slope of critical state line M can be defined as (6):
M = q m a x p m a x ,
where, p’max is the mean effective stress in maximal deviator stress conditions. In case of this tests the M parameter is equal to around 1.65. The stress paths in case of the post cyclic loading show another kind of shearing mechanics than in case of standard static triaxial tests. Usually, in undrained conditions, the vertical loading is cause of pore pressure increase. The excess pore water pressure leads to decrease of effective stress which is acting on soil skeleton and leads to failure. In the case of post cyclic shear tests, the loading leads to slight decrease of the pore pressure. This process ends when rapid change of the pore pressure behaviour is observed. This phenomena is connected with soil failure and the deviator stress, as well as the effective stress, are decreasing. When stress path reaches the critical state, further stress path change of direction is observed.
The soil behaviour during undrained shear process after the cyclic loading is applied shows that the cyclic loading generates the excess pore water pressure. The increase of pore pressure is the cause of preconsolidated behaviour of clay samples during shearing.

5. Conclusions

The cyclic loading of cohesive soil is an important topic for future constructions based on this type of subgrade. The soil under such loading conditions will respond differently when different value of frequency will be applied. Tested soil in this article was compacted in optimal moisture content. The results presented in this article show cohesive soil response to cyclic loading for three different frequencies. The test results and its analysis lead to the following conclusions:
  • The stress-strain observed during cyclic loading triaxial test, indicates the pattern of soil behaviour. Three phases were identified which refers to different rate of plastic strain accumulation. The plastic strain accumulation characteristics was logarithmic, which means that, with increasing number of cycles the accumulated plastic strain will decrease per one cycle. This type of behaviour was reported before by Goldscheider and Gudehus [36].
  • The degradation index and the resilient degradation index were employed in order to study the plastic strain accumulation and change in stiffness more precisely.
  • The degradation characteristics in all cases of frequency loading were similar for first 120 cycles. The long term cyclic loading caused grater degradation in case of sample tested in f equal to 1 Hz and 2 Hz.
  • The stiffness change analysis was conducted by application of resilient modulus Mr which for first cycles of loading was between 70.7 MPa and 79.0 MPa. The resilient degradation index proposed in this article refers to quotient of resilient modulus in N-th cycle to Mr in first cycle.
  • The resilient degradation analysis have shown that, despite the greater amount of accumulated plastic strains the samples tested in 1 Hz and 2 Hz will recover its stiffness in long term cyclic loading process. The recovery process was also observed in case of 0.5 Hz frequency loading sample but the process started later and the sample did not recovered its initial stiffness.
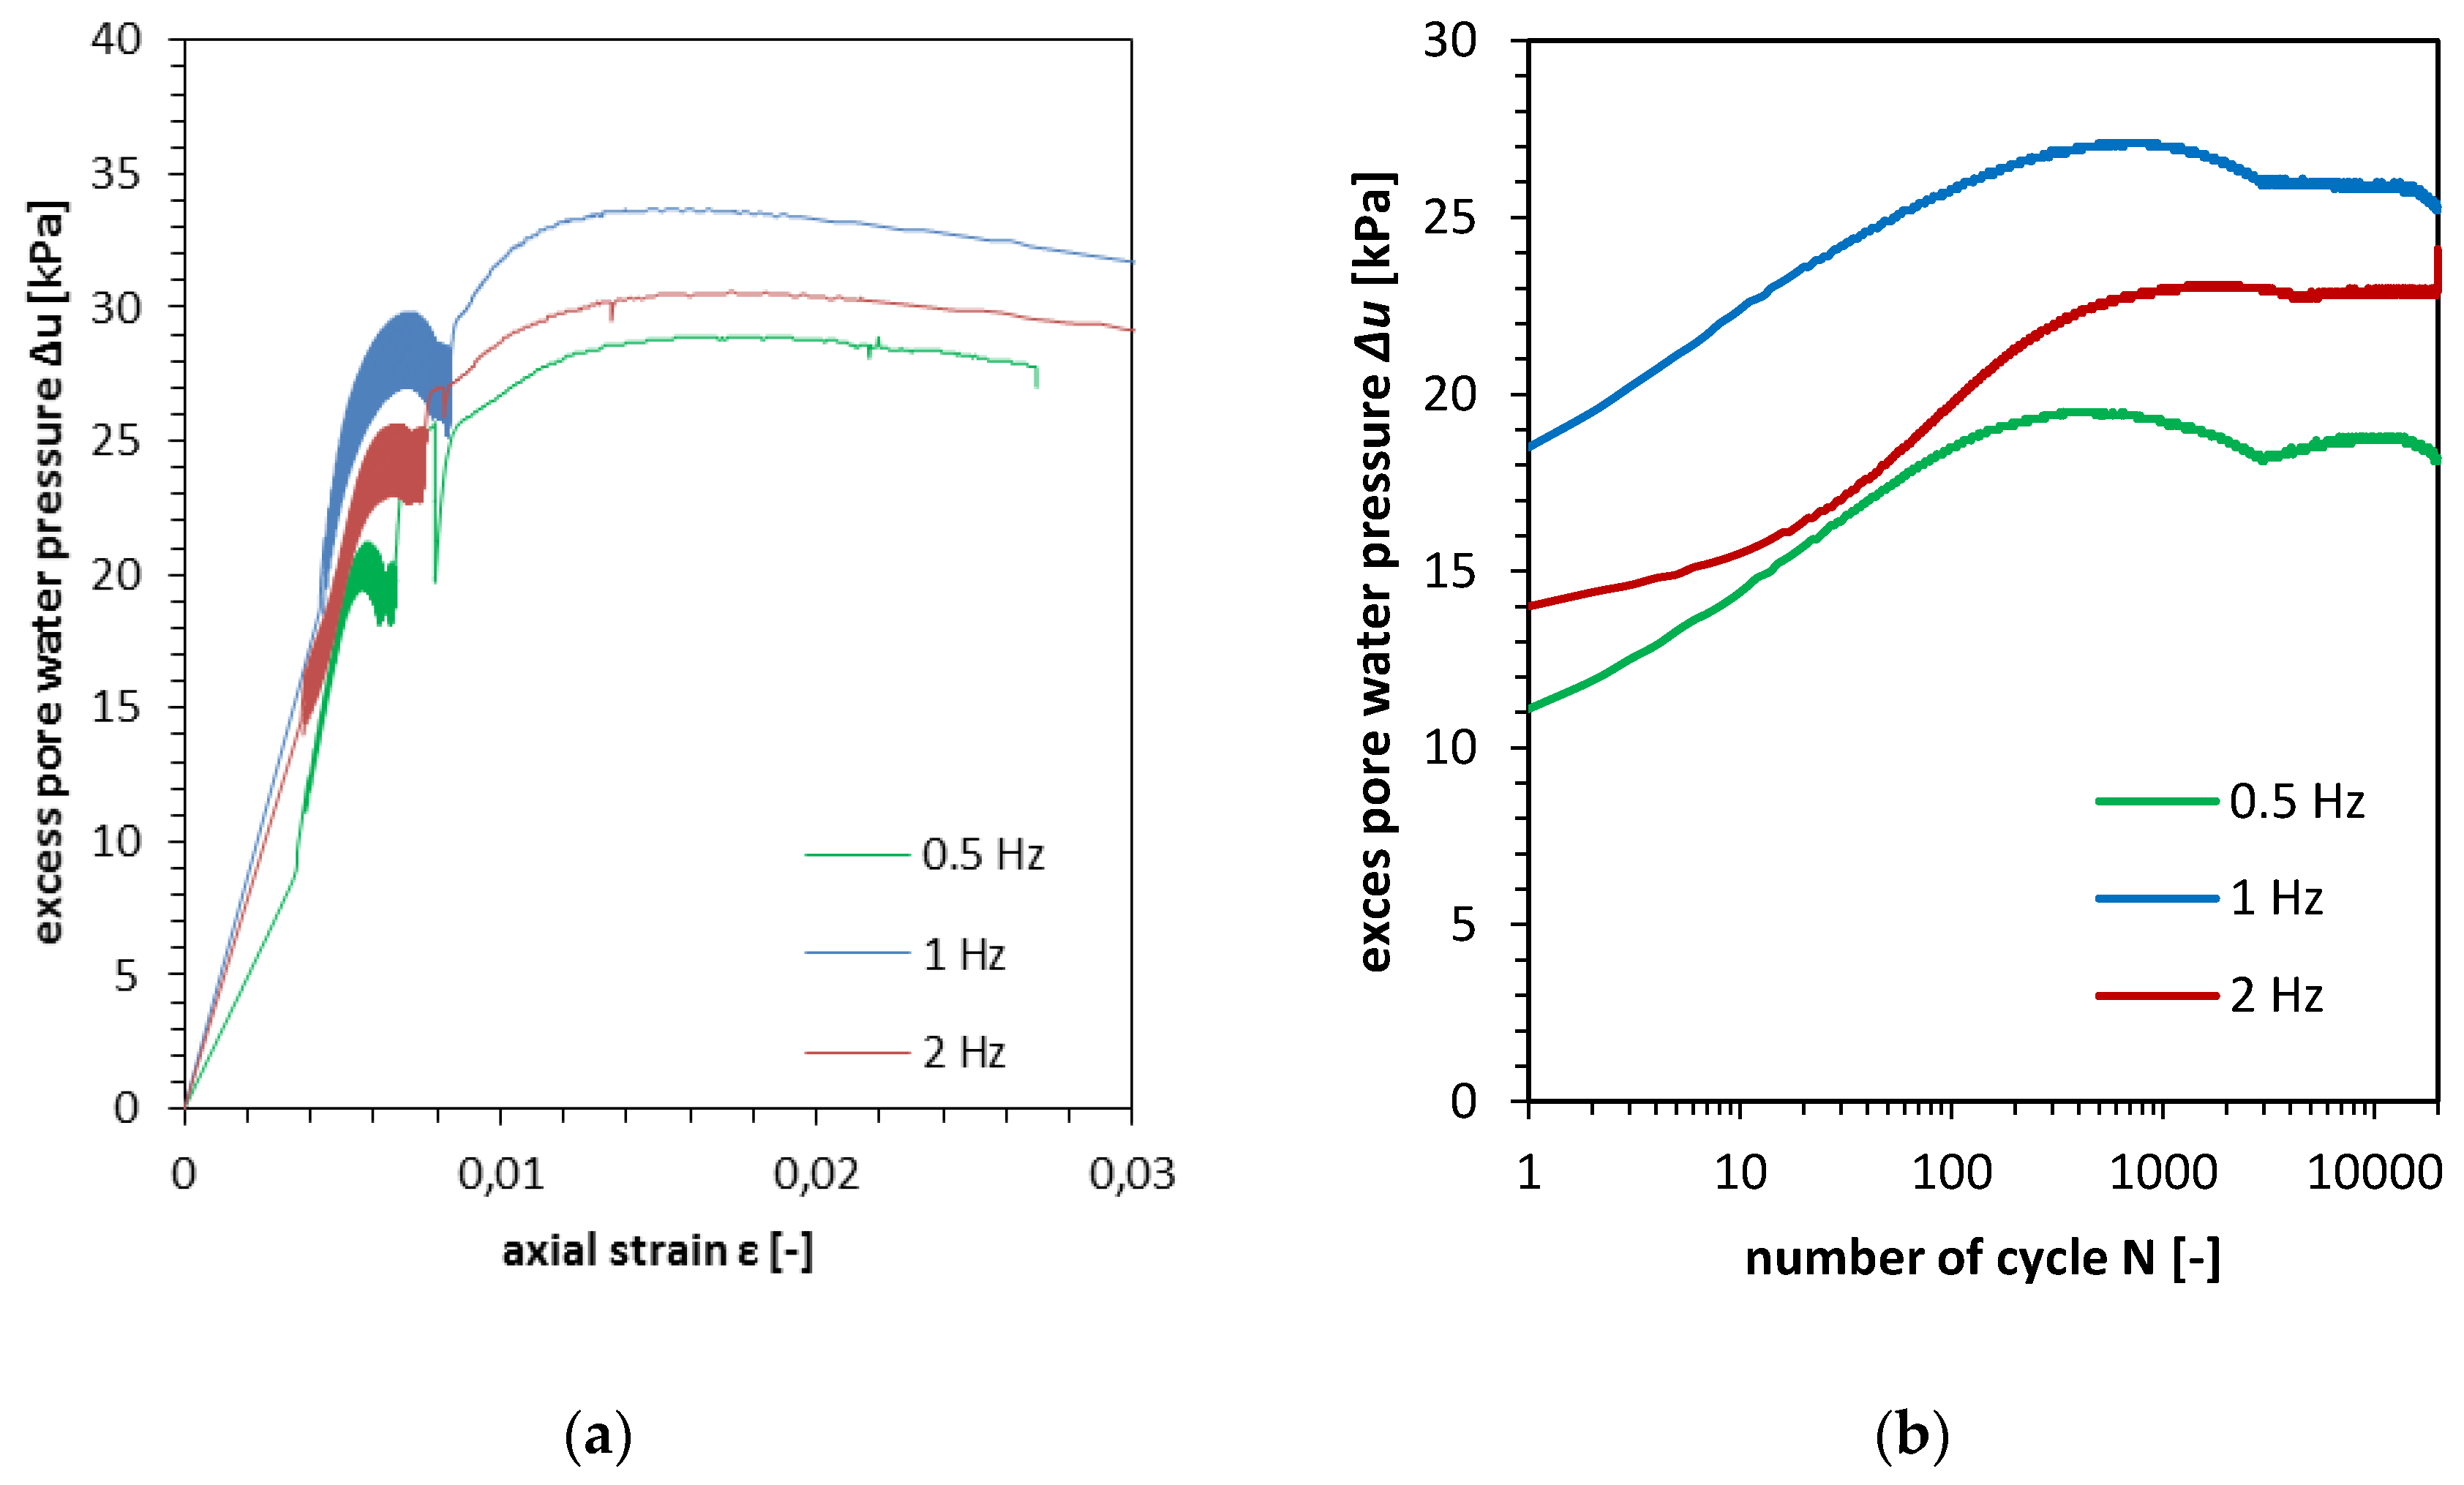
  • The excess pore water pressure analysis have shown that the degradation index is connected to the pore pressure generation. The steady value of excess pore which occurs in long term cyclic loading indicates reverse of the soil respond to cyclic loading and after the phase of softening, the hardening occurs. Pore pressure generation in long term cyclic loading of soft soil was studied by Tang et al. [37], the test results have shown, that the excess pore water pressure generation is different than for compacted cohesive soils. The cyclic loading with qa equal to 10 kPa and with σ’3 equal to 95 kPa lead to generation of Δu equal to 28 kPa after 2000 repetitions. The frequency in this test was equal to 0.5 Hz. The tests in the same stress conditions and with frequency equal to 2.5 Hz has led to generation of Δu equal to 19 kPa.
  • The characteristics of accumulated plastic strain versus number of cycles and the characteristics of excess pore water pressure development were found to be similar. The conclusion can be drown, the excess pore water pressure characteristics impact on the accumulation of the plastic strains. Such phenomena can also explain why in lower frequencies lower accumulated vertical plastic strains are observed. The results of Tang et al. [37] studies for cohesive soft soil shows different picture. The lower frequency causes higher accumulated plastic strains (0.7% and 0.96% respectively for 0.5 Hz and 2.5 Hz). This indicates that there exists the difference between compacted and soft soil response to cyclic loading of cohesive soils.
  • The soil behaviour during undrained shear process after the cyclic loading shows the increase of pore pressure is the cause of preconsolidated behaviour of clay samples during shearing. This type of behaviour differs from this observed during static triaxial test where normally consolidated soil respond was observed.

Author Contributions

K.K. and A.G. prepared the manuscript and performed the cyclic triaxial tests. K.K. and M.M. performed the static triaxial tests. W.S. consulted the research program and proofread the manuscript.

Funding

This research received no external funding.

Conflicts of Interest

The authors declare no conflict of interest.

References

  1. Pecker, A.; Prevost, J.H.; Dormieux, L. Analysis of pore pressure generation and dissipation in cohesionless materials during seismic loading. J. Earthq. Eng. 2001, 5, 441–464. [Google Scholar] [CrossRef]
  2. Paolucci, R.; Pecker, A. Seismic bearing capacity of shallow strip foundations on dry soils. Soils Found. 1997, 37, 95–105. [Google Scholar] [CrossRef]
  3. Newmark, N. Effects of earthquakes on dams and embankments. Geotechnique 1965, 15, 139–160. [Google Scholar] [CrossRef]
  4. Pecker, A.; Salençon, J. Seismic bearing capacity of shallow strip foundations on clay soils. In Proceedings of the International Workshop on Seismology and Earthquake Engineering, Mexico City, Mexico, 22–26 April 1991; pp. 287–304. [Google Scholar]
  5. Paolucci, R.; Shirato, M.; Yilmaz, M.T. Seismic behaviour of shallow foundations: Shaking table experiments vs numerical modelling. Earthq. Eng. Struct. Dyn. 2008, 37, 577–595. [Google Scholar] [CrossRef]
  6. Baralis, M.; Barla, M.; Bogusz, W.; Donna, A.D.; Ryzynski, G.; Żeruri, M. Geothermal Potential of the NE Extension Warsaw Metro Tunnels. Environ. Geotech. 2018, 1–37. [Google Scholar] [CrossRef]
  7. Crawford, C.B.; Morrison, K.I. Case histories illustrate the importance of secondary-type consolidation settlements in the Fraser River Delta. Can. Geotech. J. 1996, 33, 866–878. [Google Scholar] [CrossRef]
  8. Yin, Z.Y.; Zhu, Q.Y.; Yin, J.H.; Ni, Q. Stress relaxation coefficient and formulation for soft soils. Géotech. Lett. 2014, 4, 45–51. [Google Scholar] [CrossRef] [Green Version]
  9. Xu, J.; Tang, Y.; Yan, X.; Zhou, J. Experimental and theoretical methods on determination of stress-dependent natural frequency of marine sedimentary clay. Mar. Georesour. Geotechnol. 2017, 35, 1168–1180. [Google Scholar] [CrossRef]
  10. Wichtmann, T.; Triantafyllidis, T. Strain accumulation due to packages of cycles with varying amplitude and/or average stress–On the bundling of cycles and the loss of the cyclic preloading memory. Soil Dyn. Earthq. Eng. 2017, 101, 250–263. [Google Scholar] [CrossRef]
  11. Boulbibane, M.; Ponter, A.R.S. The linear matching method for the shakedown analysis of geotechnical problems. Int. J. Numer. Anal. Methods Geomech. 2006, 30, 157–179. [Google Scholar] [CrossRef]
  12. Nieto Leal, A.; Kaliakin, V.N. General response observed in cyclically loaded cohesive soils. Ciencia e Ingeniería Neogranadina 2016, 26, 21–39. [Google Scholar] [CrossRef]
  13. Kumar, S.S.; Krishna, A.M.; Dey, A. Dynamic properties and liquefaction behaviour of cohesive soil in northeast India under staged cyclic loading. J. Rock Mech. Geotech. Eng. 2018, 10, 958–967. [Google Scholar] [CrossRef]
  14. Martínez, E.; Patiño, H.; Galindo, R. Evaluation of the risk of sudden failure of a cohesive soil subjected to cyclic loading. Soil Dyn. Earthq. Eng. 2017, 92, 419–432. [Google Scholar] [CrossRef]
  15. Ajmera, B.; Tiwari, B.; Pandey, P. Use of pore pressure response to determine shear strength degradation from cyclic loading. In Proceedings of the Geotechnical Frontiers 2017, Orlando, FL, USA, 12–15 March 2017; pp. 19–26. [Google Scholar]
  16. Brunarski, L.; Dohojda, M. An approach to in-situ compressive strength of concrete. Bull. Pol. Acad. Sci. Tech. Sci. 2016, 64, 687–695. [Google Scholar] [CrossRef] [Green Version]
  17. Kalinowska, M.; Jastrzębska, M. Behaviour of cohesive soil subjected to low-frequency cyclic loading in strain-controlled tests. Stud. Geotech. Mech. 2014, 36, 21–35. [Google Scholar] [CrossRef]
  18. Sas, W.; Głuchowski, A.; Gabryś, K.; Soból, E.; Szymański, A. Resilient modulus characterization of compacted cohesive subgrade soil. Appl. Sci. 2017, 7, 370. [Google Scholar] [CrossRef]
  19. Mortezaie, A.; Vucetic, M. Threshold shear strains for cyclic degradation and cyclic pore water pressure generation in two clays. J. Geotech. Geoenviron. Eng. 2016, 142, 04016007. [Google Scholar] [CrossRef]
  20. Lei, H.; Li, B.; Lu, H.; Ren, Q. Dynamic deformation behavior and cyclic degradation of ultrasoft soil under cyclic loading. J. Mater. Civ. Eng. 2016, 28, 04016135. [Google Scholar] [CrossRef]
  21. Yang, G.; Ye, J. Wave & current-induced progressive liquefaction in loosely deposited seabed. Ocean Eng. 2017, 142, 303–314. [Google Scholar]
  22. Borowiec, A.; Stanuszek, M. Liquefaction mechanism induced by dynamic excitation modeled in Plaxis AE with the use of UBC and MOHR–coulomb constitutive relationships. Stud. Geotech. Mech. 2016, 38, 123–133. [Google Scholar] [CrossRef] [Green Version]
  23. Ichii, K.; Mikami, T. Cyclic threshold shear strain in pore water pressure generation in clay in situ samples. Soils Found. 2018, 58, 756–765. [Google Scholar] [CrossRef]
  24. Leng, J.; Ye, G.L.; Ye, B.; Jeng, D.S. Laboratory test and empirical model for shear modulus degradation of soft marine clays. Ocean Eng. 2017, 146, 101–114. [Google Scholar] [CrossRef]
  25. Wang, Y.; Lei, J.; Gong, X.; Wang, Y.; Yang, P. Post-cyclic undrained shear behavior of marine silty clay under various loading conditions. Ocean Eng. 2018, 158, 152–161. [Google Scholar] [CrossRef]
  26. Idriss, I.M.; Dobry, R.; Singh, R. Nonlinear behavior of soft clays during cyclic loading. J. Geotech. Eng. Div. 1978, 104, 1427–1448. [Google Scholar]
  27. Yamanouchi, T.; Yasuhara, K. Settlement of clay sub grades after opening to traffic. In Proceedings of the 2nd Australia and New Zealand Conference on Geomechanics, Brisbane, Australia, 21–25 July 1975; Volume 1, pp. 115–118. [Google Scholar]
  28. Hardin, B.O.; Drnevich, V.P. Shear modulus and damping in soils: Measurement and parameter effects. J. Soil Mech. Found. Div. 1972, 98, 603–624. [Google Scholar]
  29. Konrad, J.M.; Wagg, B.T. Undrained cyclic loading of anisotropically consolidated clayey silts. J. Geotech. Eng. 1993, 119, 929–949. [Google Scholar] [CrossRef]
  30. Matsui, T.; Ohara, H.; Ito, T. Cyclic stress strain history and shear characteristics of clay. J. Geotech. Eng. Div. 1980, 106, 1101–1120. [Google Scholar]
  31. Lebebvre, G.; LeBoeuf, D. Rate effects and cyclic loading of sensitive clays. J. Geotech. Eng. 1987, 113, 476–489. [Google Scholar] [CrossRef]
  32. Procter, D.C.; Khaffaf, J.H. Cyclic triaxial tests on remoulded clays. J. Geotech. Eng. 1984, 110, 1431–1445. [Google Scholar] [CrossRef]
  33. Vucetic, M.; Dobry, R. Degradation of marine clays under cyclic loading. J. Geotech. Eng. 1988, 114, 133–149. [Google Scholar] [CrossRef]
  34. Aksnes, J. A Study of Load Responses Towards the Pavement Edge. Ph.D. Thesis, Department of Road End Railway Engineering, Norwegian University of Science and Technology, Trondheim, Norway, 2002. [Google Scholar]
  35. Jiang, M.; Cai, Z. Stiffness degradation of soft marine clay under uniaxial cyclic loading. Electron. J. Geotech. Eng. 2012, 17, 3889–3895. [Google Scholar]
  36. Goldscheider, M.; Gudehus, G. Einige Bodenmechanische Probleme bei Küsten-und Offshore-Bauwerken. In Vorträge der Baugrundtagung; Deutsche Gesellschaft für Erd- und Grundbau: Nurnberg, Germany, 1976; pp. 507–522. [Google Scholar]
  37. Tang, Y.Q.; Zhou, J.; Liu, S.; Yang, P.; Wang, J.X. Test on cyclic creep behavior of mucky clay in Shanghai under step cyclic loading. Environ. Earth Sci. 2011, 63, 321–327. [Google Scholar] [CrossRef]
Figure 1. Soil classification (a); Grain size distribution curve; (b) Application of Feret’s triangle to determine soil classification
Geosciences 08 00468 g001
Figure 2. Determination of liquid limit of analysed soil.
Geosciences 08 00468 g002
Figure 3. Soil compaction curve based on the Proctor test.
Geosciences 08 00468 g003
Figure 4. Results of oedometric tests on compacted in optimal moisture content clay sample.
Geosciences 08 00468 g004
Figure 5. Results of triaxial tests on cohesive soil. The stress-strain characteristic for different frequency of loading.
Geosciences 08 00468 g005
Figure 6. The accumulation of plastic strain characteristics in number of cycles.
Geosciences 08 00468 g006
Figure 7. Modulus change characteristics as the degradation index versus number of cycles: (a) degradation index; (b) resilient degradation index.
Geosciences 08 00468 g007
Figure 8. Excess pore water pressure during cyclic triaxial tests: (a) Δu value versus vertical strain ε; (b) Δu value versus number of cycles N.
Geosciences 08 00468 g008
Figure 9. Deviator stress—mean effective stress plot.
Geosciences 08 00468 g009
Table 1. Physical properties of tested soil in cyclic triaxial apparatus.
PropertySample 1
(f = 0.5 Hz)
Sample 1
(f = 1.0 Hz)
Sample 1
(f = 2.0 Hz)
dry density (g/cm3)1.971.881.92
initial void ratio e0 (–)0.3520.4420.39
natural moisture content (%)11.8711.7411.54
liquidity index LI (%)0.00.00.0
consistency index CI (%)1.01.01.0

