Article

Multi-Azimuth Ground Penetrating Radar Surveys to Improve the Imaging of Complex Fractures

Department of Civil and Environmental Engineering, Politecnico di Milano, Piazza Leonardo da Vinci 32, 20133 Milan, Italy
*
Author to whom correspondence should be addressed.
Geosciences 2018, 8(11), 425; https://doi.org/10.3390/geosciences8110425
Submission received: 31 October 2018 / Revised: 12 November 2018 / Accepted: 14 November 2018 / Published: 20 November 2018
(This article belongs to the Special Issue Advances in Ground Penetrating Radar Research)

Abstract

:
Ground Penetrating Radar (GPR) images are affected, to some degree, by the relative orientation of antennas and subsurface targets. This is particularly true not only for targets that show a significant directivity, but also for inclined planes, such as fractures and faults. Depending on the relative geometry between the antennas and the orientation of the target, radar waves can be preferentially scattered, which causes changes in the reflected signal amplitude. Therefore, traditional single polarization and single azimuth surveys may produce inadequate results. The work presented here examines the use of a multi-azimuth GPR survey to increase the imaging performance of inclined fractures, showing the shortcomings of single-profile surveying and highlighting the benefits that such a strategy has on detection and characterization.

1. Introduction

Among the currently employed geophysical techniques, Ground Penetrating Radar (hereinafter addressed with its abbreviation GPR or georadar) has been found to be a useful tool for near surface investigation of the Earth’s subsurface, providing high resolution imaging capabilities and efficient data collection [1,2]. The method uses electromagnetic waves to produce an image of the discontinuities, in terms of dielectric and magnetic variations of the subsurface, making the technique suitable for a large ensemble of applications. GPR prospecting has been successfully exploited in civil engineering, archaeology, geology and forensic applications [3,4,5,6].
GPR prospecting is also applied with regard to mines and pits to assess the risk of rockslides, for which knowledge of the complex fracture system is fundamental. Of particular interest is determining subsurface shapes of fractures, because dips and depths of fractures are important variables in the construction of geomechanical models for stability analysis [7,8,9,10].
Several studies have demonstrated that GPR surveying can be used successfully to detect and map fractures, and especially to estimate their properties [11,12,13,14,15,16].
GPR investigations of fractured rocks commonly employ single polarization, co-polarized data acquisition, which is adequate for imaging planar sub-horizontal interfaces. However, natural fractures are not perfectly planar interfaces and can exhibit polarization effects at commonly used GPR frequencies [17,18]. It is therefore clear that a survey of this type is generally insufficient to determine fracture locations and orientations; hence, a multi-azimuth and/or multi-polarization approach should be considered.
Polarization is a critical factor for the informative content of a GPR image, as changes in the polarization state of the electromagnetic (EM) field occur, to some degree, upon reflection and transmission. Since the waves are vectorial, features exhibiting directionality can strongly modify the state of an incident field, and determine a mismatch in polarization between the scattered field and the receiving antenna [19]. It is well known that certain targets scatter energy preferentially, such that the backscattered field results in a different polarization [20]. Cylinders represent widespread engineering targets and their scattering properties are strongly polarization-dependent [21,22]. Polarization is a significant parameter, also in situations involving heterogeneous soils, where it may be important to discriminate between reflections arriving from undesirable scatterers, and from primary GPR targets [23,24].
Depending on the polarization of the incident wave and the orientation of the target, the radar wave can be preferentially scattered, which causes changes in the reflected signal amplitude [25].
Recent work has examined the information on fractures that can be retrieved from careful analysis of multi-polarization (or alternatively multi-component) GPR measurements, which exploit knowledge of transmitter and receiver antenna radiation patterns and incorporate wave speed, polarization, and amplitude of the scattered electric field [26,27,28]. Acquiring multi-polarization GPR data has been shown to provide more precise measurements of the size, shape, and orientation of the target [29,30,31,32], as well as advantages in identifying the different fills of the fractures [33,34,35].
The complex structure of a fracture network, however, might reduce the detection performance even when interpreting multi-component profiles, as the geometrical variations of the fracture can create unpredictable preferential scattering directions, thus preventing a correct reconstruction.
An alternative is to employ a single polarization platform and systematically investigate the area of fracture under different antenna orientations, namely through a multi-azimuth approach. Variations in the data collected using different geometries have been noted but have not been routinely used to extract information about the studied targets.
This paper advances the use of a multi-azimuth GPR experiment, in which a 2D profile was acquired by mechanically rotating a co-polarized GPR antenna, in order to give evidence of the fundamental role that antenna orientation plays for the detection of inclined fractures, and to evaluate the potential for characterizing the geometry of the fractures network.
After a brief description of the geological properties of the surveyed area and the dedicated GPR platform employed for the experimentation, the results from the field trial are presented and commented on. The obtained profiles demonstrate that significant variations in the imaging performance of the fracture exist depending on the relative geometry between the antenna orientation and the geometrical properties of the fracture. To assist with interpretation, a descriptive numerical model was computed and compared, showing a very close agreement with the experimental data, and therefore supporting the research background.

2. Materials and Methods

The Valle San Croce-Valle Del Curone area, 30 km north of Milan, Italy, is a green area of woodland penetrating the Milan industrial conurbation, connecting it to the landscapes of the pre-Alpine foothills and mountains. From a geological point of view, the area is located at the southern edge of the Southern Alpine system, forming its last outcrops in the north of the Po Plain. The northern section is mostly on a pre-Quaternary bedrock composed largely of calcarenites and limestone and, to a lesser extent, shale. The area is marked by rocky outcrops with deep valleys and steep slopes. In the southern section, there is a deep cover of loose deposits of glacial origin from the Quaternary, which gives the area a gentler appearance. From the oldest to the most recent, the nearby glacial complexes are: The Maresso Complex, the Missaglia Complex, and the Perego Complex. The valleys (Lavandaia stream valley, Valle del Curone, and Molgora stream valley) are of fluvioglacial origin [36,37].
The Missaglia Megabed is 40 m thick, and consists of megabreccia in the lower part (2–3 m of thickness) and a homogeneous segment of calcarenite-marl in the upper part.
The site chosen for this study is located in the northern section of the valley, where significant outcrops are visible, as illustratively shown in Figure 1a. From a geological point of view, the area features Flysch facies, called Flysch di Bergamo, which consist primarily of a sequence of shale, marl, and sandstone.
As the subsurface presents locally a high level of clay, the survey was carried out on an off-road path, sufficiently smooth for the acquisition to avoid excessive jolts, and maintain an acceptable level of adherence to the surface (Figure 1b).
The experimental campaign was carried out in the above-described area to evaluate the effects that the orientation of the GPR antennas has on the fracture response. The equipment used was a shielded impulse IDS GeoRadar, consisting of two bow-tie antennas spaced 9 cm, with a central frequency of 600 MHz and a bandwidth spanning from 300 MHz to 900 MHz. The radiation of the antennas was linearly polarized, and had a bidirectional pattern with broad main beams perpendicular to the plane of the antenna. The antenna, manually dragged over the surface, was mounted on a PVC sledge (Figure 2a) to allow for fast data acquisition. Within the bottom of the antenna case and the sledge, a mechanical turntable for precise platform rotation (Figure 2b) was inserted.
Along the same survey line, the GPR profiles were collected starting with the antenna oriented perpendicular to the inline direction, each time incrementing the rotation of the platform by 15 degrees, clockwise, until a complete rotation of the platform was obtained, i.e., inverting the location of the transmitter and the receiver. For a better understanding, a sketch is provided in Figure 3.
Acquisition parameters and profile details are summarized in Table 1.
For the sake of clarity, the following nomenclature, depicted in Figure 4, was employed when assessing the results.
The velocity of the subsurface was estimated through the hyperbola fitting method, giving a value of approximately 7 cm/ns, in agreement with the evidence of a clayed material. To avoid eventual processing artefacts and huge modifications of the acquired data, the applied processing [38] consisted only of: (1) Time alignment, to calibrate the time zero reflection; (2) zero-phase Butterworth filter matched to the actual spectrum; (3) trace equalization, to recover relative amplitude information; and (4) a time-to-depth conversion, computed through a Kirchhoff algorithm.
Resulting GPR profiles after each processing step are shown in Figure 5.

3. Results and Discussion

Collected GPR profiles are shown in Figure 6. Amplitude is displayed in grey colormap and was normalized in the range 0–1. For each frame, the angular deviation from the initial state is indicated. An outline of the targets of interest is provided in the lower corner of the panel.
In particular, two geological events were highlighted, marked respectively A and B in Figure 6, the first being a more composite fracture while the latter a less stratified structure. This consideration arose from a first look at the data, and from near surface evidence. The vertical extensions of the highlighted targets were roughly 120 cm for the target marked A, and 80 cm for the target marked B, whereas their inclination was approximately 20 degrees and 160 degrees, respectively.
From the first instance, one can plainly notice that there were significant alterations in the shape and pattern of the recorded target responses. Making the dependency evident, with the relative geometry, between the orientation of the antenna pattern and the direction of the fracture plane.
Isolating the fracture marked A in Figure 6, the optimum configuration (i.e., the configuration for which the event can be better identified, addressed here as the maximum response of the target) was considered when the GPR platform was rotated 45 degrees (Figure 7a). Starting from this, important variations were evidently spanning the angular space. In particular, the fracture almost disappeared at 105 and 180 degrees (Figure 7b,d, respectively), to return to a maximum value around 135 degrees (Figure 7c), corresponding to an angular shift between the maximum and minimum of approximately 90 degrees. During the transition, a highly complex trend was delineated due to the composite structure of the fracture. These concepts are depicted in Figure 7.
A similar behavior was pointed out when analyzing the other fracture marked B (Figure 6), where the maximum response was obtained at relative orientations of 75 and 120 degrees (Figure 8a,b, respectively), with an angular difference of 45 degrees separating them. However, its signature partially vanished at 90 degrees till the fracture was almost invisible at around 0 and 180 degrees, as described in Figure 8c,d.
By comparing the two responses, it was observed that the fracture marked B presented sharper transitions and higher dependency from the relative orientation when passing from its maximum and minimum responses, and this could be linked to the fact that it consists of a single layered plane, thus the effect was more perceivable. These variations in the structure of the fractures are supported by off-the-ground evidence in the area.
Another valuable consideration that could be pointed out is that observing the two boundary conditions, representing the same polarization configuration except that the transmitter and the receiver were inverted, some differences were evident for the fracture marked A (Figure 9).
While not theoretically predictable, this outcome is presumably related to the fact that the azimuth plane of the fracture may vary spatially. This hypothesis is supported by the fact that the same differences were not visible while analyzing the fracture marked B. In addition to this, the different propagation phenomena affecting the two different paths should be accounted for.
The possibility of such a detailed characterization of the target represents a clear advantage of a multi-azimuth strategy. For, when relying only on a single profile there is the potential possibility of missing the target of interest or misinterpreting the campaign outcomes.
Moreover, the fact that at some particular orientation the fracture completely disappeared is probably the key element of the analysis, as no processing steps could recover this information loss.
To verify the analysis of the experimental results, a simulated small scale model of the response of a dipping plane was computed using CST Microwave software (CST—Computer Simulation Technology, www.cst.com), a simulation package for the numerical solution of Maxwell’s equations.
As the scope was to show the variations in signal magnitude occurring when a relative orientation between the antenna pattern and the geometry of the fracture exists, a simplified model consisting of a PEC plate embedded in free space was designed.
In particular, according to the experimental results, two planes were modeled and illuminated by a plane wave, with a receiving probe located in the middle of the modeling environment at a distance of 100 cm from the middle of the target. The simulation parameters are summarized in Table 2, and follow the same strategy adopted for the experimental campaign.
The model was run rotating the strike angle of the plane in order to simulate the antennas rotation, with the initial condition corresponding to the transmitter and receiver aligned with the y-axis of Figure 4. Figure 10 shows the normalized output of the numerical model.
What was easily noticeable from the simulation results was a non-uniform variation in the magnitude of the response with respect to the fracture strike angle. The dynamic range of the graphs showed that a significant loss occurred when there was a misalignment between the orientation of the antenna pattern and the one of the fracture, and it was noticed that the two trends were almost complementary, as expected from their geometry. Considering the ideal conditions of the numerical simulation, the variations in the received magnitude were only related to the changes in the relative geometry, demonstrating the important role played by this feature for the detection and identification process.
In particular, for the fracture in Figure 10a, maximum responses were obtained when the azimuth plane was oriented parallel (0 and 180 degrees) and perpendicular (90 degrees) to the antenna direction, while the amplitude decreased down to less than half between them. Concerning the second target (Figure 10b), two optimal configurations were defined at an orientation of approximately 75 degrees and 105 degrees, and the magnitude of the response reached its minimum at 90 and 0/180 degrees.
Comparing the results of the numerical model and the corresponding experimental campaign, evident similarities could be highlighted. Obviously, a point-to-point correlation was not feasible, as achieving a perfect correspondence between the numerical simulated coordinates and the experimental one was hard to obtain.
In particular, for the fracture marked A (Figure 7):
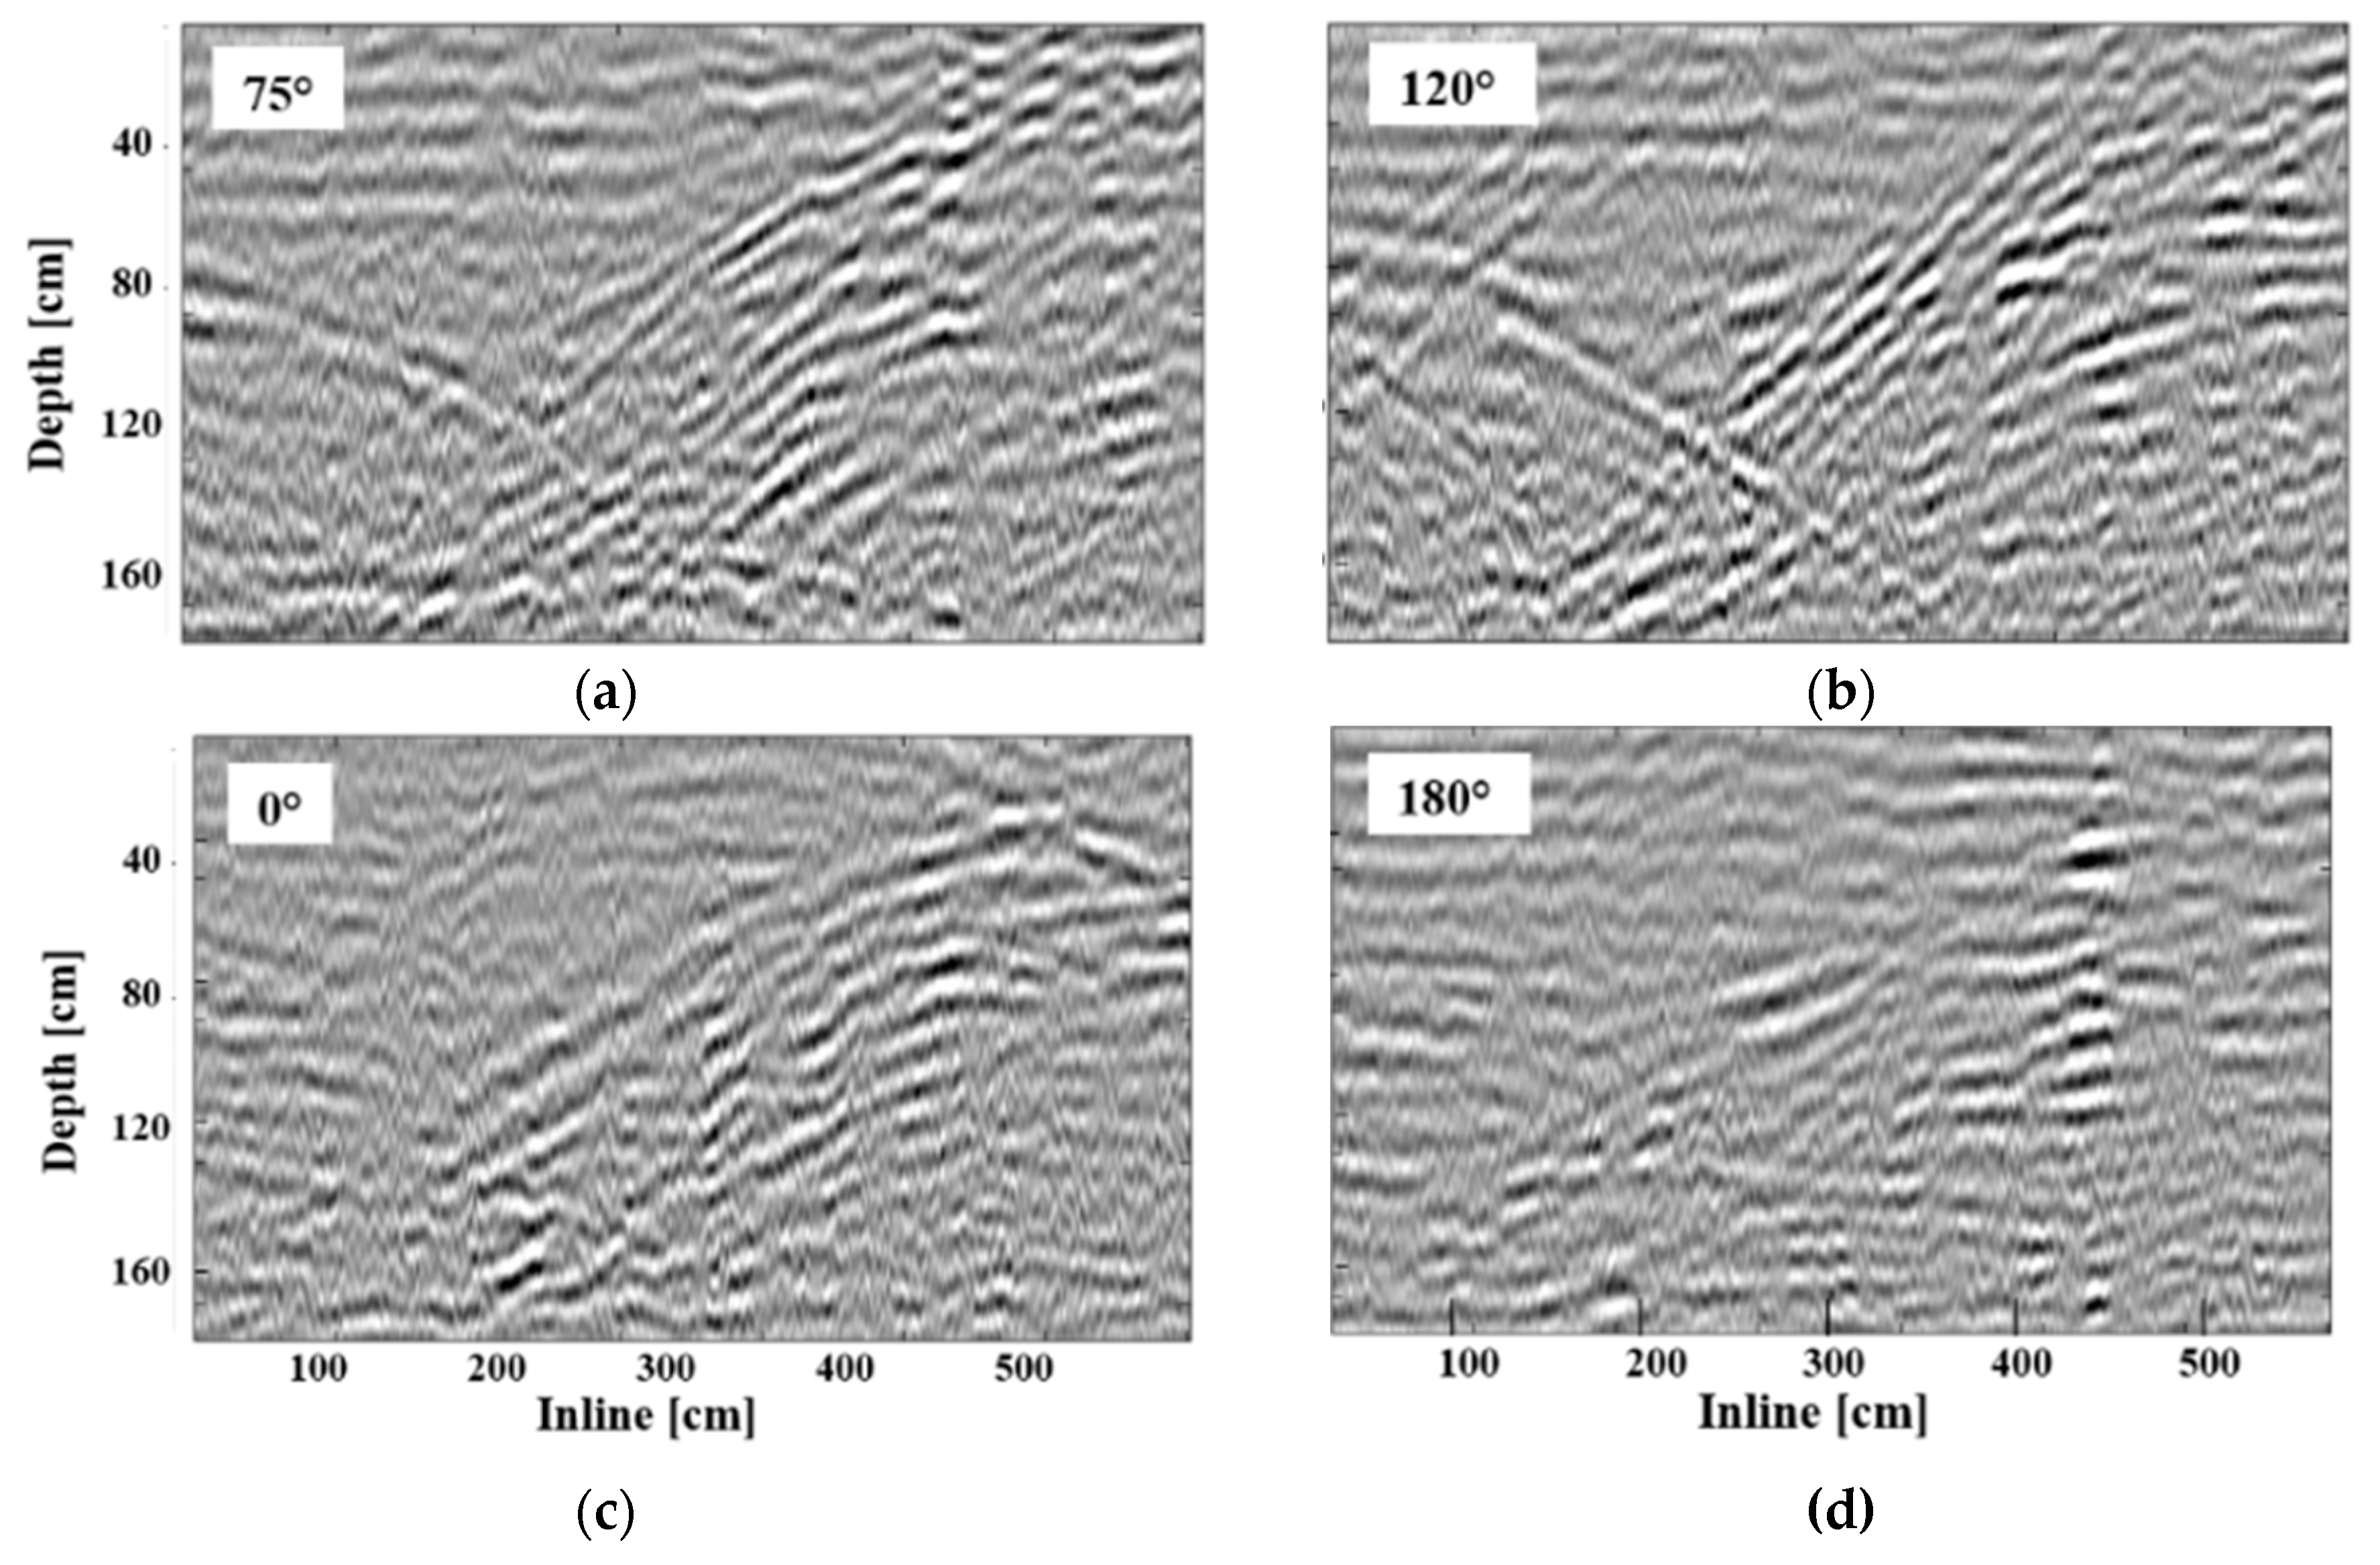
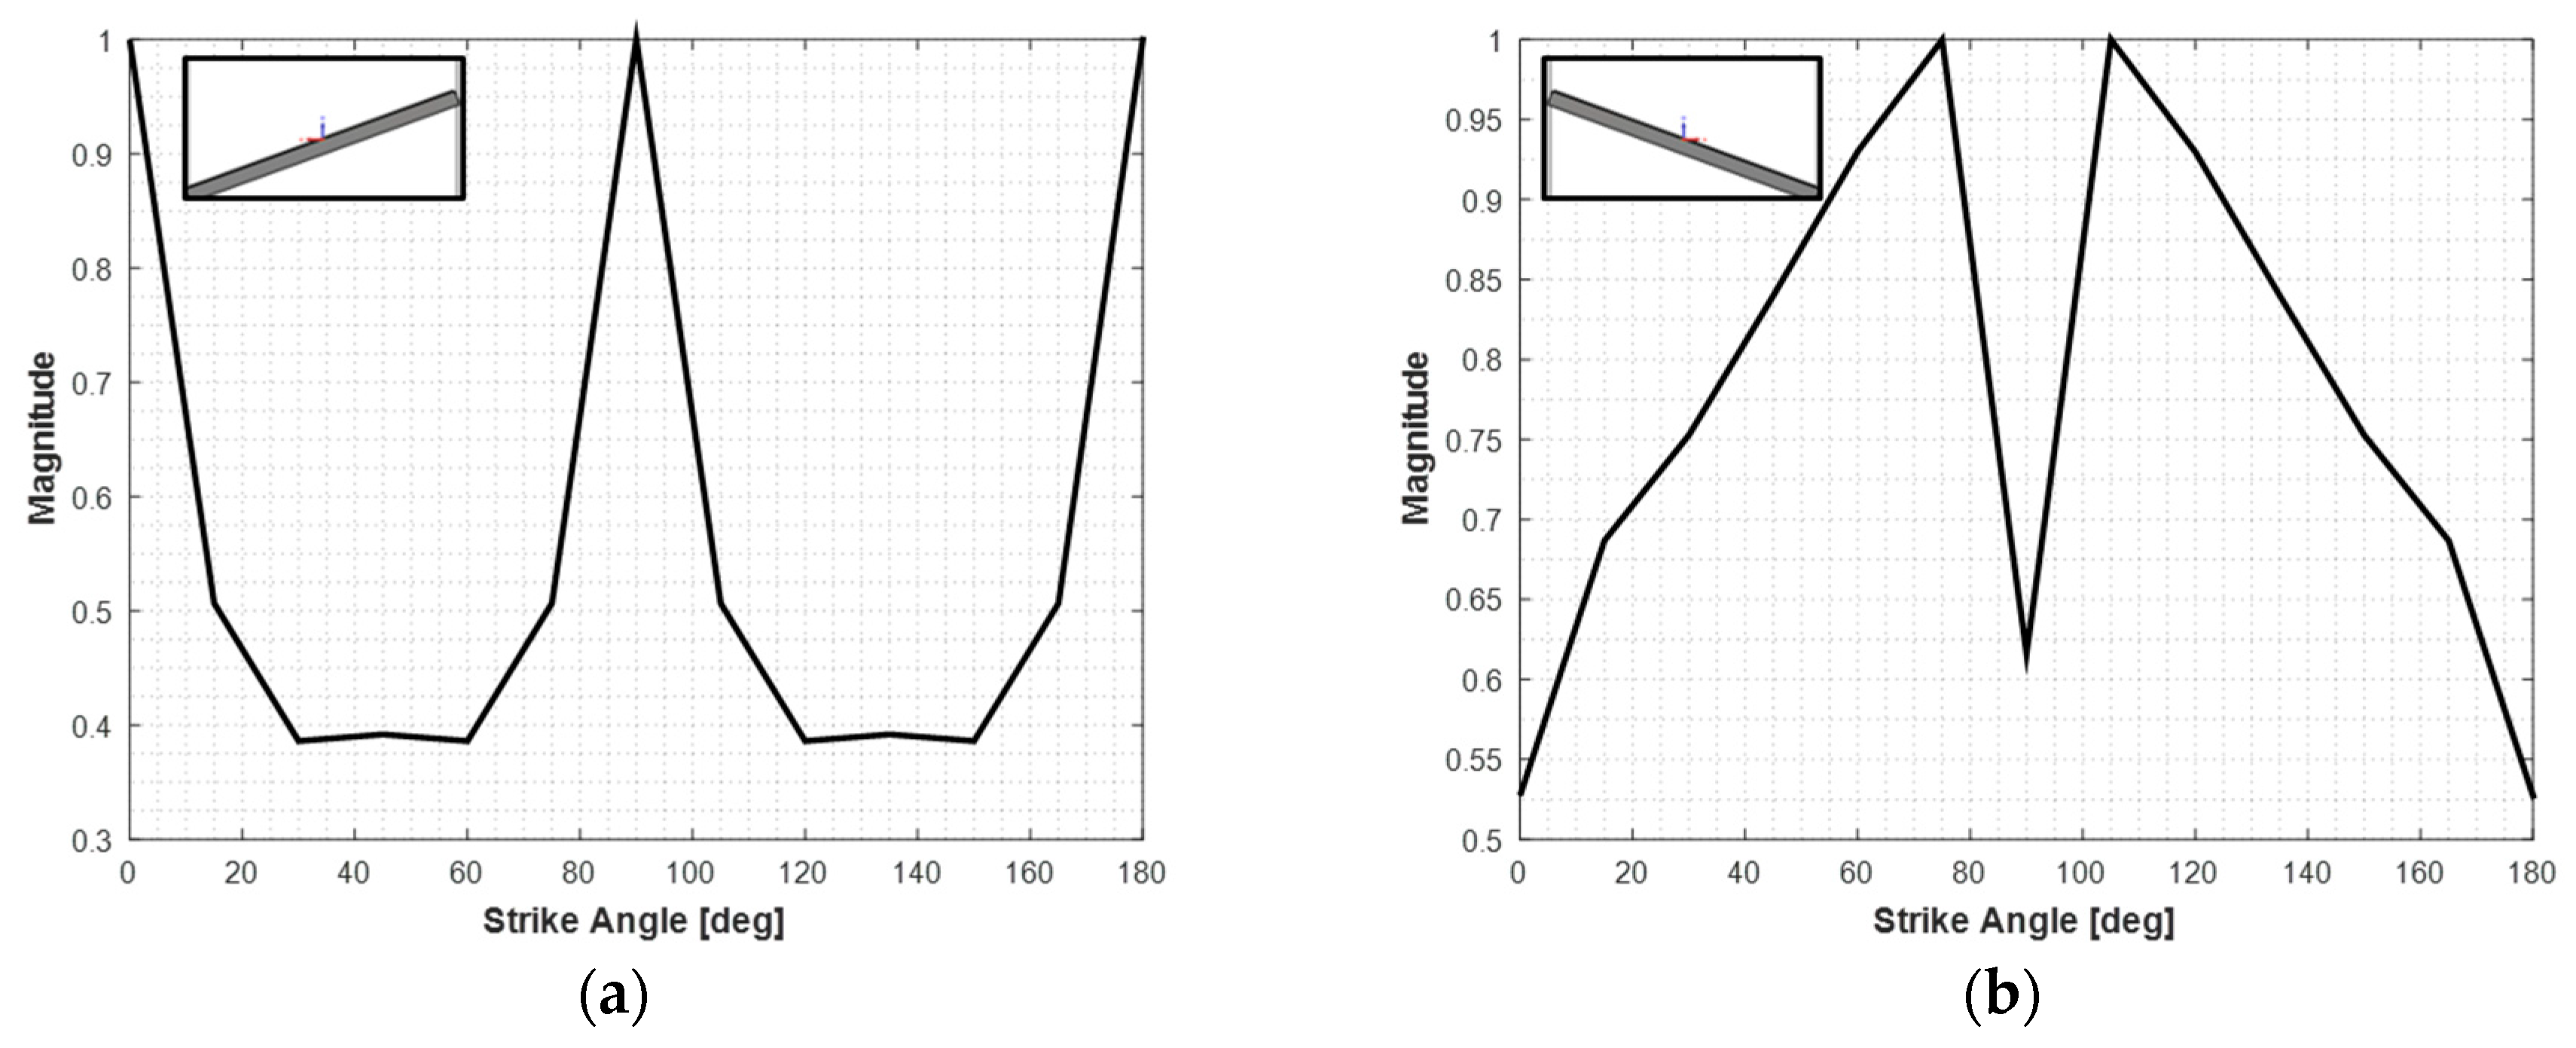
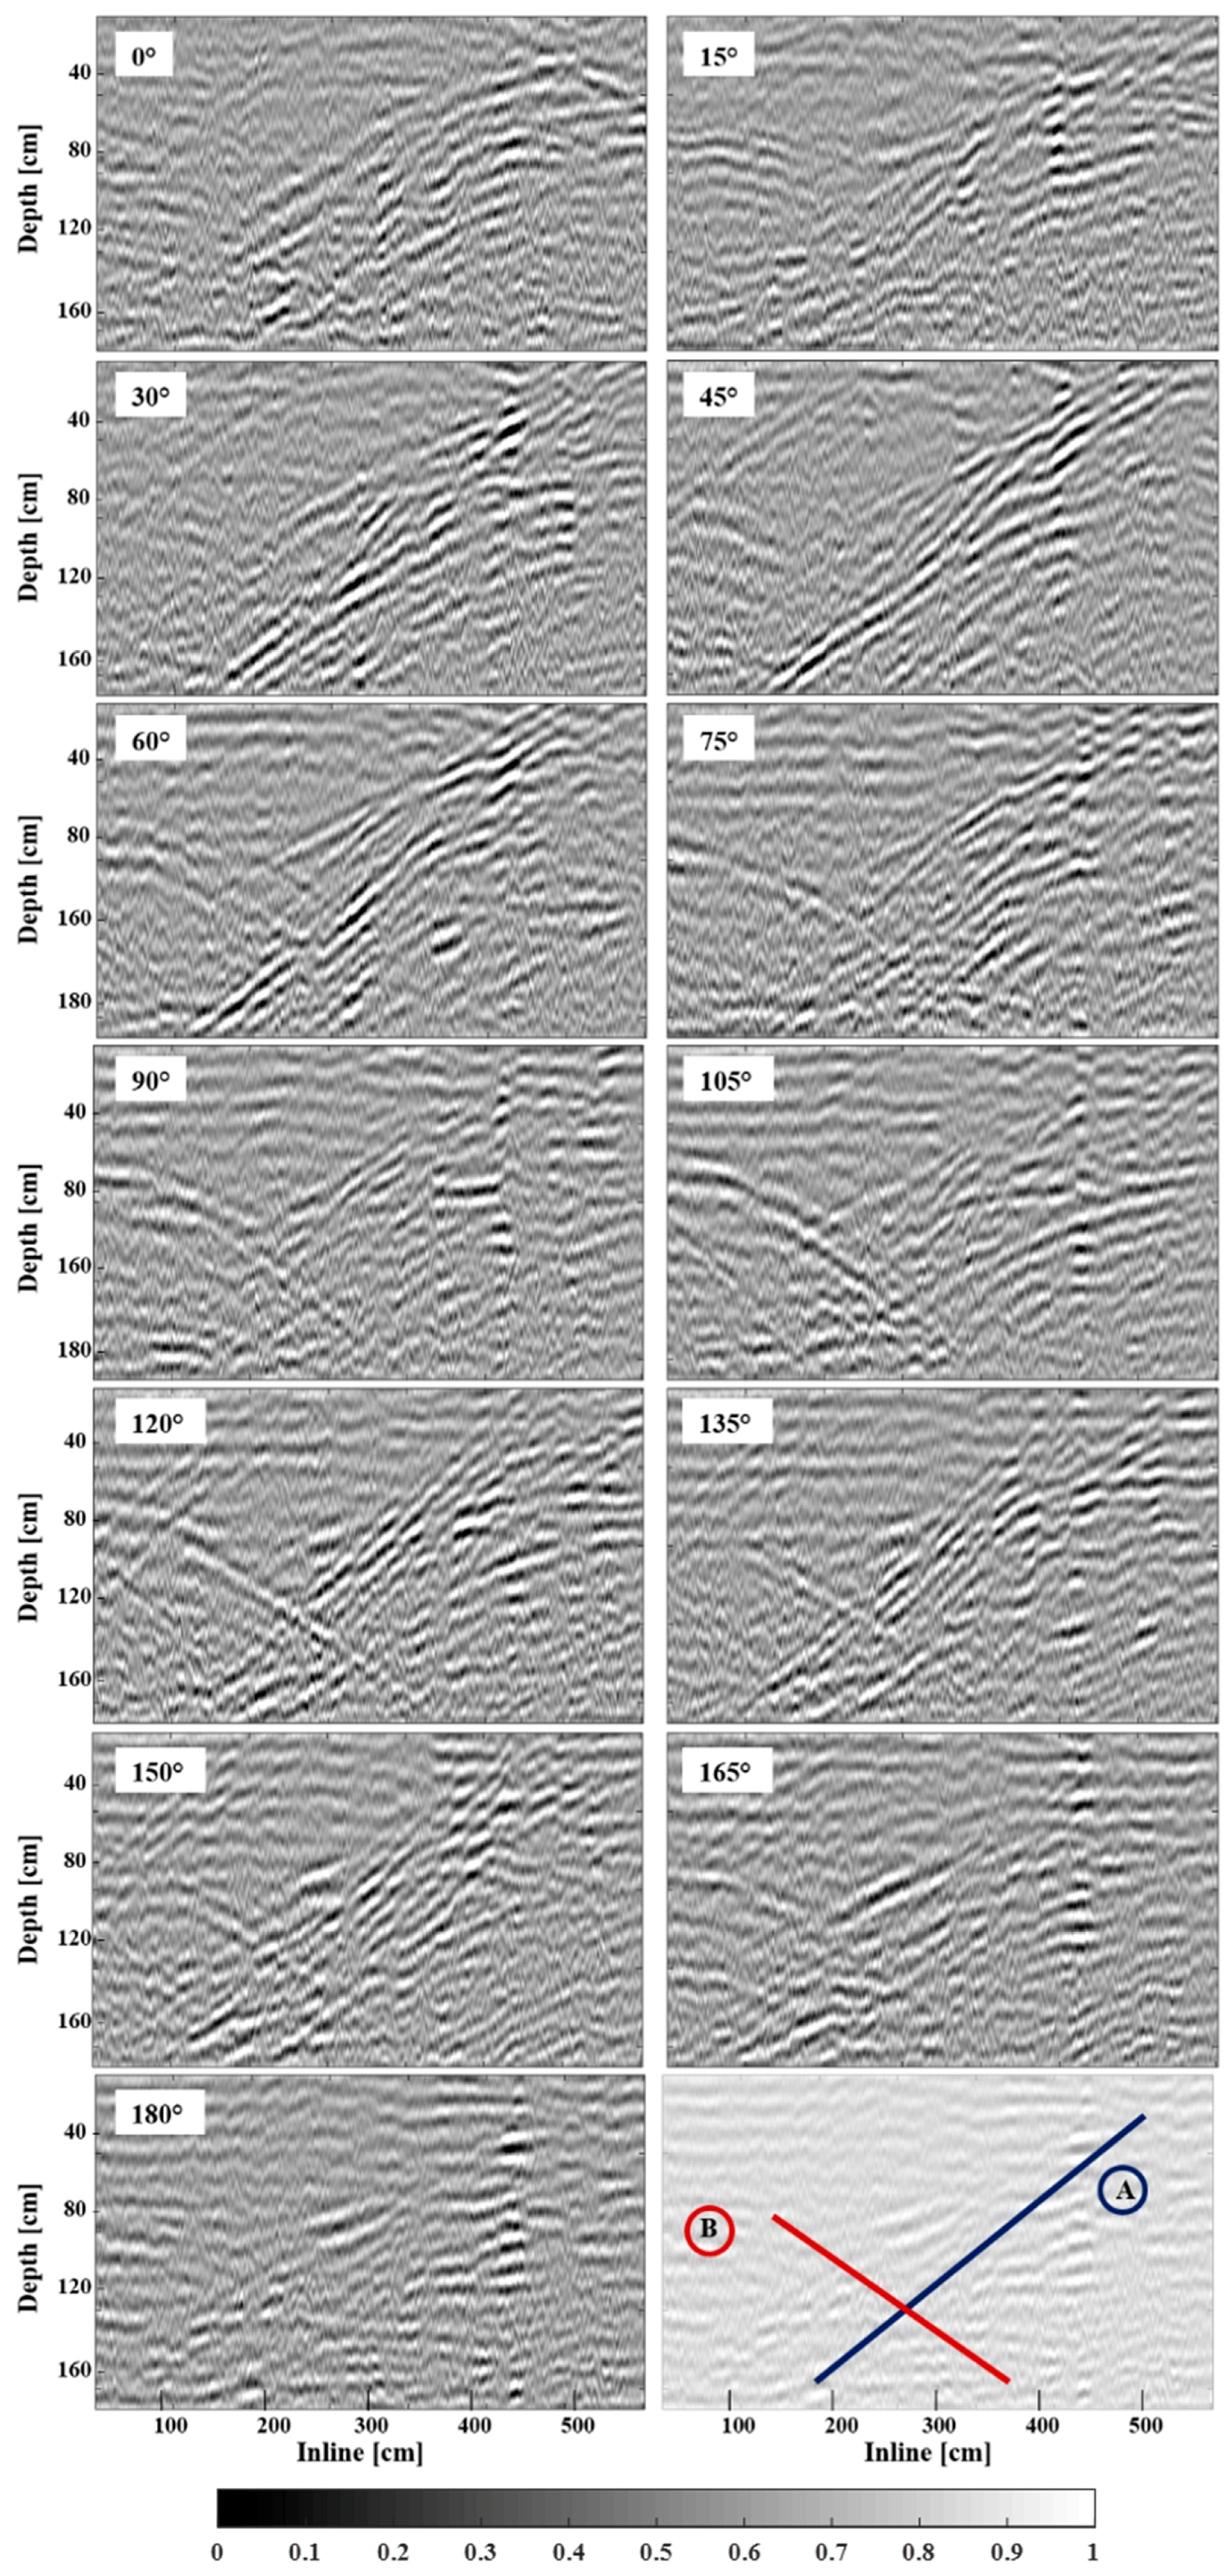
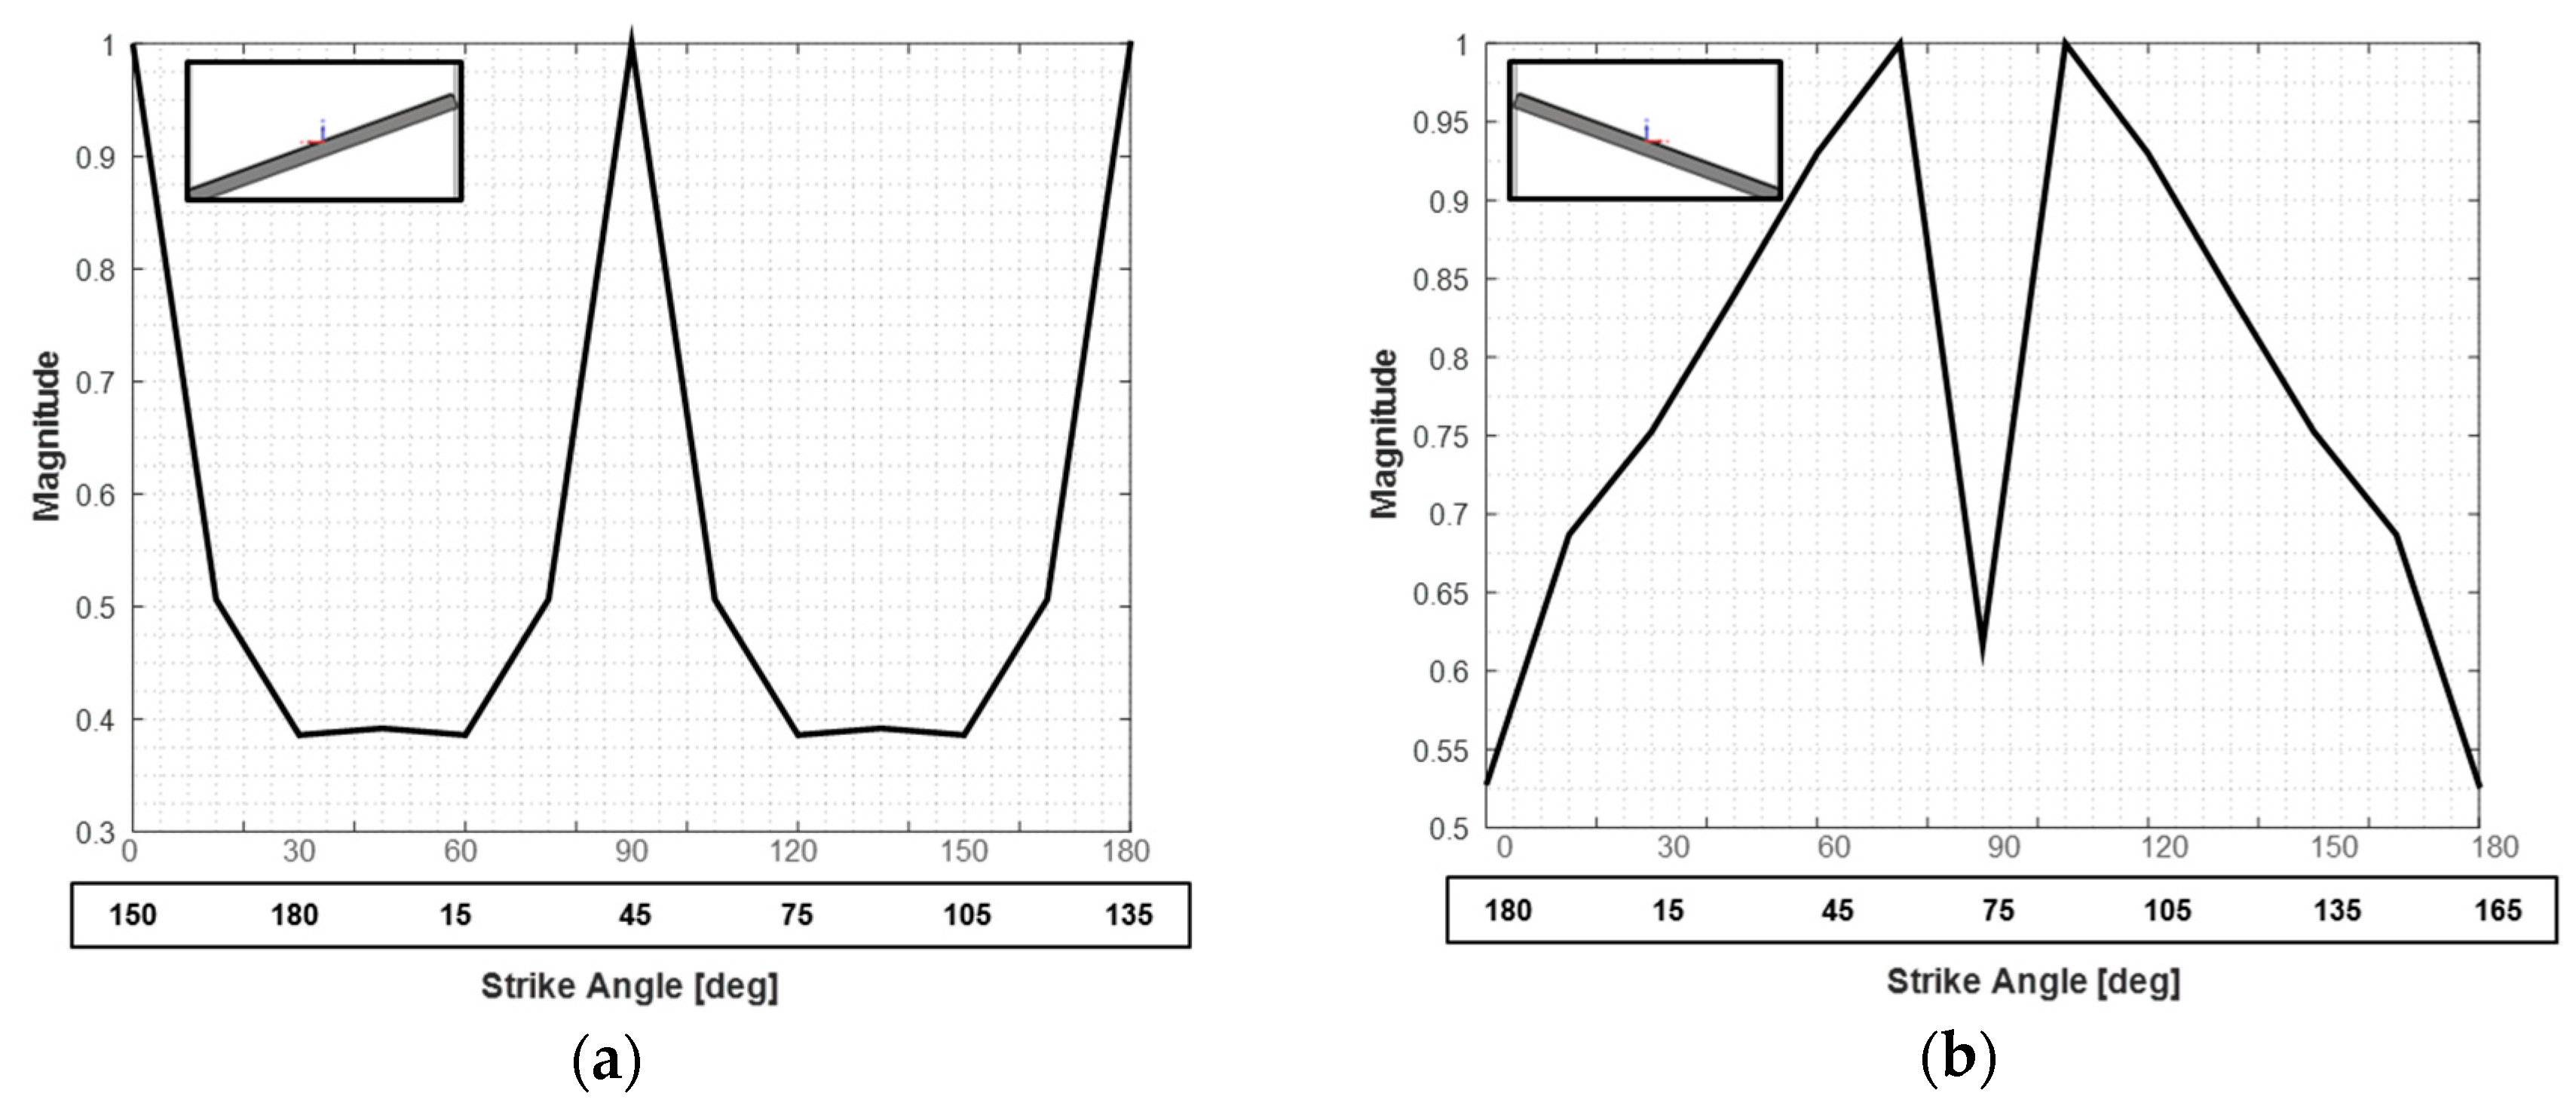
  • Experimental minima approximately located at 105 degrees and 180 degrees: In agreement with the theoretical graph (Figure 10a), in which the angular distance between the lowest values was approximately 80 degrees.
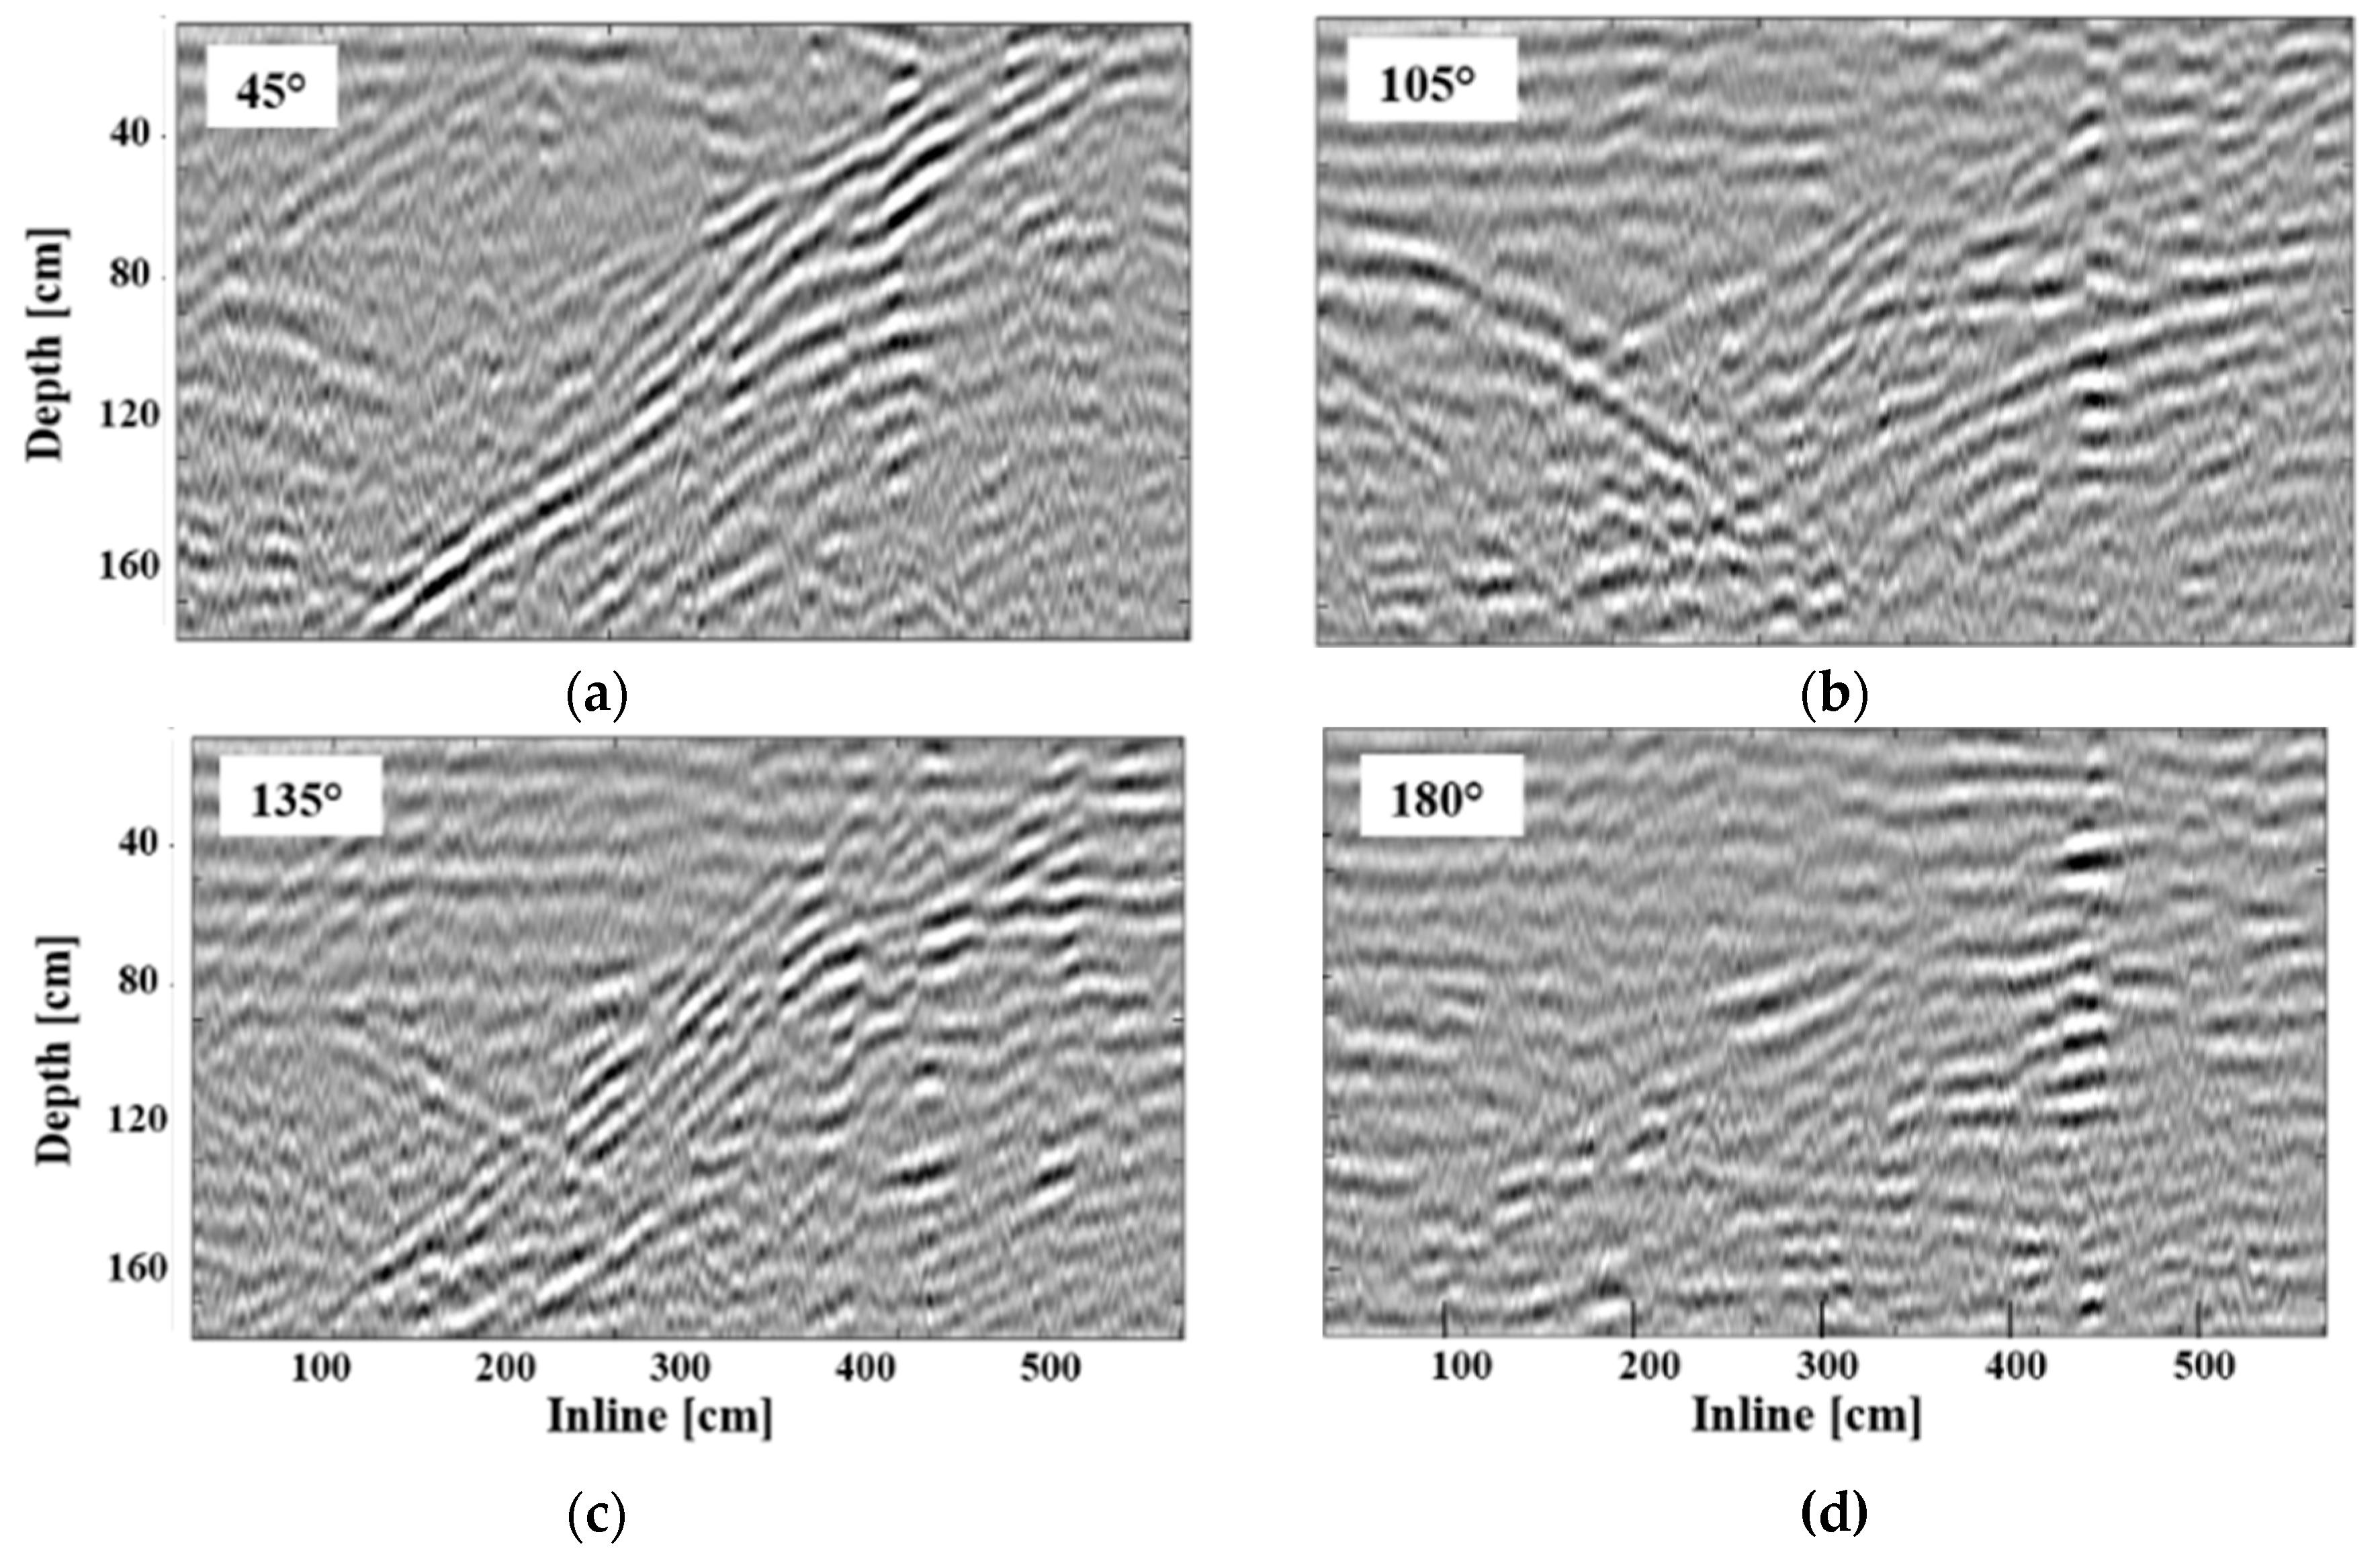
  • The fracture reached its highest value roughly at 45 degrees and 135 degrees, corresponding to an average angular deviation of 50 degrees from the two local minima.
Considering instead the fracture marked B (Figure 8):
  • Maximum response separation of approximately 45 degrees, in partial agreement with the simulated trend (difference of 30 degrees).
  • Noticeable reduction of the signature between these two points.
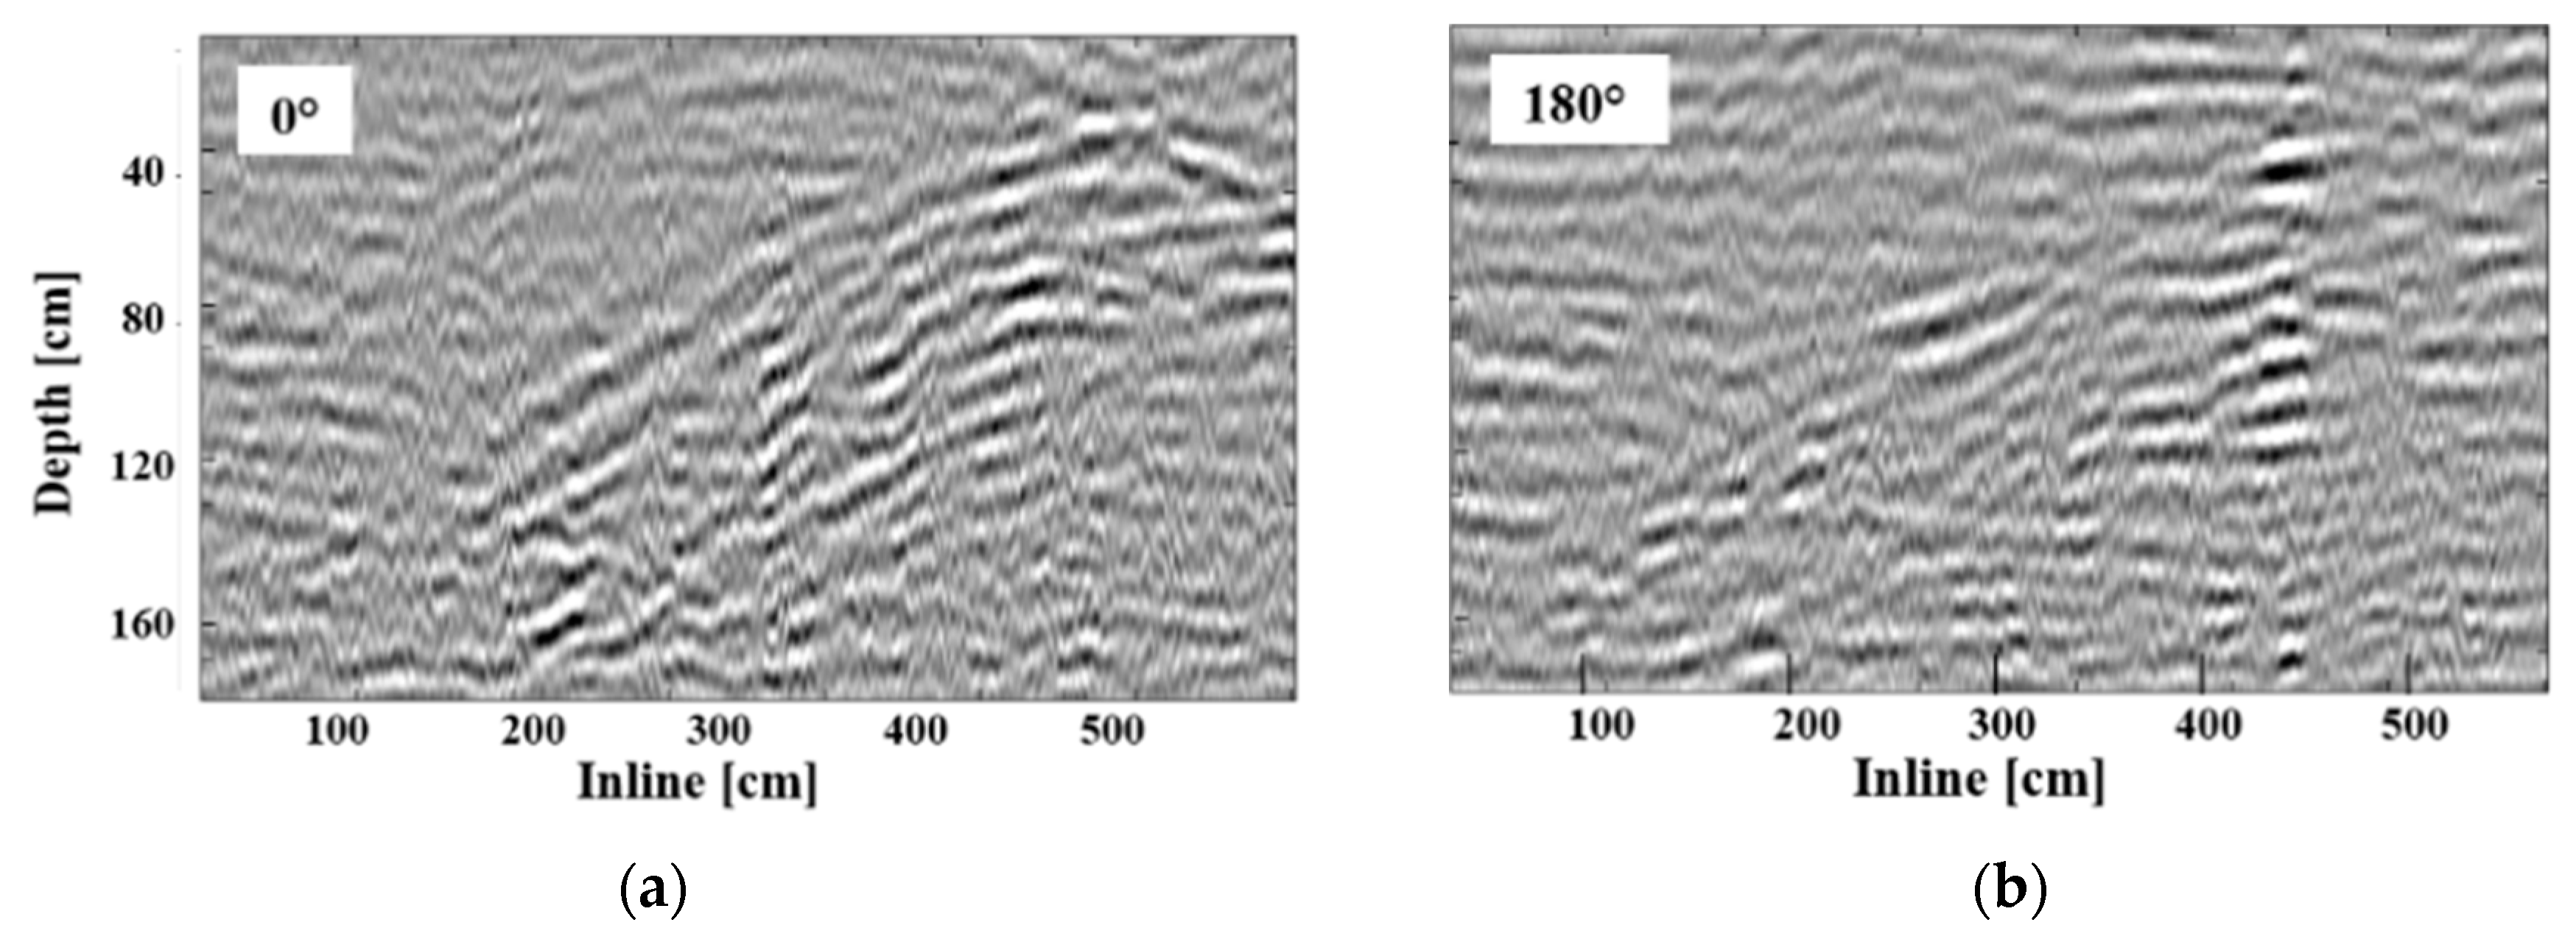
  • The fracture was completely missed in the first and last frames, corresponding to an angular difference from the maximum values of approximately 80 degrees.
The validation of these considerations is provided in Figure 11, in which the correspondences between the numerical model and the experimental results (Figure 6) were highlighted with an overlaying axis.
The two graphs demonstrate the close agreement and consistency between the theoretical results and the field ones, in particular regarding the pattern of the amplitude variations. The hypothesis on the single layer structure of the fracture marked B, and consequently on the more complex structure of the one marked A, was supported by the fact that also in the numerical model the boundary conditions were equivalent.
Finally, although the theoretical model showed a halved magnitude, the experimental data demonstrated that due to the further attenuation and absorption phenomena, the fracture may run the risk of being completely missed.

4. Conclusions

The research has addressed the effects that the GPR antenna orientation has on the imaging performance of subsurface fractures and dipping planes. The results show that the amplitude of the recorded signal was subjected to considerable variations depending on the alignment between the footprint of the antennas and the dip and strike angles of the target. In particular, the experimental results showed that a single profile collected at a single azimuth (or orientation) might be inadequate for ensuring a proper detection performance and for being able to clearly delineate the fracture plane. In the worst case, these losses reached up to half of the maximum received energy, and none of the multi-component schemes were able to fully compensate for this amplitude reduction.
Practically, this means that traditional GPR surveys can run the risk of completely missing a target or can lead to erroneous interpretation and reconstruction of the detected subsurface features, as no processing can recover these losses of information.
Conversely, a multi-azimuth scheme is capable of increasing the detection performance, at the same time allowing for the extraction of accurate information on the geometrical properties of the detected fracture, potentially leading to a comprehensive fracture network mapping.
The directional dependence of the reflection energy, due to the geometry of the reflector relative to the orientation of the antennas, can be employed to estimate the strike direction of the fracture to reduce ambiguity in the interpretation of a GPR profile.

Author Contributions

Conceptualization, F.L. and M.L.; data curation, F.L.; investigation, F.L.; methodology, F.L. and M.L.; project administration, M.L.; supervision, M.L.; writing original draft, F.L.; writing, reviewing and editing, M.L.

Funding

This research received no external funding.

Acknowledgments

Authors are grateful to IDS GeoRadar s.r.l. for supplying the georadar equipment used in the experimental campaign.

Conflicts of Interest

The authors declare no conflict of interest.

References

  1. Everett, M.E. Near-Surface Applied Geophysics; Cambridge University Press: Cambridge, UK, 2011. [Google Scholar] [CrossRef]
  2. Daniels, D.J. Ground Penetrating Radar, 2nd ed.; The Institution of Electrical Engineers: London, UK, 2004; Volume 1. [Google Scholar]
  3. Wai-Lok Lai, W.; Dérobert, X.; Annan, P. A review of Ground Penetrating Radar application in civil engineering: A 30-year journey from Locating and Testing to Imaging and Diagnosis. NDT E Int. 2018. [Google Scholar] [CrossRef]
  4. Zhao, W.; Forte, E.; Fontana, F.; Pipan, M.; Tian, G. GPR imaging and characterization of ancient Roman ruins in the Aquileia Archaeological Park, NE Italy. Measurement 2018. [Google Scholar] [CrossRef]
  5. Magalhães, A.J.C.; Lima-Filho, F.P.; Guadagnin, F.; Silva, V.A.; Teixeira, W.L.E.; Souza, A.M.; Raja Gabaglia, G.P.; Catuneanu, O. Ground penetrating radar for facies architecture and high-resolution stratigraphy: Examples from the Mesoproterozoic in the Chapada Diamantina Basin, Brazil. Mar. Pet. Geol. 2017. [Google Scholar] [CrossRef]
  6. Lombardi, F.; Griffiths, H.D.; Wright, L.; Balleri, A. Dependence of landmine radar signature on aspect angle. IET Radar Sonar Navig. 2017. [Google Scholar] [CrossRef]
  7. Crosta, G.B.; Agliardi, F.; Rivolta, C.; Alberti, S.; Dei Cas, L. Long-term evolution and early warning strategies for complex rockslides by real-time monitoring. Landslides 2017. [Google Scholar] [CrossRef]
  8. Crosta, G.B.; Dal Negro, P.; Frattini, P. Soil slips and debris flows on terraced slopes. Nat. Hazards Earth Syst. Sci. 2003. [Google Scholar] [CrossRef]
  9. Baek, S.H.; Kim, S.S.; Kwon, J.S.; Um, E.S. Ground penetrating radar for fracture mapping in underground hazardous waste disposal sites: A case study from an underground research tunnel, South Korea. J. Appl. Geophys. 2017. [Google Scholar] [CrossRef]
  10. Zanzi, L.; Hojat, A.; Ranjbar, H.; Karimi-Nasab, S.; Azadi, A.; Arosio, D. GPR measurements to detect major discontinuities at Cheshmeh-Shirdoosh limestone quarry, Iran. Bull. Eng. Geol. Environ. 2017. [Google Scholar] [CrossRef]
  11. Arosio, D. Rock fracture characterization with GPR by means of deterministic deconvolution. J. Appl. Geophys. 2016. [Google Scholar] [CrossRef]
  12. Dorn, C.; Linde, N.; Doetsch, J.; Le Borgne, T.; Bour, O. Fracture imaging within a granitic rock aquifer using multiple-offset single-hole and cross-hole GPR reflection data. J. Appl. Geophys. 2012. [Google Scholar] [CrossRef]
  13. Grasmueck, M.; Quintà, M.C.; Pomar, K.; Eberli, G.P. Diffraction imaging of sub-vertical fractures and karst with full-resolution 3D Ground-Penetrating Radar. Geophys. Prospect. 2013. [Google Scholar] [CrossRef]
  14. Mcclymont, A.F.; Green, A.G.; Streich, R.; Horstmeyer, H.; Tronicke, J.; Nobes, D.C.; Pettinga, J.; Campbell, J.; Langridge, R. Visualization of active faults using geometric attributes of 3D GPR data: An example from the Alpine Fault Zone, New Zealand. Geophysics 2008. [Google Scholar] [CrossRef]
  15. Zhao, W.; Forte, E.; Fontolan, G.; Pipan, M. Advanced GPR imaging of sedimentary features: Integrated attribute analysis applied to sand dunes. Geophys. J. Int. 2018. [Google Scholar] [CrossRef]
  16. Pipan, M.; Forte, E.; Dal Moro, G.; Sugan, M.; Finetti, I. Multifold ground-penetrating radar and resistivity to study the stratigraphy of shallow unconsolidated sediments. Lead Edge 2016. [Google Scholar] [CrossRef]
  17. Baker, M.P. Ground-Penetrating Radar Imaging of Fluid Flow through a Discrete Fracture. Ph.D. Thesis, University of Kansas, Lawrence, KS, USA, 2014. [Google Scholar]
  18. Tsoflias, G.P.; Perll, C.; Baker, M.; Becker, M.W. Cross-polarized GPR imaging of fracture flow channeling. J. Earth Sci. 2015. [Google Scholar] [CrossRef]
  19. Villela, A.; Romo, J.M. Invariant properties and rotation transformations of the GPR scattering matrix. J. Appl. Geophys. 2013. [Google Scholar] [CrossRef]
  20. Radzevicius, S.J.; Daniels, J.J. Ground Penetrating Radar Polarization and Scattering from Cylinders. J. Appl. Geophys. 2000, 45, 111–125. [Google Scholar] [CrossRef]
  21. Daniels, J.J.; Wielopolski, L.; Radzevicius, S.; Bookshar, J. 3D GPR Polarization Analysis for Imaging Complex Objects. Symp. Appl. Geophys. Eng. Environ. Probl. 2003. [Google Scholar] [CrossRef]
  22. Lualdi, M.; Lombardi, F. Combining orthogonal polarization for elongated target detection with GPR. J. Geophys. Eng. 2014. [Google Scholar] [CrossRef]
  23. Radzevicius, S.J.; Daniels, J.J.; Guy, E.D.; Vendl, M.A. Significance of crossed-dipole antennas for high noise environments. In Proceedings of the Symposium on the Application of Geophysics to Environmental and Engineering Problems, Washington, DC, USA, 21–24 February 2000. [Google Scholar]
  24. Lualdi, M.; Lombardi, F. Significance of GPR polarisation for improving target detection and characterisation. Nondestruct. Test. Eval. 2014. [Google Scholar] [CrossRef]
  25. Radzevicius, S.J.; Guy, E.D.; Daniels, J.J. Pitfalls in GPR data interpretation: Differentiating stratigraphy and buried objects from periodic antenna and target effects. Geophys. Res. Lett. 2000. [Google Scholar] [CrossRef]
  26. Roberts, R.L.; Daniels, J.J. Analysis of GPR Polarization Phenomena. J. Environ. Eng. Geophys. 1996. [Google Scholar] [CrossRef]
  27. Kruk, J.; Van Der Wapenaar, C.P.A.; Fokkema, J.T.; van den Berg, P.M. Three-dimensional imaging of multicomponent ground-penetrating radar data. Geophysics 2003. [Google Scholar] [CrossRef]
  28. Lehmann, F.; Boerner, D.E.; Holliger, K.; Green, A.G. Multicomponent georadar data: Some important implications for data acquisition and processing. Geophysics 2000. [Google Scholar] [CrossRef]
  29. Streich, R.; Van Der Kruk, J. Accurate imaging of Multicomponent GPR data based on exact radiation patterns. IEEE Trans. Geosci. Remote Sens. 2007. [Google Scholar] [CrossRef]
  30. Sassen, D.; Everett, M. 3D polarimetrci GPR coherency attributes and full-wave inversion of transmission data for charachterizing fractured rock. Geotech. Test. J. 2003. [Google Scholar] [CrossRef]
  31. Van Gestel, J.; Stoffa, P.L. Application of Alford rotation to ground-penetrating radar data. Geophysics 2001. [Google Scholar] [CrossRef]
  32. Mejia, D.R.; Young, R.A. Fracture orientation determination in sedimentary rocks using multicomponent ground-penetrating radar measurements. Lead Edge 2007, 26, 1010–1016. [Google Scholar] [CrossRef]
  33. Seol, S.J.; Kim, J.H.; Song, Y.; Chung, S.H. Finding the strike direction of fractures using GPR. Geophys. Prospect. 2001. [Google Scholar] [CrossRef]
  34. Tsoflias, G.P.; Gestel, J.; Van Stoffa, P.L.; Blankenship, D.D.; Sen, M. Vertical fracture detection by exploiting the polarization properties of ground-penetrating radar signals. Geophysics 2004. [Google Scholar] [CrossRef]
  35. Tsoflias, G.P.; Hoch, A. Investigating multi-polarization GPR wave transmission through thin layers: Implications for vertical fracture characterization. Geophys. Res. Lett. 2006. [Google Scholar] [CrossRef]
  36. Bernoulli, D.; Bichsek, M.; Bolli, H.M.; Haering, M.O.; Hochuli, P.A.; Kleboth, P. The Missaglia Megabed, a catastrophic deposit in the Upper Cretaceous Bergamo Flysch, Northern Italy. Eclogae Geol. Helv. 1981. [Google Scholar] [CrossRef]
  37. Bersezio, R.; Fornaciari, M.; Gelati, R.; Napolitano, A.; Valdisturlo, A. The significance of the Upper Cretaceous to Miocene clastic wedges in the deformation history of the Lombardian southern Alps. Géologie Alpine 1993, 69, 3–20. [Google Scholar]
  38. Yilmaz, Ö. Seismic Data Analysis: Processing, Inversion, and Interpretation of Seismic Data; Society of Exploration Geophysicists: Tulsa, OK, USA, 2001. [Google Scholar] [CrossRef]
Figure 1. Overview of the acquisition site: (a) Example of geological evidence; and (b) photograph of the survey site. The black arrow represents the survey line.
Geosciences 08 00425 g001
Figure 2. Acquisition campaign details: (a) Photograph of the survey process; (b) dedicated GPR platform, in which the mechanical protractor is visible below the antenna; and (c,d) examples of antenna rotation.
Geosciences 08 00425 g002
Figure 3. Simplified sketch of the survey geometry. TX is the transmitter, and RX is the receiver, while the survey line is indicated.
Geosciences 08 00425 g003
Figure 4. Simplified sketch of the employed nomenclature: (a) Strike angle; (b) dip angle; and (c) azimuth angle.
Geosciences 08 00425 g004
Figure 5. GPR data processing progression: (a) Time calibration; (b) frequency filtering; (c) amplitude equalization; and (d) time-to-depth conversion.
Geosciences 08 00425 g005aGeosciences 08 00425 g005b
Figure 6. Results of the multi-azimuth survey. Angles are marked in each frame and a schematic sketch is provided to aid in the visual identification and recognition process.
Geosciences 08 00425 g006
Figure 7. Highlight on fracture marked A: (a) Local maximum; (b) local minimum; (c) local maximum; and (d) local minimum.
Geosciences 08 00425 g007
Figure 8. Highlight on fracture marked B: (a) Local maximum; (b) local maximum; (c) local minimum; and (d) local minimum.
Geosciences 08 00425 g008
Figure 9. Highlights on the boundary conditions: (a) 0 degrees, starting point; and (b) 180 degrees, reverse case.
Geosciences 08 00425 g009
Figure 10. Numerical results, magnitude versus strike rotation: (a) Fracture marked A; and (b) fracture marked B.
Geosciences 08 00425 g010
Figure 11. Experimental validation. The bold lower axis represents the correspondence between the theoretical model and the field results: (a) Fracture marked A; and (b) fracture marked B.
Geosciences 08 00425 g011
Table 1. Acquisition and collection data details.
Frequency/BandwidthTime WindowTime SamplingInline SamplingAverage LengthAngular SamplingNumber of Profiles
600 MHz50 ns0.1 ns2 cm550 cm15 degrees13
Table 2. Numerical simulation details.
FrequencyFrequency SamplingCells per WavelengthPlane Dip AngleAngular Sampling
300 to 900 MHz0.006 MHz1020 degrees (fracture A)
160 degrees (fracture B)
15 degrees

