Article

Analysis of QualitySpec Trek Reflectance from Vertical Profiles of Taiga Snowpack

Finnish Meteorological Institute, Space and Earth Observation Centre, Tähteläntie 62, 99600 Sodankylä, Finland
*
Author to whom correspondence should be addressed.
Geosciences 2018, 8(11), 404; https://doi.org/10.3390/geosciences8110404
Submission received: 20 September 2018 / Revised: 26 October 2018 / Accepted: 1 November 2018 / Published: 6 November 2018
(This article belongs to the Special Issue Remote Sensing of Snow and Its Applications)

Abstract

:
Snow microstructure is an important factor for microwave and optical remote sensing of snow. One parameter used to describe it is the specific surface area (SSA), which is defined as the surface-area-to-mass ratio of snow grains. Reflectance at near infrared (NIR) and short-wave infrared (SWIR) wavelengths is sensitive to grain size and therefore also to SSA through the theoretical relationship between SSA and optical equivalent grain size. To observe SSA, the IceCube measures the hemispherical reflectance of a 1310 nm laser diode from the snow sample surface. The recently developed hand-held QualitySpec Trek (QST) instrument measures the almost bidirectional spectral reflectance in the range of 350–2500 nm with direct contact to the object. The geometry is similar to the Contact Probe, which was previously used successfully for snow measurements. The collected data set includes five snow pit measurements made using both IceCube and QST in a taiga snowpack in spring 2017 in Sodankylä, Finland. In this study, the correlation between SSA and a ratio of 1260 nm reflectance to differentiate between 1260 nm and 1160 nm reflectances is researched. The correlation coefficient varied between 0.85 and 0.98, which demonstrates an empirical linear relationship between SSA and reflectance observations of QST.

1. Introduction

The microstructure of snow is an important parameter for the modelling of microwave emission and optical reflectance [1,2,3], and it is therefore also important for remote sensing applications. However, a parameter describing all snow properties, including size, shape, bonding, and the orientation of snow grains, is not simple to define. The parameters most often used for that purpose are traditional grain size [4], correlation length [3,5], optical grain size [6,7], and specific surface area (SSA) [8,9]. Several methods exist to measure these directly or indirectly, but this study concentrates only on the reflectance-derived, in-situ methods.
Snow reflectance at near infrared (NIR) and short-wave infrared (SWIR) wavelengths, especially over 1000 nm, is dominated by grain size [6]. Optical effective grain size is defined as the diameter of spheres having equal optical properties compared with the original grains [6,10]. SSA is defined as the surface area of the air–ice interface per unit mass (unit m2 kg−1) [9,11]. Optical grain size and SSA are related by Equation (1):
  S S A = 6 ρ i c e   D 0  
where ρ i c e is the density of ice and D 0 is the optical grain size, which is derived based on equations in [9,12] as presented by [13]. Grain shape has been shown to affect the reflectance-derived SSA in many wavelengths [10,14,15], and [16] presented a modelling study concerning the influence of grain shape on albedo-derived SSA, resulting in 20–25% error.
DUal Frequency Integrating Sphere for Snow SSA (DUFISSS) was presented by [13]. It uses 1310 nm and 1550 nm lasers and an integrating sphere to measure hemispherical reflectance from the snow sample surface, which was converted to SSA [13,17]. The error of the SSA measurement was 10% based on [13]. The measurement method is similar to that of the IceCube, which is described in Section 2.2. The Profiler of Snow Specific Surface area Using SWIR reflectance Measurement (POSSSUM) and the Alpine Snow Specific Surface Area Profiler (ASSSAP) [18] are also based on the same principle. A contact spectroscopy method is presented by [7] to observe the optical grain diameter from a vertical profile of snowpack based on reflectance measurements of a band near 1030 nm by using a FieldSpec FR and attached modified Contact Probe (ASD Inc., Longmont, CO, USA). The derivation of optical grain size was based on an ice absorption model by [2]. The optical grain size and traditional grain size had poor correlation with less robust results for rounded grains, which is assumed to relate to the effect of grain shape. A review of past field experiments, where reflectance or albedo is compared to some of those parameters describing snow microstructure, is presented next.
Near infrared photography at 850–1000 nm is a method to observe SSA from reflectance as presented by [19]. The correlation between reflectance and SSA was reported to be 0.9 and the inaccuracy of SSA 15%. A clear correlation between hemispherical reflectance derived from measured nadir SWIR spectral reflectance of snow from FiedSpec FR 350–2500 nm (ASD Inc., Longmont, CO, USA) and SSA measured with Brunauer Emmett Teller (BET) analysis [9,20] was presented by [8]. Additionally, they did not find any effect from grain shape on the results. A correlation between grain size and a ratio of 1160 nm and 1260 nm hemispherical reflectance is showed by [21]. The accuracy of average grain size estimation was presented to be ±0.2 mm. Spectral albedo was measured with the Autosolexs instrument (400–1050 nm) to estimate SSA [22]. The accuracy of SSA depended on the solar zenith angle and the leveling of the instrument, and error was presented to be 15%. The SSA derived from Autosolexs had poor correlation with ASSSAP measurements; however, the wavelength and vertical resolutions of the instruments were different. The Automatic Spectro-Goniometer is presented for hemispherical–directional reflectance measurements [23]. The measurements were compared with Discrete Ordinates Radiative Transfer Program for a Multi-Layered Plane-Parallel Medium (DISORT)-modelled reflectance by using spheres with radii equal to the surface-area-to-volume ratio derived from stereological analysis, resulting in model underestimation with a maximum mean root-mean-square error (RMSE) of 0.09% for 1300 nm. A study where albedo was modelled with DISORT based on SSA measured with DUFISSS resulted in 1.1% difference to measured albedo with FieldSpec pro JR (ASD Inc., Longmont, CO, USA) [24]. It is estimated that 1% error in albedo corresponds approximately with 15 m2 kg−1 error in SSA [16]. In addition, the optical diameter of snow grains with data derived from near infrared photography or FieldSpec (ASD Inc., Longmont, CO, USA) spectral albedo or reflectance observations is researched by [25,26,27,28,29]. Grain size or size distribution was measured traditionally or from image-processing of microphotography.
The presented methods from previous studies are primarily intended for measuring reflectance from the surface of the snowpack, and they are not suitable for measuring vertical profiles except for contact spectroscopy with the Contact Probe and near-infrared photography. Since solar radiation is subject to variability, originating from, for example, zenith angle and cloud cover, it is beneficial that the instrument used includes an internal light source for stable illumination. A newly developed instrument, QST (ASD Inc., Longmont, CO, USA), was tested for performing rapid measurements of vertical snow profiles. The hand-held instrument measures almost bidirectional reflectance with similar optical geometry to that of the Contact Probe. The instrument was tested on taiga snowpack in the Arctic Space Centre of the Finnish Meteorological Institute in Sodankylä in northern Finland. QST has been used previously for other purposes such as the detection of ion concentrations in soil [30] and heavy metal pollution in soil [31]. Snow measurements are more challenging due to the deeper penetration depth of the radiation, the fragile structure of the snowpack, and melting of the snow.
Previous results of SSA measurements from a taiga snowpack in Sodankylä include the comparison of SSA and optical grain size to modelling results. The optical grain size derived from SSA measurements of IceCube was compared to SNOWPACK [32,33,34] modelled optical grain size in [35,36]. SNTHERM [37,38], SNICAR [39], and MOSES [40] modelled optical grain sizes were compared to IceCube-derived optical grain size by [37]. Moreover, the spectral reflectance of a taiga snowpack has previously been measured with a portable Field Spec pro JR spectrometer in the Sodankylä area and a similar mast-based spectrometer located at the same area as the measurements performed for this study [41,42]. In addition, measurements of bidirectional reflectance factor have been performed with a goniospectropolariphotometer [43,44].
The aim of this study was to test the suitability of the QST instrument for measuring the reflectance of snow, and the main conclusion of the study was that an empirical relationship between SSA and QST reflectance exists. The paper has the following structure: Section 2 presents field measurements and methods, results are presented in Section 3, and discussion is made in Section 4.

2. Materials and Methods

Snow measurements have been performed at the Intensive Observation Area (IOA) in Sodankylä in northern Finland since 2006 (Figure 1) for the calibration, validation, and development of remote sensing instruments and interpretation algorithms. Vegetation in the cleared area among sparse pine forests consists of lichen, moss, heather, crowberry, and lingonberry, whose growth rate is approximately 0.4 cm per year in the snow pit area [45]. Typically, the average maximum snow depth (~80 cm) occurs in late March. The average air temperature is below 0 °C from November to April, and the average wind speed is low (1–2 m s−1) in the area as described in [35]. Several automated instruments measuring snow, soil, radiation, and meteorological parameters are installed in the IOA, in addition to manually recorded snow pit measurements [35]. The data set for this study was taken from snow pit measurements made in spring 2017 (22 February, 7 March, 16 March, 21 March, and 3 April) with clear or partially cloudy sky conditions.

2.1. Layers, Traditional Grain Size, and Density

Horizontal layers of the snowpack were defined manually with a brush and toothpicks. Layers were defined according to visual appearance, grain type, grain size, hardness, and wetness. Macrophotography-based, traditional grain size, the largest extent of an average grain [4], was estimated from macro-photographs taken against a 1 mm reference grid. The density profile was measured every 5 cm with a 10 cm × 10 cm × 5 cm rectangular sampler and digital scale with ±1 g accuracy. More detailed information of the methods is presented by [35].

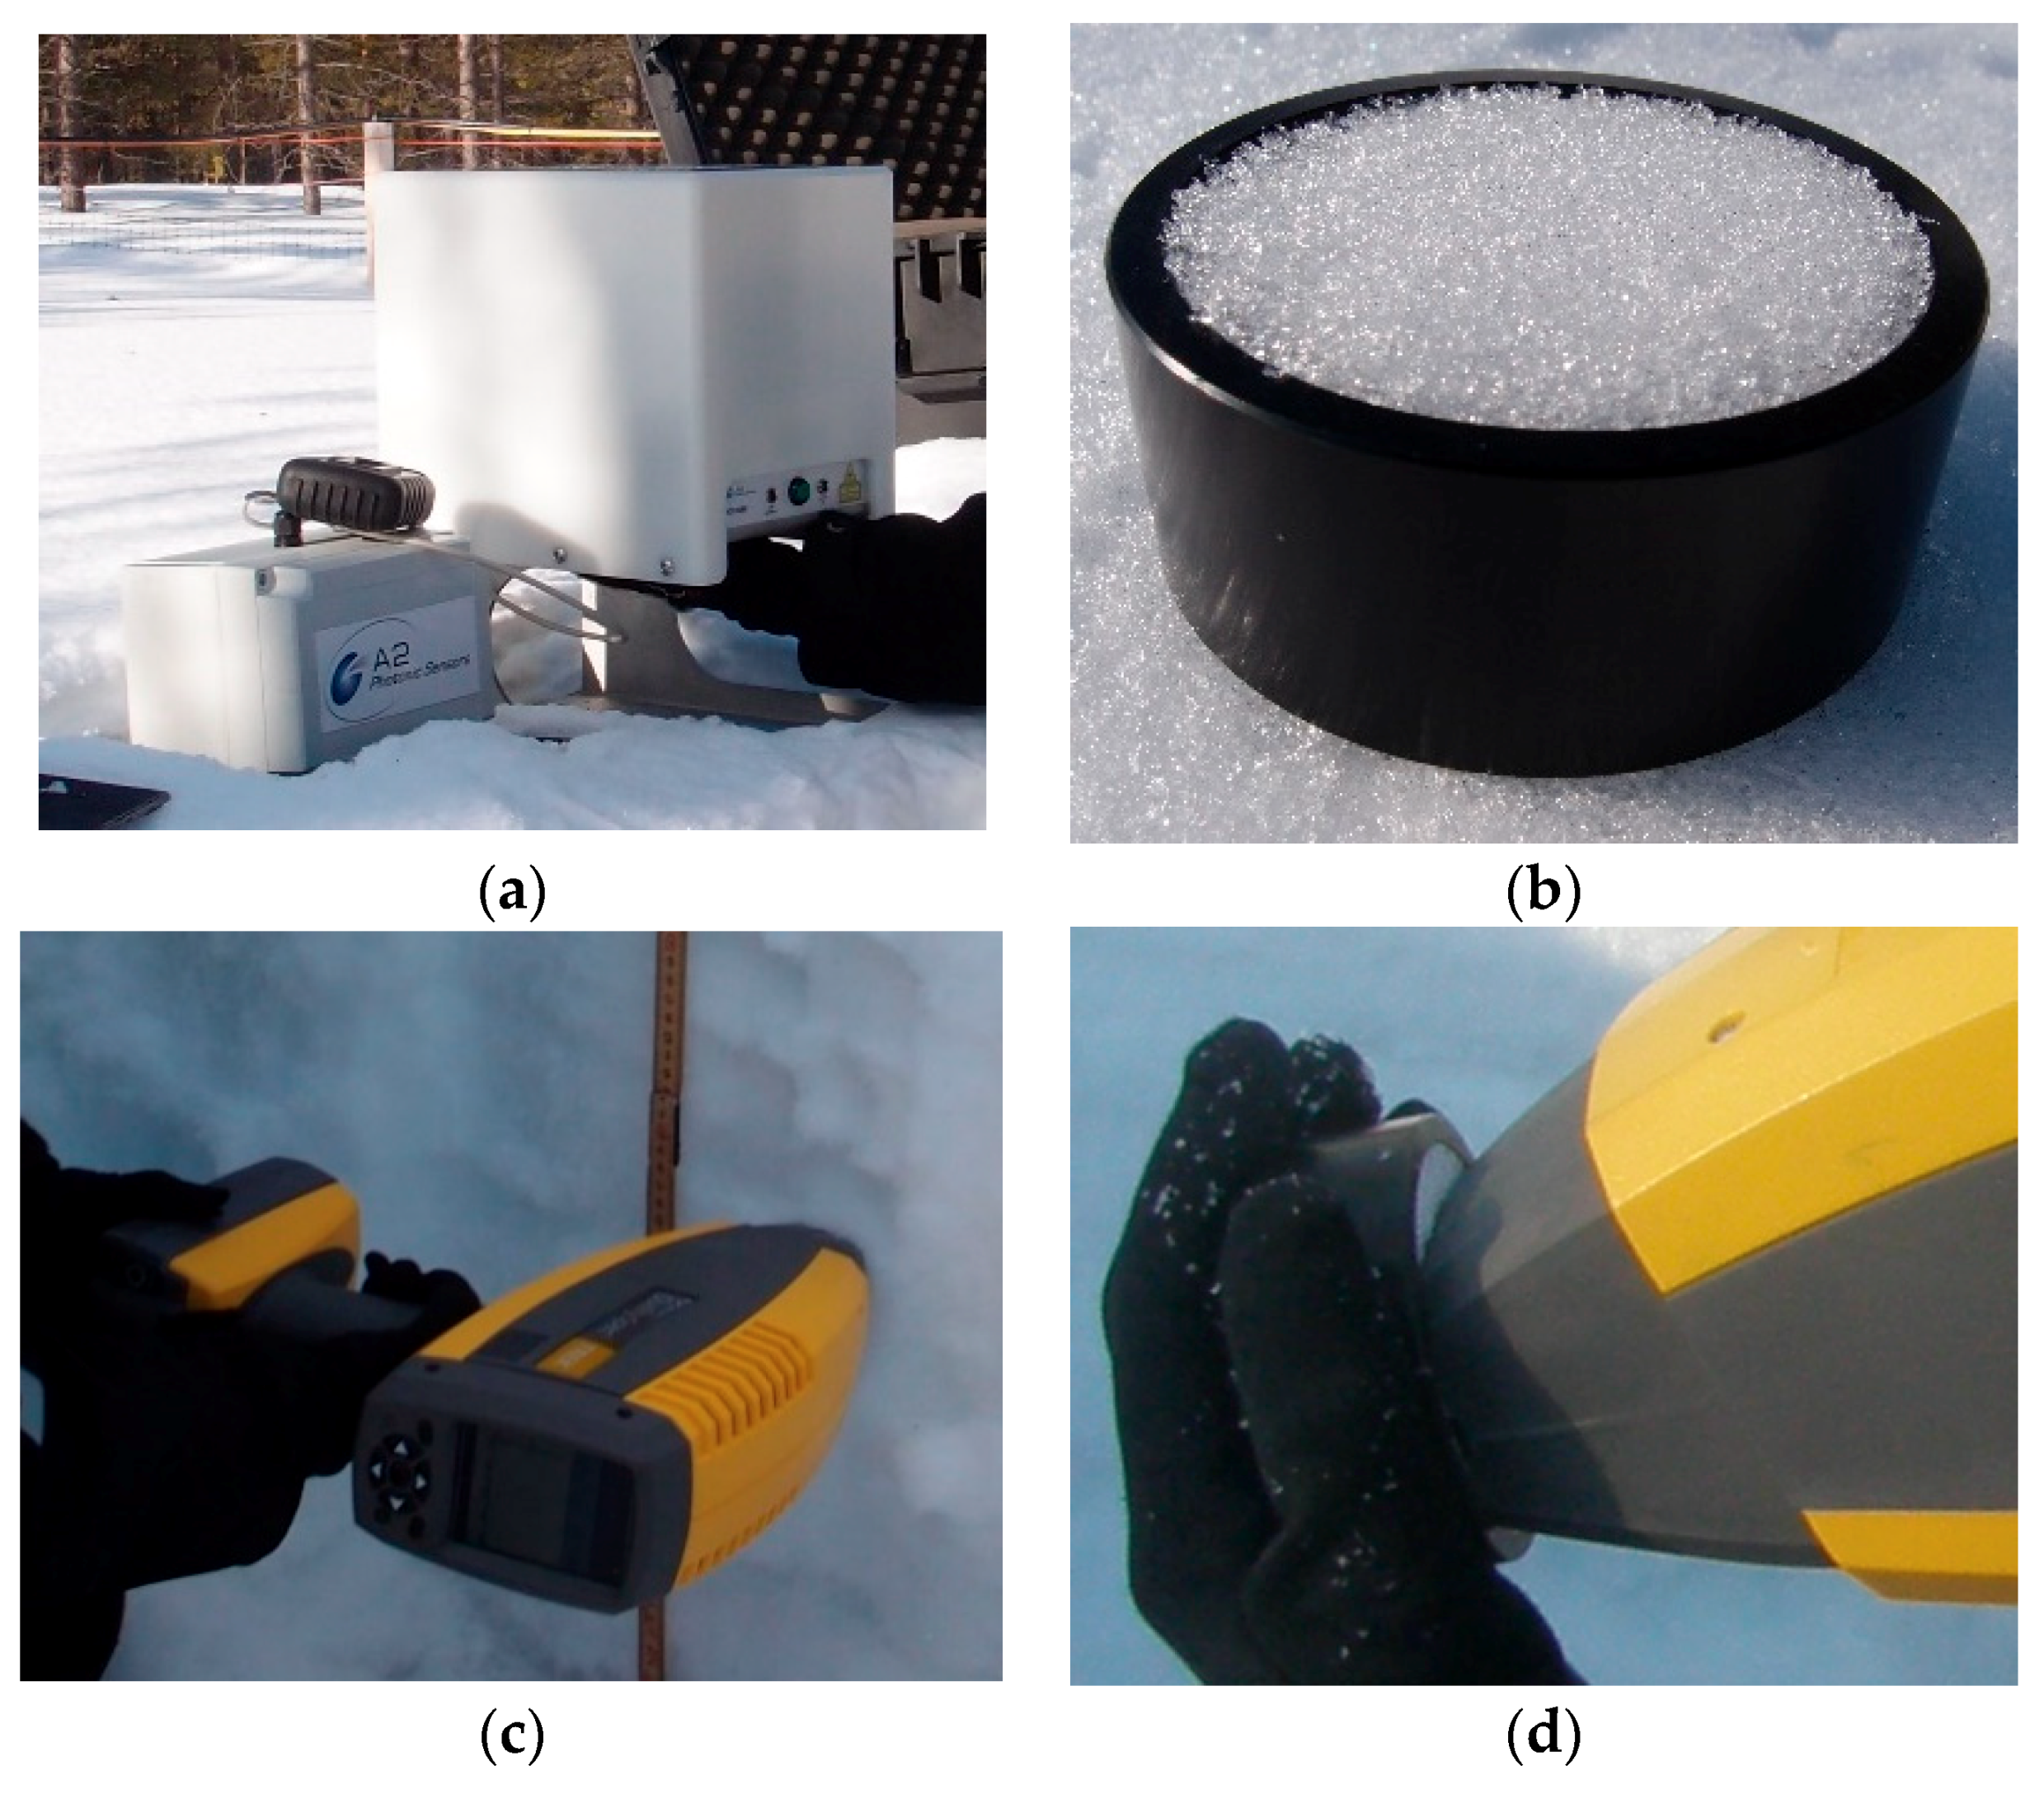
2.2. SSA with IceCube

The reflectance and SSA was observed with IceCube manufactured by A2 Photonic Sensors, Grenoble, France. IceCube measures the hemispherical reflectance of a 1310 nm laser from the snow sample surface (Figure 2a). A photodiode observes diffuse radiation from the integrating sphere originating from the laser and reflected from the sample. The snow sample is collected with a spatula (or a specific tool), packed into the sample holder to reach a minimum density of 200 kg m−3, and the surface is levelled (Figure 2b). The sample holder is 2.5 cm high and 6 cm in diameter. Software provided by the manufacturer converts the observed voltage value to reflectance using the calibration results. The instrument is calibrated for every measurement occasion using reference plates of different reflectivity. The calibration curve is fitted to the six calibration measurements. Determination of SSA from the reflectance is based on DISORT modelling and depends also on optical parameters of the integrating sphere [13]. In this study, the SSA samples were taken in 3 cm intervals from the vertical profile of the snowpack. A more detailed description of the IceCube measurement procedure is presented in [35] and a discussion on measurement errors is presented in [46].
Additional testing of the measurement accuracy occurred on 21 March 2017. The measurement of each sample from the profile was repeated three times with IceCube by rotating the sample in the azimuth direction between measurements. In addition, three samples were taken from both the surface layer and the depth hoar layer to test the effect of the sampling procedure and packing density. Those samples were also weighed to determine the sample density.

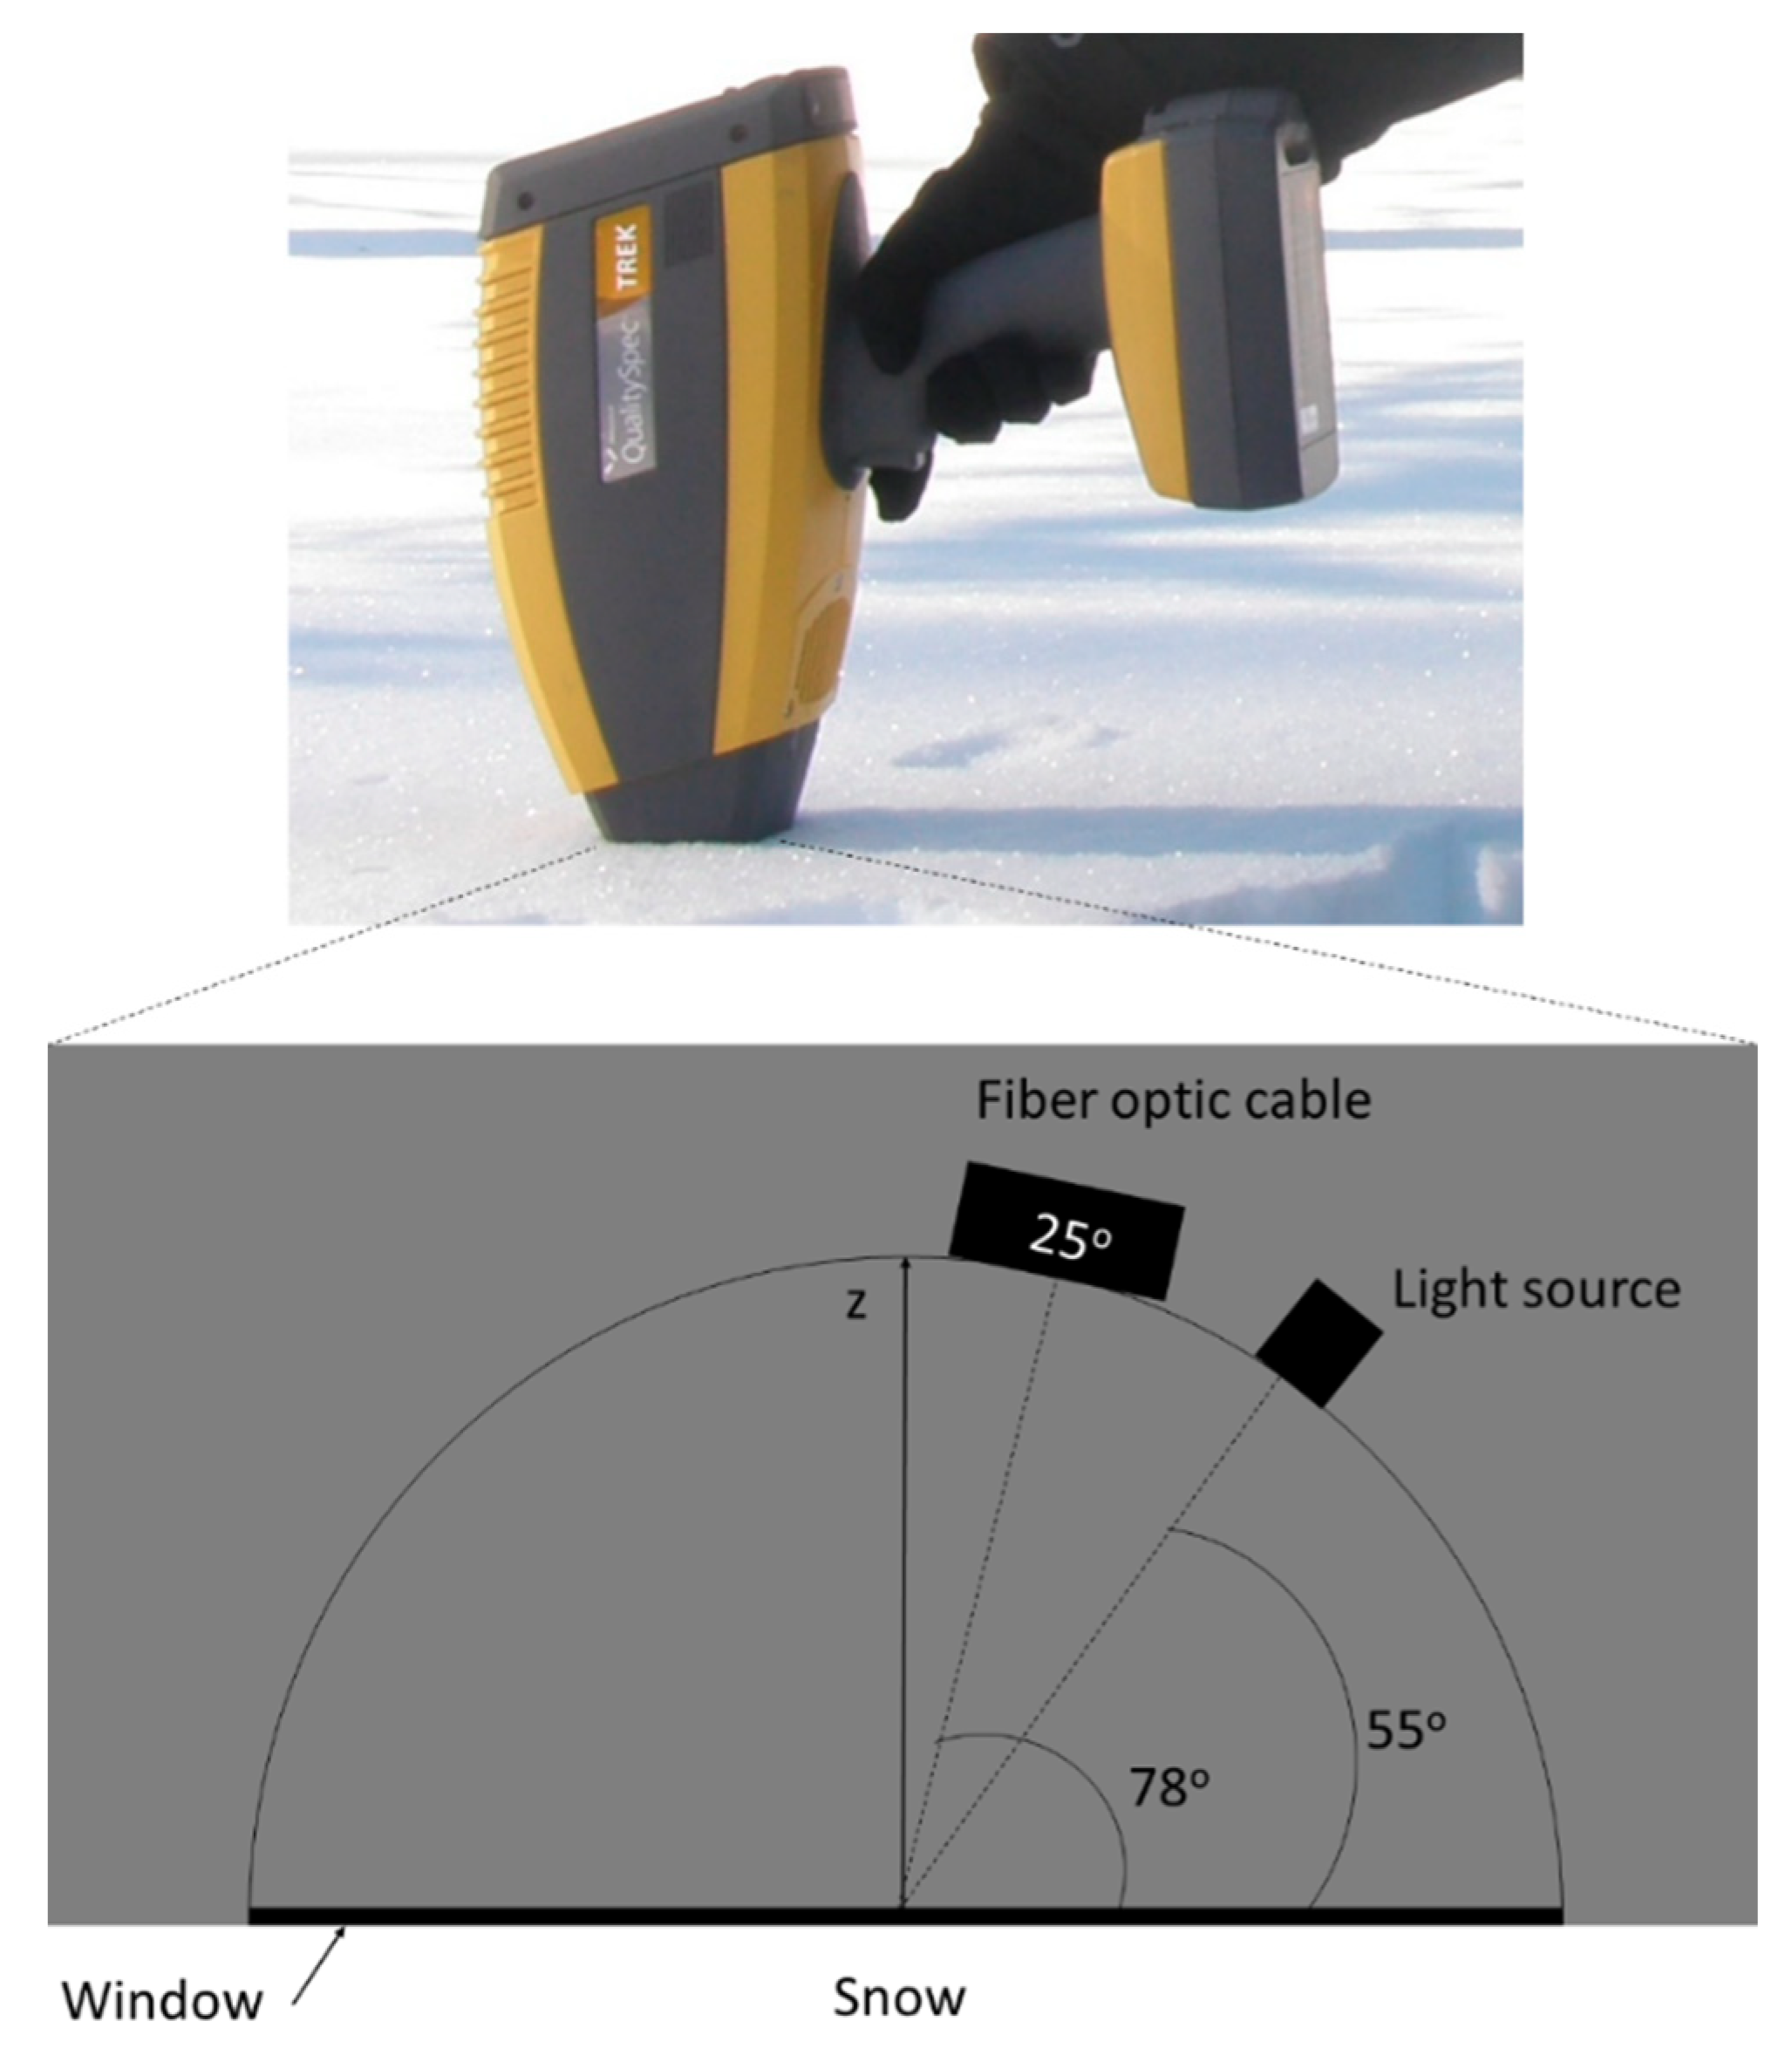
2.3. Reflectance with QualitySpec Trek

QST is a portable spectrometer manufactured by ASD Inc., Longmont, CO, USA (Figure 2c,d). QST measures the almost bidirectional reflectance of NIR and SWIR radiation at 350–2500 nm wavelengths with a spectral resolution of 9.8 nm at 1400 nm. The instrument has three detectors: 350–1000 nm (512-element silicon array), 1001–1785 nm (InGaAs photodiode), and 1786–2500 nm (InGaAs photodiode). The instrument also has an internal light source and internal gray scale reference for optimization and wavelength calibration. The light source is a Quartz Tungsten Halogen bulb with a color temperature of 2870 K ±33 K. Illumination and viewing geometry is presented in Figure 3. The window of QST is approximately 1 cm in diameter, and the whole window is illuminated by the internal light source. The window and materials inside the instrument are designed to minimize specular reflections. The angle from the instrument window to the light source is 55° and the angle to the fiber optic is 78°. The fiber optic cable has a field of view of 25°, which means that the field of view is 0.82 cm on the window of the instrument. The Contact Probe [7] has the same measurement geometry as QST. Additional calibration is made before every measurement occasion with a separate white reference plate. The reference plate is attached in front of the instrument window with magnetic plugs. It is important that the white reference plate is clean and that the manufacturer provides information for cleaning and replacing the plate. Full-spectrum dark reference is measured also during the start-up with an internal shutter, the light source is turned off, and the white reference is plugged. The dark reference (background) value is subtracted from raw data prior to the reflectance calculation. The sample count averaging time can be set to 1, 2, 5, or 10 s. The instrument scans the entire wavelength range 10 times per second and produces an average of those. The sample is set to physical contact with the instrument window (Figure 2c,d and Figure 3), so cleaning of the window between the measurements is therefore required. A measurement is stored by pushing a trigger button. Sound signals for starting and finishing the measurement notes when the instrument needs to be in stationary position with the (snow) sample. The most recent data is shown on the screen. Audio note recording is possible after the measurement. The instrument also stores coordinates and elevation from the internal GPS for each sample. Automatic and manual data storage options are available. The resulting reflectance is absolute reflectance (reflectance normalized with reference reflectance). Since the instrument is commercial, calibration data and data from the single spectrums before averaging are not available.
The measurement procedure included a white reference measurement, instrument setup (choosing how many times the wavelength range is scanned for averaging), and snow measurement (repeated). Cleaning of the window was rarely needed. Automatic data storage was used. The integration time for a measurement was set to 1 or 2 s. A longer integration time meant more averaged spectrums and therefore less noise for an acquisition. On the other hand, the instrument remained steadier in snow with a shorter integration time. Two procedures related to how the instrument can be used are (1) vertical reflectance profile from the snowpack of the snow pit wall and (2) reflectance from the snow surface without digging a snow pit. The measurements were made with the first procedure from the snowpack profile by pushing the instrument window steadily against the snow pit wall during the measurement (Figure 2c). The window had physical contact to the snow so that the distance between the snow and fiber optic cable was always constant and the measurement configuration did not change. The measurements were made at approximately 2–5 cm intervals from the vertical profile. Some of the IceCube samples were also measured with QST by pushing the window against the snow in the middle of the sample surface (Figure 2d).

2.4. Methods for Comparison of QST and IceCube Measurements

Reflectance profiles were measured with QST from both the snowpack and the sampled snow on 21 March and 3 April 2017. The two profiles were measured with different height intervals, and therefore both profiles were linearly interpolated for every centimeter (no extrapolation). A comparison presented in Section 3.3 was made only for the heights where both interpolated reflectance values existed.
The empirical relationship between SSA and reflectance was studied with 1160 and 1260 nm reflectance-dependent coefficient Q, which is the ratio of reflectance at the bottom of the ice absorption feature and the reflectance change in the ice absorption feature. The absorption coefficient of ice is larger at 1260 nm than at 1160 nm. Q is calculated with Equation (2) as
Q = R 1260 R 1160 R 1260  
where R 1160 is reflectance at 1160 nm and R 1260 is reflectance at 1260 nm.
Similarly, interpolation was also needed to compare SSA and reflectance-derived Q from the same heights of snow. Linear interpolation without extrapolation was made for SSA when the reflectance profiles from the snowpack were studied. For 21 March, the values from the first of the three SSA measurements of the same sample were used. The comparison presented in Section 3.4 was made with interpolated SSA values from the same heights as the original reflectance profile measurements from the snowpack. Interpolation was not needed in the case of the reflectance profile from sampled snow because the same samples were measured with both instruments.
Clearly erroneous reflectance values measured with QST were removed from the analysis (>0.1 difference to the closest value without fitting to other values around). One of those was from the snowpack profile in 16 March (63 cm height), another one was from the snowpack profile in 21 March (70 cm height), and the two last ones were from the sampled snow in 21 March (48 and 51 cm height).

3. Results

The data set includes vertical profile measurements of reflectance, SSA, macrophotography-based traditional grain size, and density from various snow types with varying grain size and density in a taiga snowpack. The snow height of 0 cm was set to the ground surface. The height of the snow and air temperature for spring 2017 are presented in Figure 4. An overview of all data used in the study is presented in Figure 5.

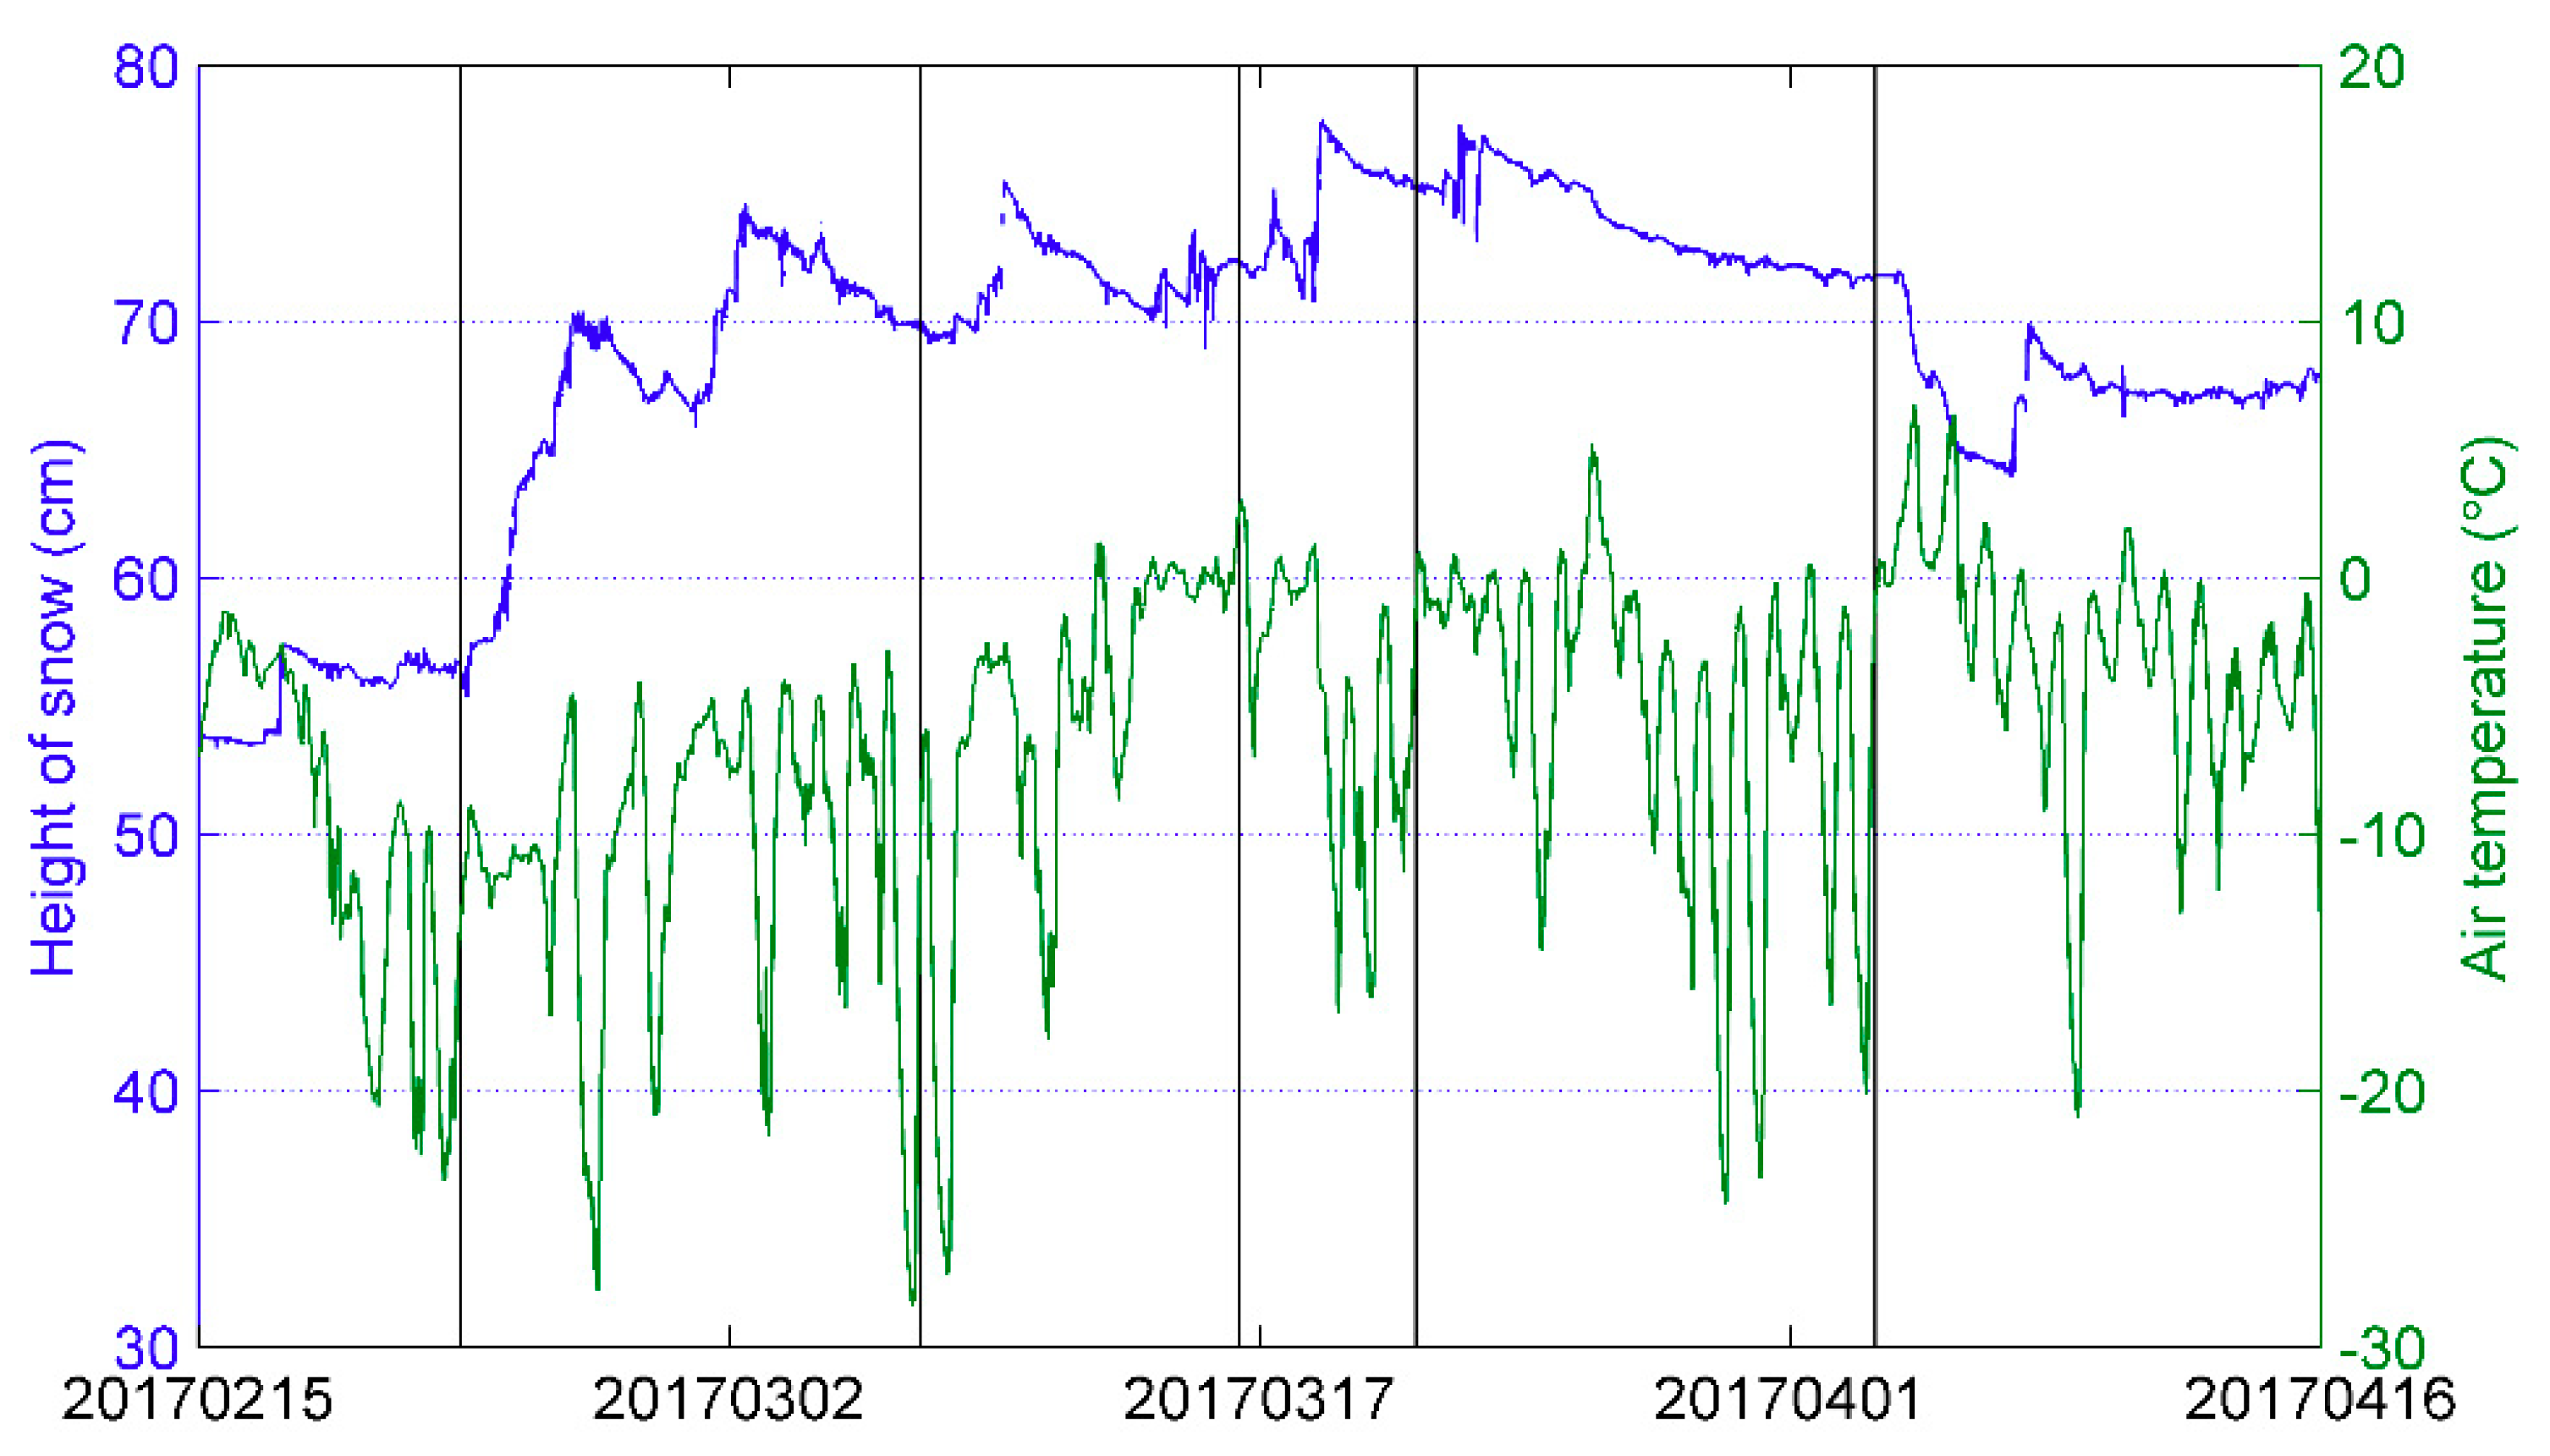
3.1. Snowpack Properties

The height of snow increased before 21 March and melting had already started in 3 April, as shown in Figure 4. The air temperature was close to zero or positive (in °C) on 16 March, 21 March, and 3 April. Layer properties had temporal variations; however, there were some lasting similarities. The hard crust layer at approximately 30 cm height (red in Figure 5c) was observed in all snow pits. The traditional grain size was larger below than above that layer, which is typical, because grain growth is largest at the bottom due to the higher temperature gradient. Between 30–40 cm height of snow, the grain shape changed from round (pink in Figure 5c) to faceted (light blue in Figure 5c), and grain size increased simultaneously. In mid-winter, the bottom layers consisted of smaller grains than in the layers above those. Typically, traditional grain size was larger in faceted crystal and depth hoar layers than layers with rounded grains, as expected based on the temperature gradient. Density was lowest in the top 5–15 cm of the snowpack. Maximum density was found in the 5–15 cm bottom layer of the snowpack, and in the crust layer around 30–40 cm height. Based on those observations, the reflectance and SSA measurements were made at differing air temperatures and snow conditions with variating grain size, grain type, and density.

3.2. Repeatability of SSA Measurements

Repeatability of the SSA measurements with IceCube was tested to confirm the reliability of observations for the following analysis. First, the measurement method was tested by repeating measurements with the same sample; then, sampling was tested by sampling snow to different densities. The repeatability of the IceCube measurement method was tested on 21 March 2017. Every sample from the profile was measured three times with IceCube. The mean standard deviation of the SSA was 0.34 m2 kg−1, which means a relative standard deviation (RSD) of 2.0%. RSD is calculated by Equation (3)
R S D = 100   σ / μ  
where σ is the standard deviation and µ is the average. The repeatability of IceCube sampling was also tested on 21 March 2017. Precipitation particles in the surface layer and faceted crystals in the bottom of the snowpack were both sampled three times. The samples were taken next to each other so that snow was as homogenous as possible for all the samples. The samples were packed to different densities, measured with IceCube and weighed for density calculation. The average standard deviation was 0.65 and RSD was 2.85% (Table 1). Since the total RSD was low (<5%), SSA is relied on as a truthful value in the subsequent analysis.

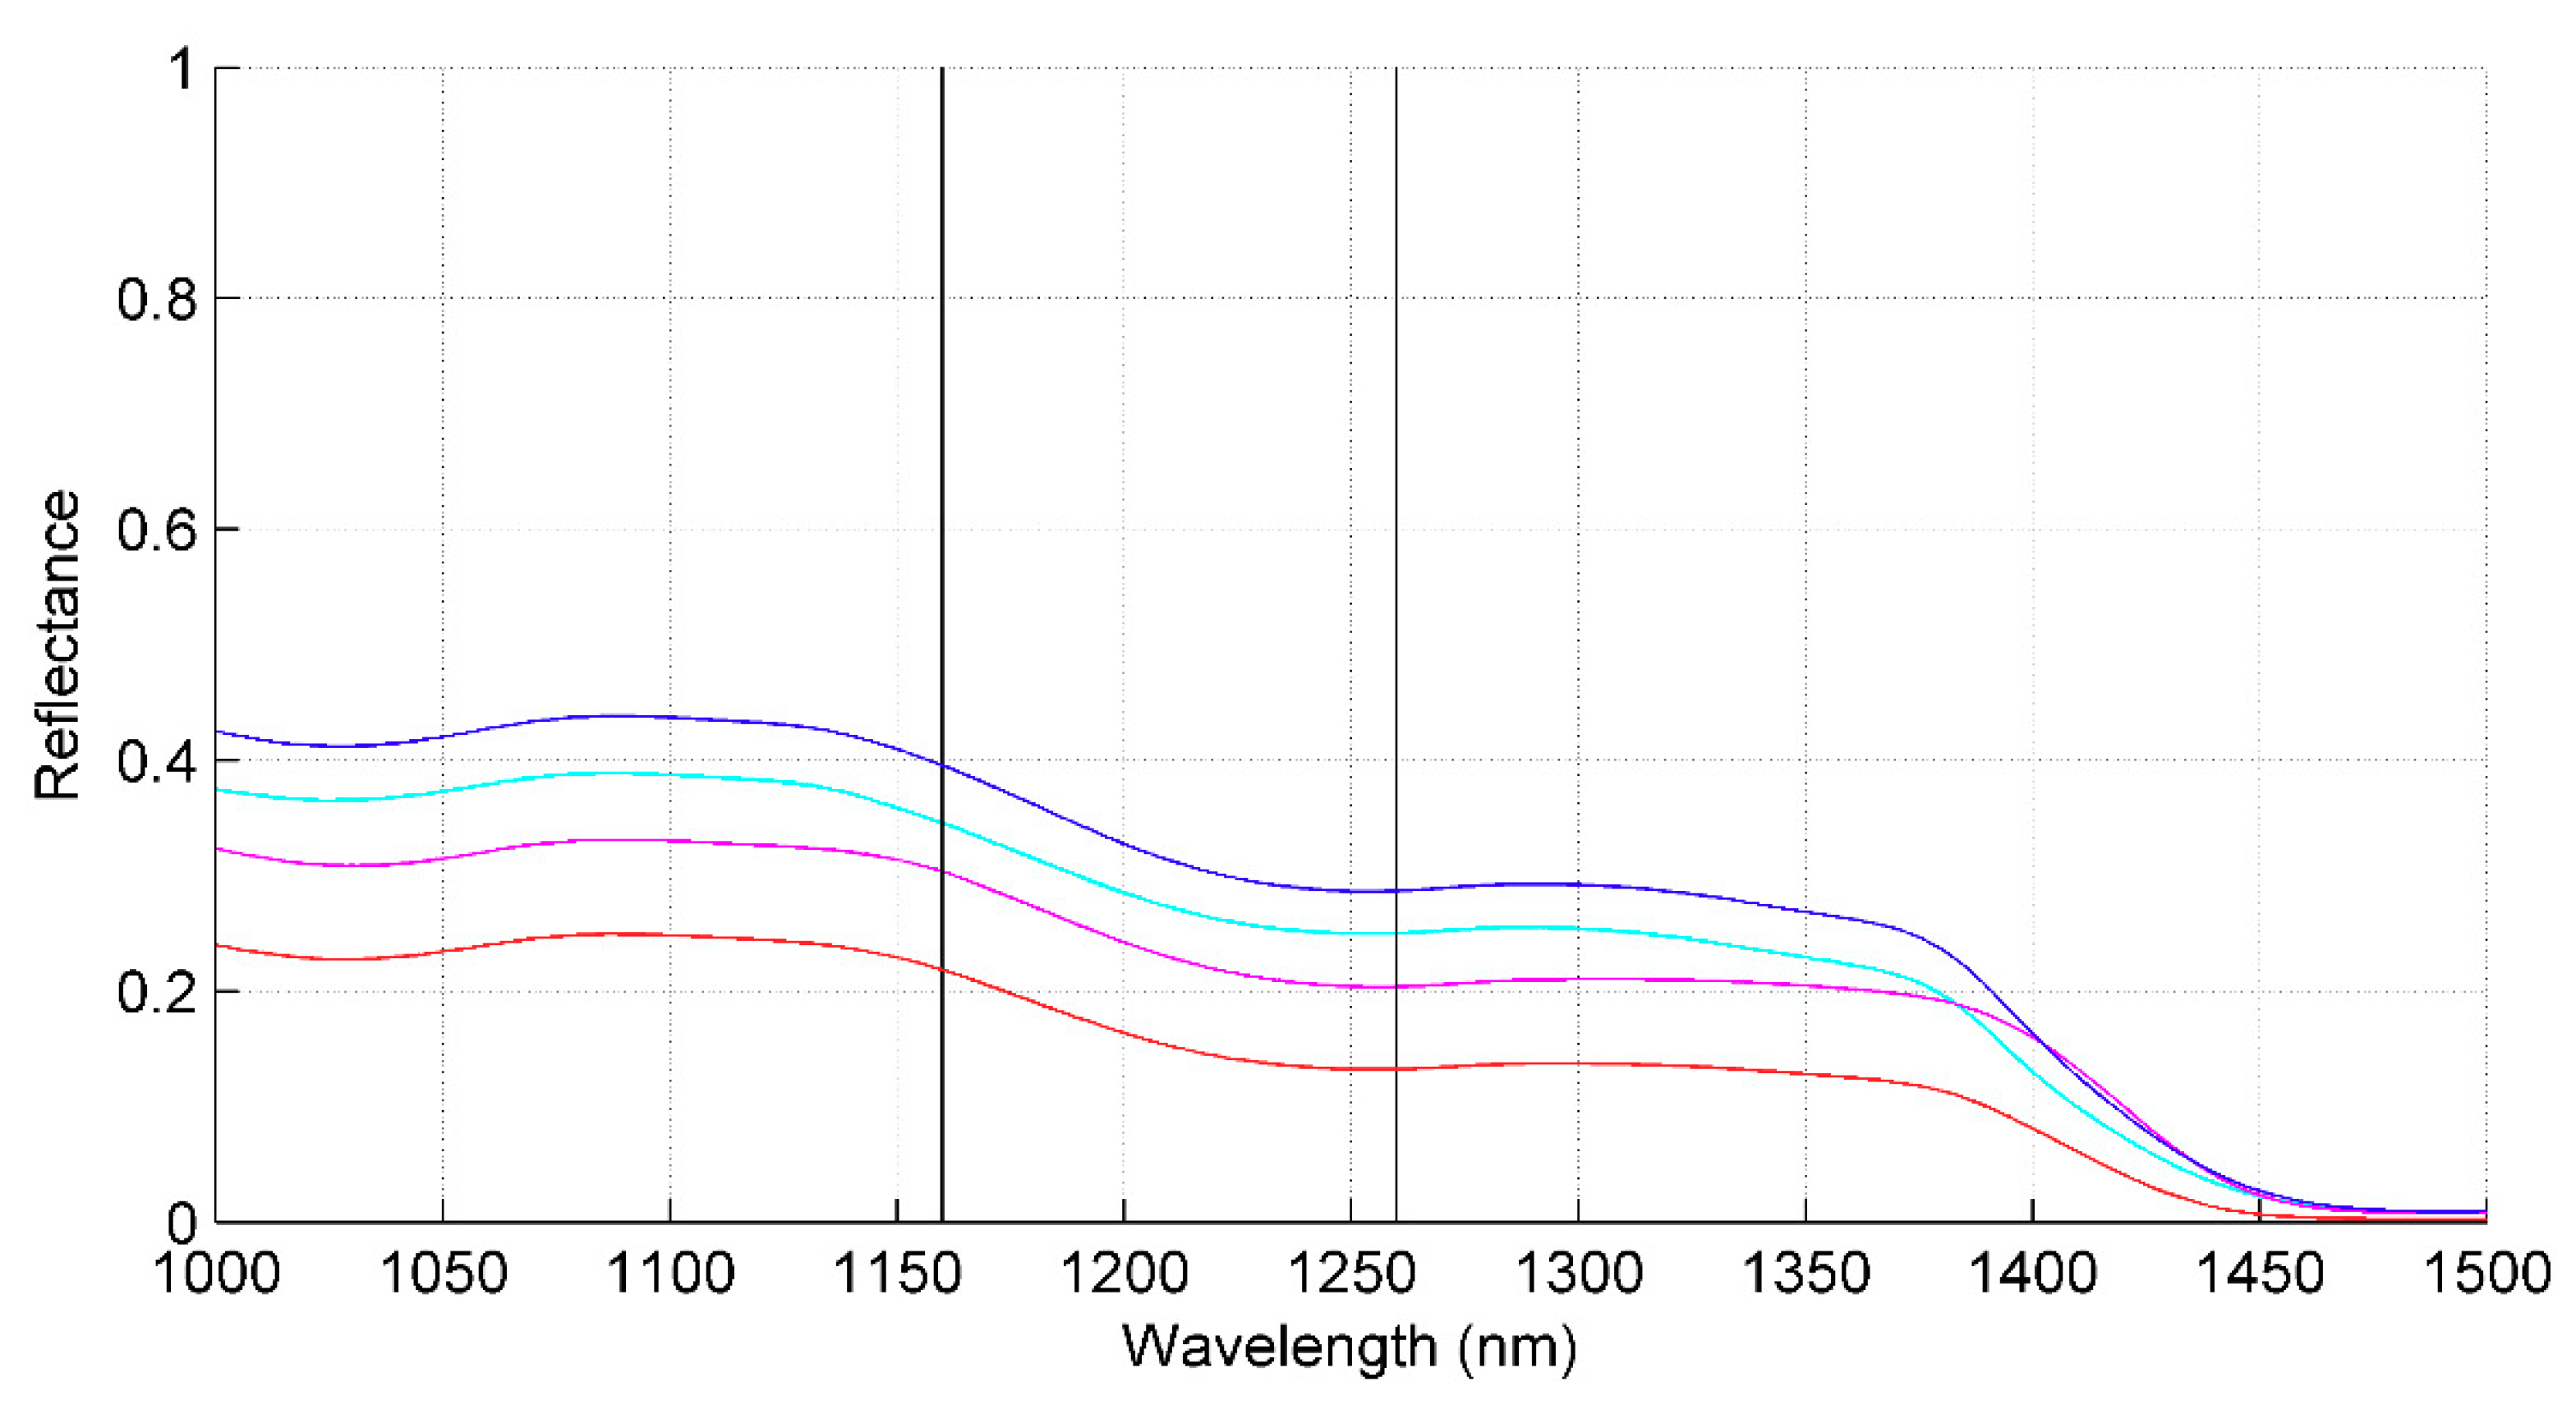
3.3. Comparison of QST Reflectance Profiles

Reflectance profiles were measured with QST from both the snowpack and the sampled snow in 21 March and 3 April 2017. Both profiles were made next to each other at the same snow pit. The reflectance profiles were compared with three wavelengths (1160, 1260, and 1310 nm), which are used later in the study.
The comparison results showed a strong correlation between the reflectance profiles directly from the snowpack and the sampled snow with a correlation coefficient of 0.92–0.94 (Table 2), as was expected. Bias varied from −0.020 to 0.016 and RMSE varied from 0.022 to 0.040 (Table 2). According to the results, IceCube sampling had only a small effect on the reflective properties of snow (microstructure) at 1160, 1260, and 1310 nm wavelengths.

3.4. Empirical Relationship between SSA and Reflectance

Previously shown relationships between snow microstructural parameters and albedo or hemispherical reflectance are described in the Section 1. Similarly, we hypothesized that reflectance measured with QST could have an empirical connection to the SSA. The empirical relationship between SSA and reflectance was studied with 1160 and 1260 nm reflectance-dependent coefficient Q (see Section 2.4). Examples of the measured reflectance are presented in Figure 6, where the upper part of an ice absorption feature was located close to 1160 nm and bottom of it close to 1260 nm. The correlation between SSA and Q was high with correlation coefficients between 0.85 and 0.98 (Table 3). Linear fits are presented for measurements from the snowpack and the sampled snow in Figure 7. The fit is better for the QST measurements from the snowpack (Figure 7a). Single outliers existed for observations in 21 March from sampled snow, which are visible in the scatter plot of Figure 7b. There is approximately 0.2 bias in the linear fits between QST measurements from the snowpack and from the sampled snow. The results prove that an empirical relationship between SSA and reflectance exists, although measurement of light, new snow and fragile depth hoar is challenging.

4. Discussion

Snow microstructure is an important parameter for microwave and optical remote sensing of snow. Field observations are needed in the development and validation of retrieval algorithms. Therefore, simple and accurate novel measurement methods are required. In this study, the newly developed QST instrument for reflectance measurements was tested on taiga snow, and the empirical relationship between QST reflectance and the microstructural parameter SSA was defined.
We tested the measurement accuracy of SSA to confirm the repeatability of the measurement method. The accuracy was tested by repeating IceCube measurements (several measurements from the same sample) and repeating IceCube sampling (several samples from the same height of snow). The first one resulted in an error (relative standard deviation) of 2.0% and the second one resulted in an error of 2.9%. However, the repeated sampling was made for two of the most difficult types of snow to measure with IceCube with a relatively small set of observations. The total error was below 5%, and measurements are therefore considered repeatable in the taiga snow conditions. We hypothesized that snow sampling for IceCube measurements might change the microstructure of snow. However, the correlation of the two QST reflectance profiles (one directly from the snowpack and one from the sampled snow) was high, with correlation coefficients of 0.92–0.94. Based on this result, we assume that the IceCube sampling procedure does not remarkably affect the optical properties and microstructure of the snow in the sample. Analysis made from the IceCube and the QST measurements resulted in a strong correlation between SSA and Q, where Q is the ratio of reflectance at the bottom of the absorption feature (1260 nm) and the reflectance change in the absorption feature (between 1160 and 1260 nm). The reflectance profiles measured from both the snowpack and the sampled snow were used to calculate the correlation coefficients, which had values 0.85–0.98. In Section 1, the presented correlations of instruments measuring reflectance or albedo to SSA measurements are around 0.9. Compared to those values, the correlation between SSA and Q is approximately similar or better. Lower values of Q from the sampled snow compared to observations from the snowpack (bias of 0.2) originate likely from absorption by the black sample holder. The outlier values of the sampled snow on 21 March originate most likely from the melting of the snow samples due the longer measurement procedure, since the samples were measured first three times with IceCube, then weighed and finally measured with QST. Typically, the sampled snow was measured with QST directly after one IceCube measurement.
The QST measurements contain error arising from instrument metrics, the observer, and the environmental conditions. As a heavy instrument (2.5 kg), QST is difficult to hold stably in a stationary position with physical contact to the snow when it is not possible to lean the instrument on snow. This is the case with newly fallen surface snow with a low density (around 100 kg m−3) and depth hoar layer snow, which is coarse and therefore fragile. This could be avoided by using an appropriate, assembled tripod or another support structure. On the other hand, adjusting the height of the tripod between each measurement of a profile might slow down the measurements. Physical contact to the snow is required so this needs to be confirmed when using external support. However, dense and compact snow (rounded grains or faceted crystals with traditional grain size <1.25 mm and density >200 km m−3) had no such problems. In surface snow, solar radiation penetrates the snowpack and possibly causes some degree of error in the measurements. This could be avoided by covering the snowpack, as presented in [7,19]. The sampled snow measurements with QST were made mostly in the shade of the snow pit. The effect of different external illumination conditions was not studied. Warming of the instrument window and plastic casing causes some melting of the snow, and probably some inaccuracy to the measurements, especially during clear skies and positive air temperature conditions. Definition of the exact point of measurement in the snow profile is difficult, with the accuracy being approximately ±2 cm. The instrument size limits its ability to perform measurements close to the ground, so that the bottom of the snowpack below approximately 10 cm is difficult to measure. The clearly erroneous reflectance measurements, which were removed from the analysis, were expected to originate from the wetness of the snow or scattering of the radiation to outside of the field of view.
QST has similar optical geometry to the Contact Probe, and it uses the same range of wavelengths. However, QST is a compact, hand-held instrument while the Contact Probe is attached to a spectrometer. The hand-held instrument has no external spectrometer, laptop, and connecting cables, so QST is therefore fast and simple to use compared to the Contact Probe. In addition, audio notes are possible to record with QST. However, the Contact Probe has less direct contact with snow and the light source is further from the snow, which may reduce additional warming and melting of the snow. Reflectance from the Contact Probe is successfully used for calculation of optical grain size with the Nolin–Dozier model [7]. Therefore, we assume that derivation of optical grain size or SSA from the QST reflectance could be possible with a lookup table in the future, since the empirical relationship between SSA and reflectance has been found. However, it would require a more comprehensive set of observations and proper testing of the penetration depth of radiation and the lost portion of scattered radiation, where field experiments with both QST and the Contact Probe would be beneficial.

Author Contributions

Conceptualization, L.L. and A.K.; Formal analysis, L.L.; Investigation, L.L.; Methodology, L.L. and A.K.; Visualization, L.L.; Writing—original draft, L.L.; Writing—review & editing, L.L. and A.K.

Funding

Work of Leena Leppänen has been partly undertaken with funding from the Vilho, Yrjö and Kalle Väisälä Foundation of the Finnish Academy of Science and Letters.

Acknowledgments

We thank the personnel of Arctic Space Centre of Finnish Meteorological Institute for performing the manual snow measurements. We thank ASD Goetz instrument support program for the availability of the QualitySpec Trek instrument.

Conflicts of Interest

The authors declare no conflict of interest.

References

  1. Pulliainen, J.; Grandell, J.; Hallikainen, M. HUT snow emission model and its applicability to snow water equivalent retrieval. IEEE Trans. Geosci. Remote Sens. 1999, 37, 1378–1390. [Google Scholar] [CrossRef]
  2. Nolin, A.W.; Dozier, J. A hyperspectral method for remotely sensing the grain size of snow. Remote Sens. Environ. 2000, 74, 207–216. [Google Scholar] [CrossRef]
  3. Mätzler, C. MATLAB functions for Mie scattering and absorption, version 2. IAP Res. Rep. 2002, 8, 1–24. [Google Scholar]
  4. Fierz, C.; Armstrong, R.L.; Durand, Y.; Etchevers, P.; Greene, E.; McClung, D.M.; Nishimura, K.; Satyawali, P.K.; Sokratov, S.A. The International Classification for Seasonal Snow on the Ground; IHP-VII Technical Documents in Hydrology N°83, IACS Contribution N°1; UNESCO-IHP: Paris, France, 2009. [Google Scholar]
  5. Debye, P.; Anderson, H.R.; Brumberger, H. Scattering by an inhomogeneous solid. II. The correlation function and its application. J. Appl. Phys. 1957, 28, 679–683. [Google Scholar] [CrossRef]
  6. Warren, S.G. Optical properties of snow. Rev. Geophys. 1982, 20, 67–89. [Google Scholar] [CrossRef]
  7. Painter, T.H.; Molotch, N.P.; Cassidy, M.; Flanner, M.; Steffen, K. Contact spectroscopy for determination of stratigraphy of snow optical grain size. J. Glaciol. 2007, 53, 121–127. [Google Scholar] [CrossRef]
  8. Domine, F.; Salvatori, R.; Legagneux, L.; Salzano, R.; Fily, M.; Casacchia, R. Correlation between the specific surface area and the short wave infrared (SWIR) reflectance of snow. Cold Reg. Sci. Technol. 2006, 46, 60–68. [Google Scholar] [CrossRef]
  9. Legagneux, L.; Cabanes, A.; Dominé, F. Measurement of the specific surface area of 176 snow samples using methane adsorption at 77 K. J. Geophys. Res. Atmos. 2002, 107. [Google Scholar] [CrossRef]
  10. Grenfell, T.C.; Warren, S.G. Representation of a nonspherical ice particle by a collection of independent spheres for scattering and absorption of radiation. J. Geophys. Res. Atmos. 1999, 104, 31697–31709. [Google Scholar] [CrossRef] [Green Version]
  11. Dominé, F.; Cabanes, A.; Taillandier, A.S.; Legagneux, L. Specific surface area of snow samples determined by CH4 adsorption at 77 K and estimated by optical microscopy and scanning electron microscopy. Environ. Sci. Technol. 2001, 35, 771–780. [Google Scholar] [CrossRef] [PubMed]
  12. Kokhanovsky, A.A.; Zege, E.P. Scattering optics of snow. Appl. Opt. 2004, 43, 1589–1602. [Google Scholar] [CrossRef] [PubMed]
  13. Gallet, J.C.; Domine, F.; Zender, C.S.; Picard, G. Measurement of the specific surface area of snow using infrared reflectance in an integrating sphere at 1310 and 1550 nm. Cryosphere 2009, 3, 167–182. [Google Scholar] [CrossRef] [Green Version]
  14. Neshyba, S.P.; Grenfell, T.C.; Warren, S.G. Representation of a nonspherical ice particle by a collection of independent spheres for scattering and absorption of radiation: 2. Hexagonal columns and plates. J. Geophys. Res. Atmos. 2003, 108. [Google Scholar] [CrossRef] [Green Version]
  15. Grenfell, T.C.; Neshyba, S.P.; Warren, S.G. Representation of a nonspherical ice particle by a collection of independent spheres for scattering and absorption of radiation: 3. Hollow columns and plates. J. Geophys. Res. Atmos. 2005, 110. [Google Scholar] [CrossRef] [Green Version]
  16. Picard, G.; Brucker, L.; Fily, M.; Gallée, H.; Krinner, G. Modeling time series of microwave brightness temperature in Antarctica. J. Glaciol. 2009, 55, 537–551. [Google Scholar] [CrossRef]
  17. Gallet, J.C.; Domine, F.; Dumont, M. Measuring the specific surface area of wet snow using 1310 nm reflectance. Cryosphere 2014, 8, 1139–1148. [Google Scholar] [CrossRef] [Green Version]
  18. Arnaud, L.; Picard, G.; Champollion, N.; Domine, F.; Gallet, J.-C.; Lefebvre, E.; Fily, M.; Barnola, J.-M. Measurement of vertical profiles of snow specific surface area with a 1 cm resolution using infrared reflectance: Instrument description and validation. J. Glaciol. 2011, 57, 17–29. [Google Scholar] [CrossRef]
  19. Matzl, M.; Schneebeli, M. Measuring specific surface area of snow by near-infrared photography. J. Glaciol. 2006, 52, 558–564. [Google Scholar] [CrossRef] [Green Version]
  20. Brunauer, S.; Emmett, P.H.; Teller, E. Adsorption of gases in multimolecular layers. J. Am. Chem. Soc. 1938, 60, 309–319. [Google Scholar] [CrossRef]
  21. Hyvärinen, T.; Lammasniemi, J. Infrared Measurement of Grain Size and Melting Degree of Snow; Infrared Technology XI; International Society for Optics and Photonics: San Diego, CA, USA, 1985; Volume 572, pp. 158–166. [Google Scholar]
  22. Picard, G.; Libois, Q.; Arnaud, L.; Verin, G.; Dumont, M. Development and calibration of an automatic spectral albedometer to estimate near-surface snow SSA time series. Cryosphere 2016, 10, 1297–1316. [Google Scholar] [CrossRef] [Green Version]
  23. Painter, T.H.; Dozier, J. Measurements of the hemispherical-directional reflectance of snow at fine spectral and angular resolution. J. Geophys. Res. Atmos. 2004, 109. [Google Scholar] [CrossRef] [Green Version]
  24. Carmagnola, C.M.; Dominé, F.; Dumont, M.; Wright, P.; Strellis, B.; Bergin, M.; Dibb, J.; Picard, G.; Libois, Q.; Arnaud, L.; et al. Snow spectral albedo at Summit, Greenland: Measurements and numerical simulations based on physical and chemical properties of the snowpack. Cryosphere 2013, 7, 1139–1160. [Google Scholar] [CrossRef]
  25. Langlois, A.; Royer, A.; Montpetit, B.; Picard, G.; Brucker, L.; Arnaud, L.; Harvey-Collardard, P.; Fily, M.; Goïta, K. On the relationship between snow grain morphology and in-situ near infrared calibrated reflectance photographs. Cold Reg. Sci. Technol. 2010, 61, 34–42. [Google Scholar] [CrossRef]
  26. Aoki, T.; Aoki, T.; Fukabori, M.; Hachikubo, A.; Tachibana, Y.; Nishio, F. Effects of snow physical parameters on spectral albedo and bidirectional reflectance of snow surface. J. Geophys. Res. Atmos. 2000, 105, 10219–10236. [Google Scholar] [CrossRef] [Green Version]
  27. Pirazzini, R.; Räisänen, P.; Vihma, T.; Johansson, M.; Tastula, E.M. Measurements and modelling of snow particle size and shortwave infrared albedo over a melting Antarctic ice sheet. Cryosphere 2015, 9, 2357–2381. [Google Scholar] [CrossRef] [Green Version]
  28. Tanikawa, T.; Aoki, T.; Hori, M.; Hachikubo, A.; Abe, O.; Aniya, M. Monte Carlo simulations of spectral albedo for artificial snowpacks composed of spherical and nonspherical particles. Appl. Opt. 2006, 45, 5310–5319. [Google Scholar] [CrossRef] [PubMed]
  29. Tanikawa, T.; Aoki, T.; Hori, M.; Hachikubo, A.; Aniya, M. Snow bidirectional reflectance model using non-spherical snow particles and its validation with field measurements. EARSeL eProc. 2006, 5, 137–145. [Google Scholar]
  30. Peng, J.; Ji, W.; Ma, Z.; Li, S.; Chen, S.; Zhou, L.; Shi, Z. Predicting total dissolved salts and soluble ion concentrations in agricultural soils using portable visible near-infrared and mid-infrared spectrometers. Biosyst. Eng. 2016, 152, 94–103. [Google Scholar] [CrossRef]
  31. Hu, B.; Chen, S.; Hu, J.; Xia, F.; Xu, J.; Li, Y.; Shi, Z. Application of portable XRF and VNIR sensors for rapid assessment of soil heavy metal pollution. PLoS ONE 2017, 12, e0172438. [Google Scholar] [CrossRef] [PubMed]
  32. Bartelt, P.; Lehning, M. A physical SNOWPACK model for the Swiss avalanchewarning: Part I: Numerical model. Cold Reg. Sci. Technol. 2002, 35, 123–145. [Google Scholar] [CrossRef]
  33. Lehning, M.; Bartelt, P.; Brown, B.; Fierz, C.; Satyawali, P. A physical SNOWPACK model for the Swiss avalanche warning. Part II: Snow microstructure. Cold Reg. Sci. Technol. 2002, 35, 147–167. [Google Scholar] [CrossRef]
  34. Lehning, M.; Bartelt, P.; Brown, B.; Fierz, C. A physical SNOWPACK model for the Swiss avalanche warning: Part III: Meteorological forcing, thin layer formation and evaluation. Cold Reg. Sci. Technol. 2000, 35, 169–184. [Google Scholar] [CrossRef]
  35. Leppänen, L.; Kontu, A.; Hannula, H.-R.; Sjöblom, H.; Pulliainen, J. Sodankylä manual snow survey program. Geosci. Instrum. Methods Data Syst. 2016, 5, 163–179. [Google Scholar] [CrossRef] [Green Version]
  36. Kontu, A.; Lemmetyinen, J.; Vehviläinen, J.; Leppänen, L.; Pulliainen, J. Coupling SNOWPACK-modeled grain size parameters with the HUT snow emission model. Remote Sens. Environ. 2017, 194, 33–47. [Google Scholar] [CrossRef]
  37. Sandells, M.; Essery, R.; Rutter, N.; Wake, L.; Leppänen, L.; Lemmetyinen, J. Microstructure representation of snow in coupled snowpack and microwave emission models. Cryosphere 2017, 11, 229. [Google Scholar] [CrossRef]
  38. Jordan, R. A One-Dimensional Temperature Model for a Snow Cover: Technical Documentation for SNTHERM.89; Special Report 91-16; Cold Regions Research and Engineering Laboratory (U.S.): Hanover, NH, USA; Engineer Research and Development Center (U.S.): Vicksburg, MS, USA, 1991. [Google Scholar]
  39. Flanner, M.G.; Zender, C.S. Linking snowpack microphysics and albedo evolution. J. Geophys. Res. 2006, 111, D12208. [Google Scholar] [CrossRef]
  40. Essery, R.; Best, M.; Cox, P. MOSES 2.2 Technical Documentation; Technical Report, Hadley Centre Technical Note 30; Hadley Centre, Met Office: Exeter, UK, 2001; p. 31. [Google Scholar]
  41. Salminen, M.; Pulliainen, J.; Metsämäki, S.; Kontu, A.; Suokanerva, H. The behaviour of snow and snow-free surface reflectance in boreal forests: Implications to the performance of snow covered area monitoring. Remote Sens. Environ. 2009, 113, 907–918. [Google Scholar] [CrossRef]
  42. Meinander, O.; Kazadzis, S.; Arola, A.; Riihelä, A.; Räisänen, P.; Kivi, R.; Kontu, A.; Kouznetsov, R.; Sofiev, M.; Svensson, J.; et al. Spectral albedo of seasonal snow during intensive melt period at Sodankylä, beyond the Arctic Circle. Atmos. Chem. Phys. 2013, 13, 3793–3810. [Google Scholar] [CrossRef] [Green Version]
  43. Peltoniemi, J.I.; Kaasalainen, S.; Näränen, J.; Matikainen, L.; Piironen, J. Measurement of directional and spectral signatures of light reflectance by snow. IEEE Trans. Geosci. Remote Sens. 2005, 43, 2294–2304. [Google Scholar] [CrossRef]
  44. Peltoniemi, J.; Hakala, T.; Suomalainen, J.; Puttonen, E. Polarised bidirectional reflectance factor measurements from soil, stones, and snow. J. Quant. Spectrosc. Radiat. 2009, 110, 1940–1953. [Google Scholar] [CrossRef]
  45. Leppänen, L.; Leinss, S.; Suokanerva, H. Growth of Forest Floor Vegetation Observed from Snow Depth Measurements in Sodankylä, Finland, Snow an Ecological Phenomenon, Smolenice, Slovakia, 19–21 September 2017. Available online: http://www.sbks.sk/smolenice/Leppanen%20et%20al.pdf (accessed on 5 November 2018).
  46. Leppänen, L.; Kontu, A.; Vehviläinen, J.; Lemmetyinen, J.; Pulliainen, J. Comparison of traditional and optical grain-size field measurements with SNOWPACK simulations in a taiga snowpack. J. Glaciol. 2015, 61, 151–162. [Google Scholar] [CrossRef]
Figure 1. (a) Location of Sodankylä in northern Finland; (b) snow pit measurement site in Sodankylä.
Geosciences 08 00404 g001
Figure 2. (a) The IceCube measurement; (b) the IceCube sample; (c) the QualitySpec Trek (QST) measurement from the snowpack vertical profile; (d) the QST measurement from sampled snow.
Geosciences 08 00404 g002
Figure 3. Illumination and viewing configuration. Fiber optic and light source have the same azimuth angle. Fiber optic cable has 25° field of view. Diameter of the window is approximately 1 cm.
Geosciences 08 00404 g003
Figure 4. The height of snow (blue) and air temperature (green) measured at the Intensive Observation Area (IOA). Vertical black lines indicate the measurements made with QST.
Geosciences 08 00404 g004
Figure 5. Reflectance from QST, specific surface area (SSA) from IceCube, grain type, macrophotography-based traditional grain size, and density profiles of snow are plotted in columns (ae) for all dates. Original SSA data are marked with circles and interpolated values with dots in column (b). SSA for 21 March 2017 is plotted from the first measurement of three for every height. Grain type abbreviations are described in [4].
Geosciences 08 00404 g005
Figure 6. Example of reflectances measured on 7 March 2017 at heights of 73 cm (blue), 64 cm (cyan), 52 cm (magenta), and 34 cm (red). Vertical lines indicate wavelengths 1160 nm and 1260 nm.
Geosciences 08 00404 g006
Figure 7. Scatter plot of Q with Equation (2) (y-axis) and SSA (x-axis) from the QST measurements made (a) directly from the snowpack profile and (b) the measurements from the sampled snow. Lines fitted to the points are marked.
Geosciences 08 00404 g007
Table 1. The SSA from three samples of precipitation particles at the surface and faceted crystals in the bottom of the snowpack. Standard deviations (STD) and relative standard deviations (RSD) from Equation (3) are calculated for both surface and bottom.
Density (kg m−3)SSA (m2 kg−1)STDRSD (%)
225.039.8
Surface309.941.61.042.53
352.441.6
338.27.9
Bottom409.08.20.253.17
394.97.7
Average 0.652.85
Table 2. Bias, root-mean-square error (RMSE) and correlation coefficient (R) for QST reflectances from the snowpack profile and the sampled snow.
DateWavelength (nm)BiasRMSER
1160−0.02040.0400.92
21 March 20171260−0.02020.0310.94
1310−0.02300.0340.93
11600.01600.0330.92
3 April 201712600.00550.0220.92
13100.00680.0230.92
Table 3. Correlation coefficient (R) between SSA and Q for the QST measurements from the snowpack profile and profile of the sampled snow.
DateProfileR
22 February 2017Snowpack0.95
7 March 2017Sampled Snow0.98
16 March 2017Snowpack0.89
21 March 2017Sampled Snow0.89
21 March 2017Snowpack0.94
3 April 2017Sampled Snow0.96
3 April 2017Snowpack0.85

