2.1. Orogens and the Growth of Supercontinents
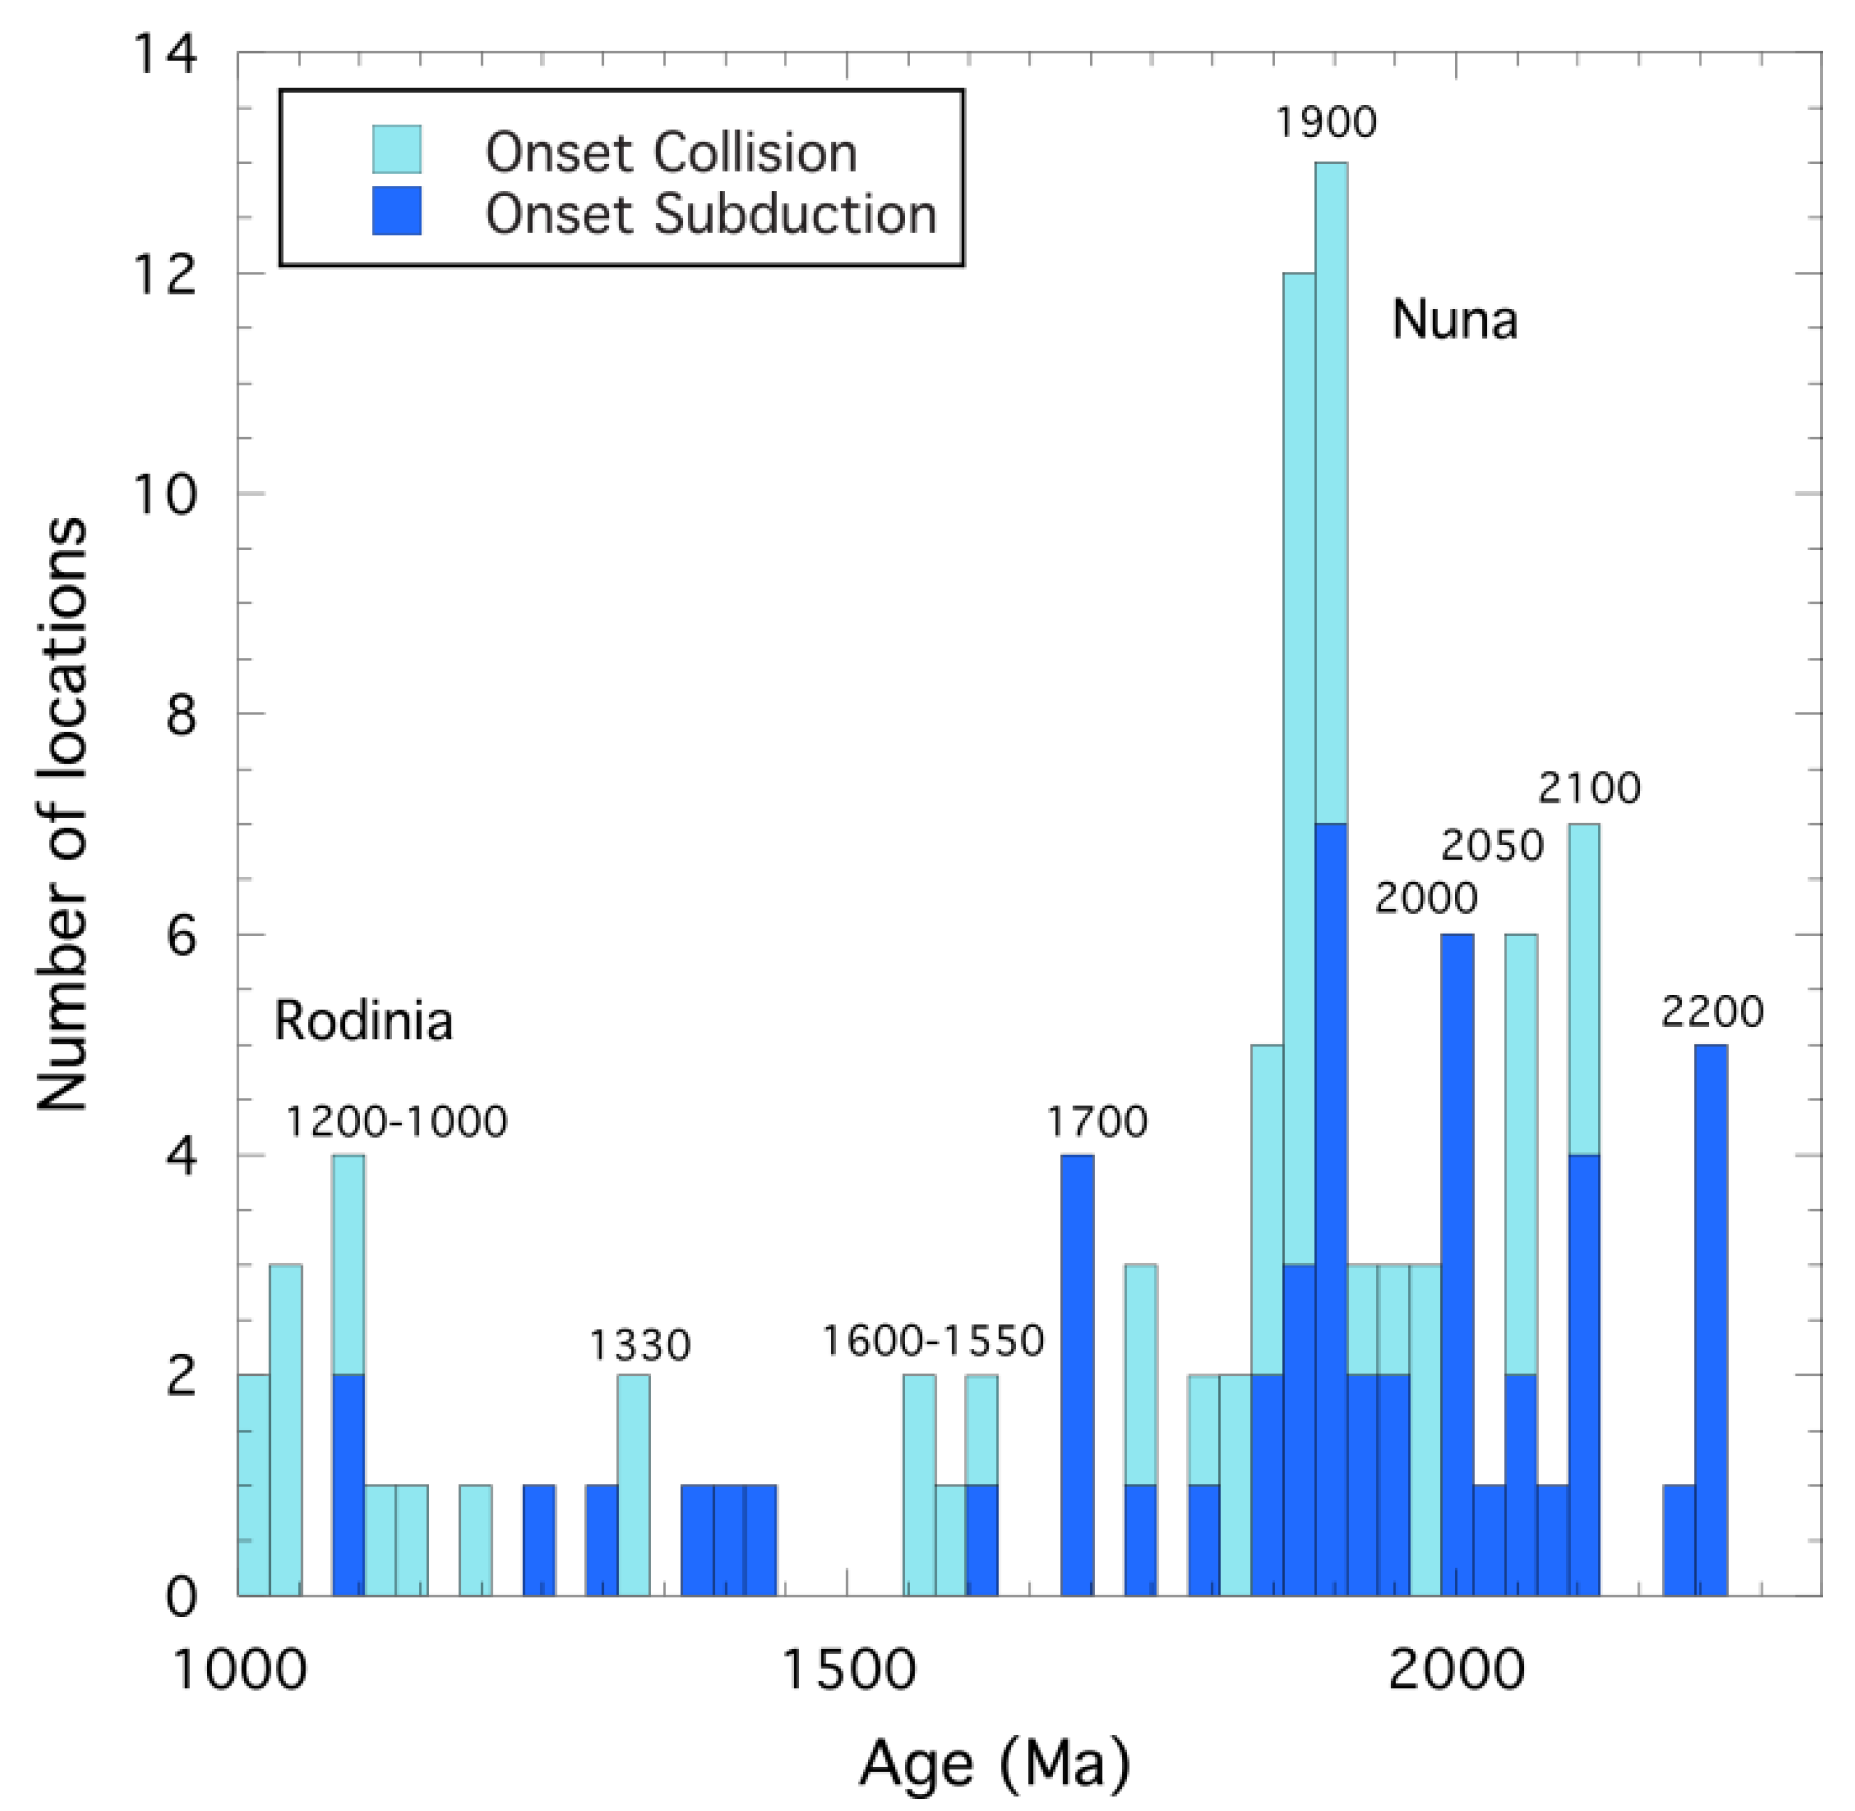
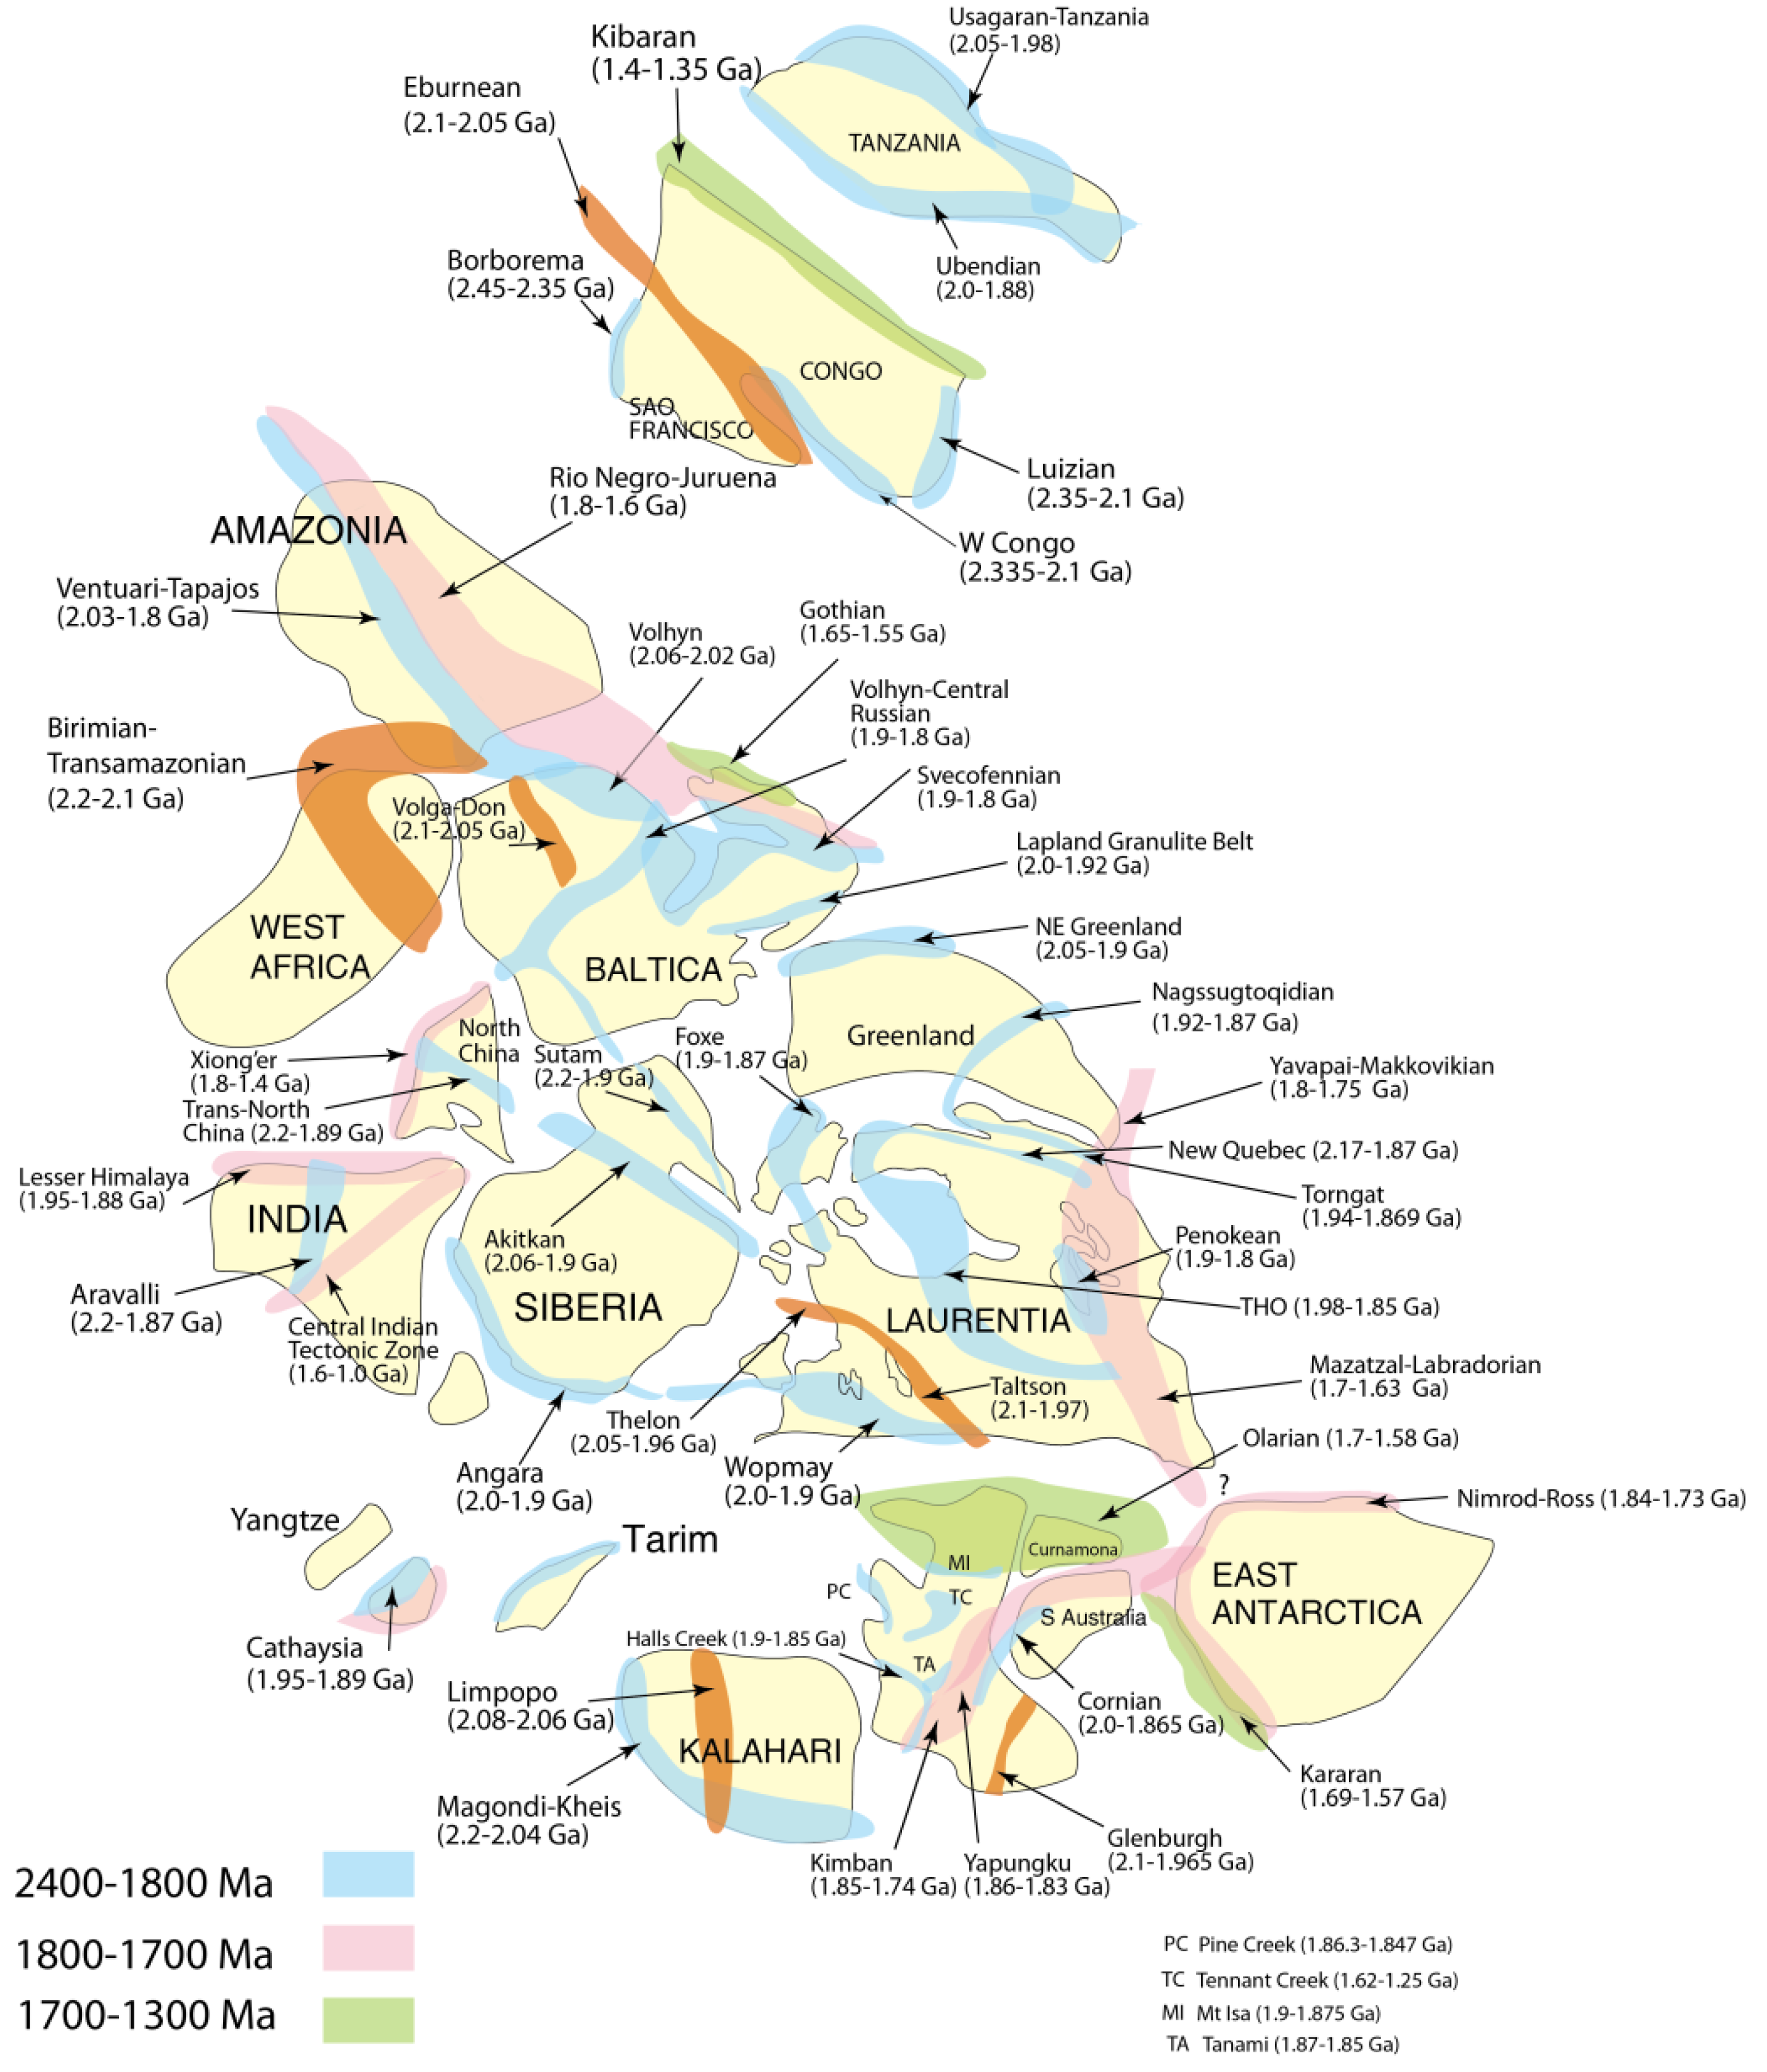
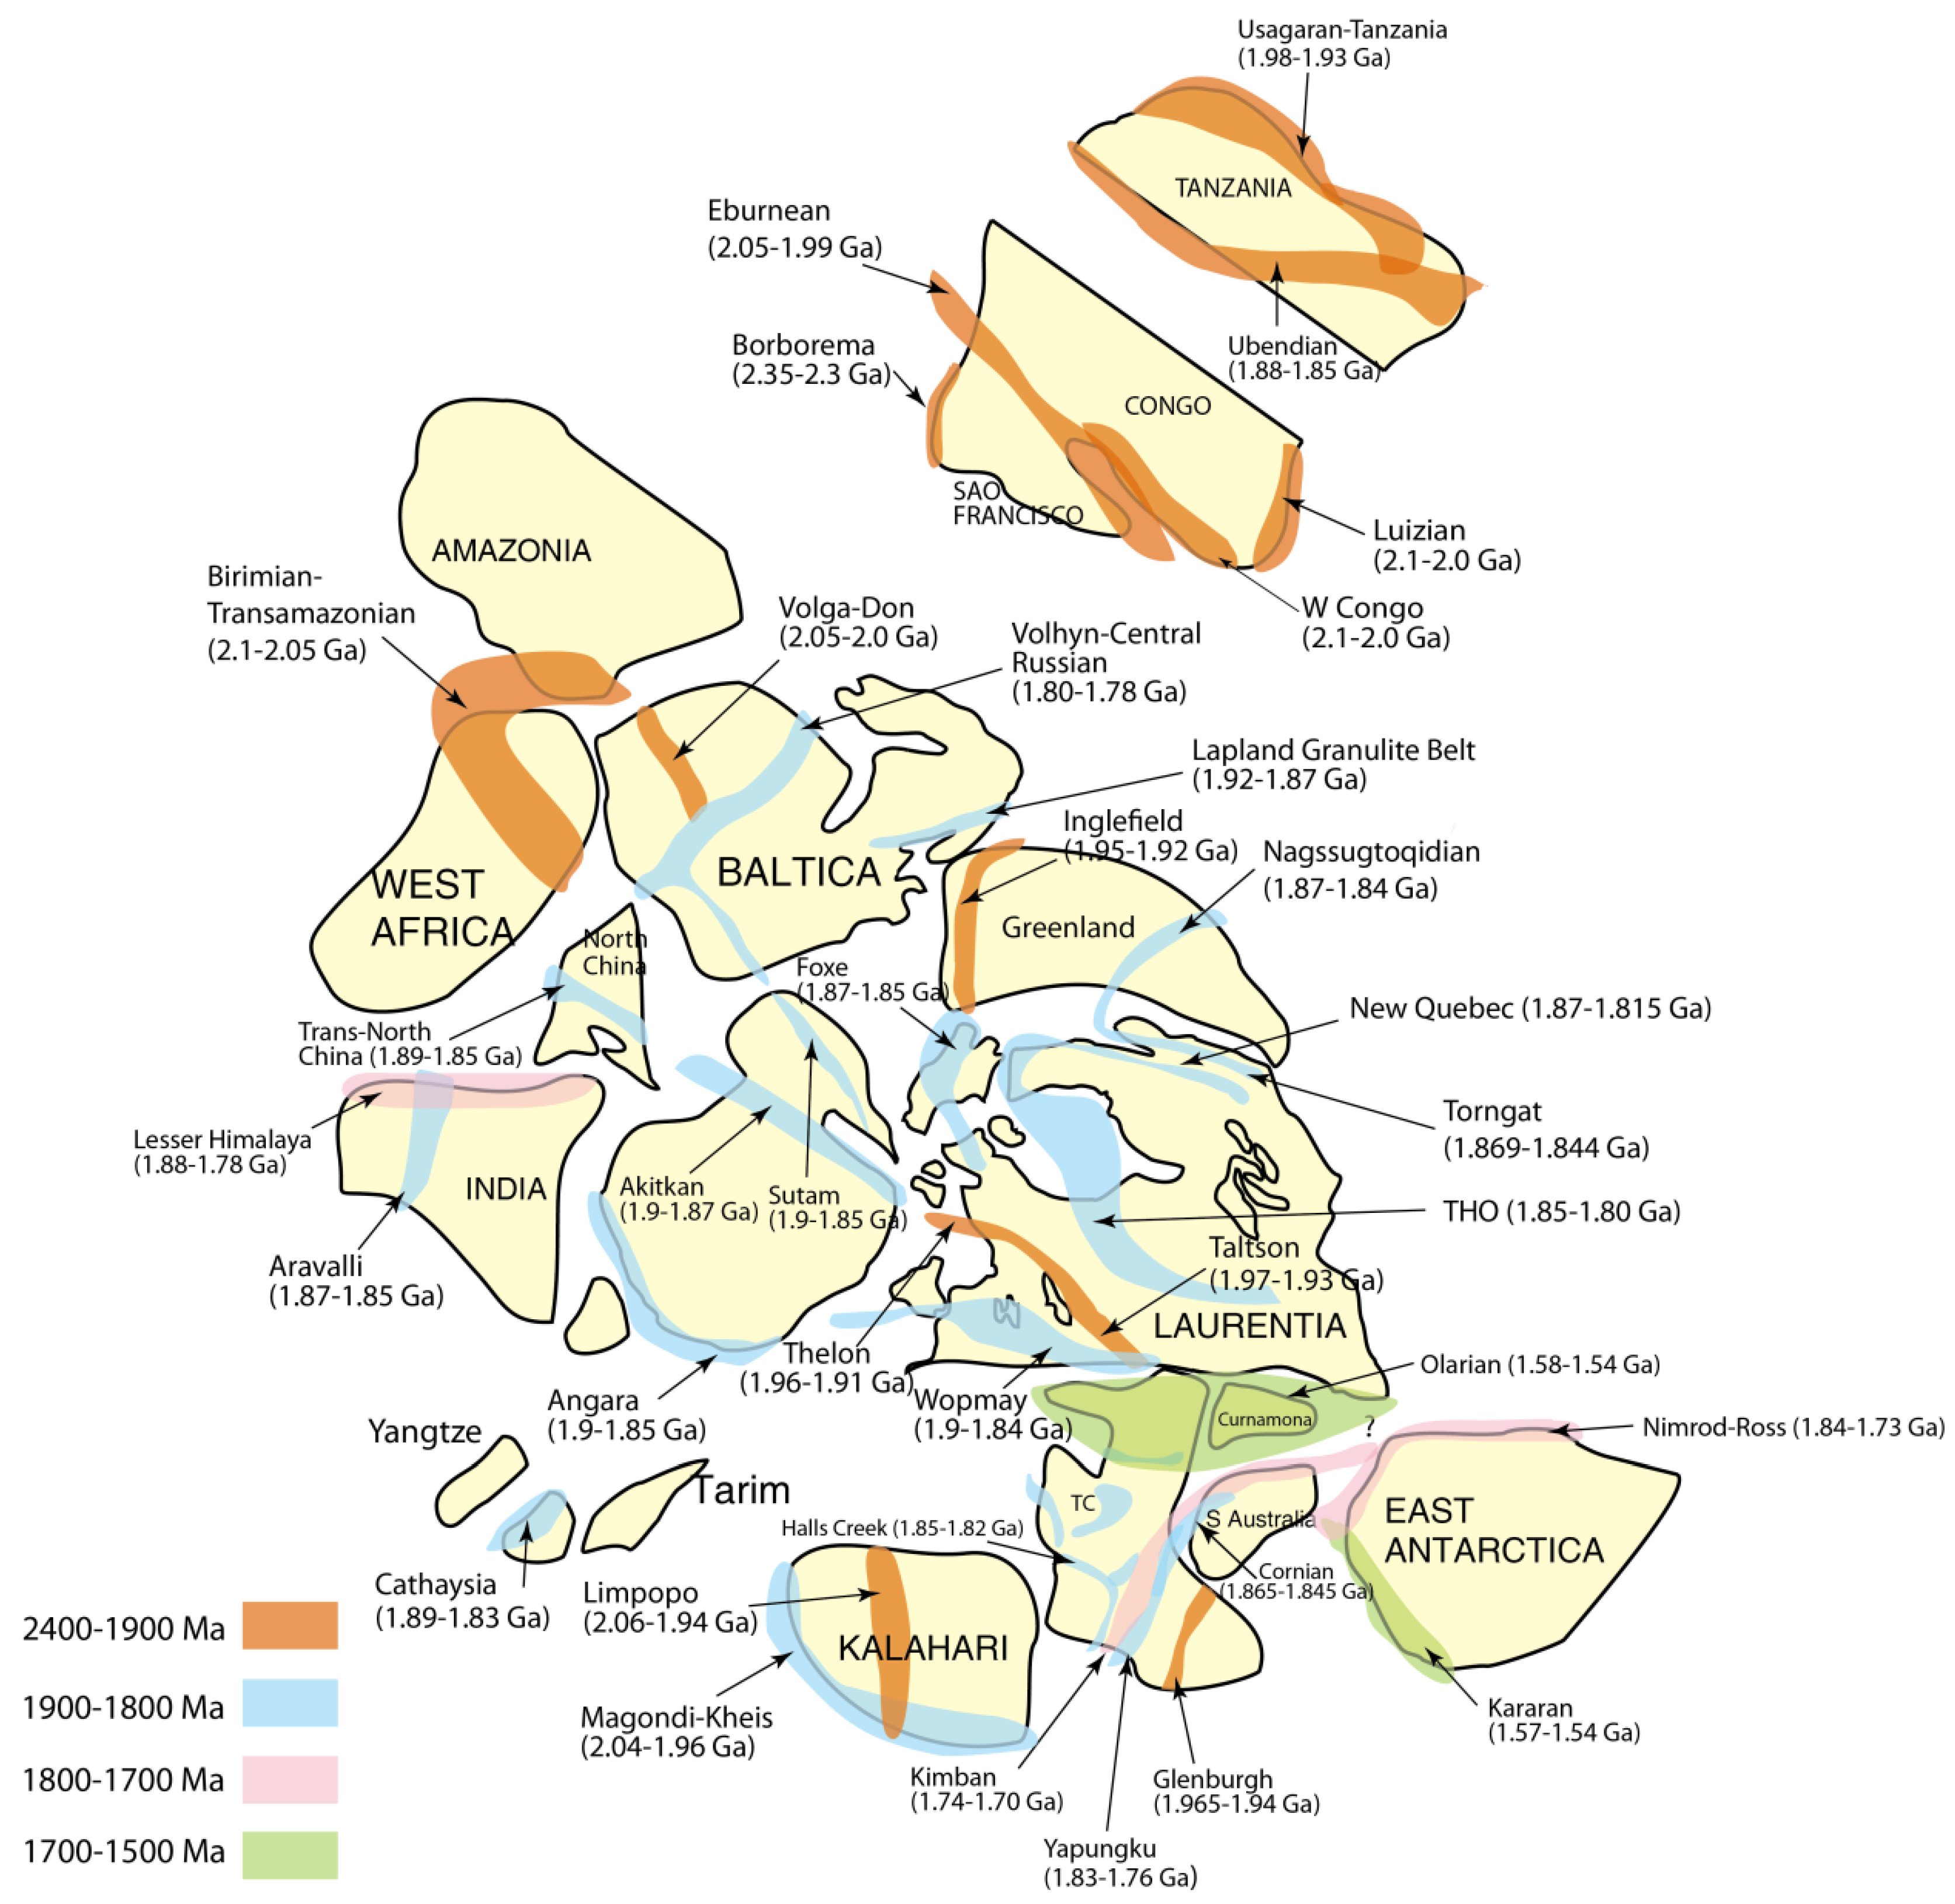
Orogen evolution can be considered in two stages: the onset of subduction and the onset of collision (
Figure 1,
Figure 2,
Figure 3; Appendix 1). The onset of subduction is a maximum age for the onset of closing of an ocean basin, since subduction may begin before actual closing of an ocean basin begins. Available data indicate that post-Archean age peaks ≤2100 Ma are controlled by data from both collisional phases and accretionary (subduction) phases of orogens, whereas those >2100 Ma reflect chiefly or entirely the onset of subduction (such as Birimian-Transamazonian, Magondi-Kheis, Sutam and Trans-North China orogens) (Appendix 1). As previously recognized [
3,
4], collisional peaks between 2100 and 1900 Ma correlate with the growth of Nuna, whereas those at 1200–1000 Ma correspond to the growth of Rodinia (
Figure 1). The earliest phase of Nuna assembly is recorded by collisions in the Luizian, West Congo, Birimian-Transamazonian, Limpopo, Volga-Don, Eburnean, and Magondi-Kheis orogens between 2150 and 2050 Ma, and much of this action occurred in the Congo, West Africa and Tanzania cratons (Appendix 1;
Figure 3). What appears to be an orogen of local extent in the Borborema province of eastern Brazil may actually represent one of the oldest Nunian collisions at 2350 Ma. Most of the action in the assembly of Nuna, however, occurred in a relatively short period of time between 1900 and 1800 Ma. The two orogens with collisional onsets around 1600 Ma are in Australia and Antarctica [Olarian, Kararan (
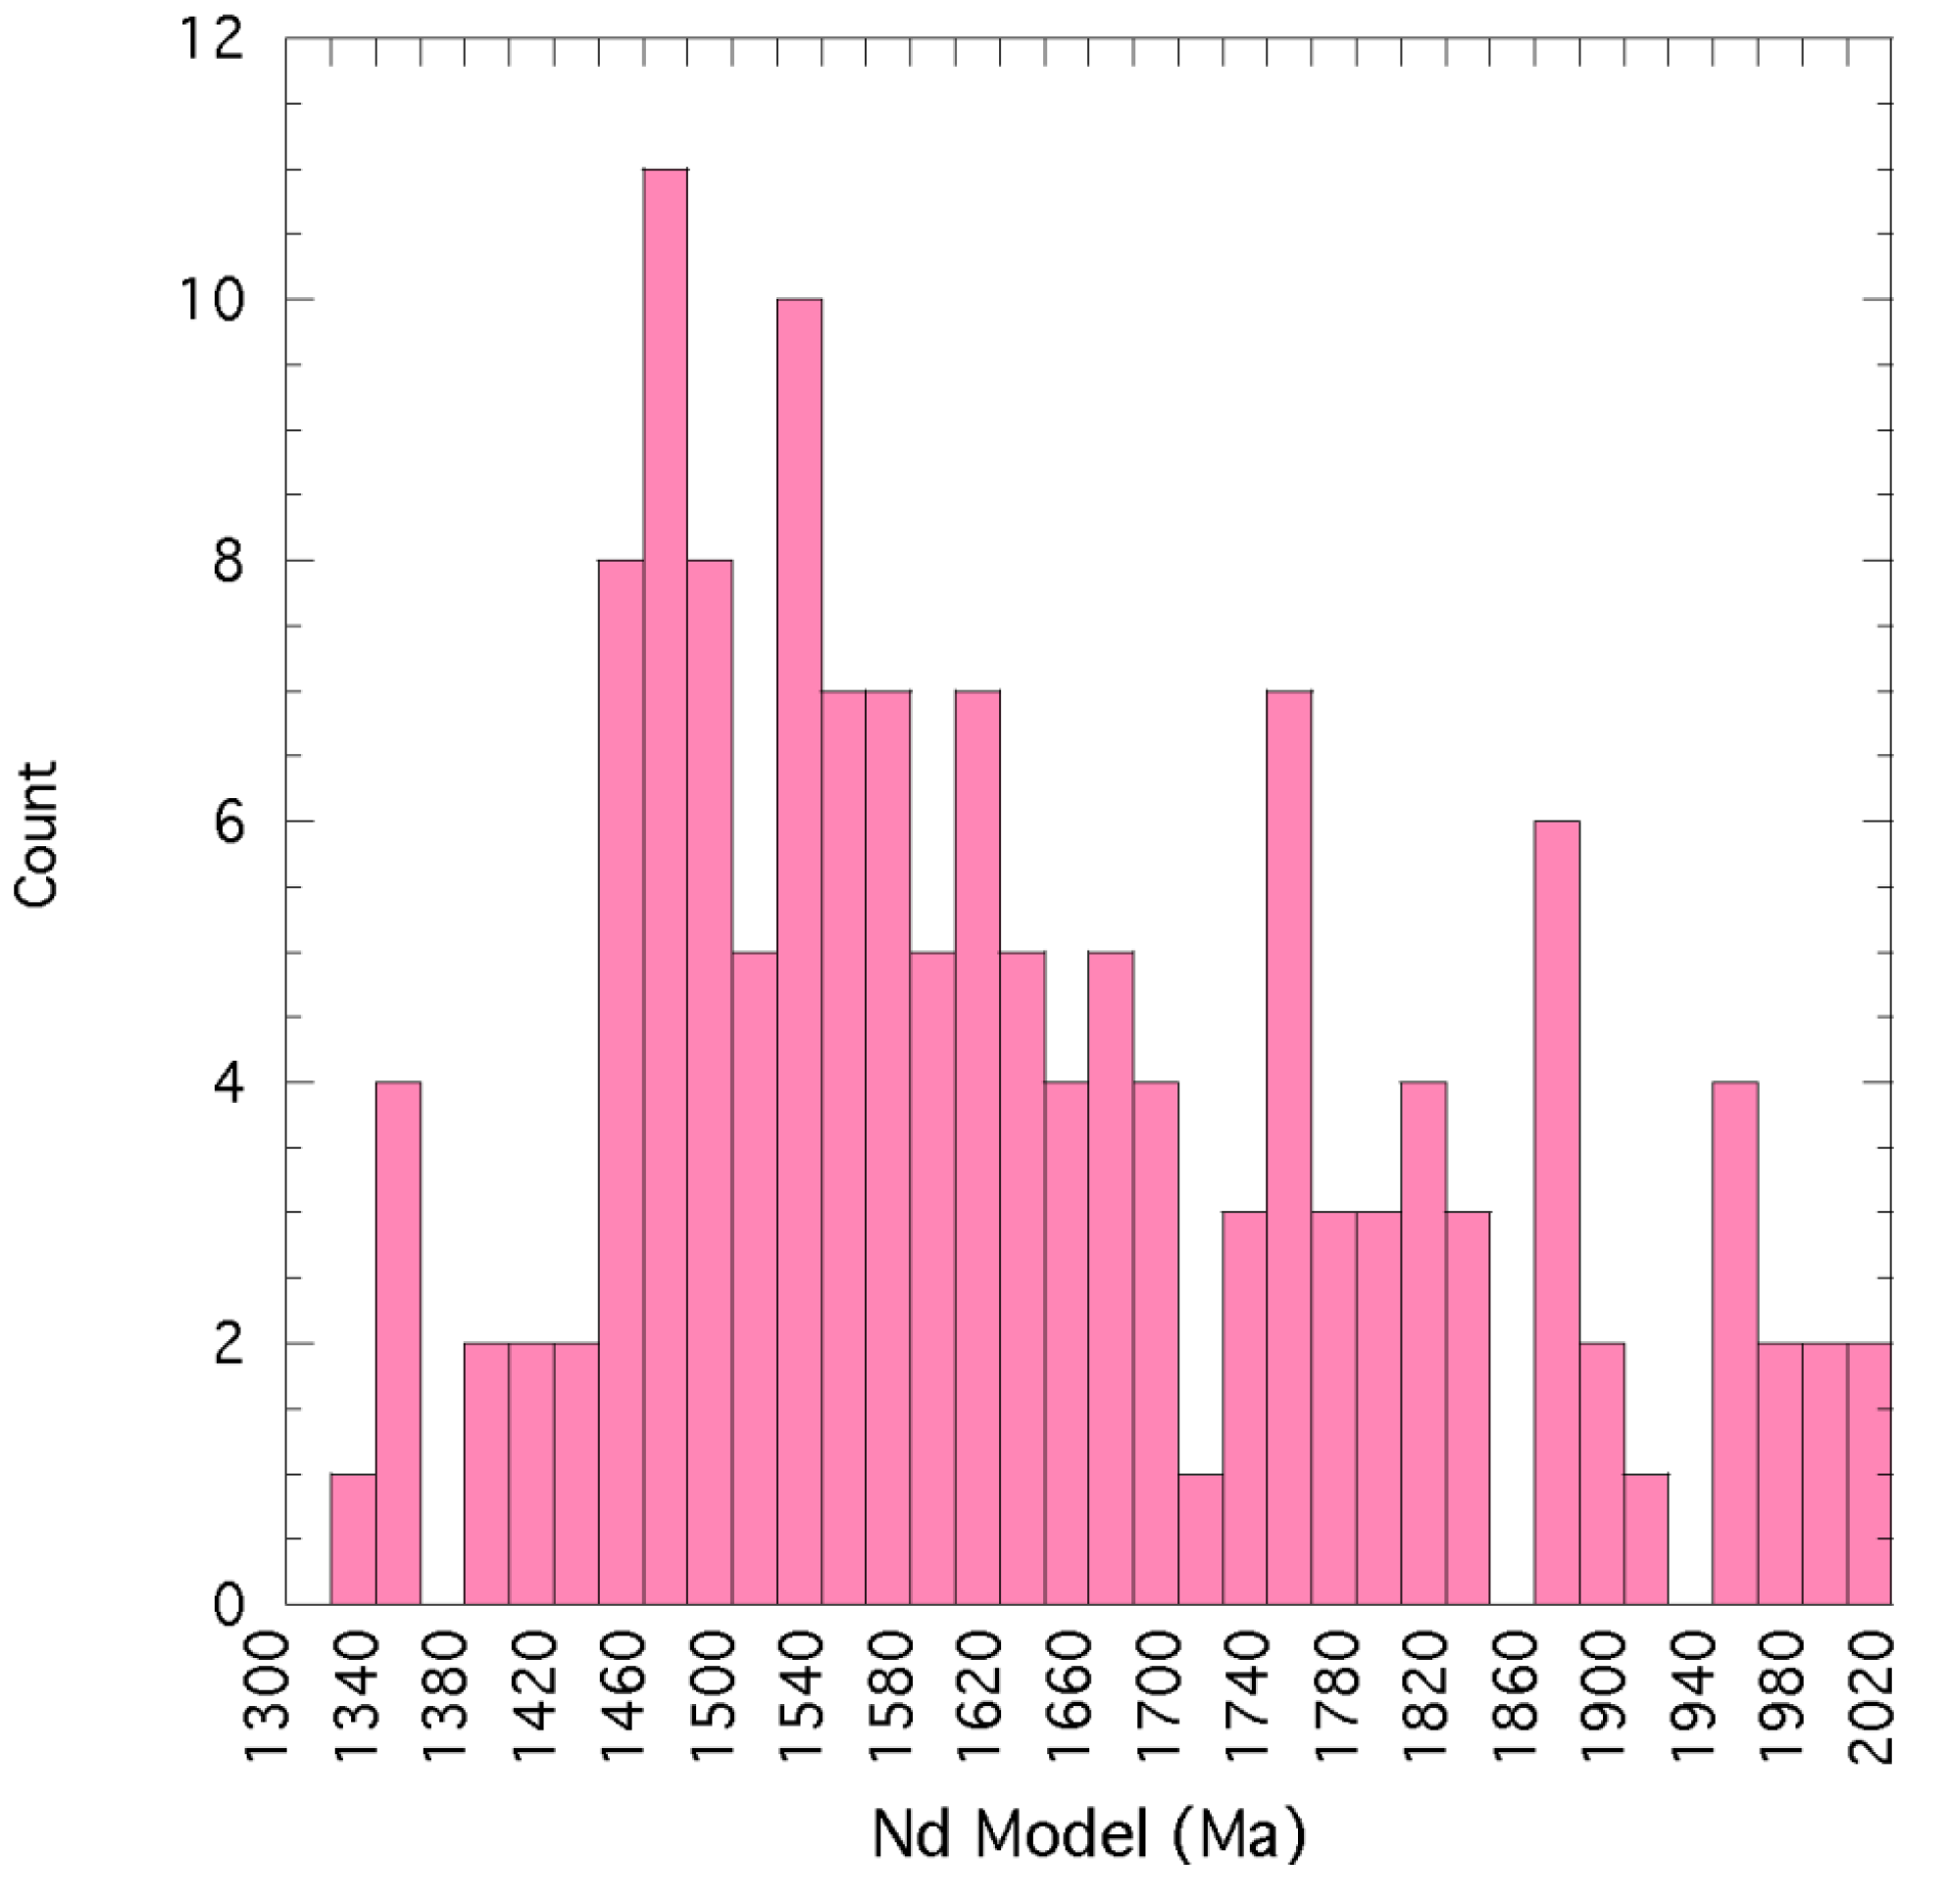
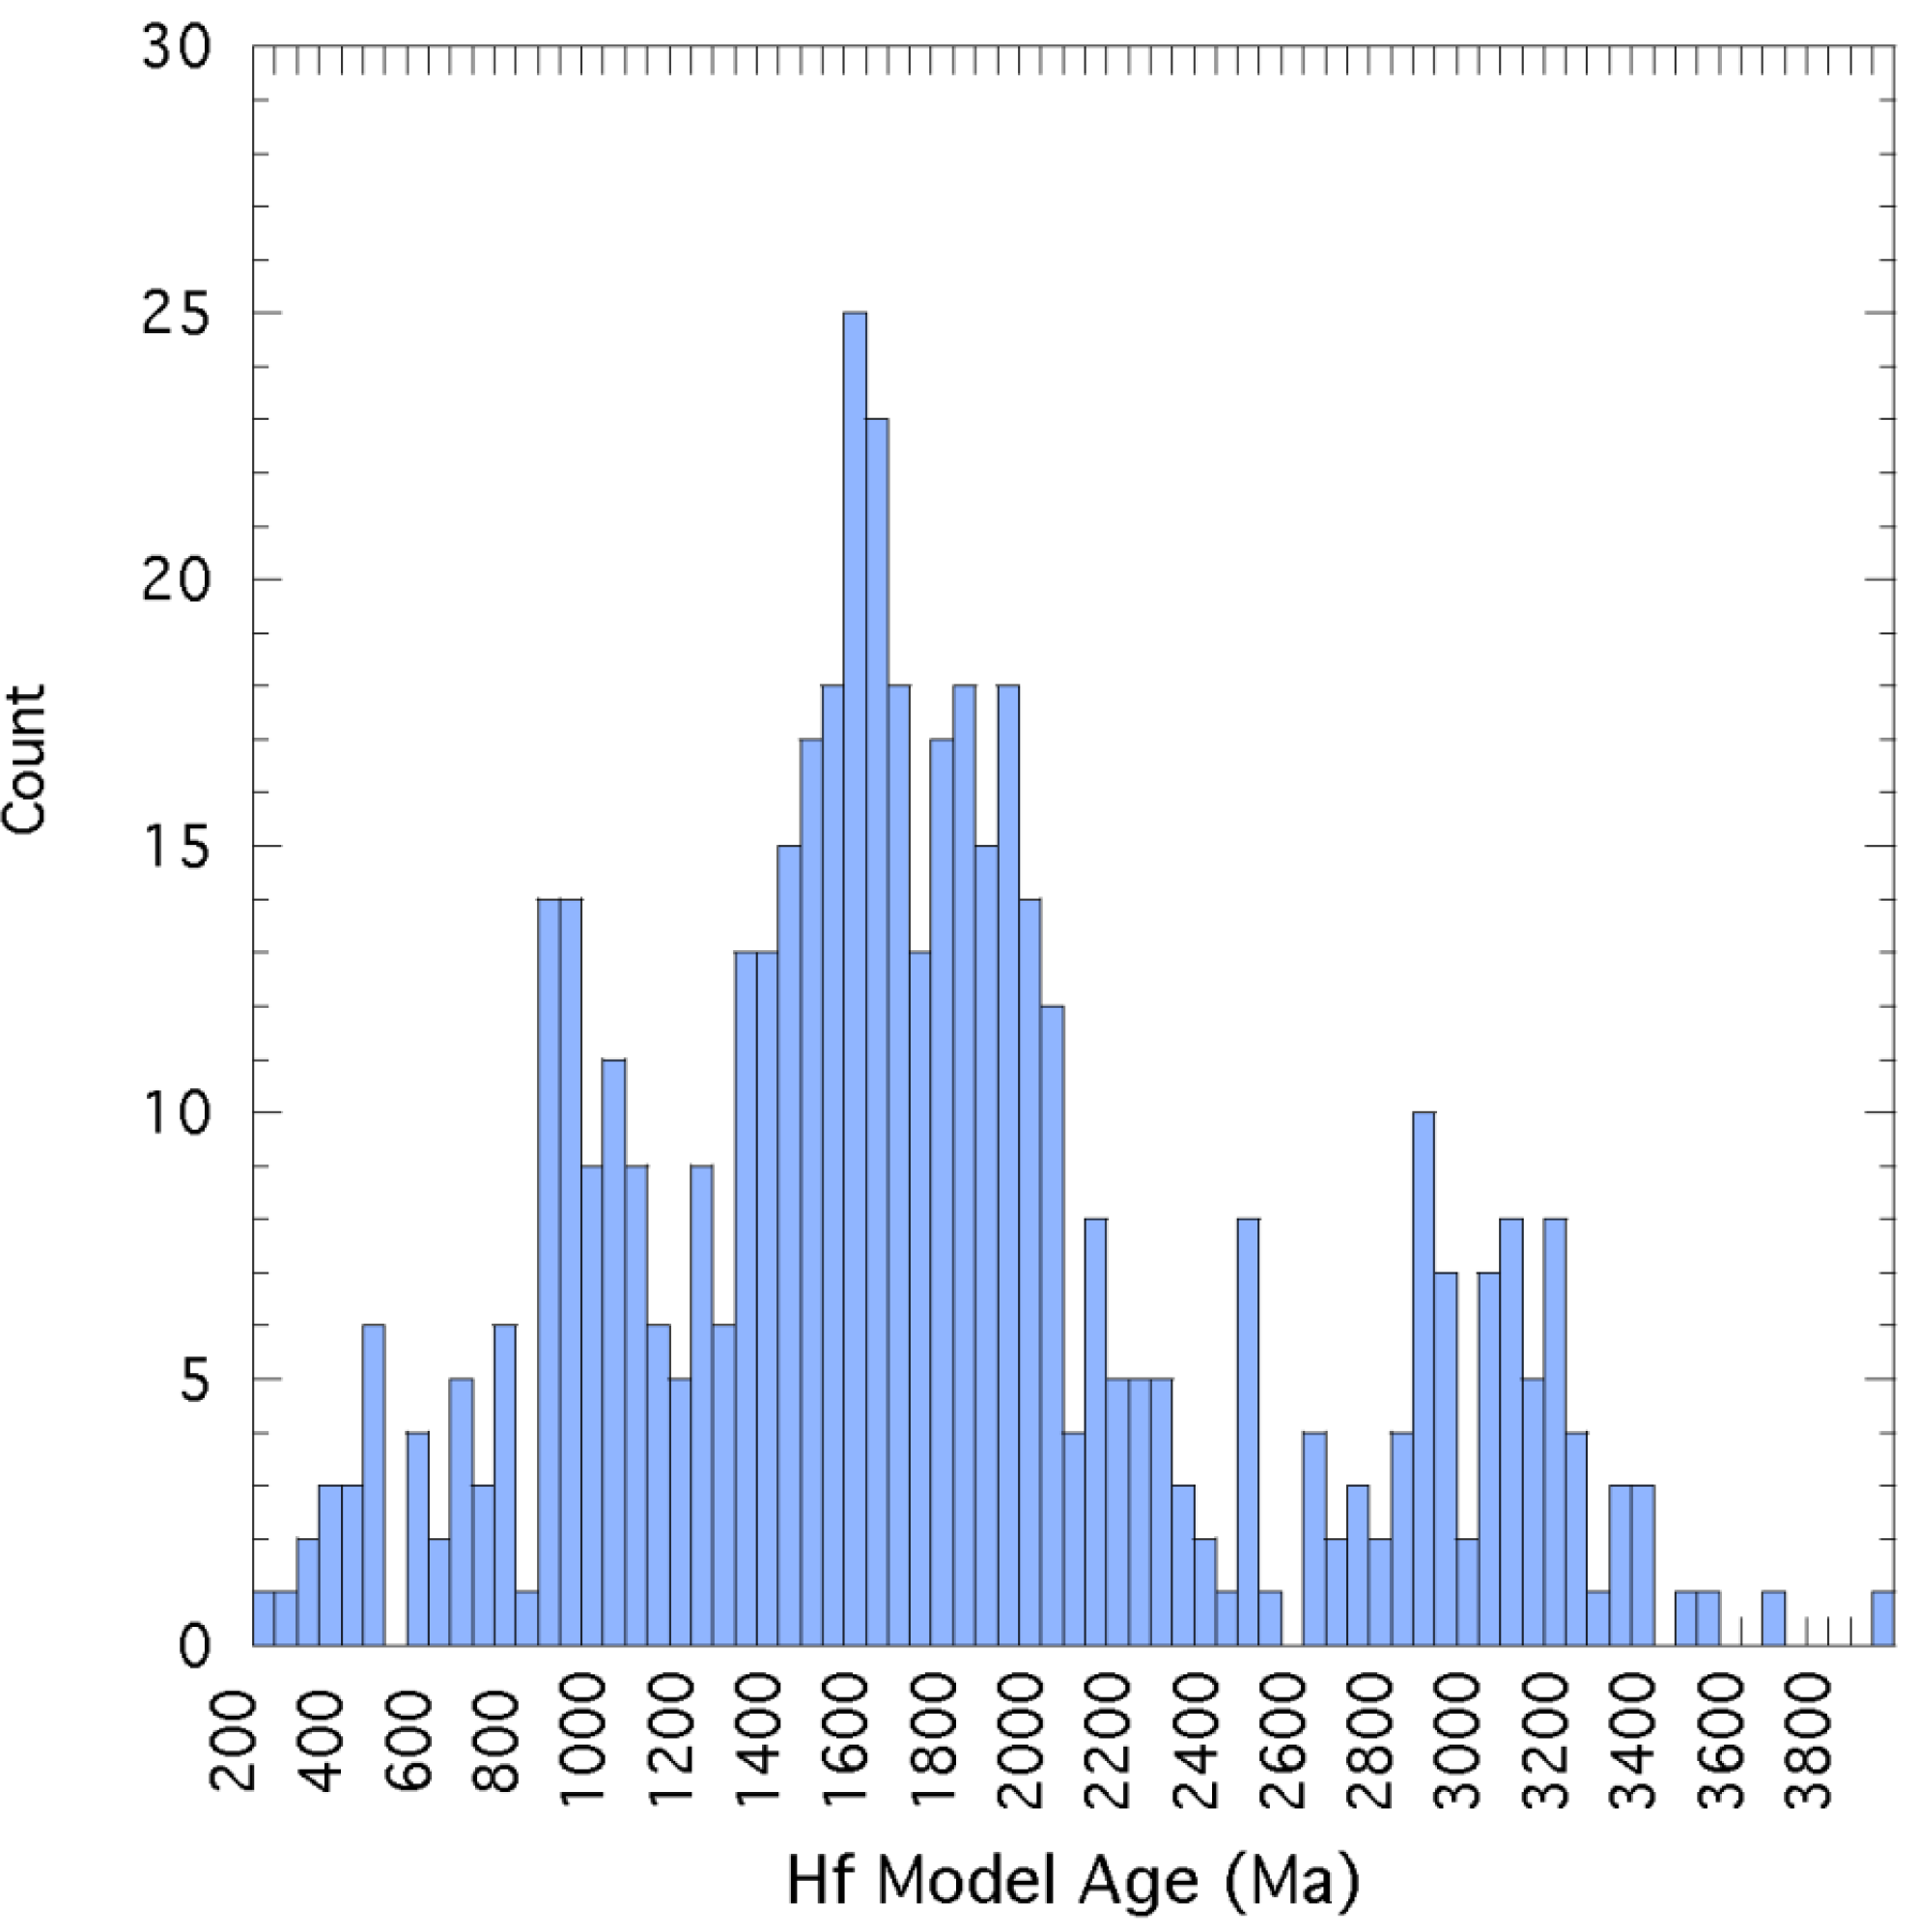
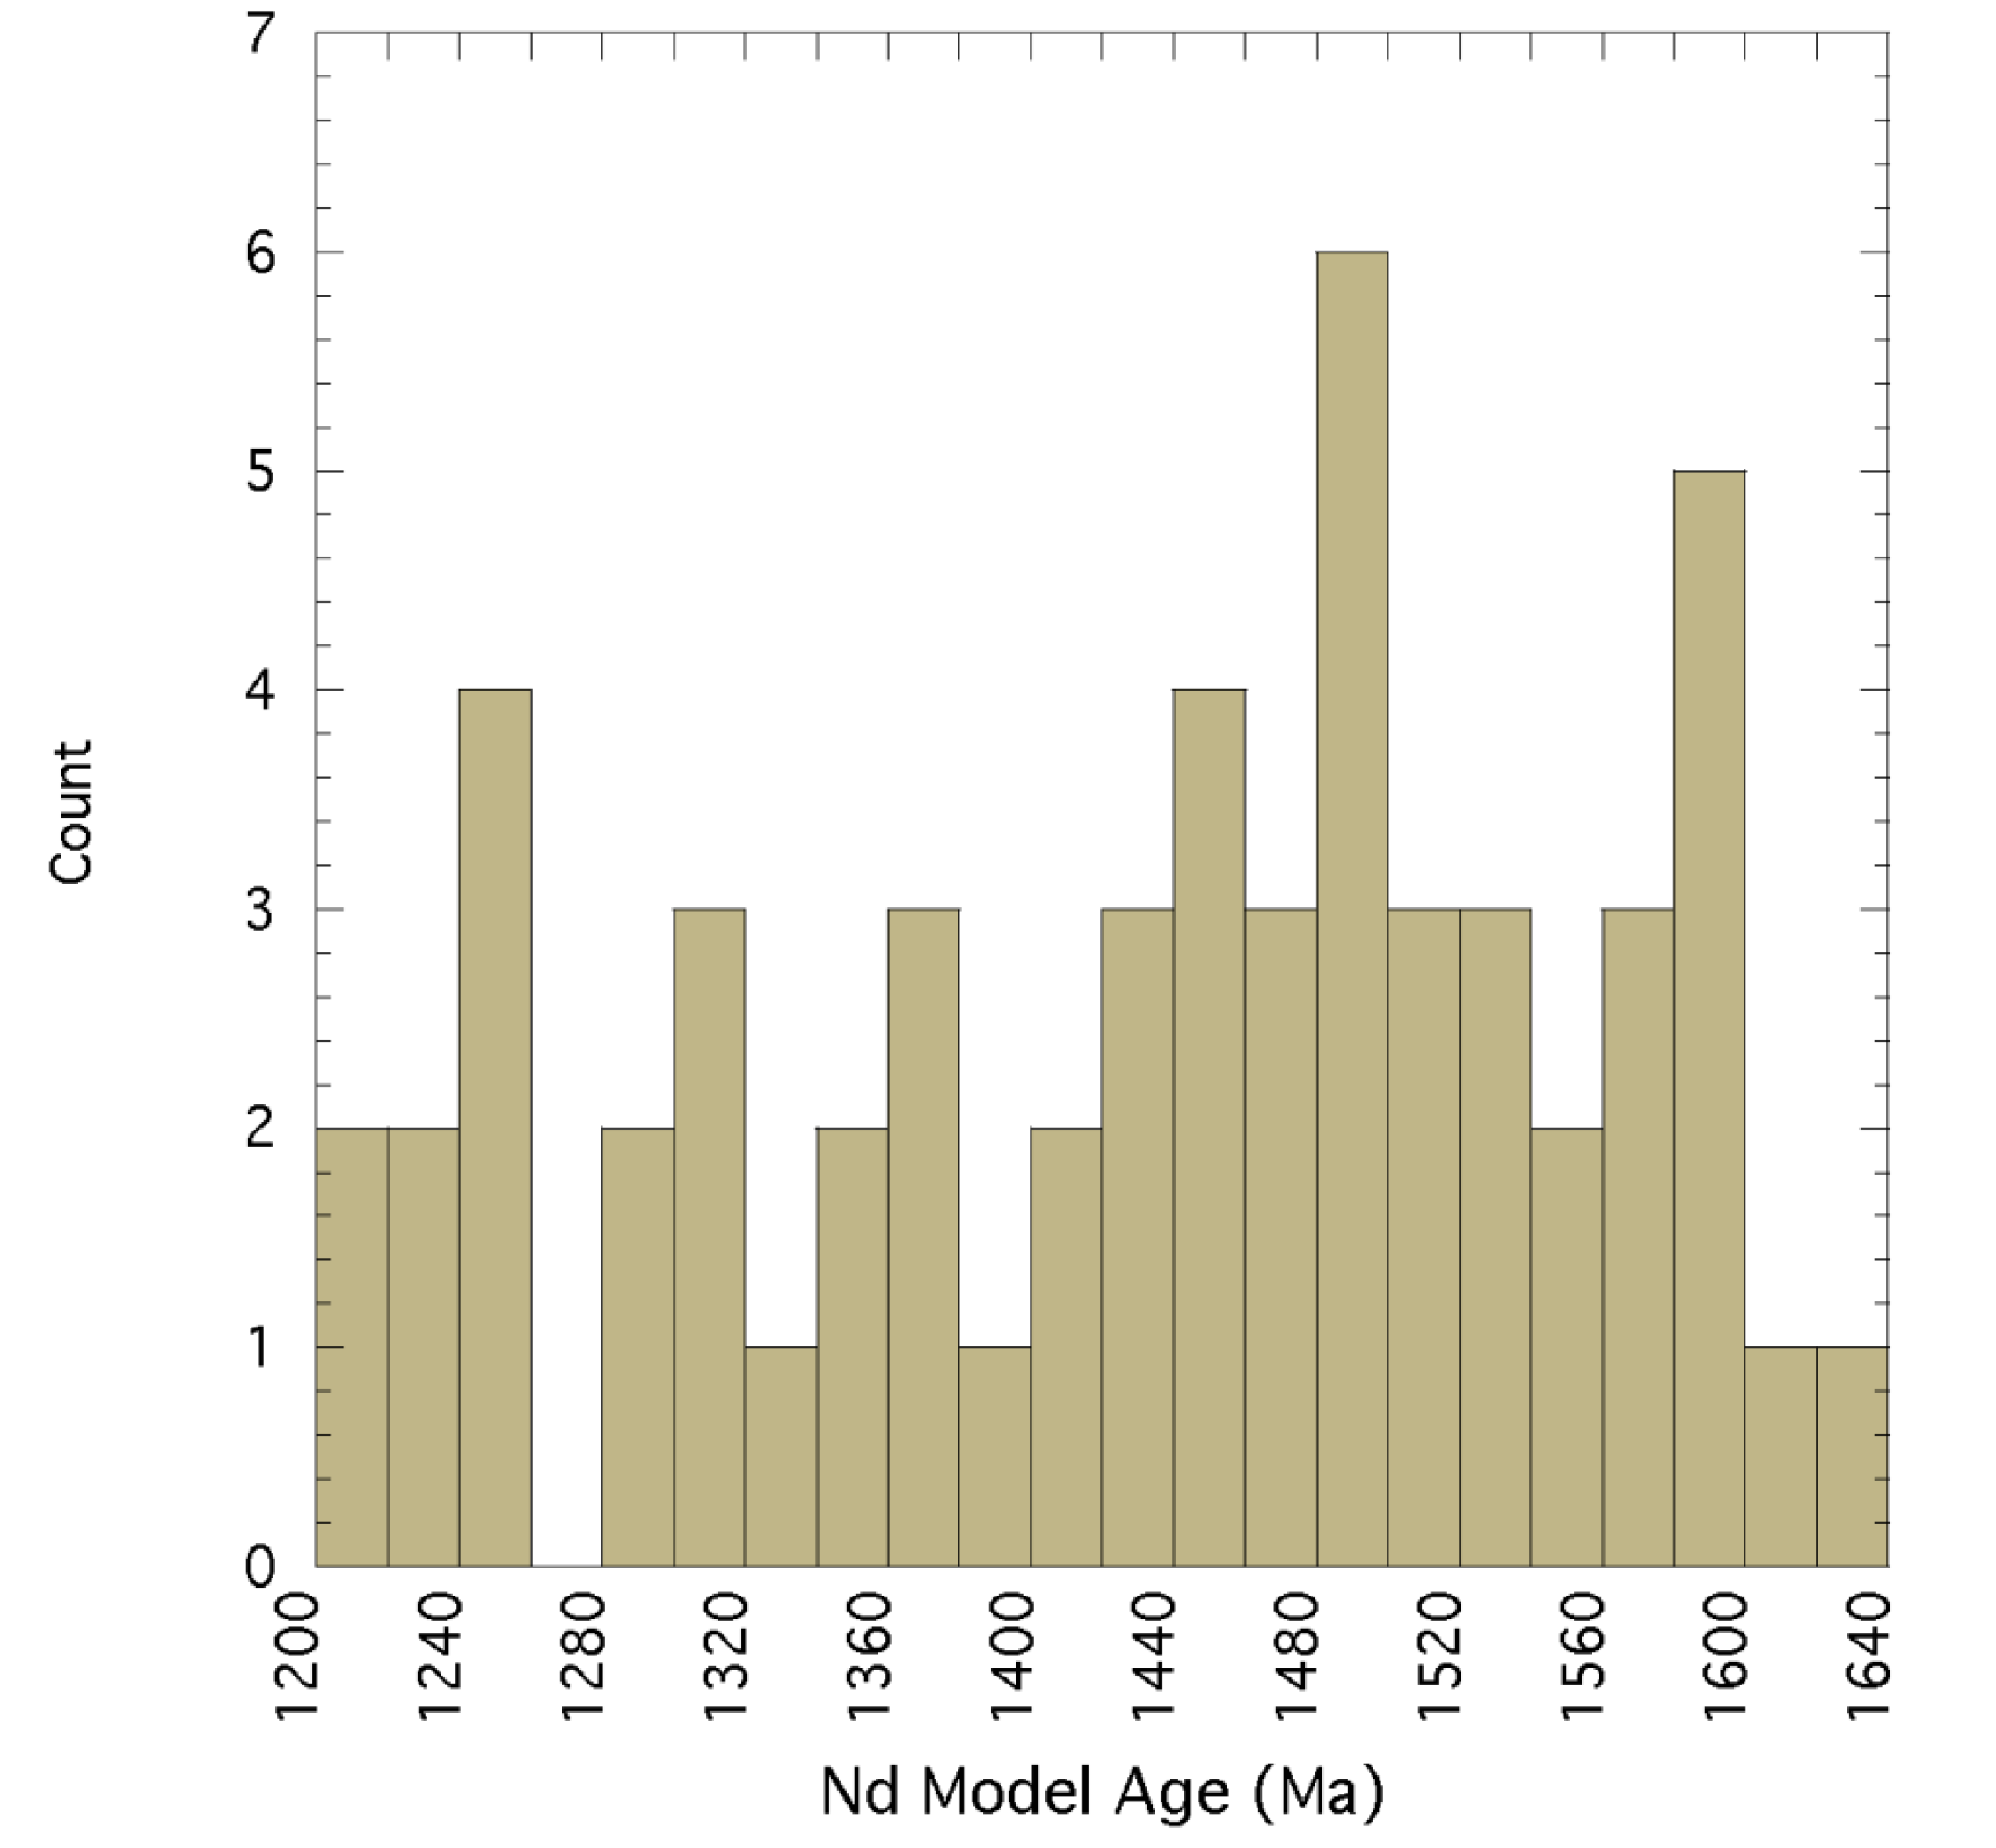
Figure 3)], and appear to record the final amalgamation of Nuna. If Nuna fragmented, it occurred in the time interval of 1500–1300 Ma, before or overlapping with the Albany-Fraser and Musgrave collisions in Australia at 1345–1330 Ma. There is a suggestion of a short-lived minimum at about 1350–1200 Ma in both the zircon age spectra and in model Nd and Hf ages, which could correspond to the fragmentation (or more likely, partial fragmentation) of Nuna (
Figure 4,
Figure 5; [
4]). Grenvillian collisions began at 1200 Ma marking the onset of the formation of Rodinia. The last stages in the formation of Rodinia are recorded by the Eastern Ghats collision in India at 1085 Ma and the Kibaran collision in East Africa at 1000 Ma.
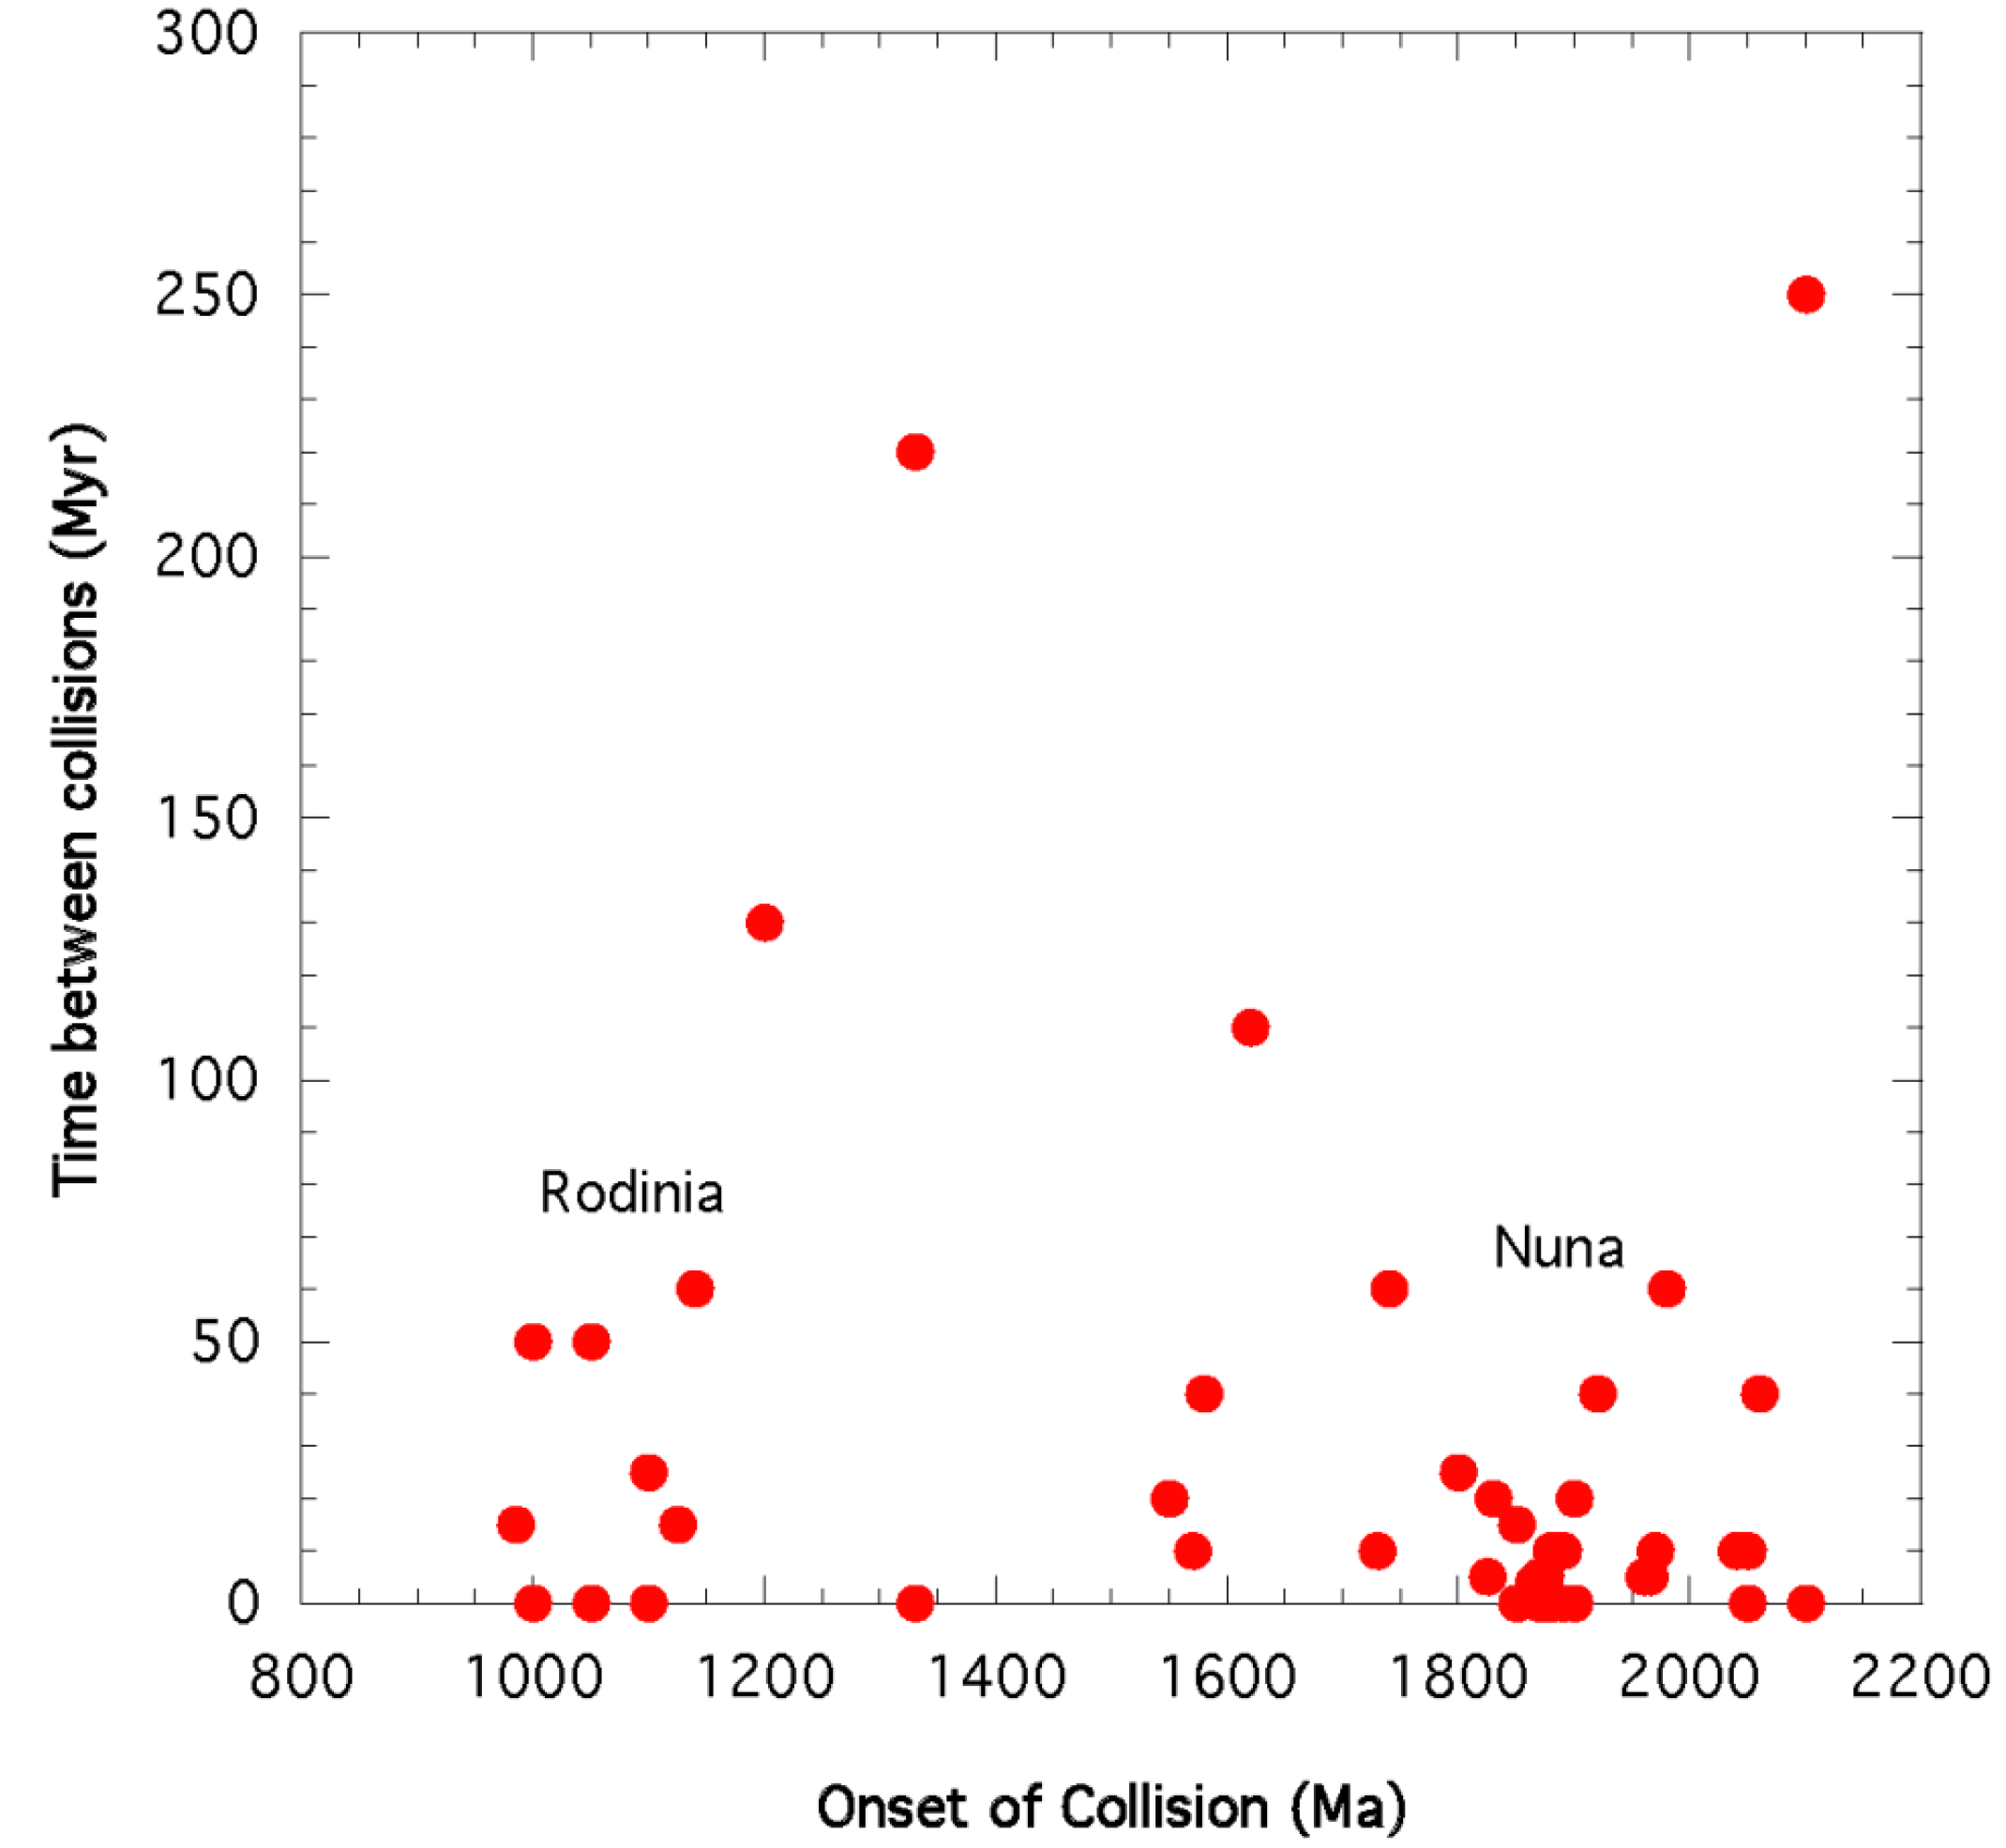
The time interval between collisions ranges from zero to 250 Myr. Most are <50 Myr with a mean of 26 Myr and a median of 10 Myr. As shown in
Figure 6, there is no apparent relationship between the time interval between collisions and collision age. There are four notably long time intervals (>100 Myr): Borborema to Luizian (250 Myr), Albany-Fraser to Eastern Ghats (220 Myr), Penokean-Yavapai-Mazatzal to Musgrave (130 Myr) and Nimrod-Ross to Olarian (110 Myr). As expected, the shortest times between collisions (<10 Myr) correlate with either the growth of Nuna at 1900–1800 Ma or the growth of Rodinia at 1200–1000 Ma.
Figure 1.
Frequency of onset of subduction and collision in Proterozoic orogens (data from Appendix 1, peak ages given in Ma).
Figure 1.
Frequency of onset of subduction and collision in Proterozoic orogens (data from Appendix 1, peak ages given in Ma).
Figure 2.
Diagrammatic assembly of Nuna showing major accretionary orogens
(2400–1300 Ma). Reconstruction after Zhao
et al. [
16] and Evans and Mitchell [
17].
Figure 2.
Diagrammatic assembly of Nuna showing major accretionary orogens
(2400–1300 Ma). Reconstruction after Zhao
et al. [
16] and Evans and Mitchell [
17].
Figure 3.
Diagrammatic assembly of Nuna showing major collisional orogens (2400–1500 Ma). Reconstruction after Zhao
et al. [
16] and Evans and Mitchell [
17].
Figure 3.
Diagrammatic assembly of Nuna showing major collisional orogens (2400–1500 Ma). Reconstruction after Zhao
et al. [
16] and Evans and Mitchell [
17].
Figure 4.
Nd model ages of granites from Southwestern United States and the Mid-continent region of Laurentia. Data compiled in Appendix 1.
Figure 4.
Nd model ages of granites from Southwestern United States and the Mid-continent region of Laurentia. Data compiled in Appendix 1.
Figure 5.
Hf model ages from detrital zircons from modern rivers in Laurentia. Data from Belousova
et al. [
5] and Condie
et al. [
13] and references therein.
Figure 5.
Hf model ages from detrital zircons from modern rivers in Laurentia. Data from Belousova
et al. [
5] and Condie
et al. [
13] and references therein.
Figure 6.
Graph of the time between orogenic collisions and the onset of collision (data from Appendix 1).
Figure 6.
Graph of the time between orogenic collisions and the onset of collision (data from Appendix 1).
2.2. Orogen Durations
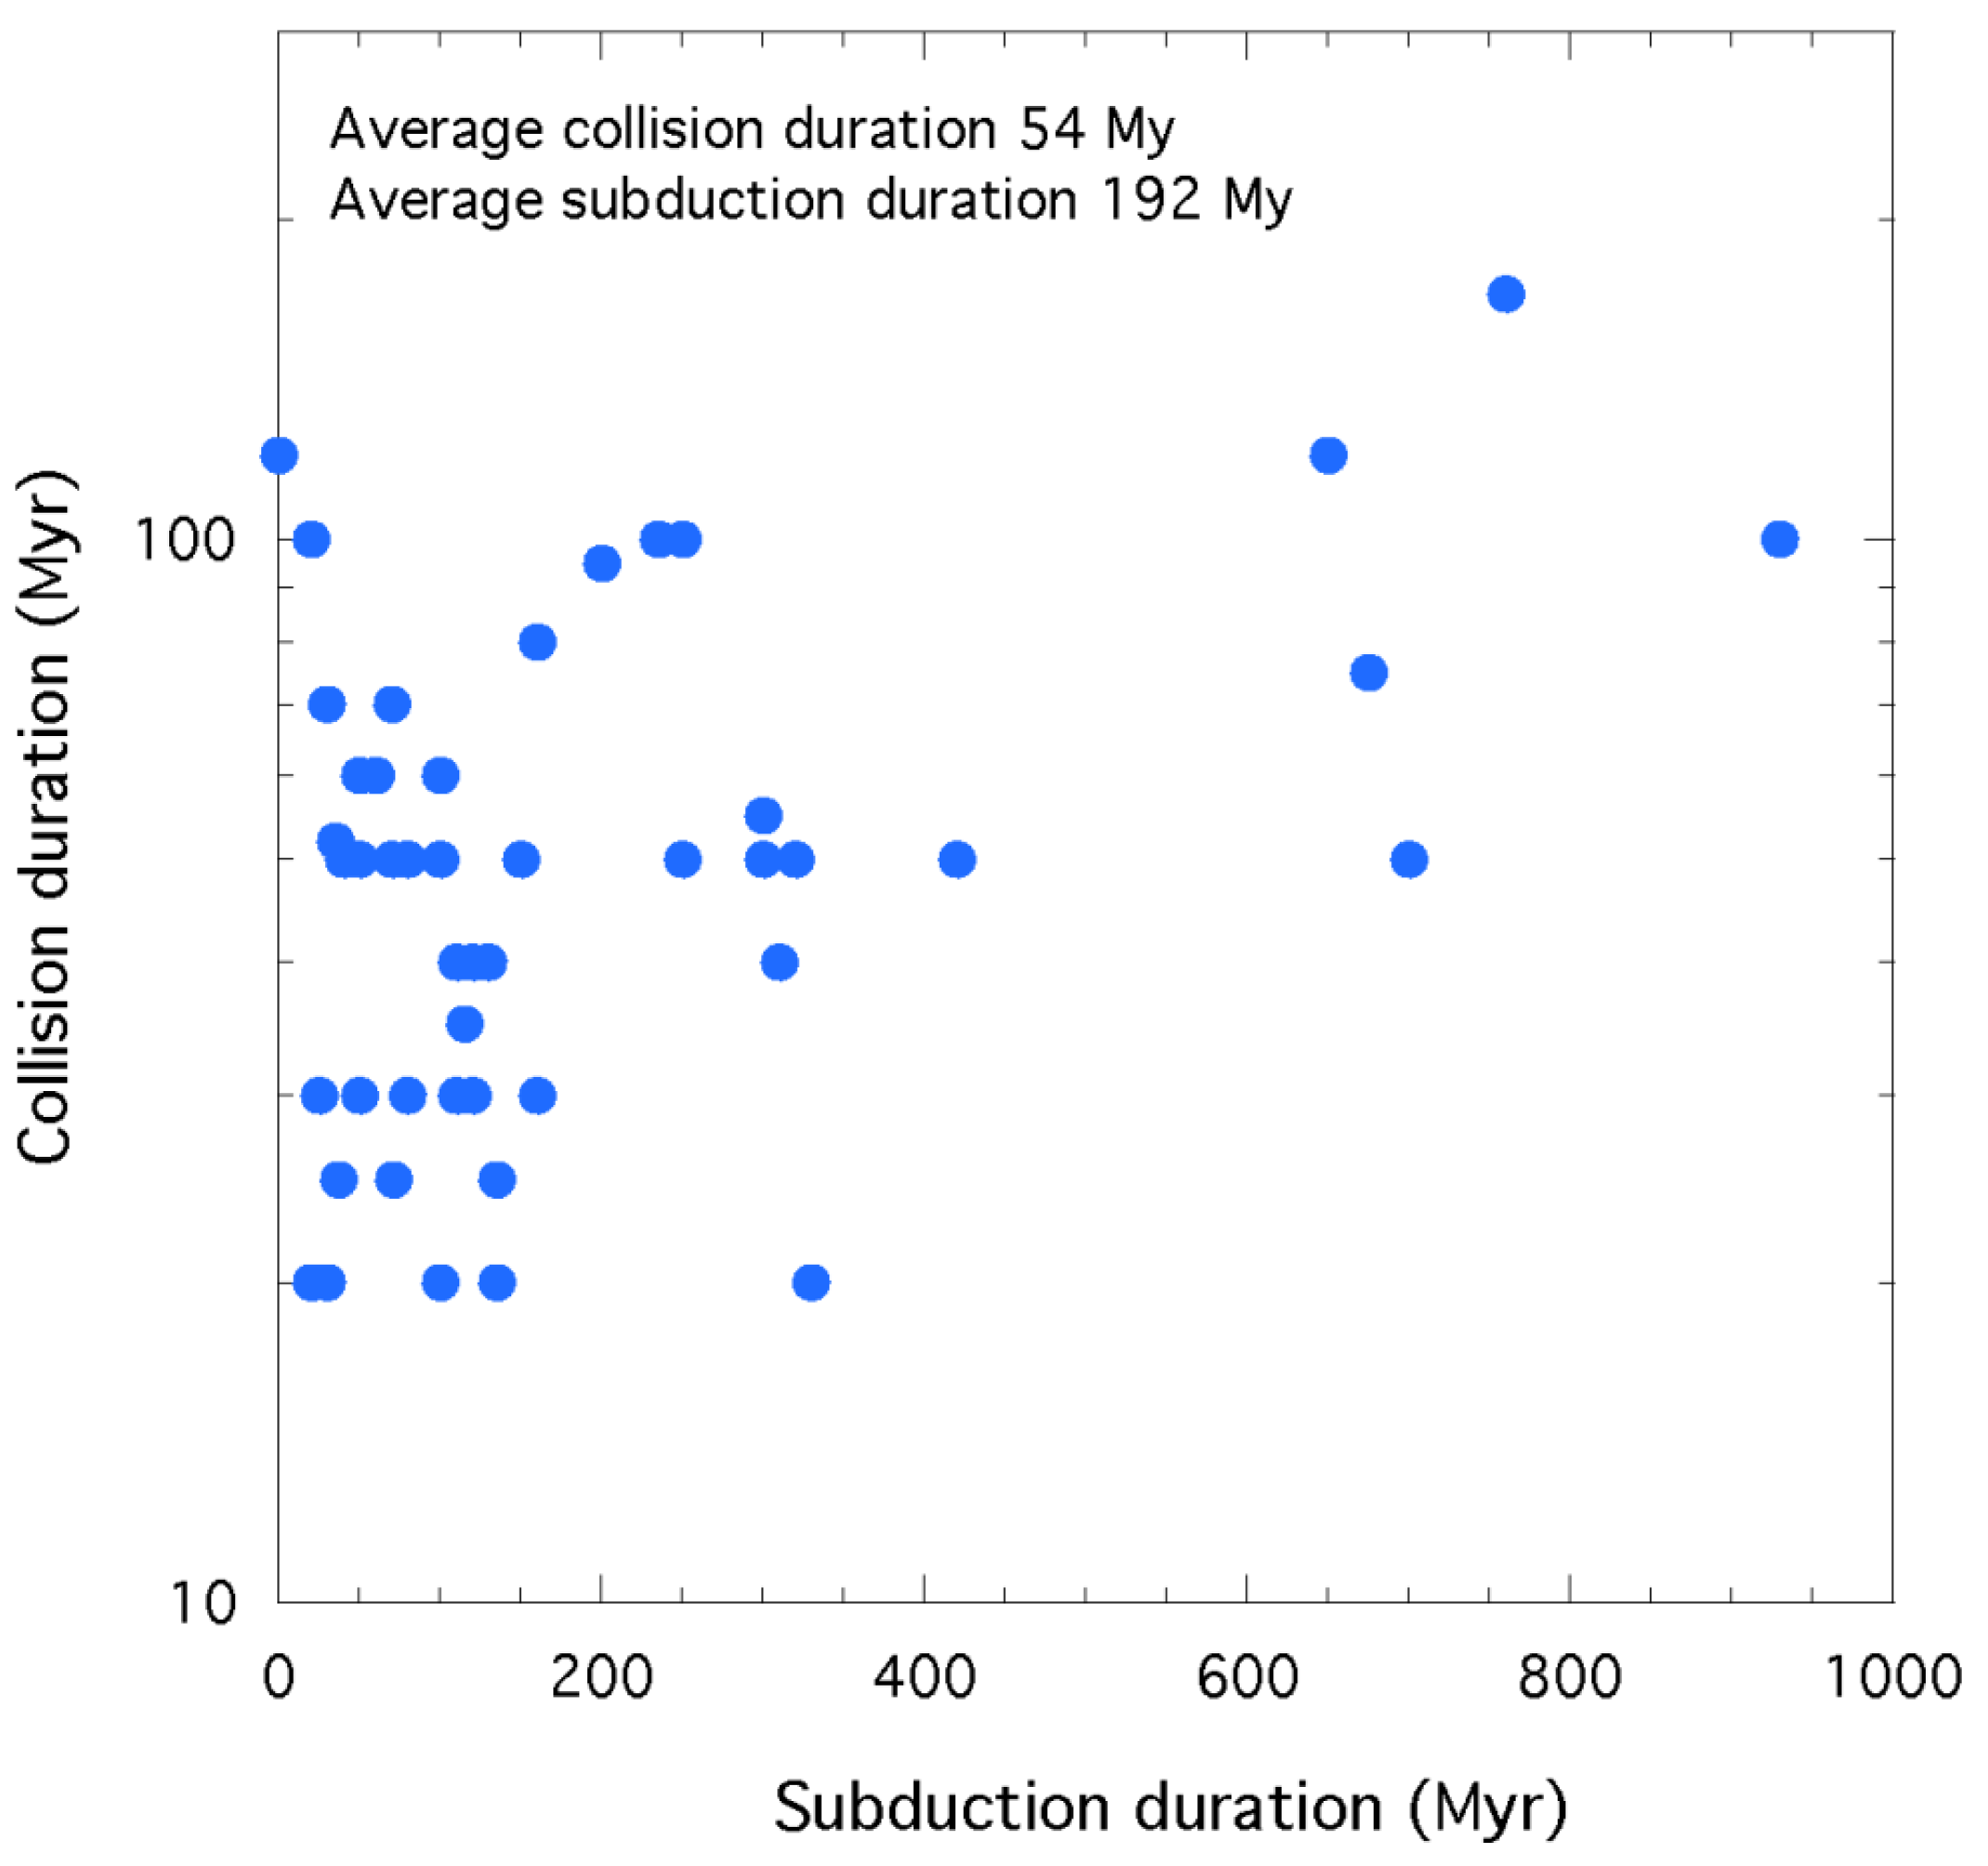
To better understand how and when crust is preserved in orogens, it is useful to examine the duration of both the subduction (ocean-basin closing) and collisional stages, estimates of which are compiled in Appendix 1. The onset of subduction is equated with the ages of the oldest arc volcanic and plutonic rocks, and the onset of collision from the oldest syntectonic granitoids and structures associated with a continent-continent collision. The terminations of subduction and collision are more difficult to estimate since these processes end diachronously as colliding continents or terranes are annealed to each other and delamination ceases. This termination is equated with the oldest post-tectonic plutons, dykes and structures, which is a maximum age for the end of collision. Duration of subduction is estimated as the difference between the age of the onset of subduction and the onset of collision, which is a maximum age for duration of closing of an ocean basin, since subduction associated with the accretionary stage may have started before the actual closing of the ocean basin. Subduction duration ranges from about 20 to 900 Myr (mean = 192 Myr) and collision duration from 20 to 170 Myr (mean 54 Myr) (
Figure 7). Only eight examples have collisional durations ≥100 Myr, whereas about 30% have collisional durations ≤30 Myr.
Figure 7.
Graph of collision duration versus subduction duration for Proterozoic orogens (data from Appendix 1).
Figure 7.
Graph of collision duration versus subduction duration for Proterozoic orogens (data from Appendix 1).
In terms of subduction duration, orogens fall into two groups: those with subduction durations <500 Myr (mean = 125 Myr) and those with durations of ≥500 Myr (mean = 720 Myr) (
Figure 7). Only five examples of the ≥500 Myr group are recognized: Penokean-Yavapai-Mazatzal, Makkovikian-Labradorian, Baltica, Amazonia, and Xiong’er. The first four of these comprise the Great Proterozoic Accretionary Orogen (GPAO), which may be the longest-lived orogen of all time, parts of it enduring for at least 900 Myr (Appendix 1). All of the orogens with a long subduction duration stage began as accretionary orogens during the amalgamation of Nuna, and did not terminate in collision until Rodinia formed at 1200–1000 Ma. It is noteworthy that the subduction duration of most Proterozoic orogens is longer than the lifespan (oldest igneous rock age minus accretion age) of typical terranes in these orogens (50–100 Myr; [
18]). This means that, on average, arc magmatism in terranes continues after terrane docking.
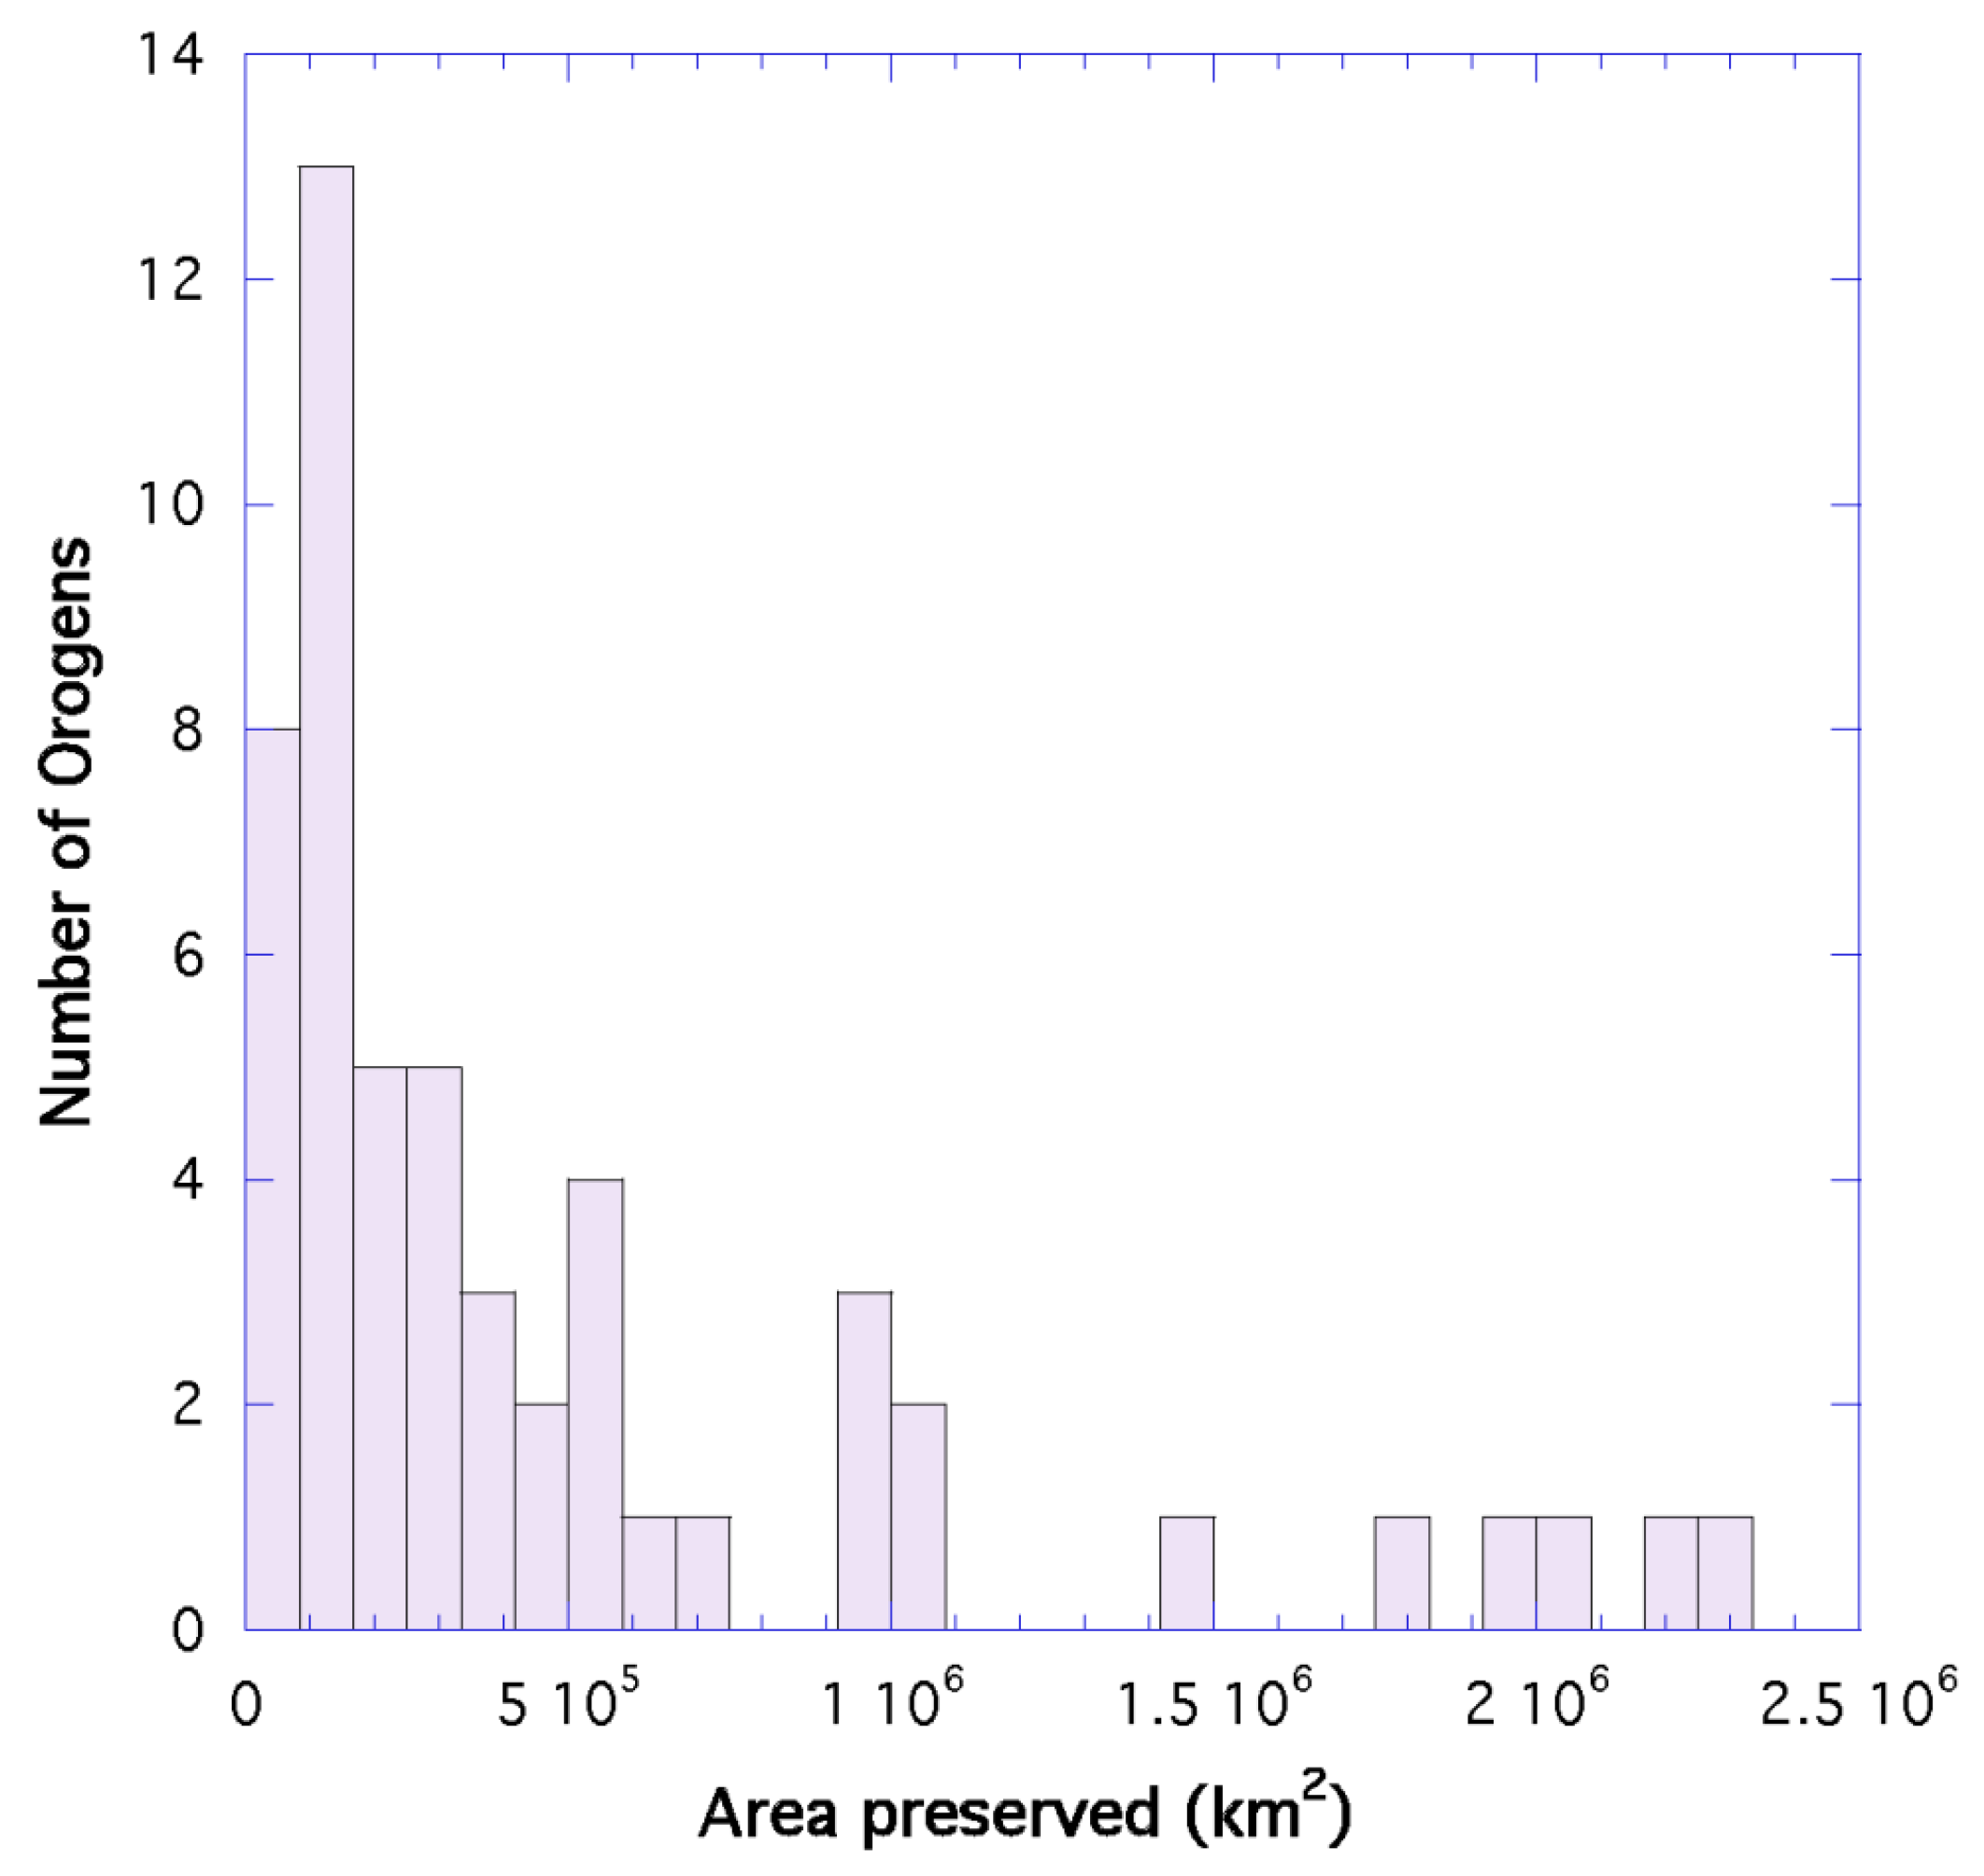
Also given in Appendix 1 are estimates of the areas of preserved orogens today. Most orogens have preserved areas between 10
5 and 10
6 km
2, with a mean of about 5 × 10
5 km
2 (
Figure 8). It is noteworthy that neither orogen age nor the duration of either subduction or collision correlates with area preserved.
Figure 8.
Frequency of area preserved of Proterozoic orogens (data from Appendix 1).
Figure 8.
Frequency of area preserved of Proterozoic orogens (data from Appendix 1).
2.3. Tectonic Settings Preserved in Orogens
In order to better estimate the amount of juvenile crust preserved in orogens, it is important to identify tectonic settings preserved in orogens. Tectonic settings are inferred from rock associations and geochemical features as described in previous papers [
18,
19,
20]. The areal abundances of various settings are estimated from geologic maps at varying scales. Preserved tectonic settings represent an array of older and contemporary crust that survived subduction during closing of an ocean basin. They include both oceanic and continental tectonic regimes as represented by supracrustal and plutonic rocks. Greenstones (supracrustal assemblages in which mafic volcanics dominate) are perhaps most definitive in identifying ancient tectonic settings. The distribution of Proterozoic greenstones preserved in orogens grouped into arc and non-arc settings is shown in
Figure 9. Although both types of greenstones are preserved throughout the Proterozoic, those associated with the formation of Nuna between 2100 and 1650 Ma are more frequently preserved than at other times. The exception is a peak at about 1300 Ma, which is defined by greenstones and associated plutons from two areas in the Eastern Grenville (Central Metamorphic Belt and the Adirondacks) and one in the Namaqua orogen in southern Africa. Unlike Nuna, very few greenstones are preserved that accompanied the assembly of Rodinia between 1200 and 1000 Ma, and the reason for this is an important outstanding question.
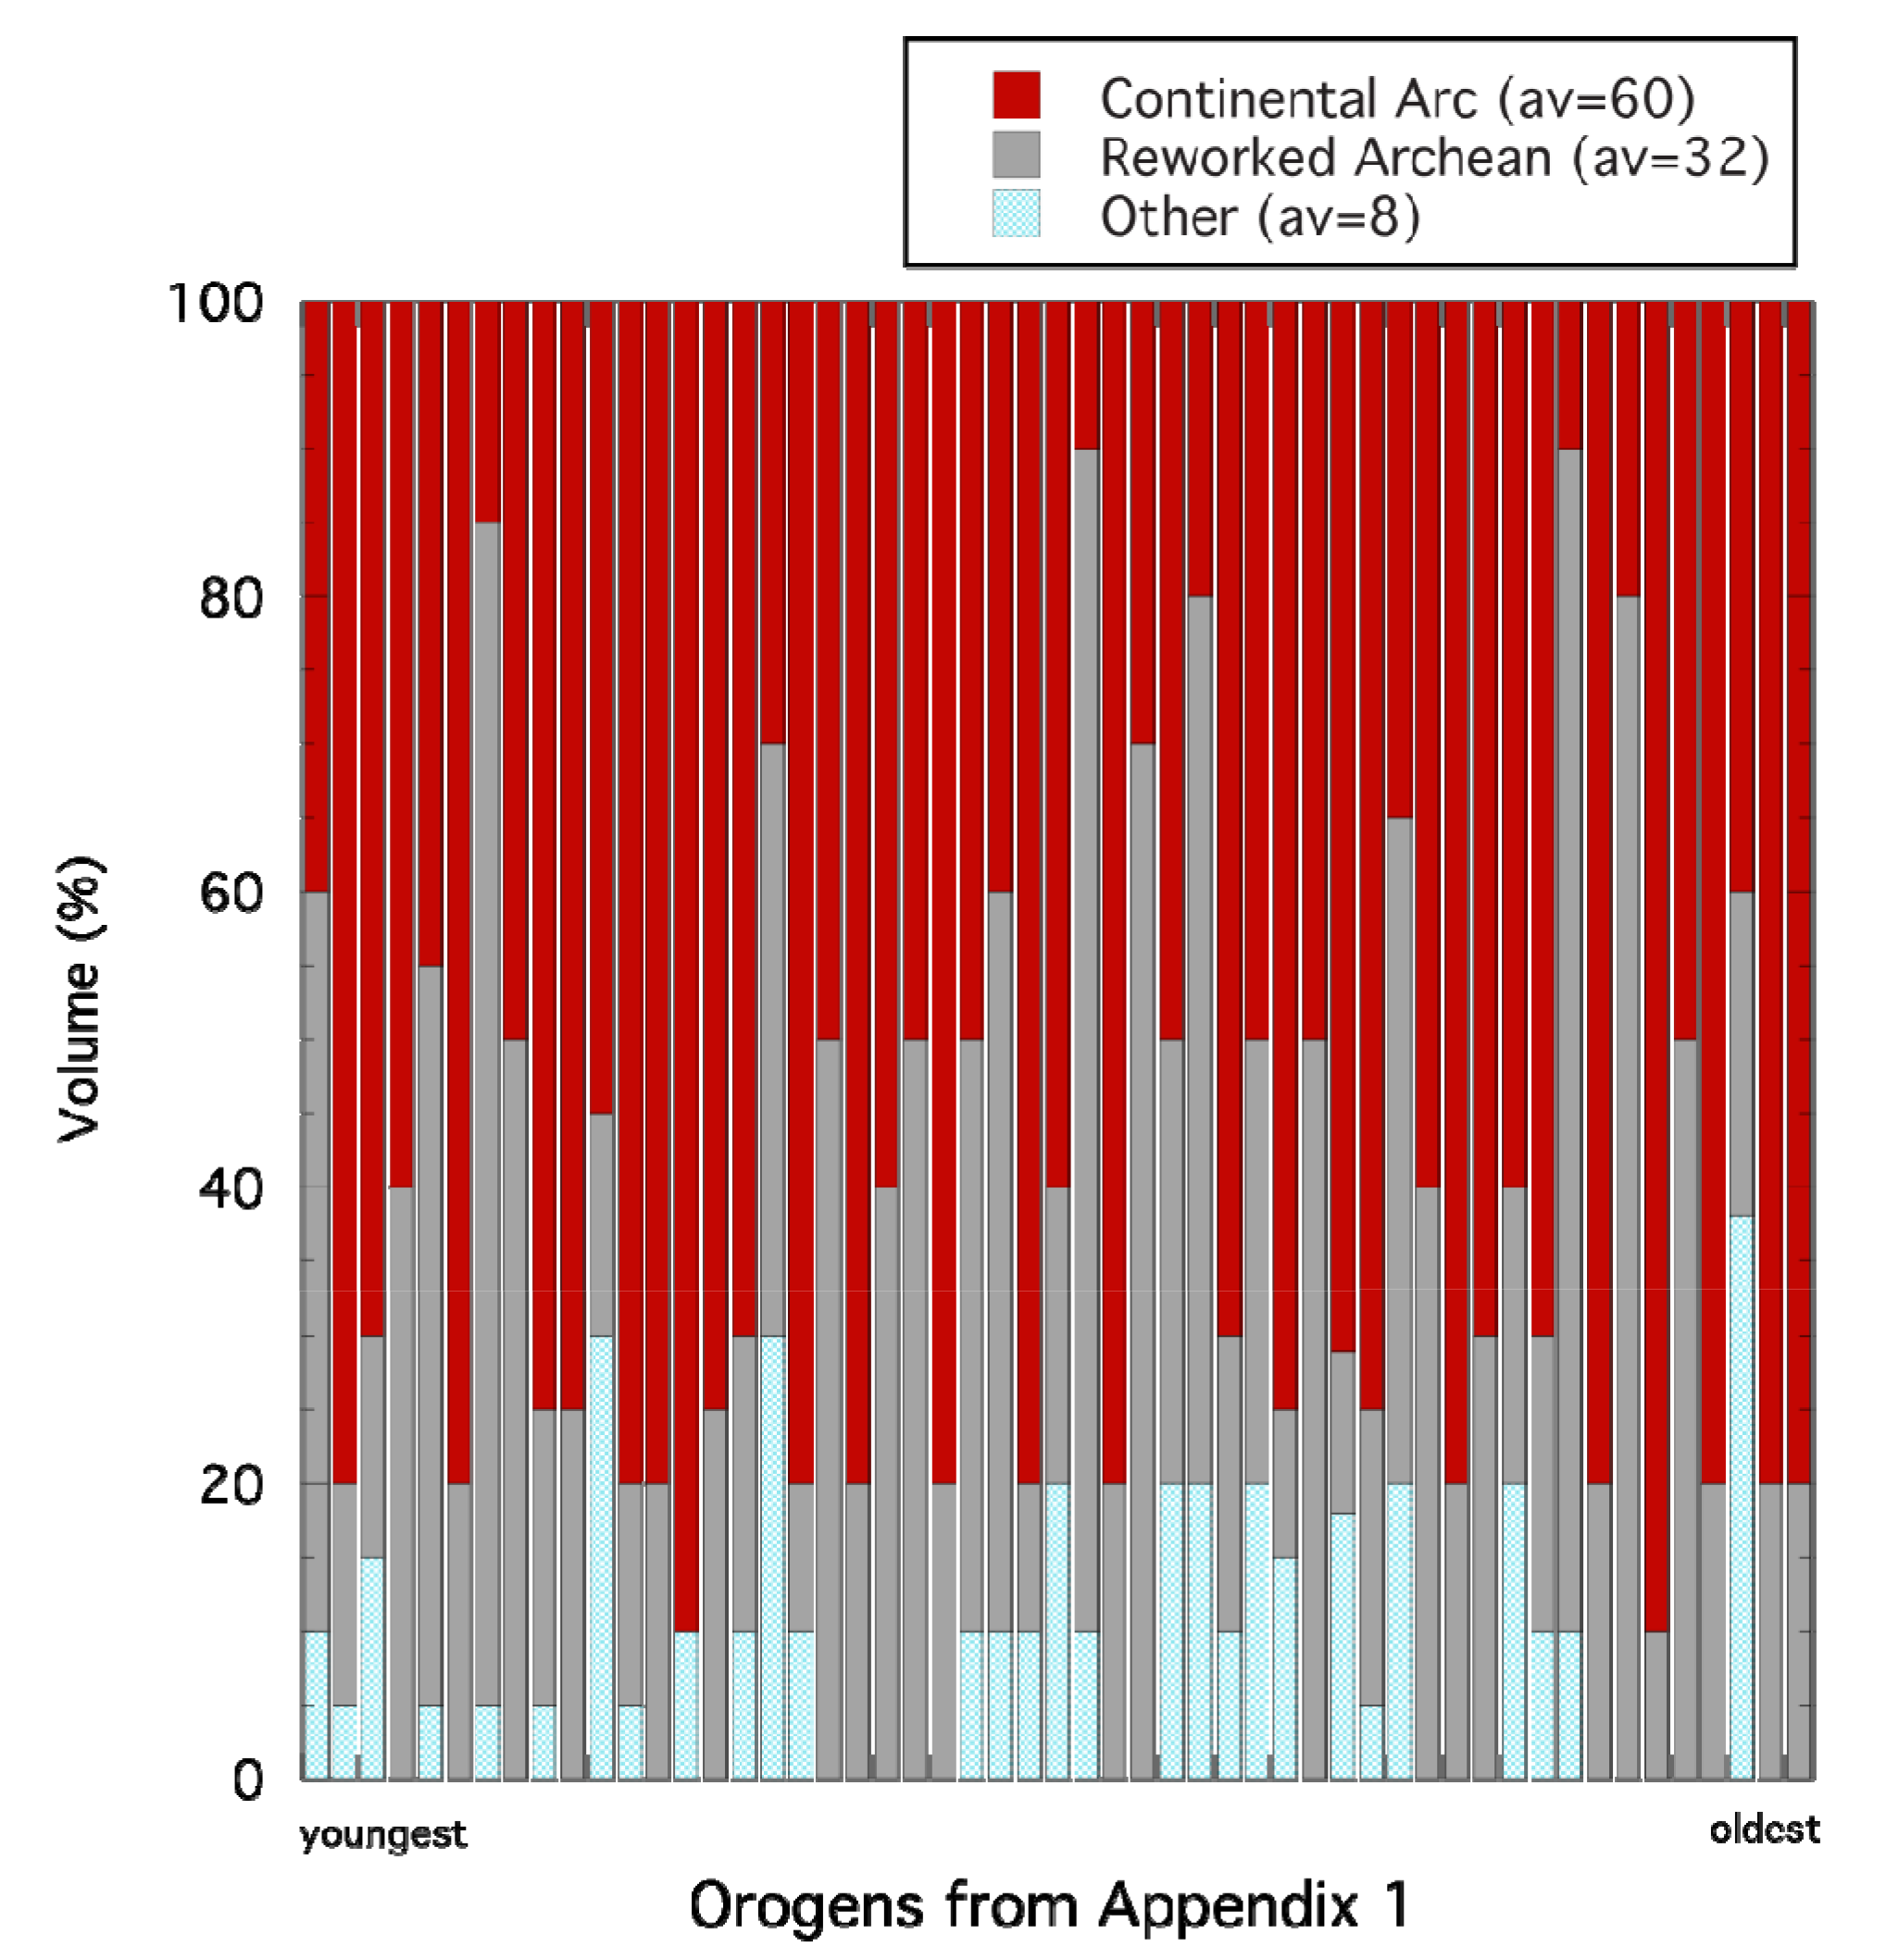
Tectonic settings preserved in orogens are summarized in Appendix 1. On average, the most abundant preserved setting is the continental arc ranging from 10% to 90% by volume (mean = 60%) (
Figure 10). In most orogens, remnants of continental arcs comprise from 60% to 70% of exposed rocks, but in a few examples, such as the Limpopo, Usagaran-Tanzania, Ubendian, New Quebec, and Angara orogens, they comprise ≤20%. Some of these orogens may involve a large transpressive subduction component, such that arc magmatism was minimal. In contrast to continental arcs, oceanic arcs comprise a very small amount of orogens (<10%). This is in agreement with the results of Condie and Kroner [
21], who suggest that oceanic arcs are not major components of continental growth. Other oceanic tectonic settings such as oceanic crust (including ophiolites), serpentinites, pelagic sediments, and oceanic islands and plateaus are also rarely preserved in most orogens. Collectively, they comprise <20% and often <10% of rocks preserved in orogens with an average value of only 8%. One outstanding exception is the Trans-Hudson orogen in Canada, in which nearly 40% of oceanic terranes are preserved in the central part of the orogen. The Eburnean and Birimian-Transamazonian orogens in West Africa and South America are also unusual in that they comprise about 30% of oceanic terranes.
Figure 9.
Frequency of arc and non-arc type greenstones preserved in Proterozoic orogens. Data from unpublished database of the author; earlier versions of the database can be found in [
22,
23].
Figure 9.
Frequency of arc and non-arc type greenstones preserved in Proterozoic orogens. Data from unpublished database of the author; earlier versions of the database can be found in [
22,
23].
Figure 10.
Volume percent of tectonic settings preserved in Proterozoic orogens (data from Appendix 1). Other: oceanic crust, serpentinites, pelagic sediments, oceanic islands and plateaus; av: average percent.
Figure 10.
Volume percent of tectonic settings preserved in Proterozoic orogens (data from Appendix 1). Other: oceanic crust, serpentinites, pelagic sediments, oceanic islands and plateaus; av: average percent.
Both reworked crust and microcratons also occur in orogens. Reworked crust comprises chiefly Archean components that occur as some combination of basement, accreted terranes, and sediments. Reworked components generally comprise between 20% and 80% of orogens with an average of 32%, based on Nd and Hf isotope studies (Appendix1;
Figure 10). Microcratons, such as the Sask craton in the Trans-Hudson orogen, are difficult to identify without geophysical data, because they often are not exposed at the surface. Thus, microcratons may be more abundant than suggested by the data in Appendix 1. Four orogens are unusual in that they comprise about 80% reworked components (Limpopo, Usagaran-Tanzania, Angara, and Ubendian). It is possible that these four orogens involved largely transpressive collisions with minimal amounts of concurrent arc magmatism.
2.4. Juvenile Crust Preserved in Orogens
There is a large database of Nd and Hf isotopes and geologic maps upon which the distribution of juvenile crust (both continental and oceanic) can be constrained [
4,
5,
18,
24]. Juvenile crust includes crust that has been extracted from the mantle with a relatively short crustal residence time (≤200 Myr), most of which resides in remnants of continental arcs [
21]. Hawkesworth
et al. [
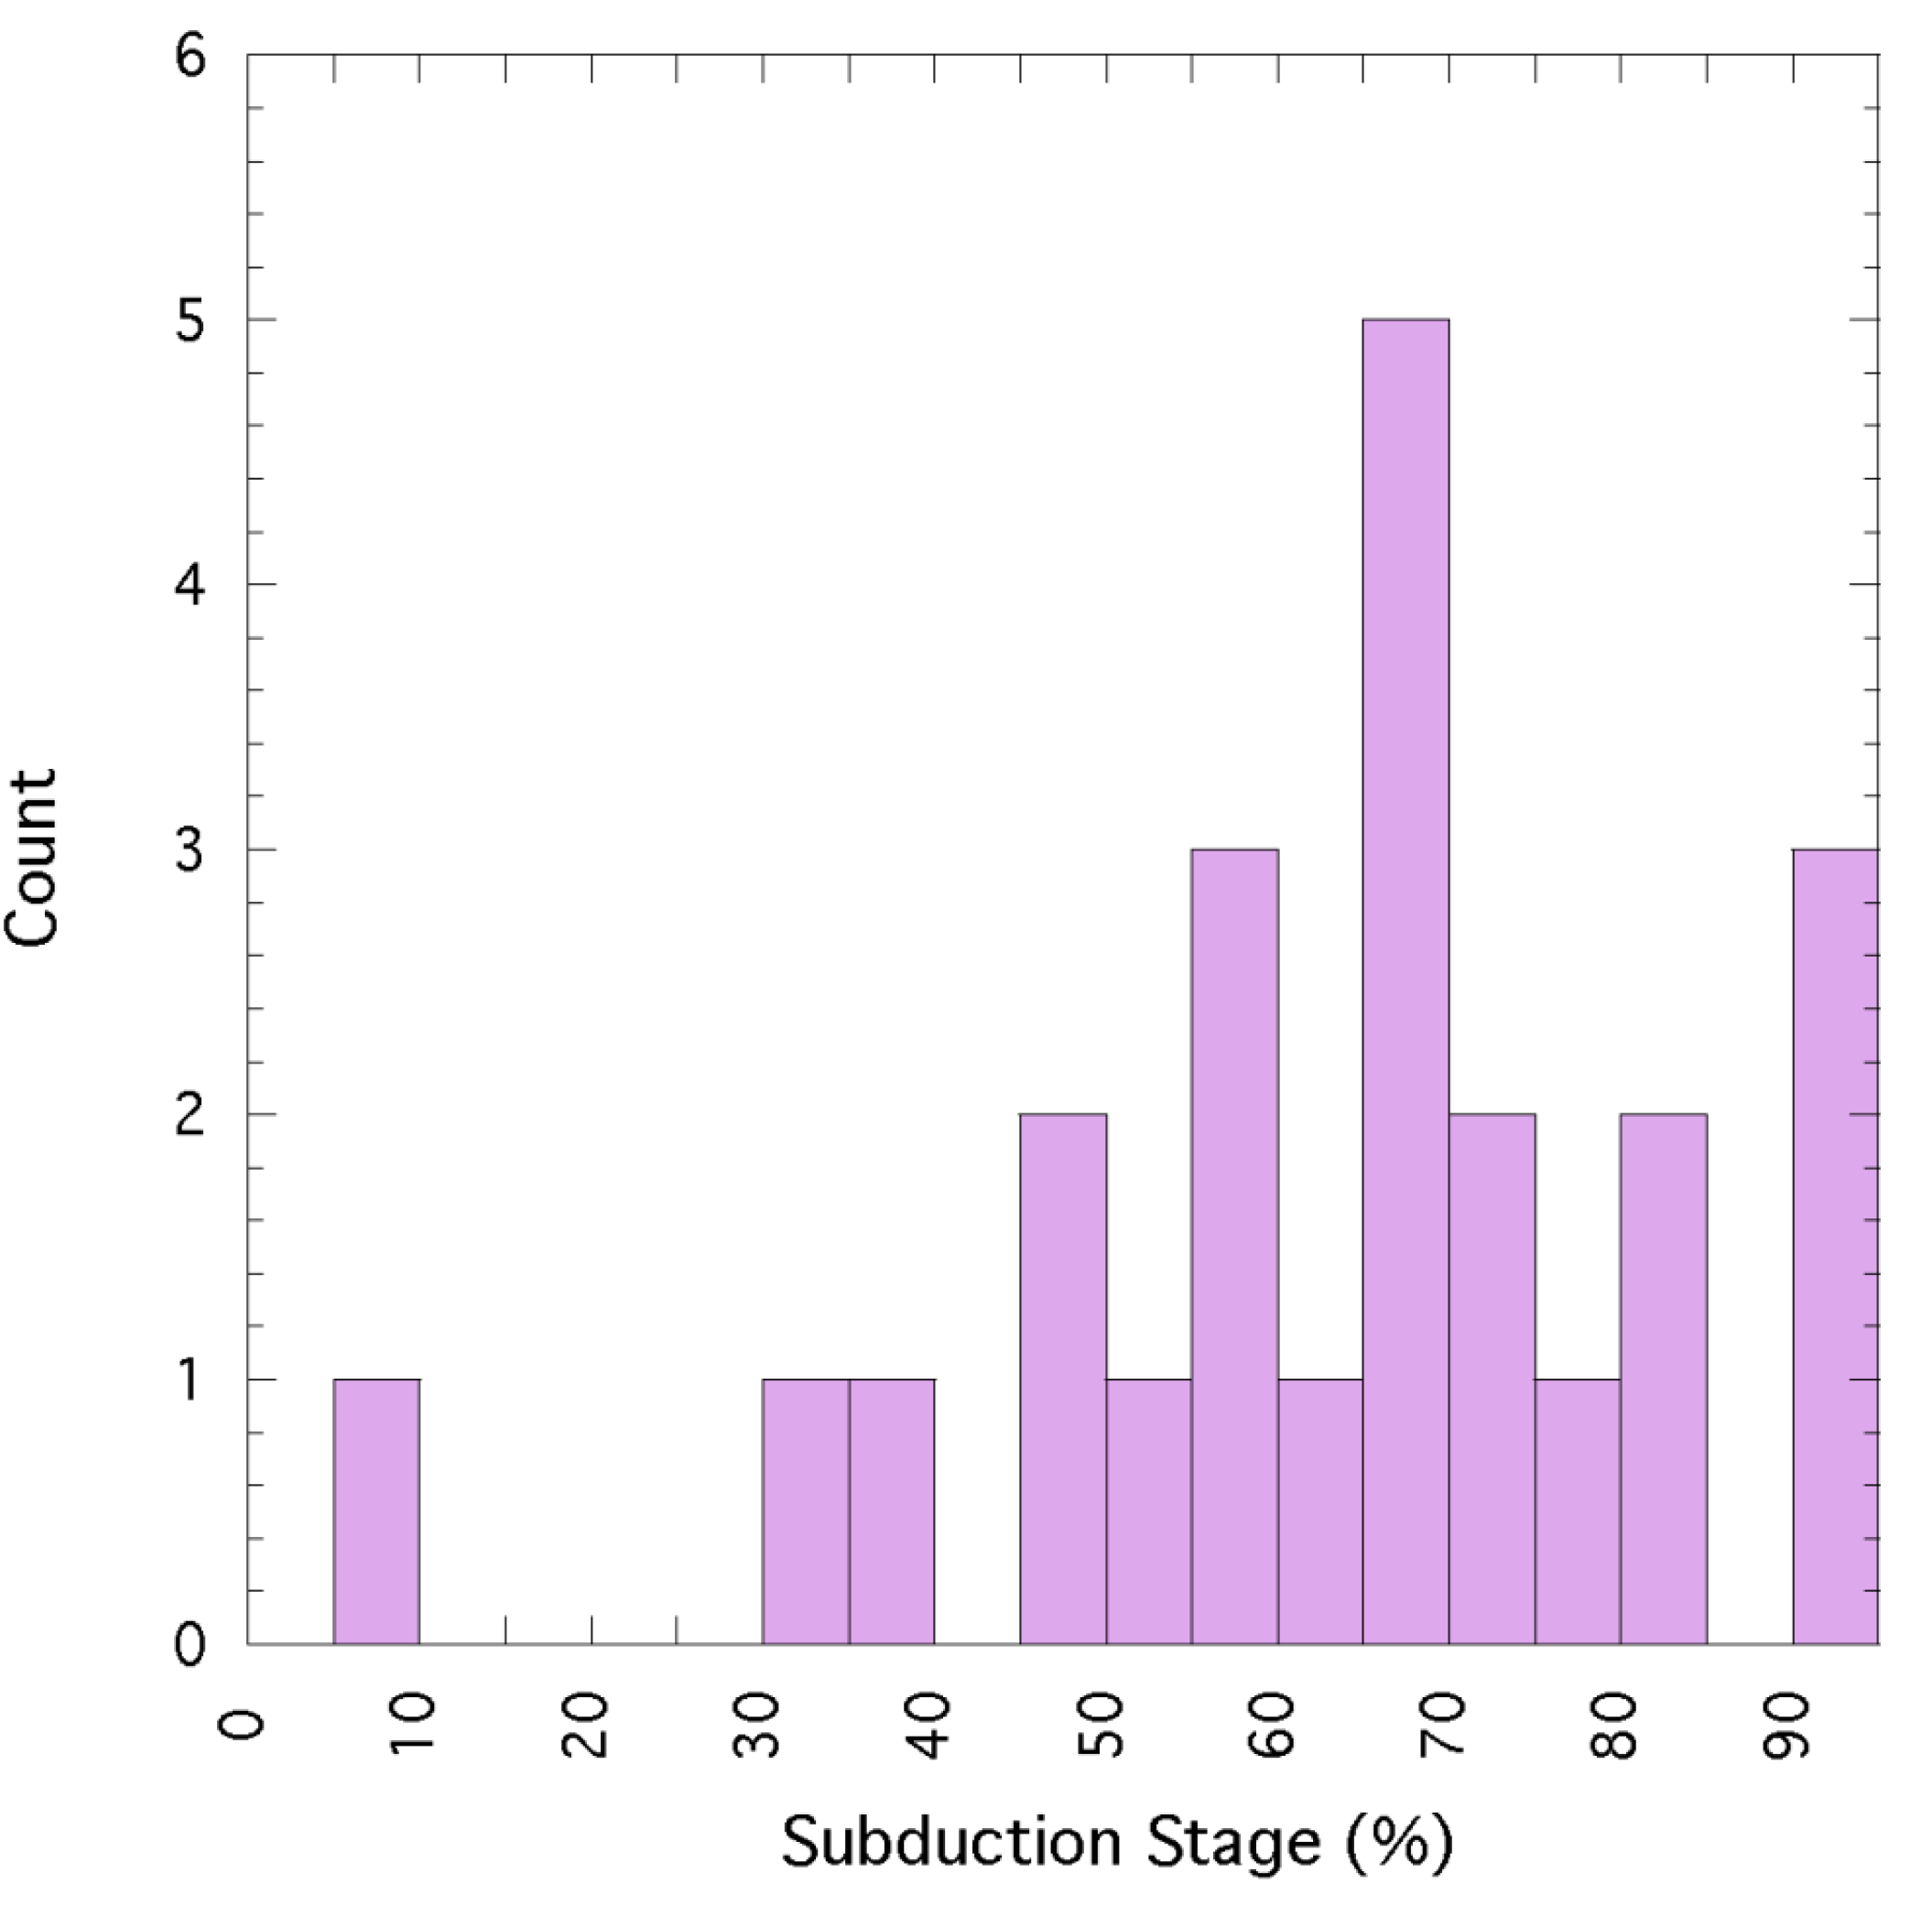
11] have suggested that peak igneous activity preserved in orogens is reached early in the collisional stage. To test this idea, we have calculated the preservation ratio of rocks in the subduction stage (ocean-basin closing) to those in the subduction + collision stage in Proterozoic orogens (Appendix 1). The ratio is calculated from a combination of igneous zircon ages and areal distributions of igneous rocks as estimated from geologic maps. Note that this estimate does not include possible contributions from mafic underplating. As shown in
Figure 11, there is a considerable range in preservation ratio (expressed as percent of subduction stage), with igneous rocks formed during the subduction stage ranging from <10% to 90% of the total (mean = 63%; median = 67%). Clearly, a large fraction of the non-reworked rocks preserved in orogens date to the pre-collisional, ocean-closing stage and not to the actual collisional stage.
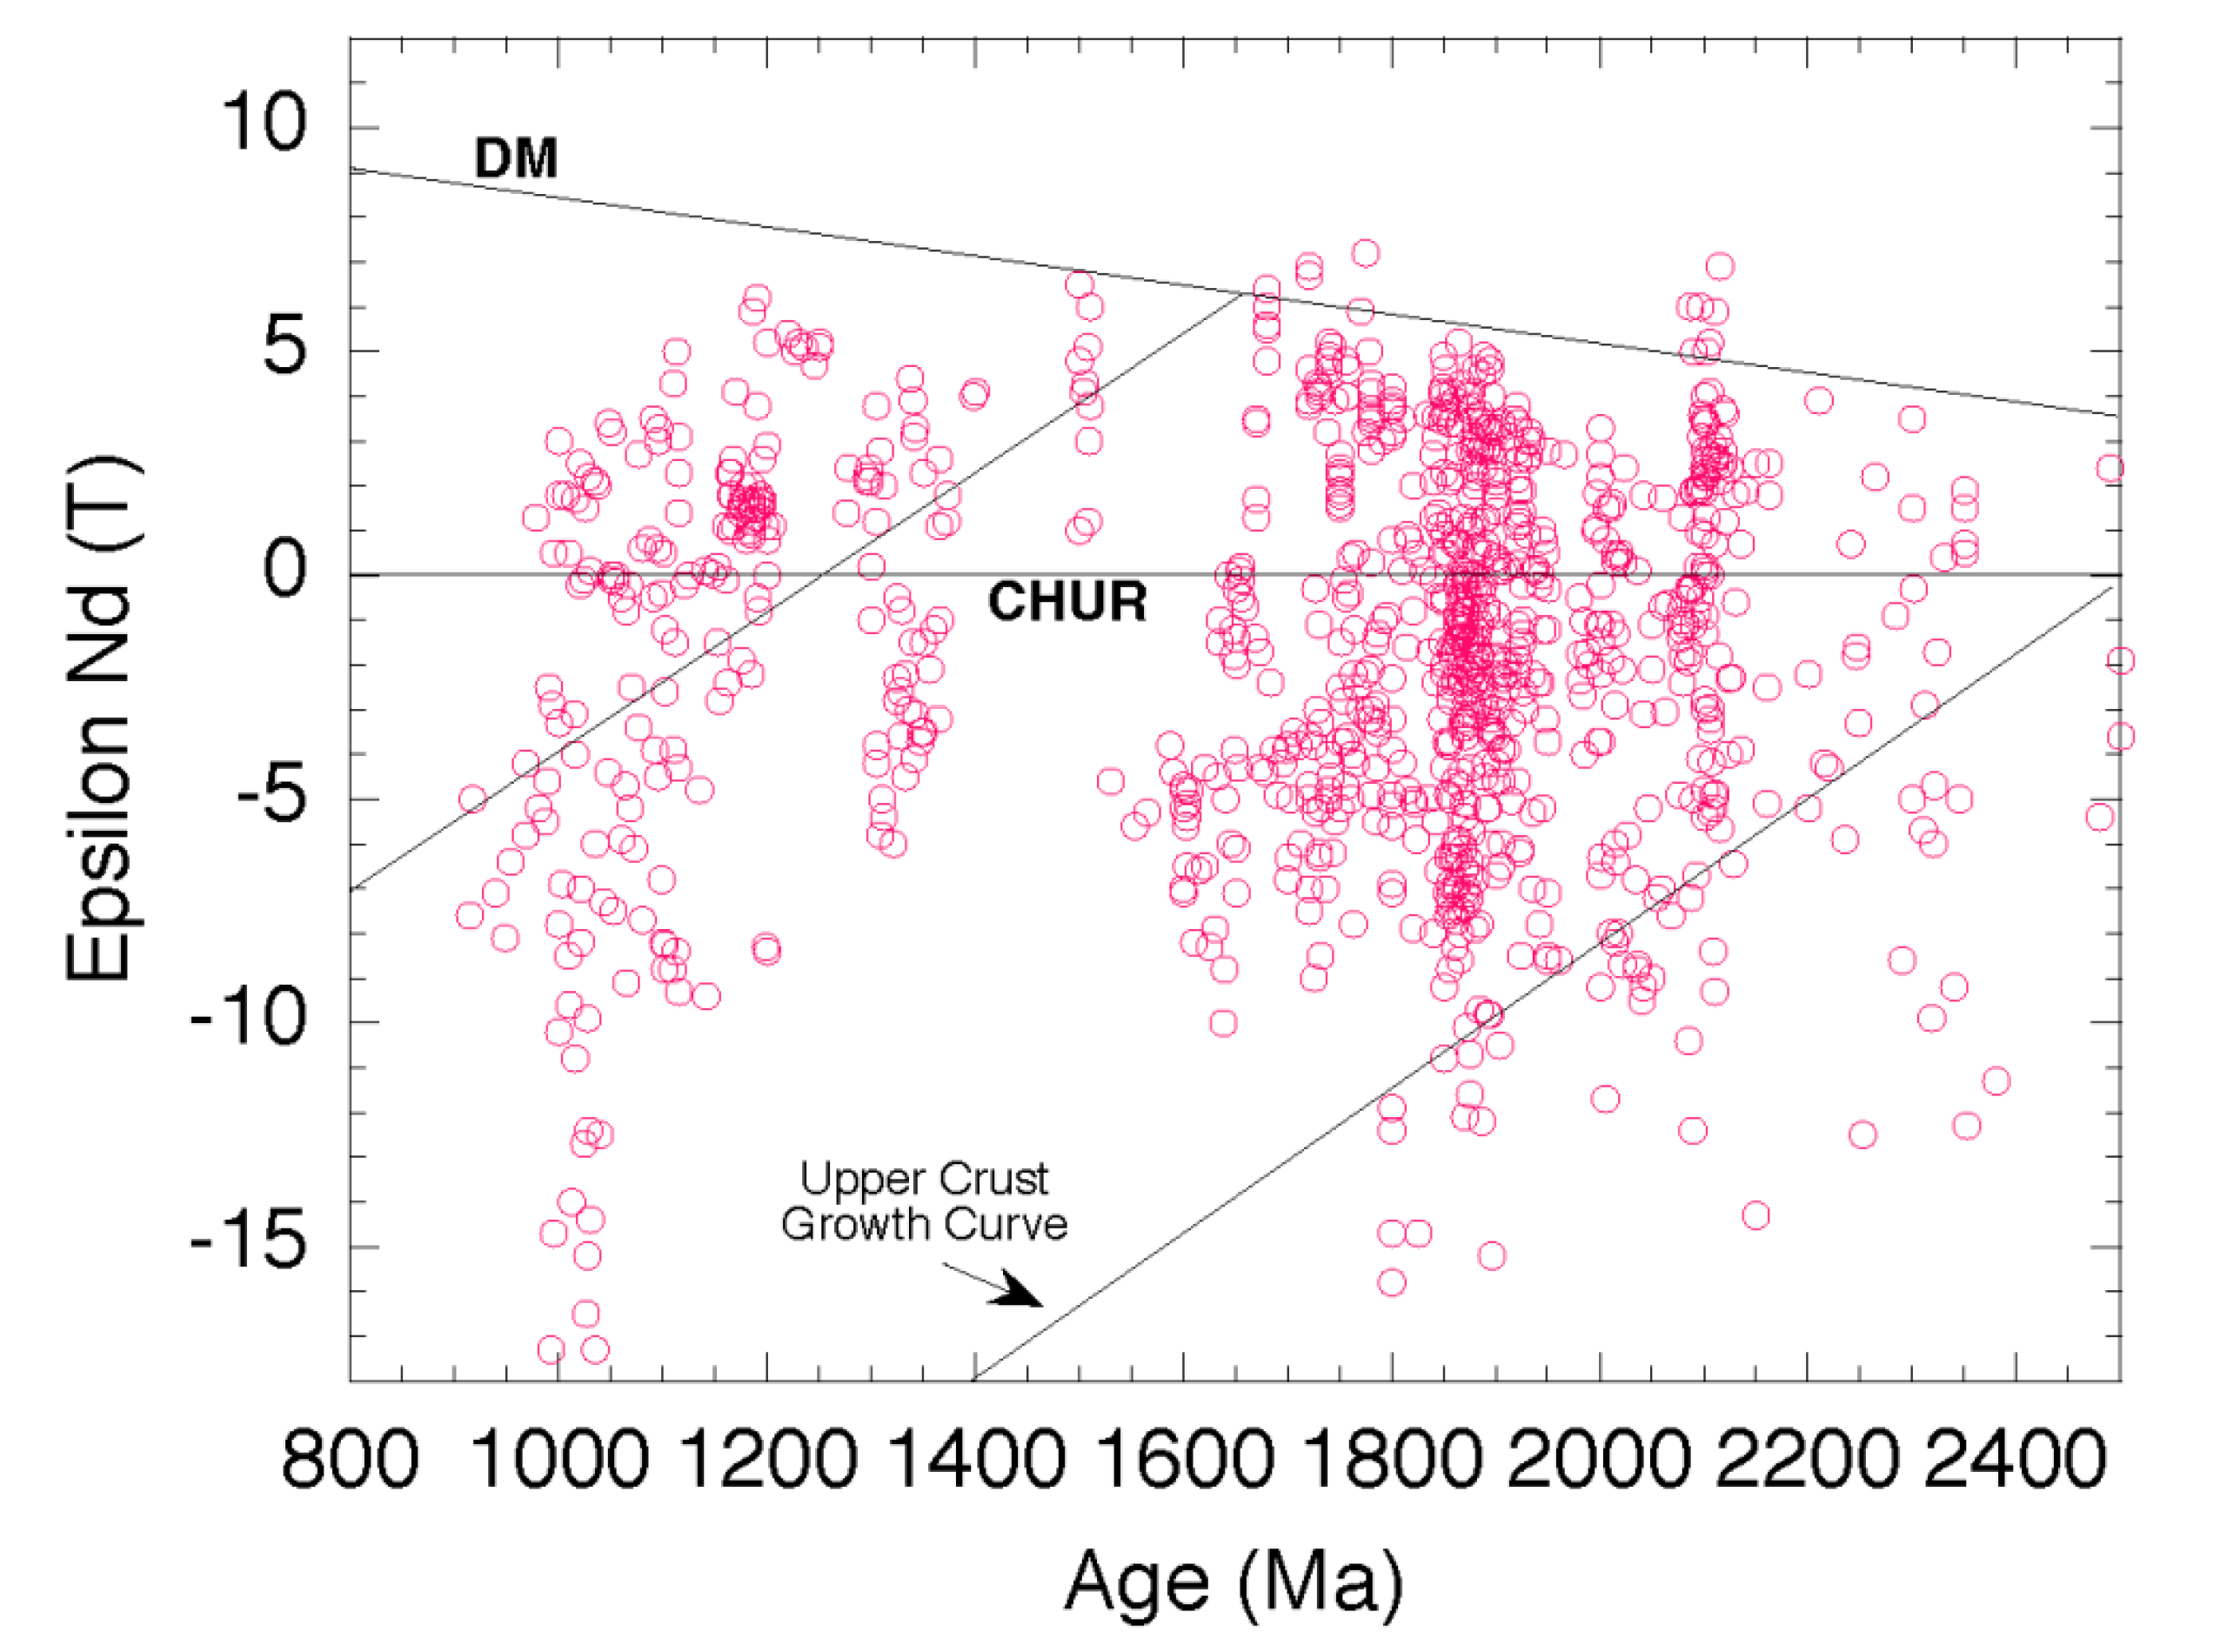
Of the 50 Proterozoic orogens studied, 36 have whole-rock Nd isotopic data available (Appendix 1). Only 10 of these have chiefly positive εNd(T) values (Birimian-Transamazonian, Baltica, Wopmay, NE Greenland, New Quebec, Volga-Don, Yapungku, and Olarian), whereas the others have negative or mixed values (
Figure 12). Hence, most orogens contain significant volumes of reworked older crust. A similar conclusion is reached using the Hf isotope data from detrital zircons and has also been suggested for Phanerozoic orogens [
5,
13,
24]. From the combined Nd and Hf isotope databases, together with geologic maps of varying scales (for outcrop samples), the distribution of juvenile crust preserved in Proterozoic orogens has been estimated (Appendix 1). On average, 50% of continental arcs comprise juvenile input, whereas oceanic terranes (including oceanic arcs, crust, islands and plateaus) comprise about 90% juvenile input. The amount of preserved juvenile crust in collisional orogens ranges over two orders of magnitude with most orogens between 10
6 and 10
7 km
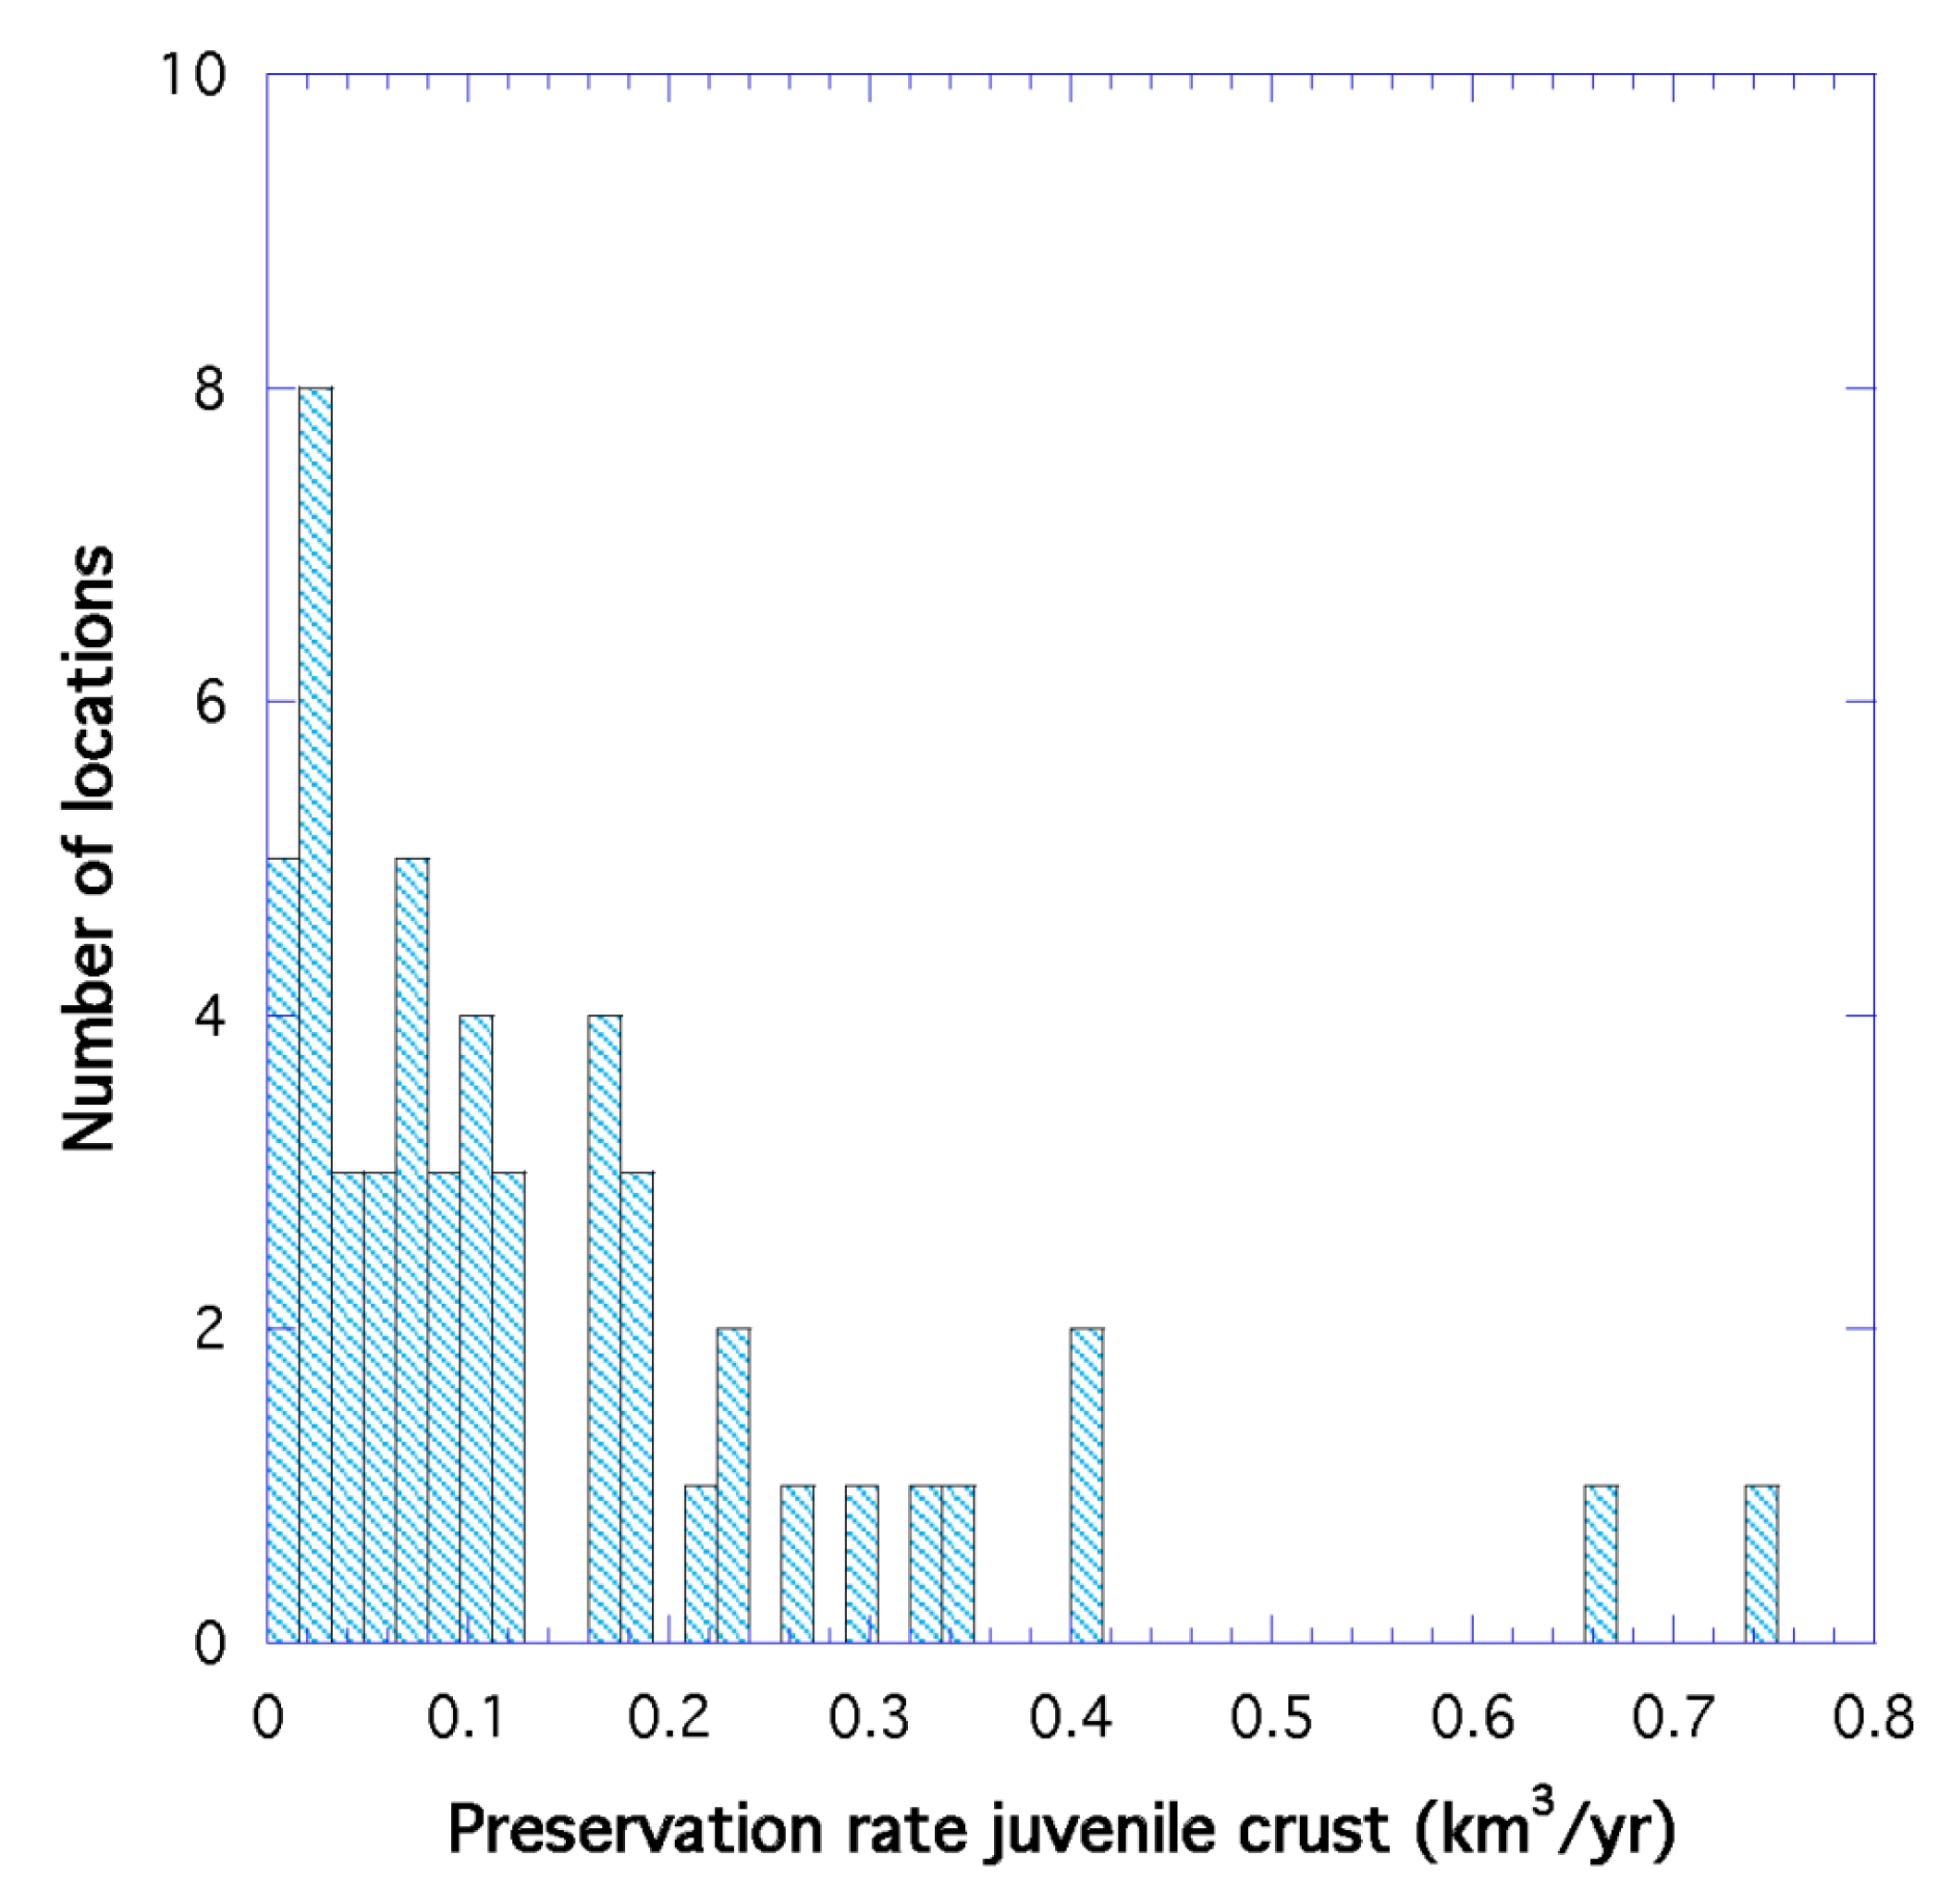
3. As expected, the tightest grouping of preserved juvenile crust correlates with the assembly of Nuna and Rodinia. Preservation rate, defined as juvenile crust volume preserved per year of subduction, is shown in
Figure 13. Although the rate of preservation ranges from close to zero to over 0.7 km
3/year, most orogens have preservation rates in the range of 0.02–0.1 km
3/year, with an average of about 0.14 km
3/year. Neither the fraction of juvenile crust preserved nor the rate of preservation is related to the collision age nor to the duration of subduction. Preservation rates of juvenile crust are ≥0.4 km
3/year in only three orogens: Eburnean, Yapungku, and Torngat. Many of the orogens with preservation rates over 0.1 km
3/year have long-lived accretionary phases, such as the Penokean-Yavapai-Mazatzal, Baltica, Amazonia, and Makkovikian-Labradorian orogens, all of which are part of the Great Proterozoic Accretionary Orogen (GPAO). Approximately 37% of all juvenile continental crust preserved between 2 and 1 Ga was produced in the GPAO.
Figure 11.
Frequency of preservation of rocks formed during the subduction stage of Proterozoic orogens (data from Appendix 1, col AG). The ratio is calculated from a combination of igneous zircon ages and areal distributions of igneous rocks as estimated from geologic maps.
Figure 11.
Frequency of preservation of rocks formed during the subduction stage of Proterozoic orogens (data from Appendix 1, col AG). The ratio is calculated from a combination of igneous zircon ages and areal distributions of igneous rocks as estimated from geologic maps.
Figure 12.
Epsilon Nd(T)
versus age for igneous rocks from Proterozoic orogens (updated after Condie [
18] from data in Appendix 1). DM, depleted mantle growth curve; CHUR, chondritic uniform reservoir.
Figure 12.
Epsilon Nd(T)
versus age for igneous rocks from Proterozoic orogens (updated after Condie [
18] from data in Appendix 1). DM, depleted mantle growth curve; CHUR, chondritic uniform reservoir.
Figure 13.
Preservation rate of juvenile crust per year of duration of subduction for Proterozoic orogens (data from Appendix 1, col K).
Figure 13.
Preservation rate of juvenile crust per year of duration of subduction for Proterozoic orogens (data from Appendix 1, col K).
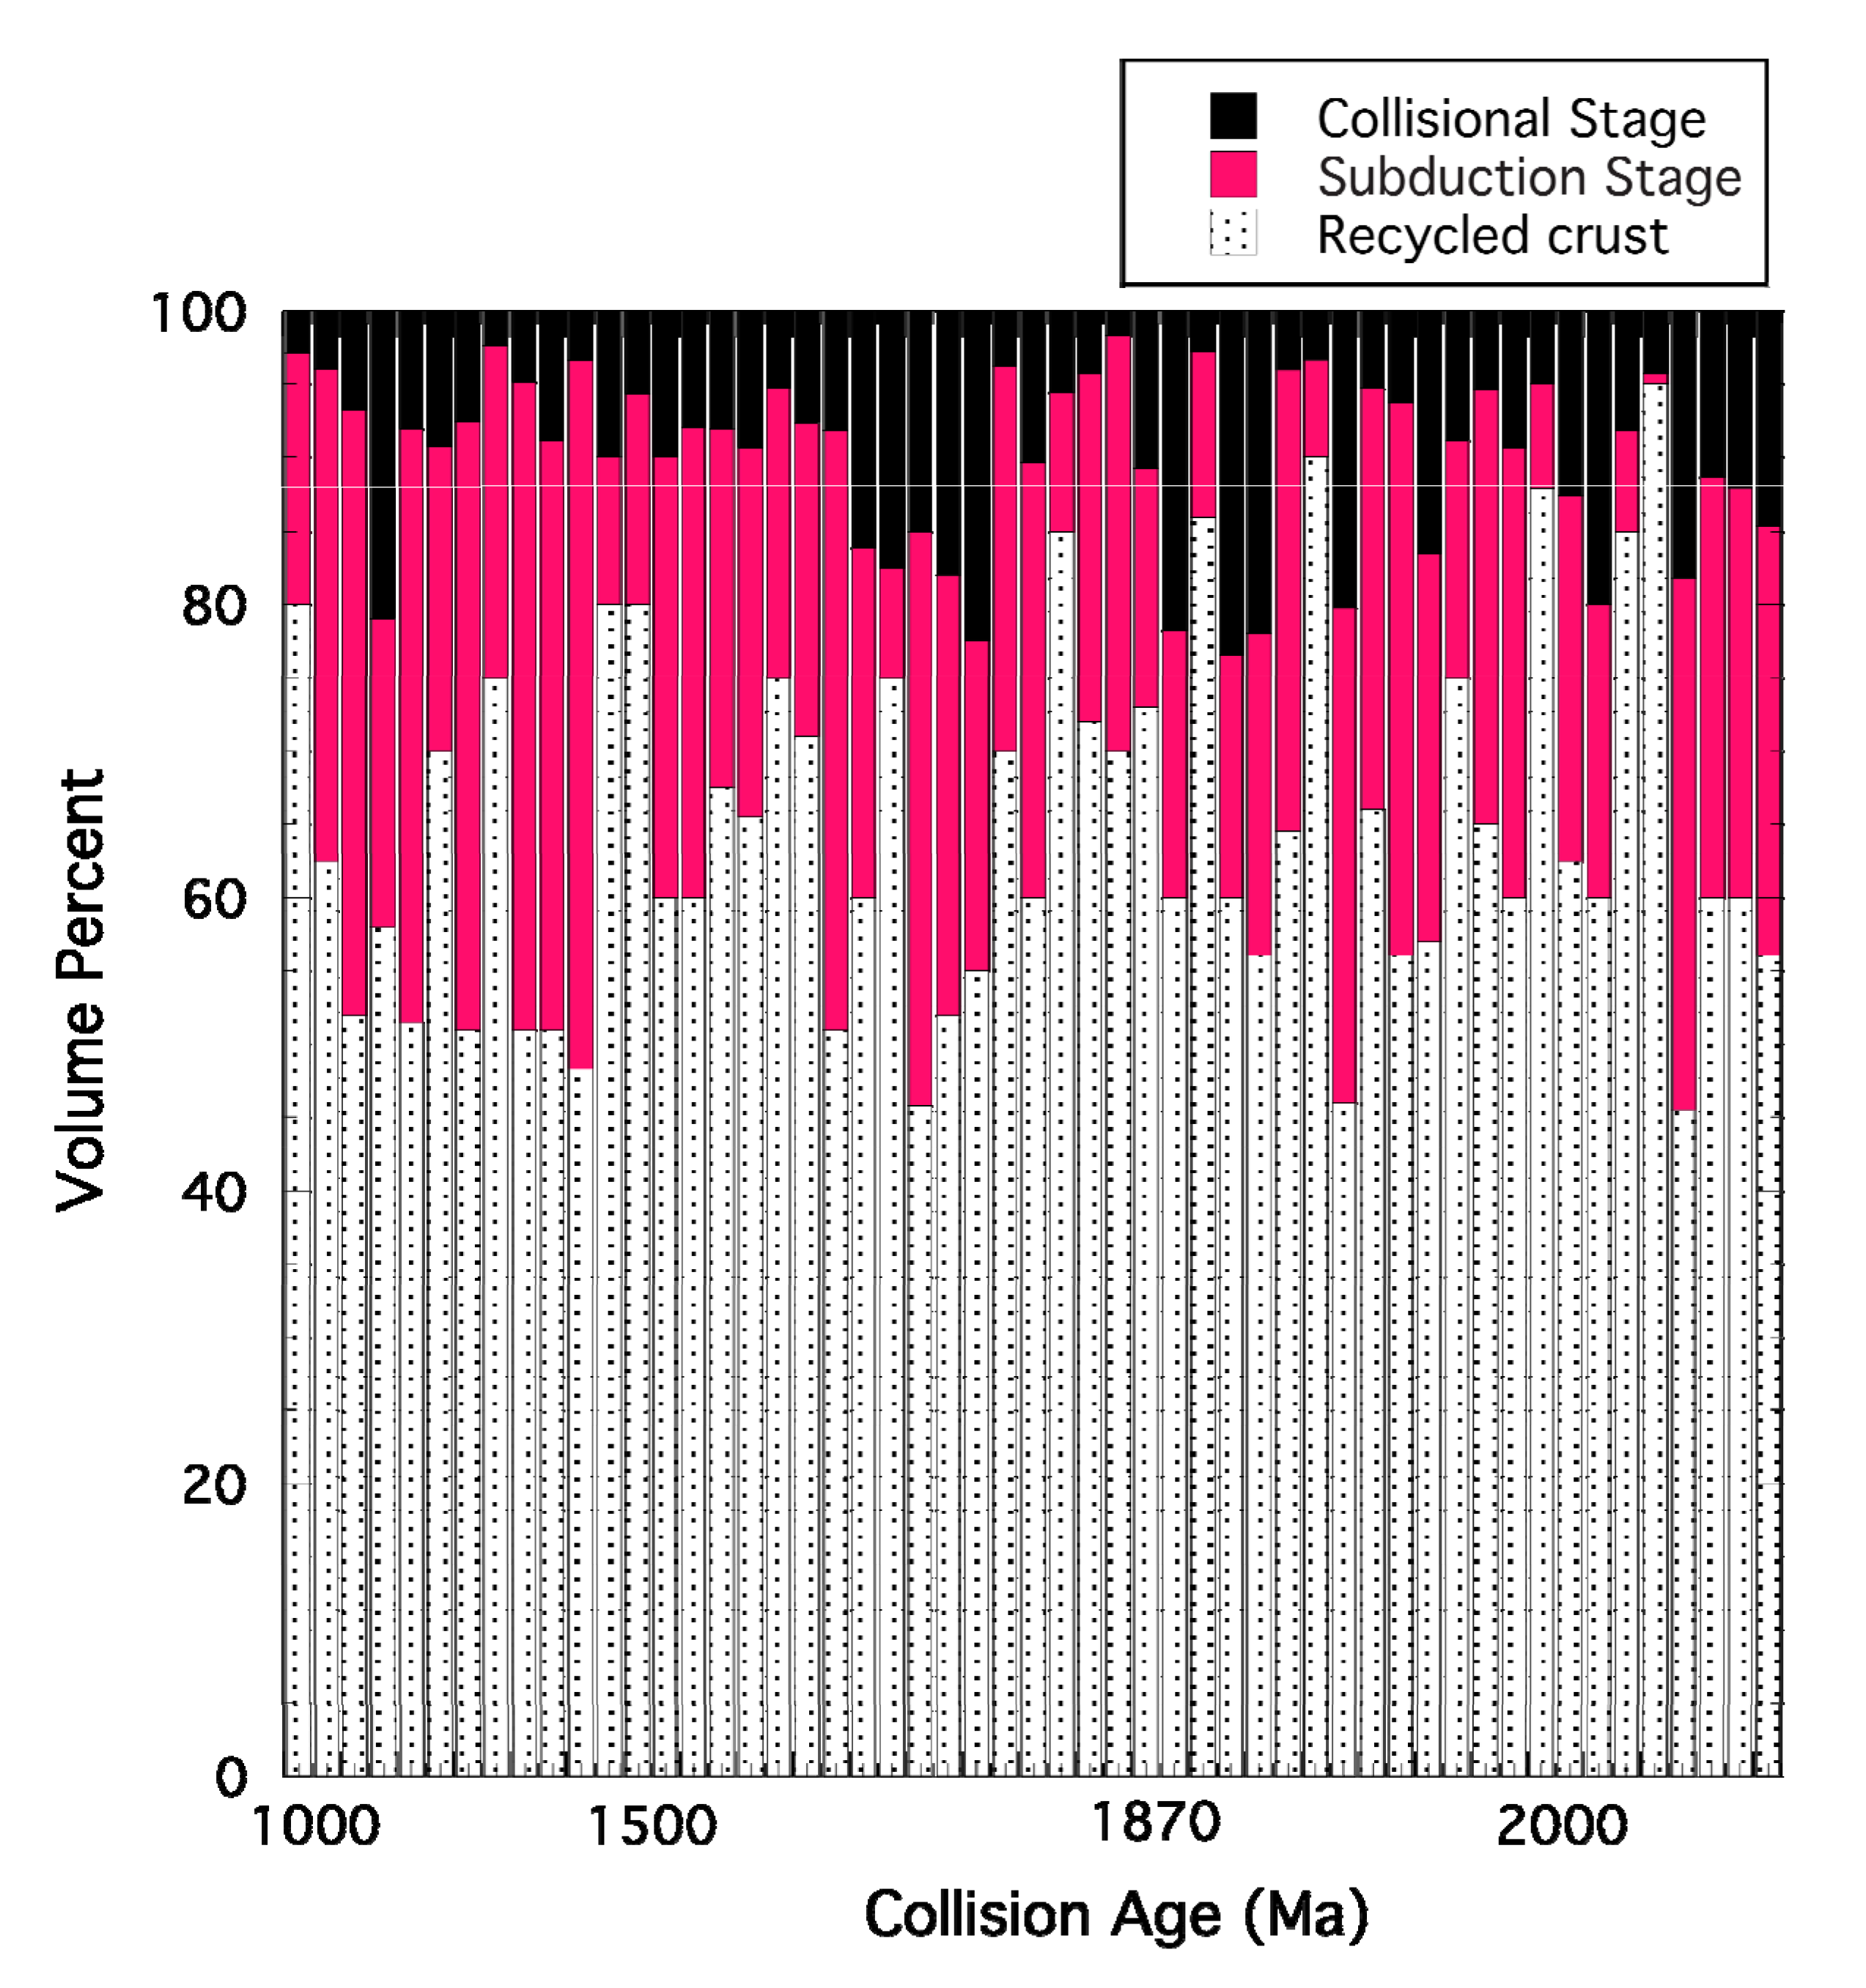
The fraction of juvenile crust preserved in orogens ranges from about 10% to 60% (mean = 36%) and the amount of reworked crust from 40% to 75% (mean = 64%). The Limpopo orogen contains the smallest amount of juvenile crust (about 5%) with the Eburnean, Usagaran-Tanzania, Ubendian, Angara, Nagssugtoqidian, and Arctic orogens all containing ≤20%. At the other extreme, there are 10 orogens that contain ≥50% juvenile input (Birimian-Transamazonian, Wopmay, Trans-Hudson, Volyn Central, Halls Creek, Penokean-Yavapai-Mazatzal, Baltica, Xiong’er, Makkovikian-Labradorian, and Amazonia). Of the juvenile crust preserved, most dates to the subduction stage rather than the collision stage (
Figure 14). An excellent example of this is presented by Dickin
et al. [
25] for the Grenville orogen. Although Hawkesworth
et al. [
6,
11] have made a case for poor preservational potential for igneous rocks formed at convergent margins and high potential for syn-collisional igneous rocks, results of this study do not completely support this model. Although the preservational potential is certainly high during the collisional phase, the results indicate that the age of the igneous rocks preserved date chiefly to the pre-collisional, accretionary convergent margin stage, not to the syn-collisional stage. Thus, the preservation potential during the accretionary stage must also be moderate to high for these rocks to survive to a continent-continent collision, which we can think of as the final “capture stage” that makes it possible for rocks to eventually become part of a craton.
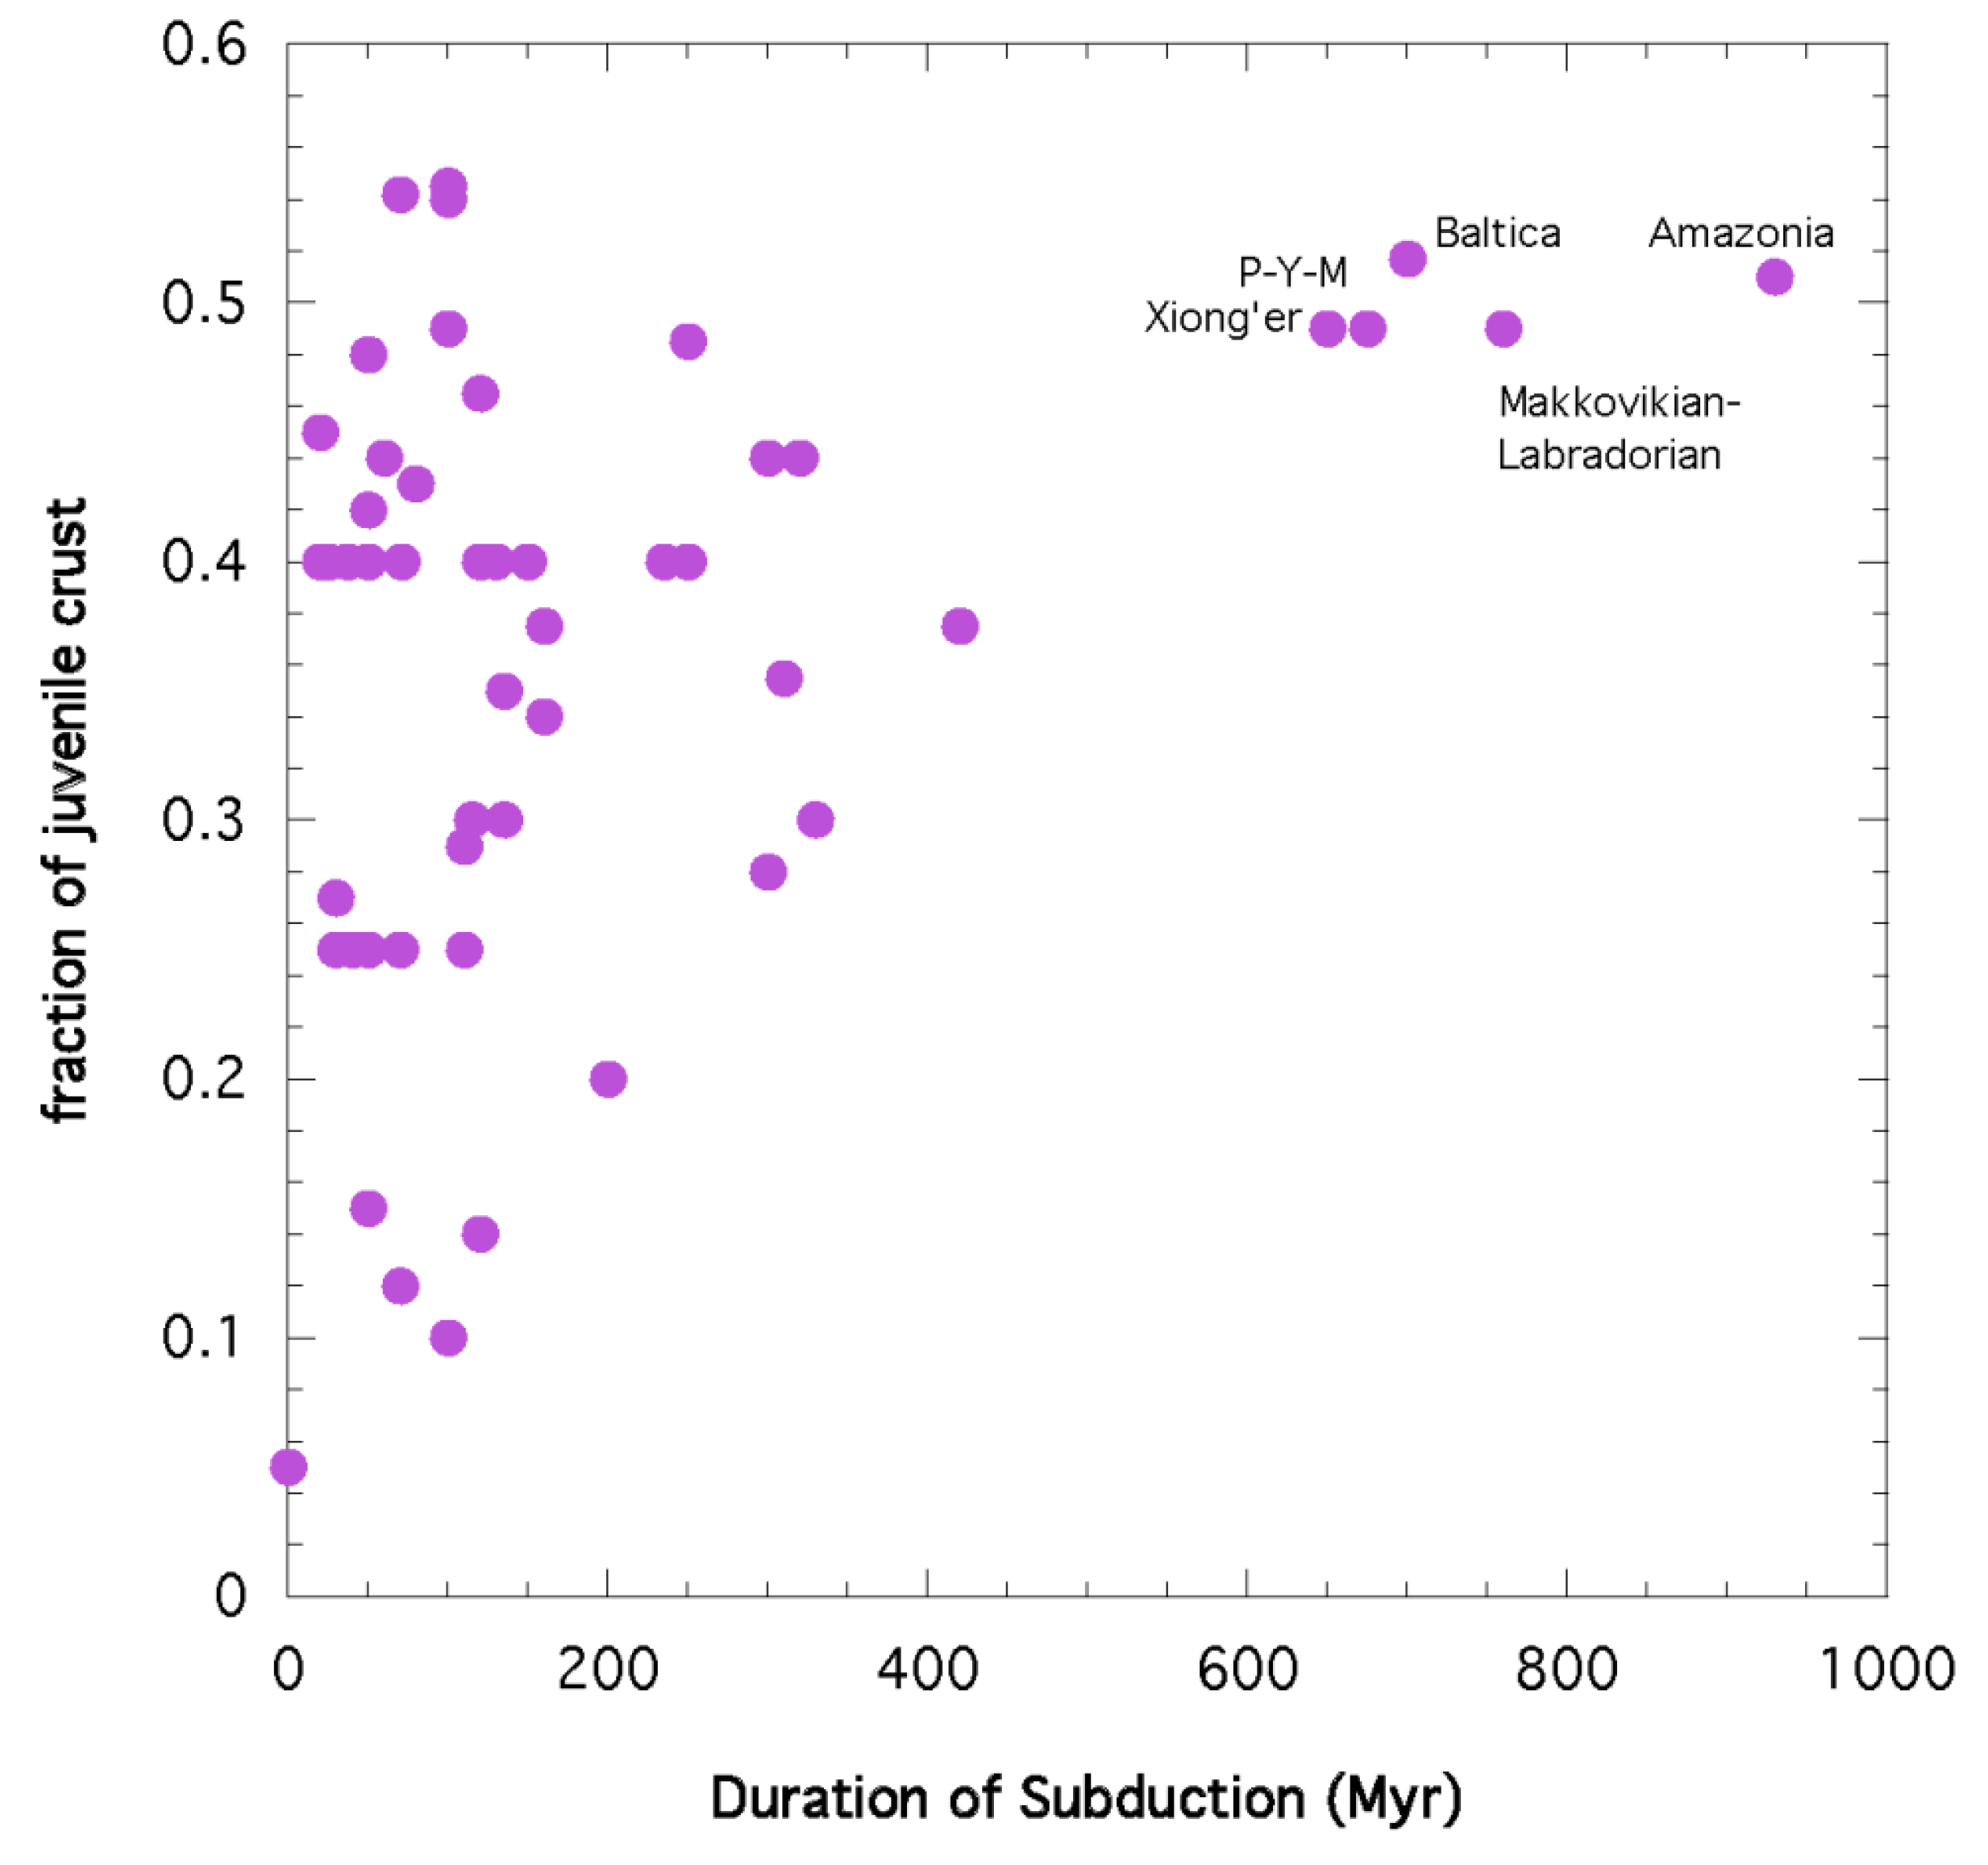
Although the six orogens with subduction durations of >500 Myr all contain around 50% juvenile components, many of the short-duration subduction orogens also contain similar amounts of juvenile crust (
Figure 15). This seems to indicate that the duration of subduction is not a major control on the fraction of juvenile crust preserved in orogens; regardless of subduction duration, the fraction of juvenile crust preserved reaches a maximum of around 50%. It is important to note that the six orogens with subduction durations >500 Myr all have long-lived accretionary phases, with four out of the six comprising part of the Great Proterozoic Accretionary Orogen (GPAO). Because the GPAO had both a long duration and large area, it contains the largest volume of juvenile crust produced between 2 and 1 Ga.
Figure 14.
Fractions of juvenile and recycled crust preserved in Proterozoic orogens (data from Appendix 1). Juvenile crust divided into collisional and subduction stages of production. Mean values (%) and standard deviations: collisional 10, 6; subduction 25, 11; recycled 65, 12.
Figure 14.
Fractions of juvenile and recycled crust preserved in Proterozoic orogens (data from Appendix 1). Juvenile crust divided into collisional and subduction stages of production. Mean values (%) and standard deviations: collisional 10, 6; subduction 25, 11; recycled 65, 12.
Figure 15.
Fraction of juvenile crust preserved in Proterozoic orogens versus the duration of subduction (data from Appendix 1). P-Y-M, Penokean-Yavapai-Mazatzal.
Figure 15.
Fraction of juvenile crust preserved in Proterozoic orogens versus the duration of subduction (data from Appendix 1). P-Y-M, Penokean-Yavapai-Mazatzal.
2.5. Recycling of Crust in Orogens
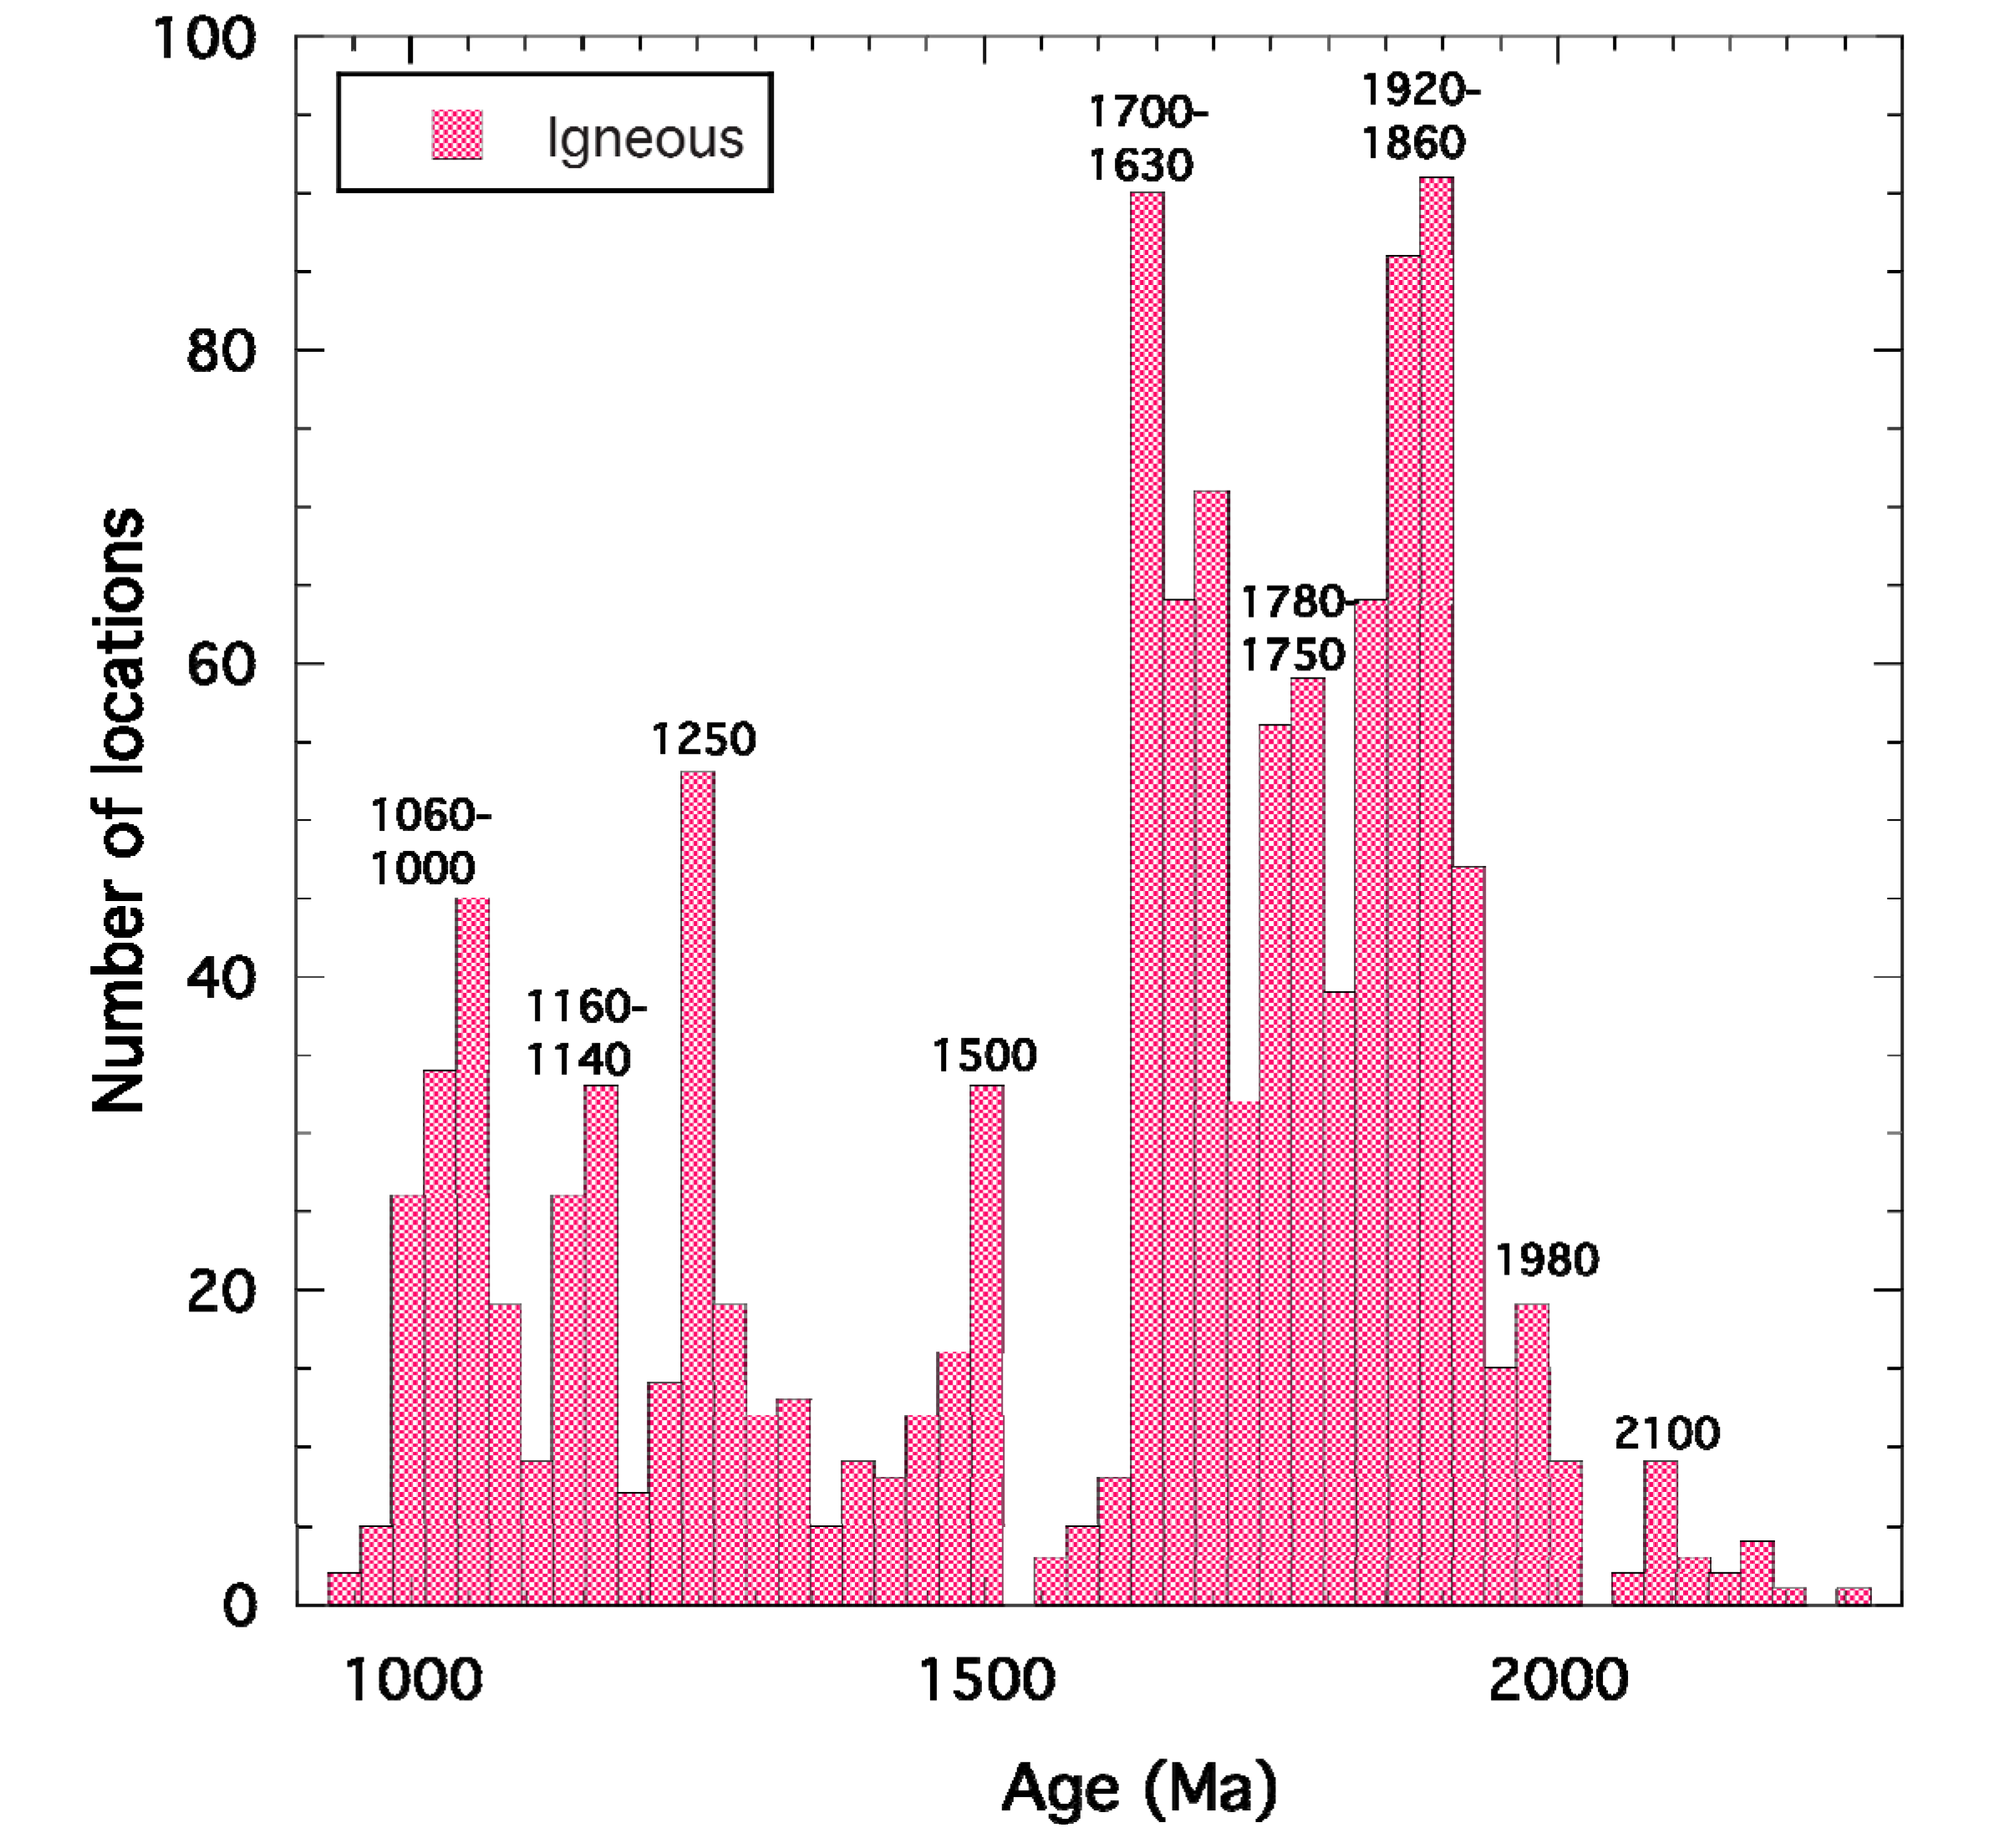
Now we have seen how and where crust is preserved in orogens, the next question is when and how much crust is recycled into the mantle during orogen evolution. Pronounced minima occur in the ages of rocks preserved in orogens, as for example the long-recognized sparsity of ages between 1600 and 1500 Ma in the Laurentian portion of the GPAO [
26,
27] (
Figure 16,
Figure 17). This minimum also shows up in the detrital zircon age spectra from North American river sediments (
Figure 18). Similar age minima occur in both the igneous and detrital age spectra of the Amazonia and Baltica portions of the GPAO at 1700–1600 Ma and 1750–1700 Ma, respectively. The cause of these minima may be related to (1) rocks of this age never formed, (2) they are covered with younger rocks, or (3) they have been recycled into the mantle [
13]. Accretionary orogens go through retreating and advancing phases [
12]. Retreating orogens grow by addition of new continental crust in forearc and back arc basins, whereas advancing orogens may lose significant volumes of crust by recycling into the mantle at subduction zones by a combination of subduction erosion and delamination [
12,
28,
29,
30,
31,
32,
33]. Scholl and von Huene [
29,
30] have estimated that crust around the Pacific basin is being recycled back into the mantle at a rate of 3.2 km
3/year. At this rate, the entire width of an accretionary orogen can be destroyed in a few hundred million years, and if this rate is typical of the last 3 Gyr, an equal volume of the current continental crust would have been recycled into the mantle during this time interval.
Although magmatic activity along subduction zones tends to be episodic on 10–50 Myr time scales and hence may be missing for short distances and short time intervals along an arc system [
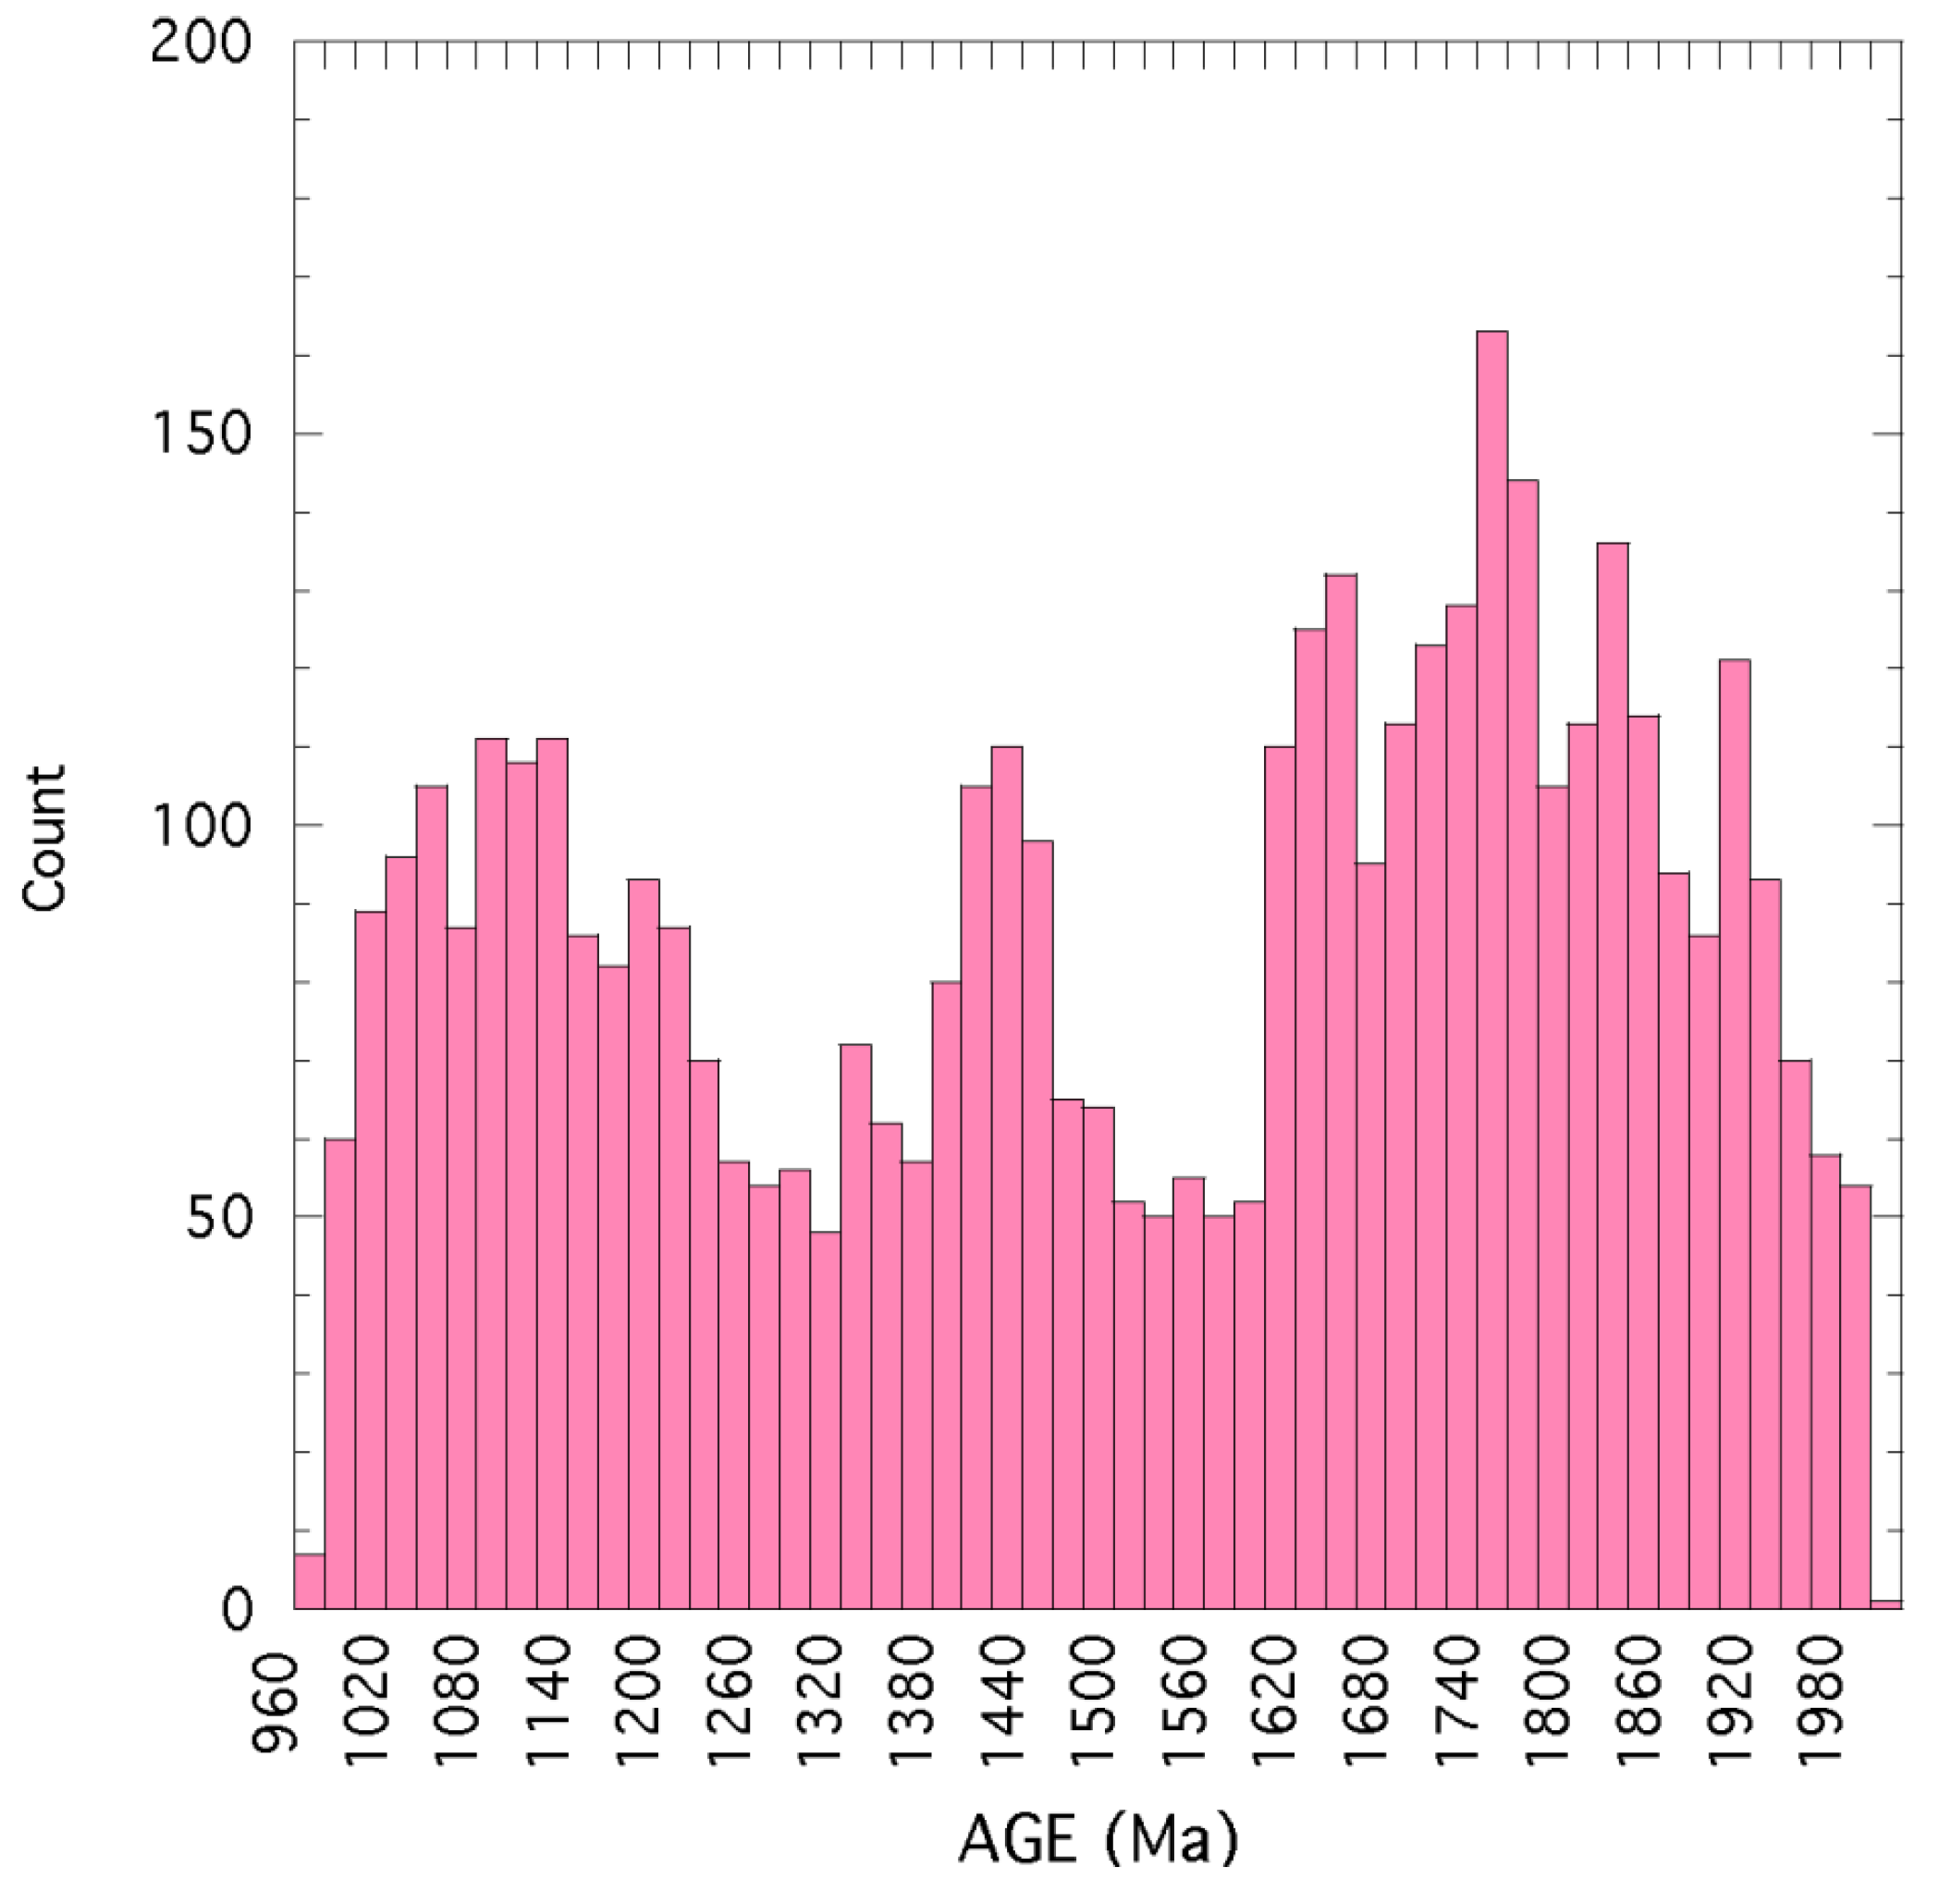
4], young subduction zones rarely if ever shut down over lengthy arc segments for >50 Myr. The sparsity of zircon ages for the 100 Myr period between 1600 and 1500 Ma in the Laurentian segment of the GPAO (
Figure 16,
Figure 17) probably does not reflect shut down of the continental arc system for such a long period of time.
Figure 16.
Frequency of zircon ages from igneous rocks preserved in the Laurentian portion of the Great Proterozoic Accretionary Orogen (data from Appendix 1). Peak ages in Ma.
Figure 16.
Frequency of zircon ages from igneous rocks preserved in the Laurentian portion of the Great Proterozoic Accretionary Orogen (data from Appendix 1). Peak ages in Ma.
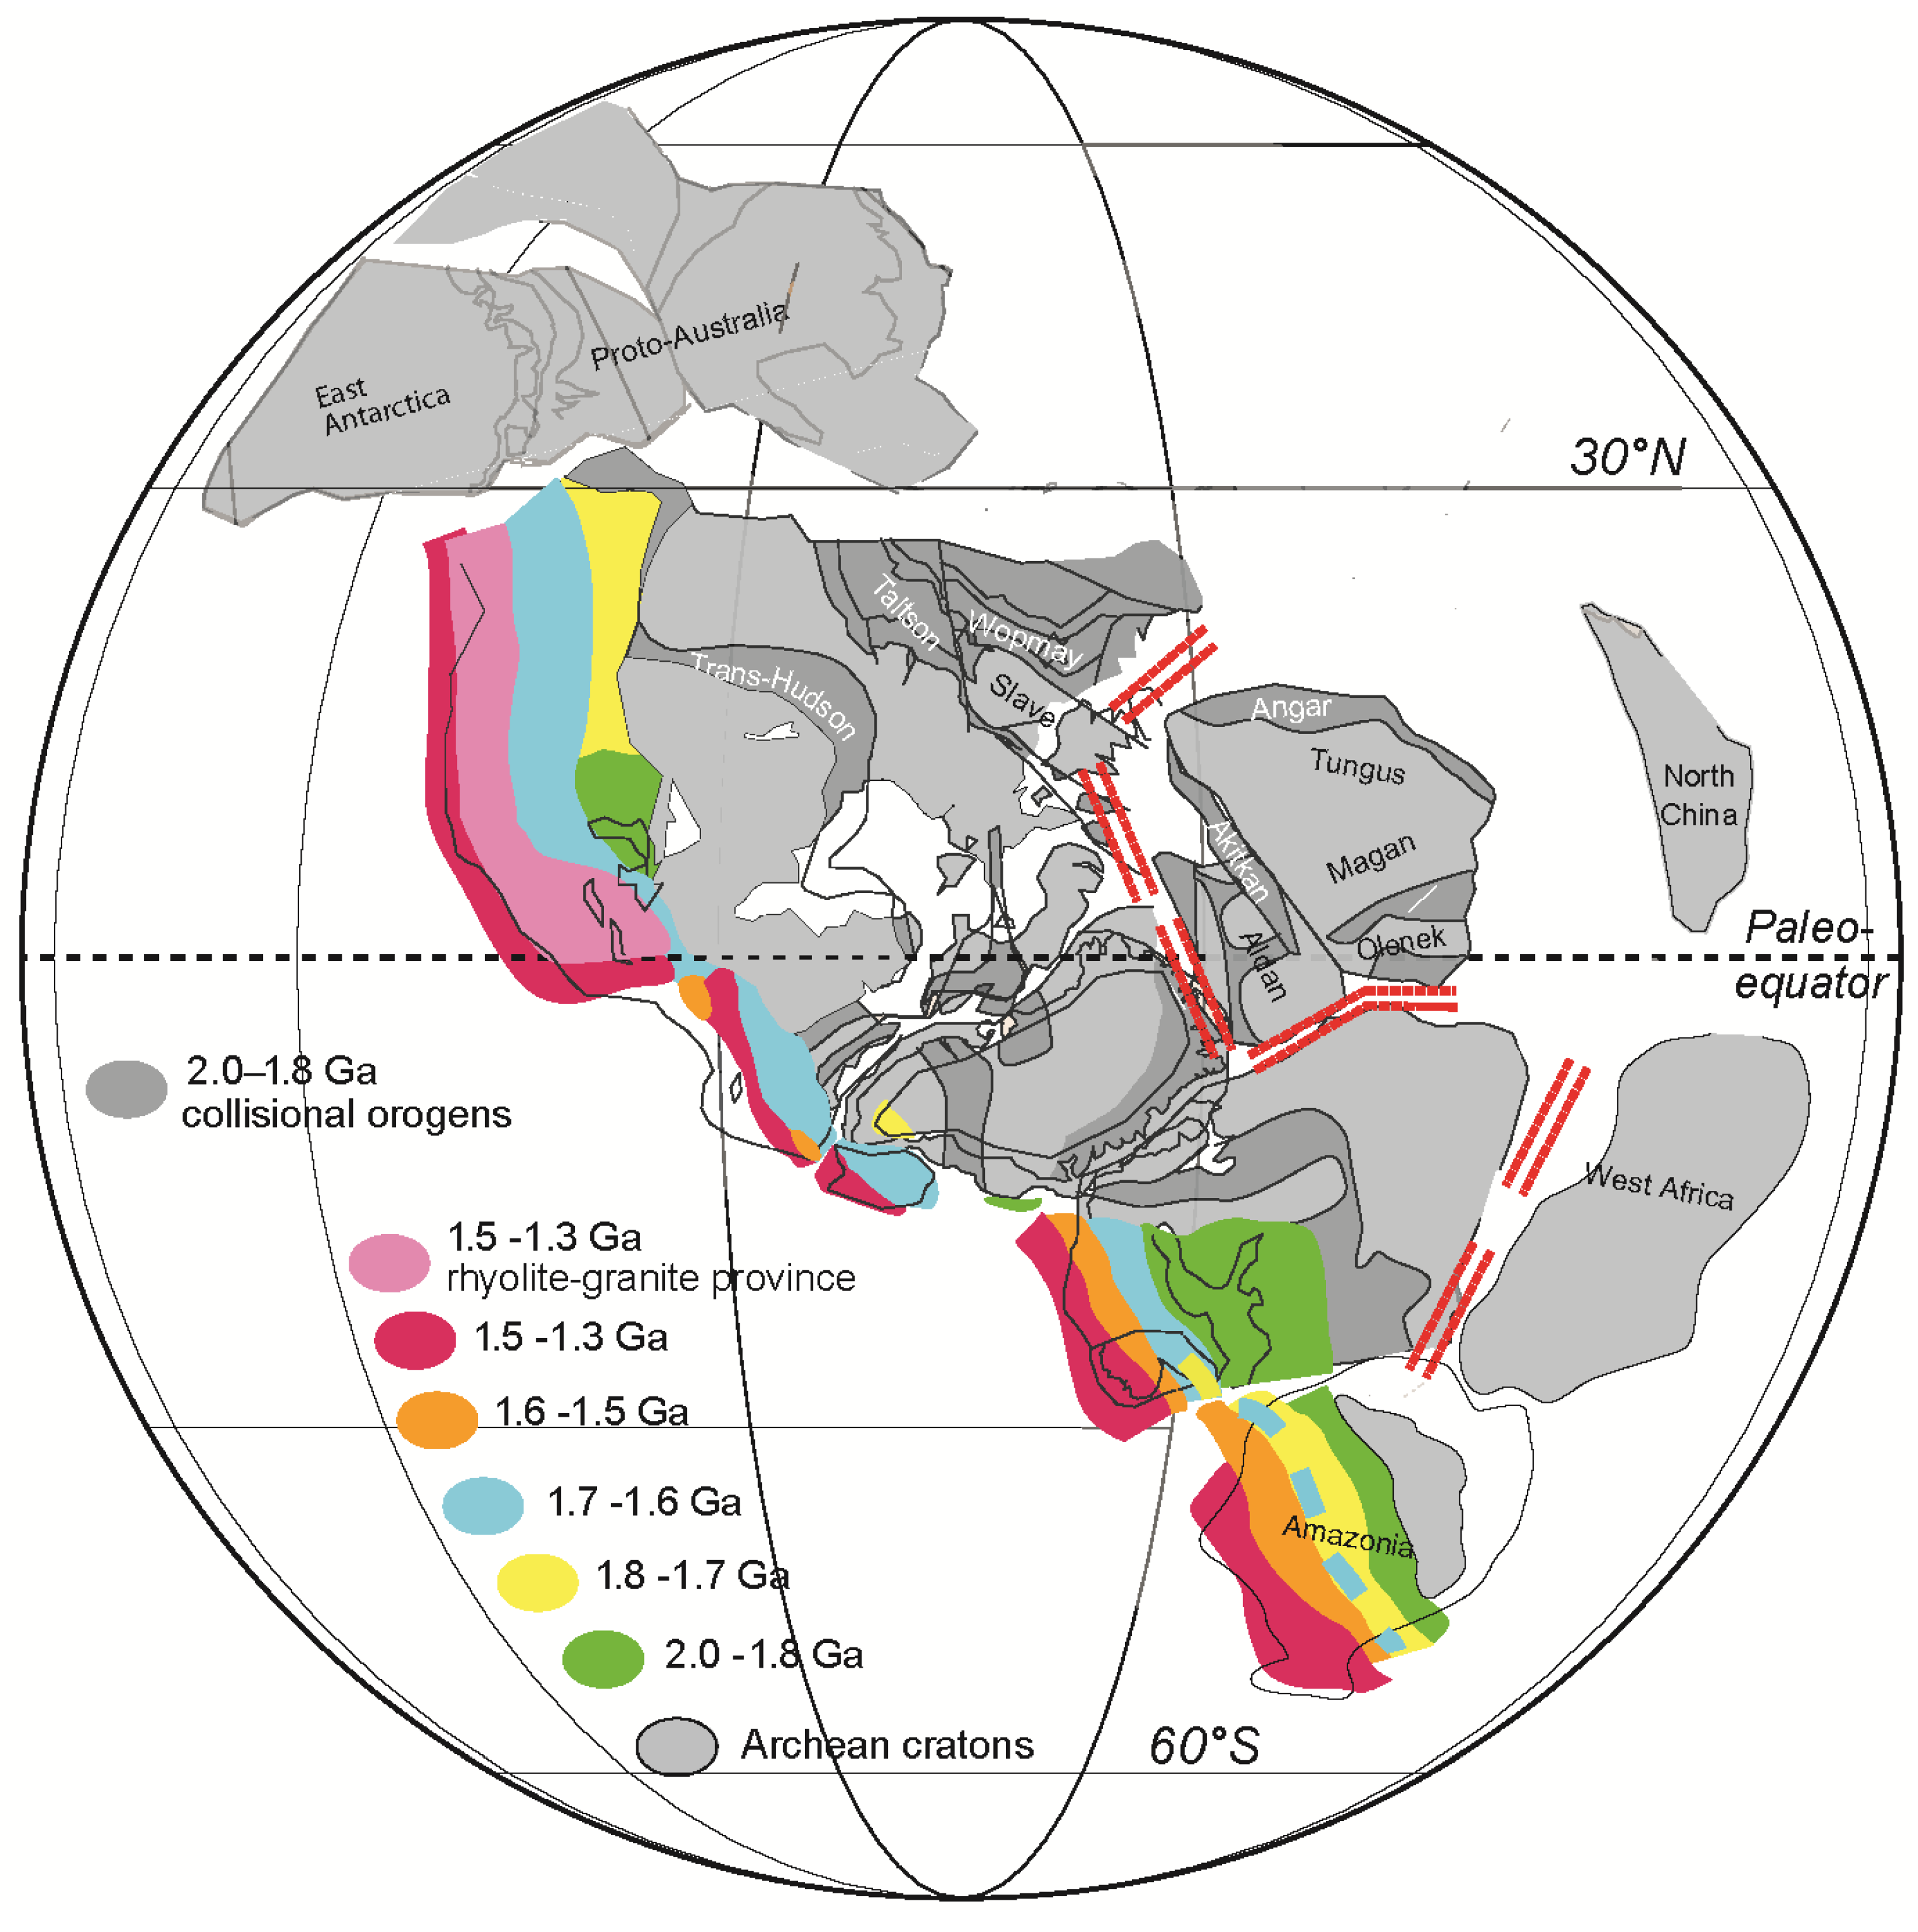
Figure 17.
Paleomagnetic reconstruction of Nuna at about 1270 Ma showing age provinces in the Great Proterozoic Accretionary Orogen. Craton configurations modified after Evans and Mitchell [
17], courtesy of Dave Evans. Red double lines: incipient rifting of cratons.
Figure 17.
Paleomagnetic reconstruction of Nuna at about 1270 Ma showing age provinces in the Great Proterozoic Accretionary Orogen. Craton configurations modified after Evans and Mitchell [
17], courtesy of Dave Evans. Red double lines: incipient rifting of cratons.
Figure 18.
Distribution of detrital zircon ages in Laurentia. Data from Belousova
et al. [
5] and Condie
et al. [
13] and references therein.
Figure 18.
Distribution of detrital zircon ages in Laurentia. Data from Belousova
et al. [
5] and Condie
et al. [
13] and references therein.
There are three lines of evidence for the former existence of rocks in the 1600–1500 Ma age range in Laurentia: (1) there are two segments of continental arc rocks of this age preserved in the Central Metamorphic Belt and adjacent areas in the eastern Grenville orogen [
25,
34,
35], which could be remnants of a much more extensive arc system; (2) Nd and Hf model ages indicate sources for orogenic granitoids in this age window (
Figure 4,
Figure 5); and (3) detrital zircon ages from North America show evidence of rocks of this age range (
Figure 18). The problem with detrital zircons is that we really do not know where they come from. Although studies of detrital zircon age distributions from the Belt Supergroup and Hess Canyon Group in the western United States have been interpreted by some investigators to reflect sources in Australia when Laurentia was part of the Rodinian supercontinent [
36,
37], it is also possible that at least some of these zircons come from unexposed Laurentian sources or from Laurentian sources that have been recycled into the mantle. Indicative that arc-related rocks formed in the Laurentian segment of the GPAO are numerous Nd model ages between 1600 and 1500 Ma that come from 1.5 to 1.0 Ga granitoids and volcanics in this orogen (
Figure 4,
Figure 19) [
25,
35]. Hf model ages show much the same distributions (
Figure 5).
Figure 19.
Nd model ages of greenstones in the eastern Grenville orogen, Canada. Data from Dickin [
34], Dickin
et al. [
25] and McNutt and Dickin [
35].
Figure 19.
Nd model ages of greenstones in the eastern Grenville orogen, Canada. Data from Dickin [
34], Dickin
et al. [
25] and McNutt and Dickin [
35].
Studies of both the Japanese and Andean orogens have shown that large volumes of juvenile and reworked crust have been recycled into the mantle during the Phanerozoic, chiefly by subduction erosion, but probably also involving delamination [
28,
29,
30,
31,
38]. Calculated rates of subduction erosion in the central Andes are 250 km/Myr/km. If we use the same rate of removal of crust in the Laurentian segment of the GPAO (
Figure 17) for the 1600–1500 Ma missing crust, for a width of 250 km and strike length of 7000 km, 1.75 × 10
6 km
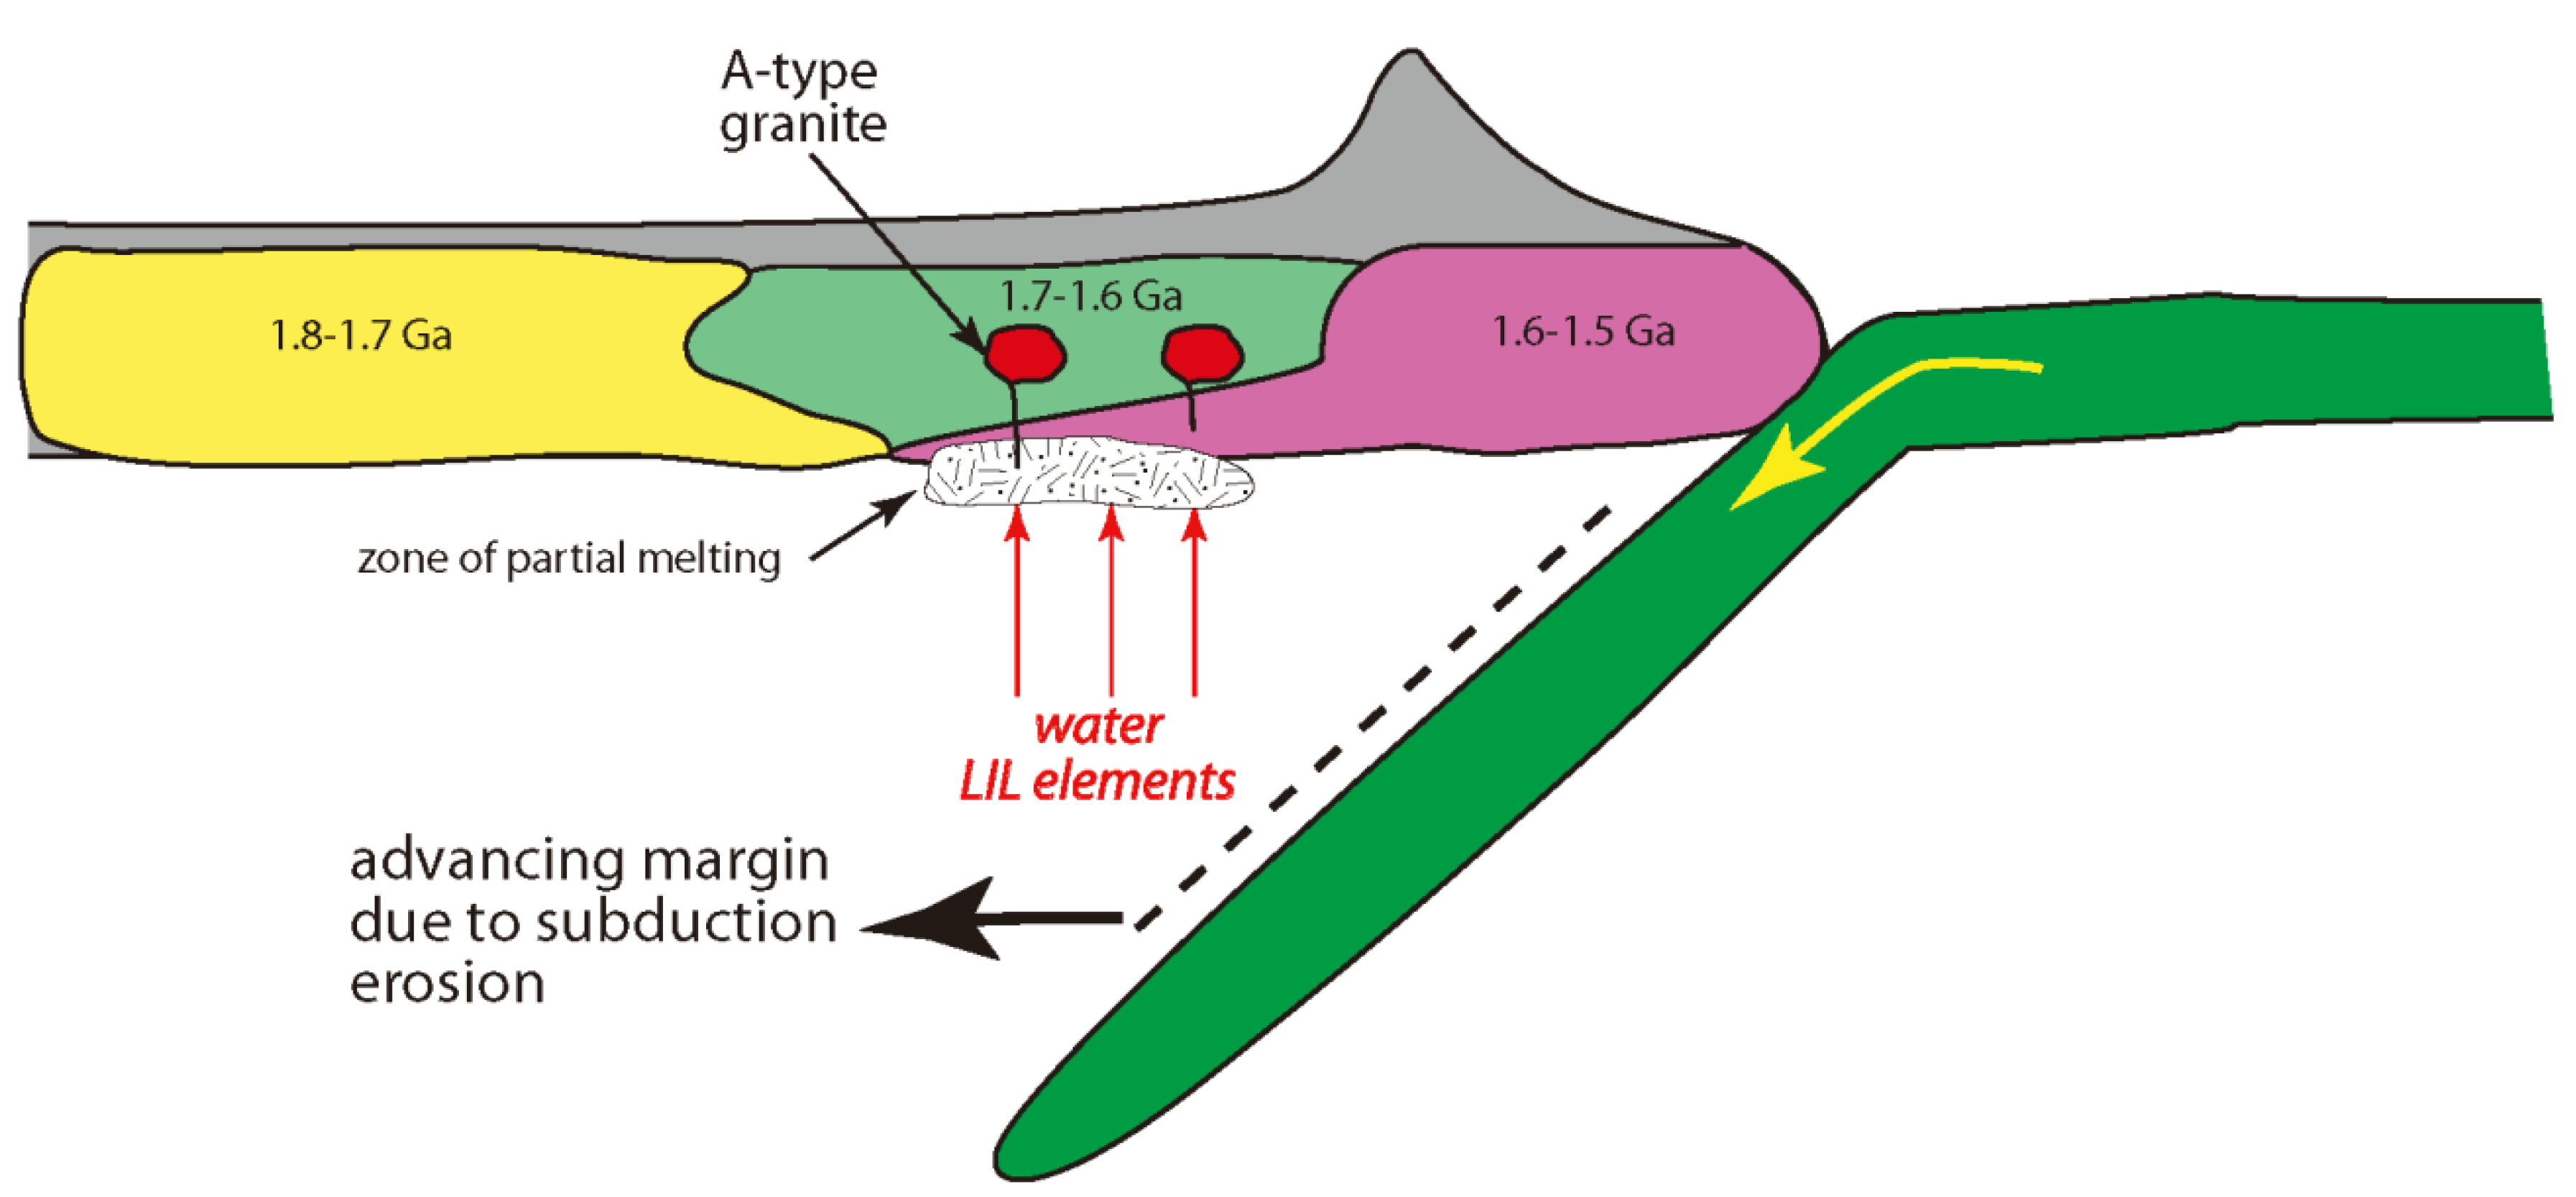
2 of Proterozoic crust may have been recycled into the mantle. This could represent as much as 35% of the original crustal volume in the orogen. The enhanced subduction erosion in the Andes in the last 250 Myr may reflect opening of the Atlantic basin, during which the Andean arc changed from a retreating to an advancing arc. If a similar situation is applicable to the missing crust in the GPAO, Nuna may have begun to fragment by rifting of Siberia from Laurentia at 1500–1300 Ma, which changed the frontal arc system to an erosive advancing arc like the Andes (
Figure 17,
Figure 20). Likewise, the missing Proterozoic crust in the Baltica and Amazonia segments of the GPAO may reflect rifting of West Africa from Amazonia at 1600–1500 Ma, and of Baltica from West Africa at 1700–1600 Ma.
Figure 20.
Diagrammatic cross section of the Great Proterozoic Accretionary Orogen along the southern margin of Laurentia showing advancing plate margin possibly caused by subduction erosion.
Figure 20.
Diagrammatic cross section of the Great Proterozoic Accretionary Orogen along the southern margin of Laurentia showing advancing plate margin possibly caused by subduction erosion.
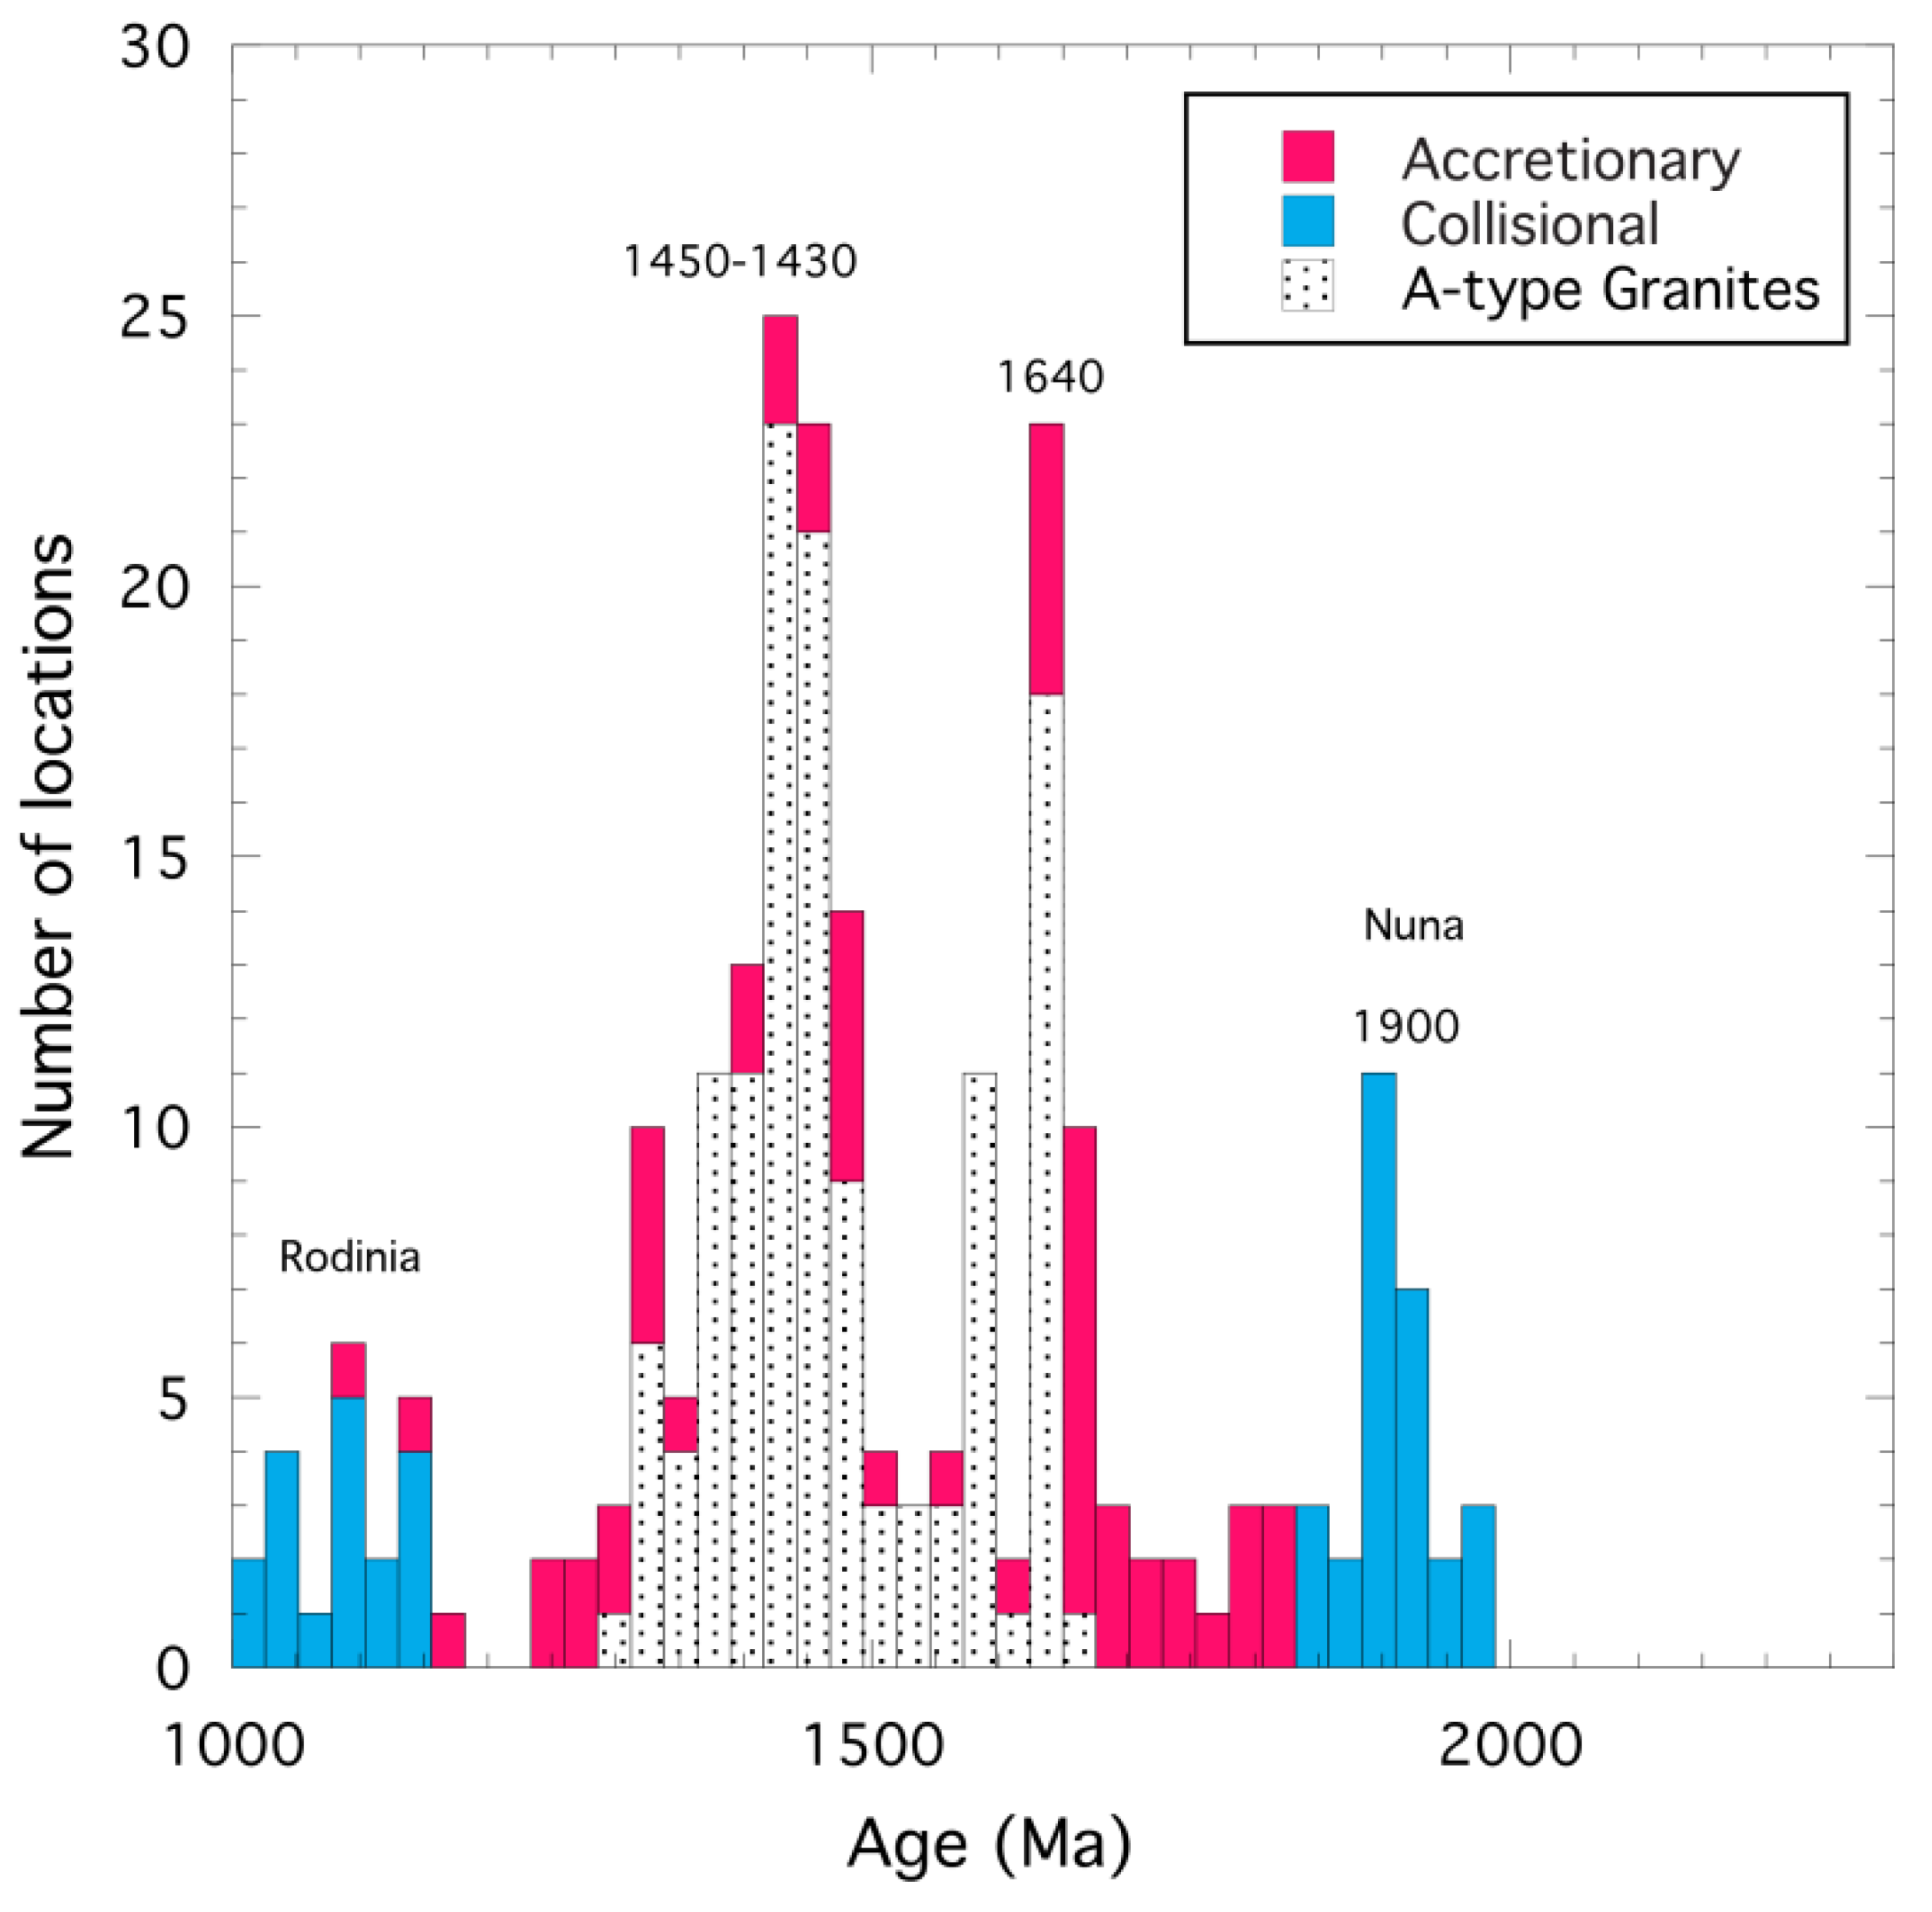
One other interesting feature of the GPAO is the widespread occurrence of A-type granites and associated rhyolites along this belt, ranging from 1500 to 1350 Ma in the Laurentian Southwest and mid-continent regions, 1650–1500 Ma in the eastern Grenville, to 1850–1750 Ma in Baltica (
Figure 21) [
39,
40,
41,
42,
43]. In effect, this felsic province within the GPAO is bracketed in time between the two supercontinents Rodinia and Nuna. If indeed, a large volume of continental crust in the age range of 1600–1500 Ma was recycled into the mantle by subduction erosion and delamination between 1500 and 1300 Ma in Laurentia, could this be related to the distribution of A-type granites of this age? As shown is
Figure 20, subduction of significant volumes of continental crust may have enriched the mantle wedge in incompatible elements and water, and partial melting of this wedge would produce enriched mafic magmas. Fractional crystallization of these magmas or partial melting an enriched mafic underplate [
44] may have given rise to A-type felsic magmas, some of which were erupted and many of which were intruded into overlying crust. A model involving an enriched mantle source has been proposed for A-type granites in southeastern Scandinavia [
45]. Because the Nd isotopic data from the granite-rhyolite province (
Figure 17) indicate a source with a typical model age of 1600–1500 Ma, rocks of this age must have underlain the overlying crust (with an age of 1700–1600 Ma), the latter of which hosts most of the A-type granites (
Figure 20).
Figure 21.
Frequency of Proterozoic A-type granites in Laurentia compared to distribution of accretionary and collisional phases of Proterozoic orogens in Laurentia (data from Appendix 1 and from Van Schmus
et al. [
40] and Goodge and Vervoort [
42].
Figure 21.
Frequency of Proterozoic A-type granites in Laurentia compared to distribution of accretionary and collisional phases of Proterozoic orogens in Laurentia (data from Appendix 1 and from Van Schmus
et al. [
40] and Goodge and Vervoort [
42].
