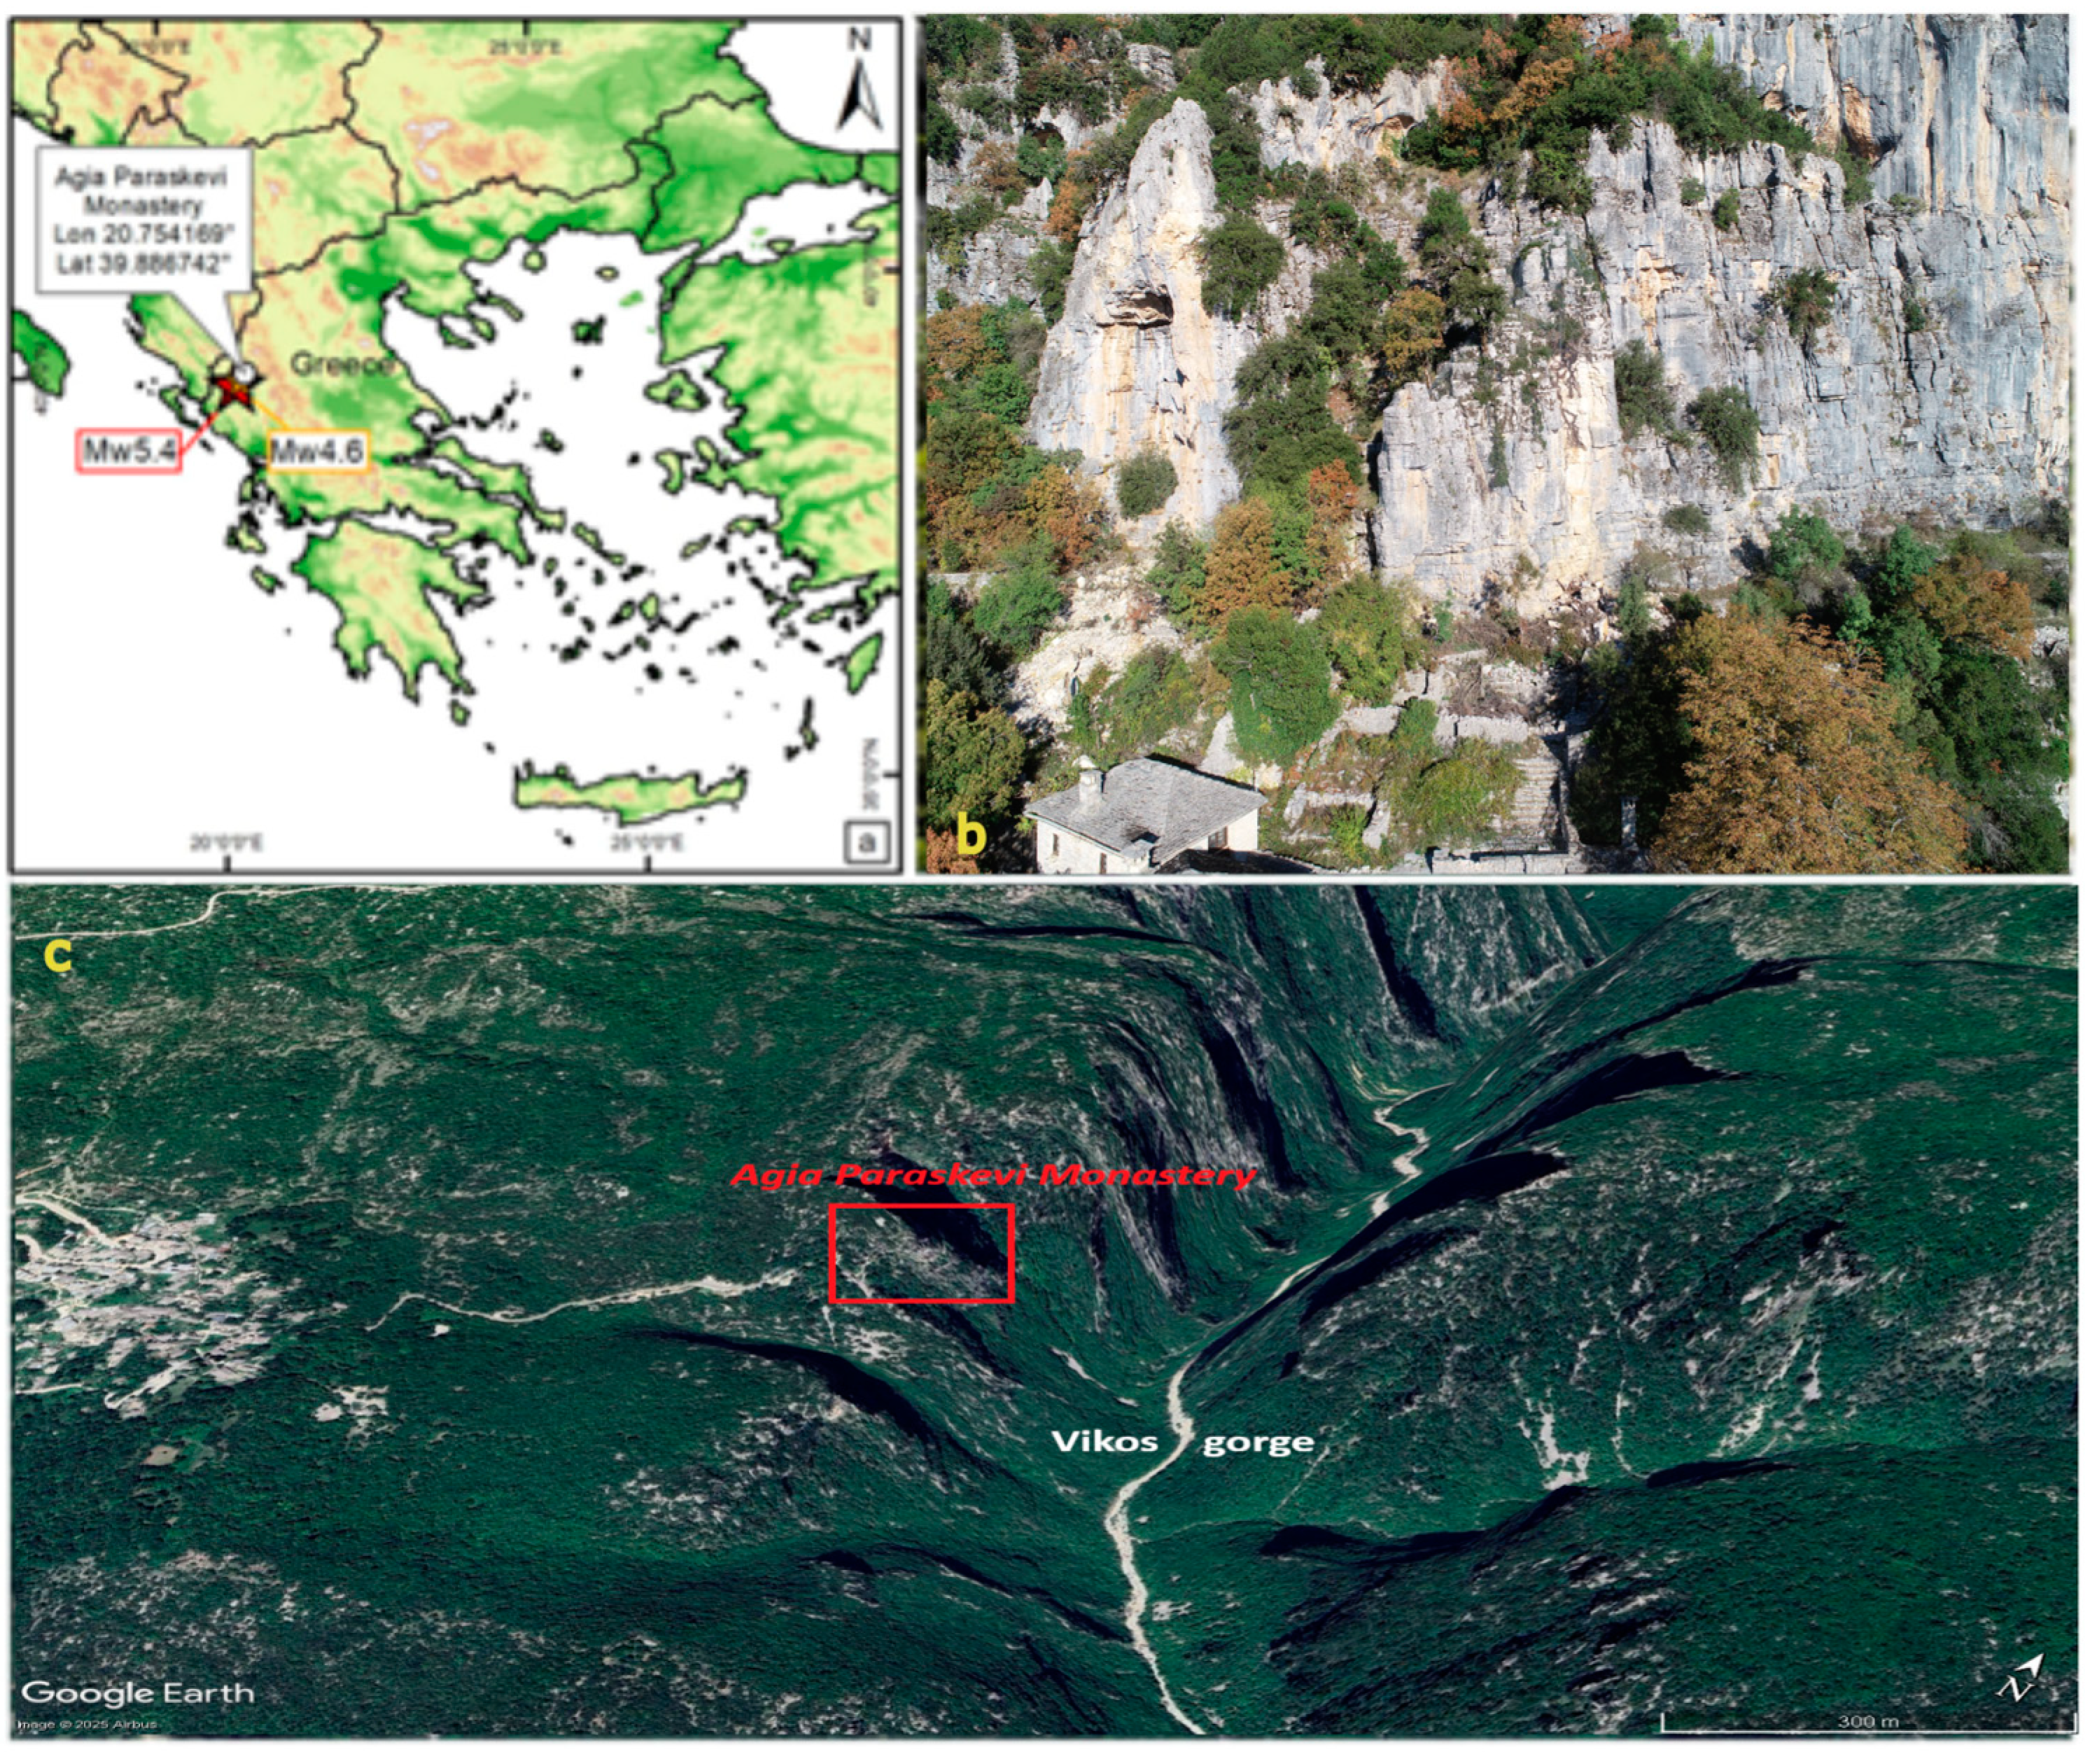
Figure 1.
(a) Map showing the location of the study area in the northwestern part of Greece and the two earthquake epicenters (red and orange stars for the Mw 5.4 and Mw 4.6 earthquakes, respectively); (b) photo showing the Agia Paraskevi Monastery and the steep slope of limestone (photo taken on 21 October, 2021; (c) morphology of the Vikos Gorge showing the location of the Agia Paraskevi Monastery (produced from Google Maps, 2025).
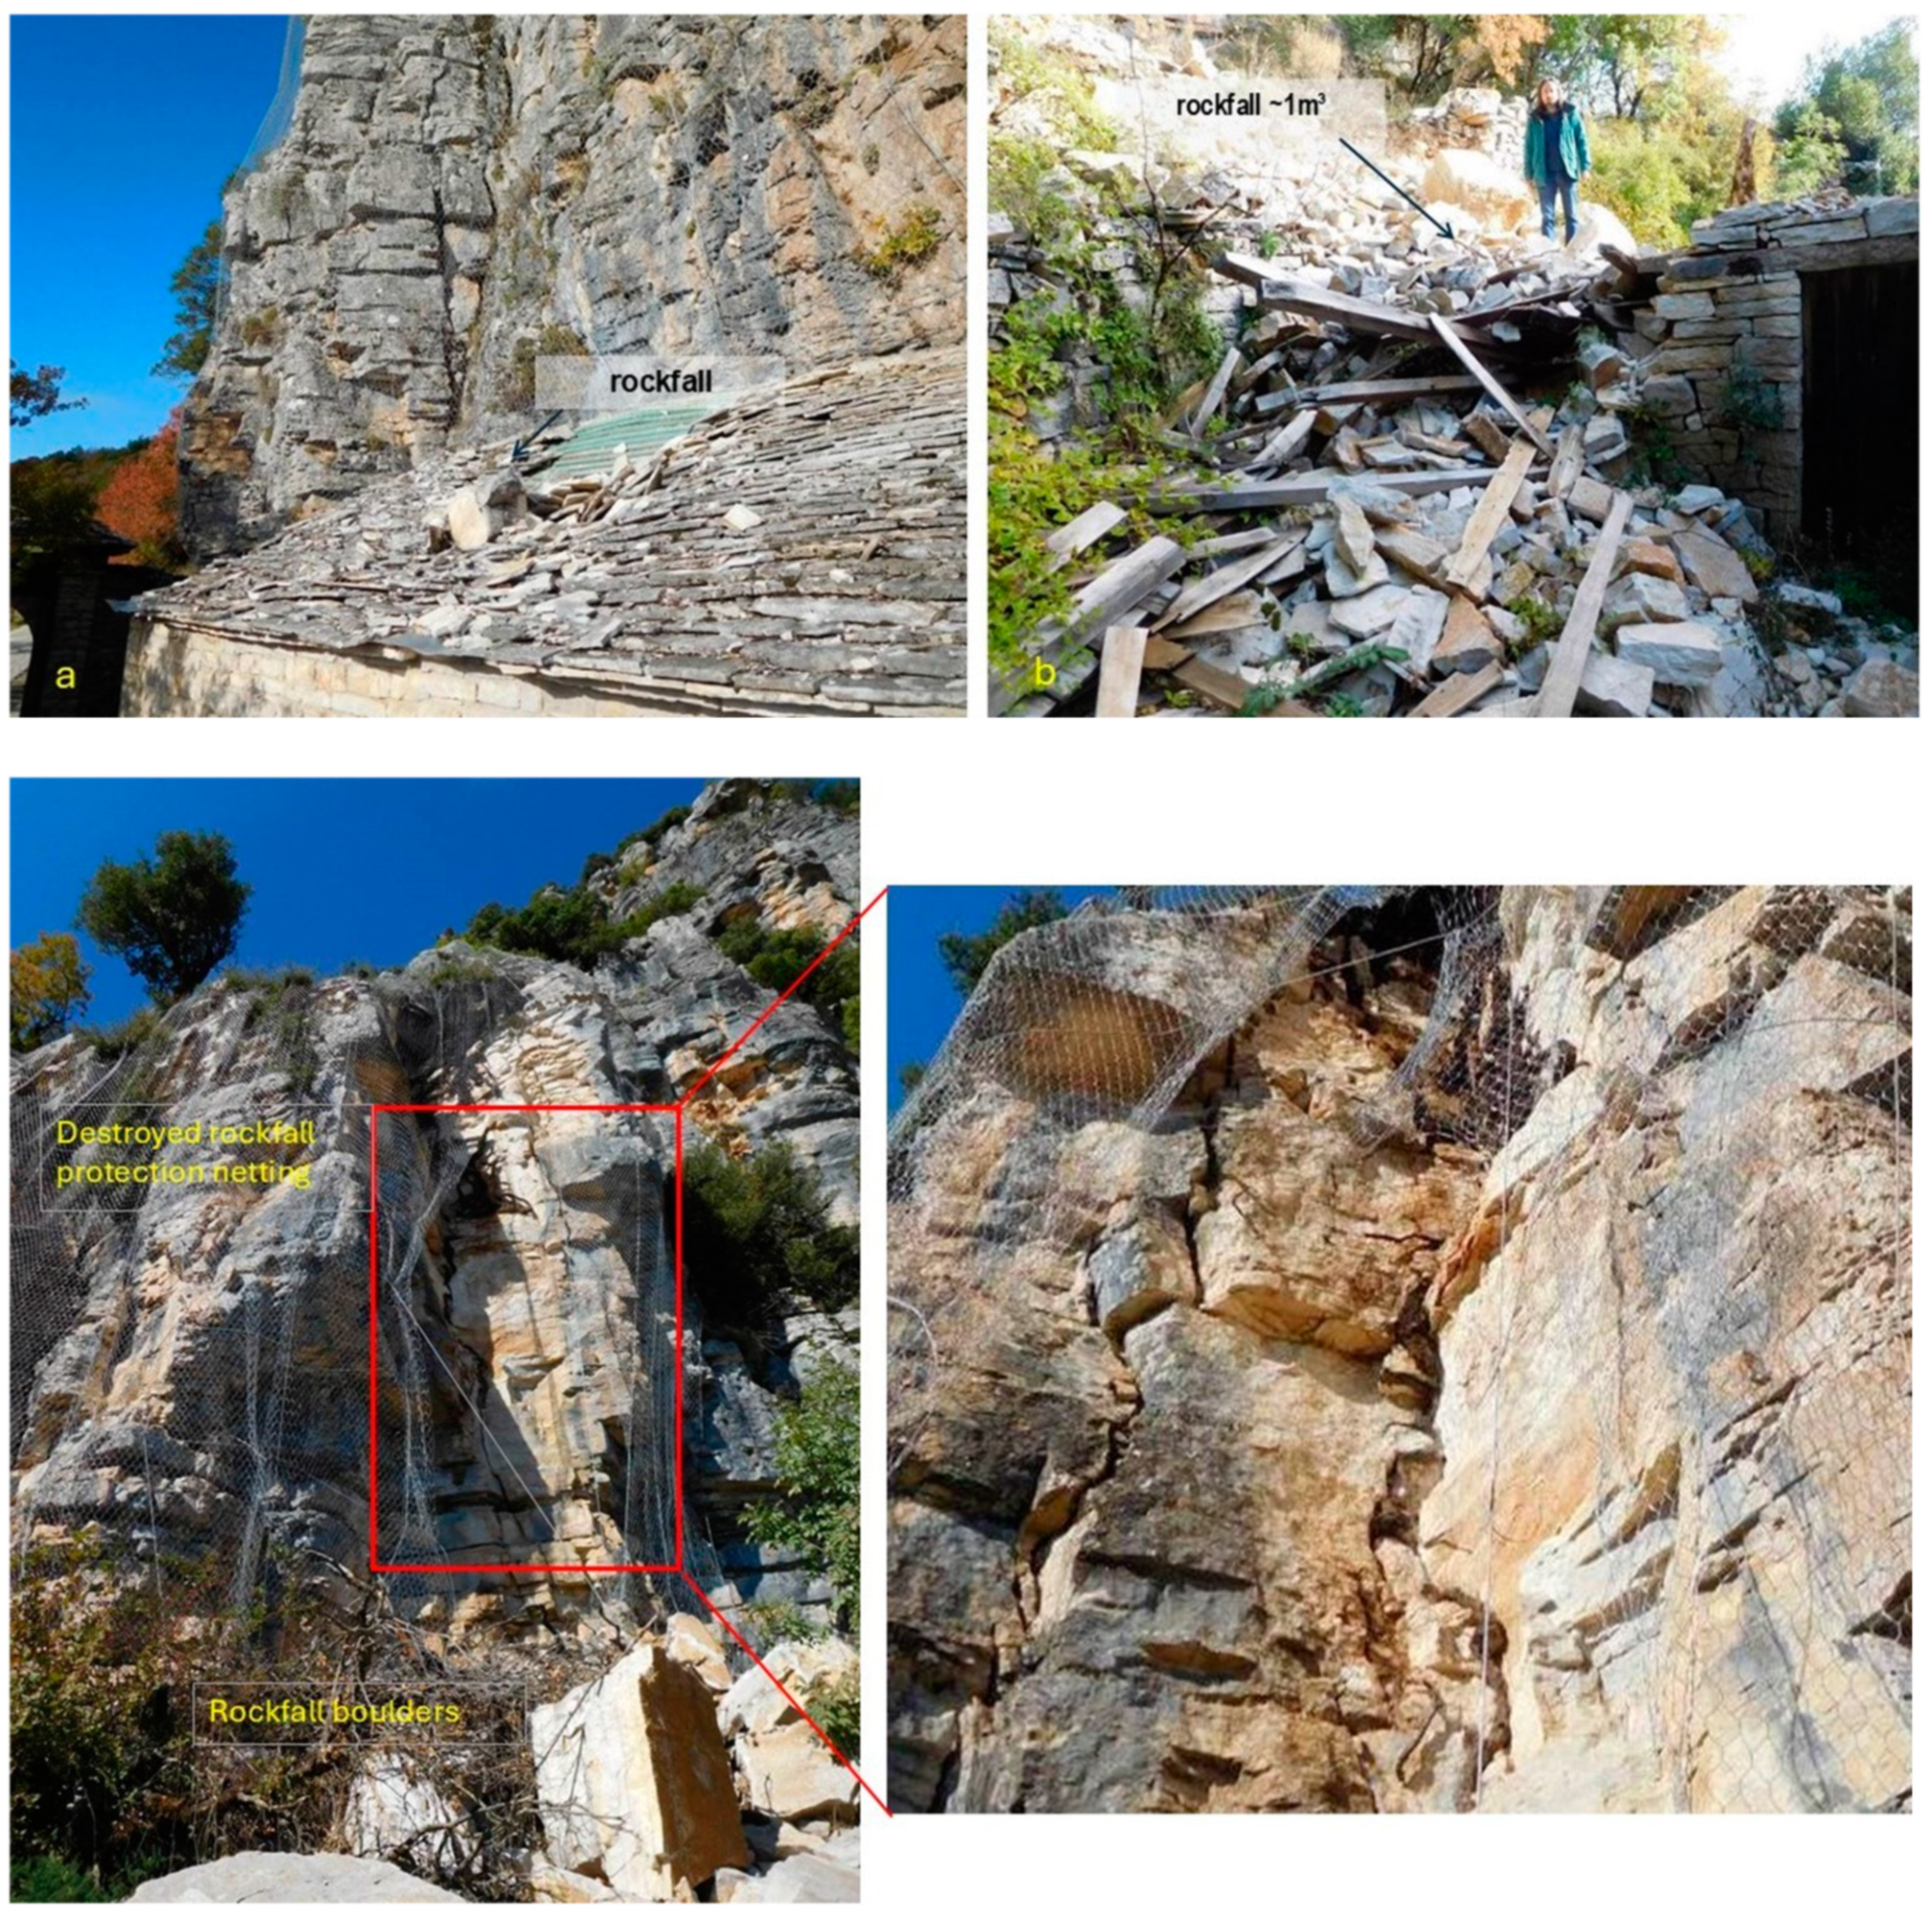
Figure 2.
(a,b) Rockfalls at a distance of 20 and 60 m, respectively, from the Monastery of Agia Paraskevi. The image below (a) shows the destroyed rockfall protection netting from the rockfall event in October 2021.
Figure 2.
(a,b) Rockfalls at a distance of 20 and 60 m, respectively, from the Monastery of Agia Paraskevi. The image below (a) shows the destroyed rockfall protection netting from the rockfall event in October 2021.
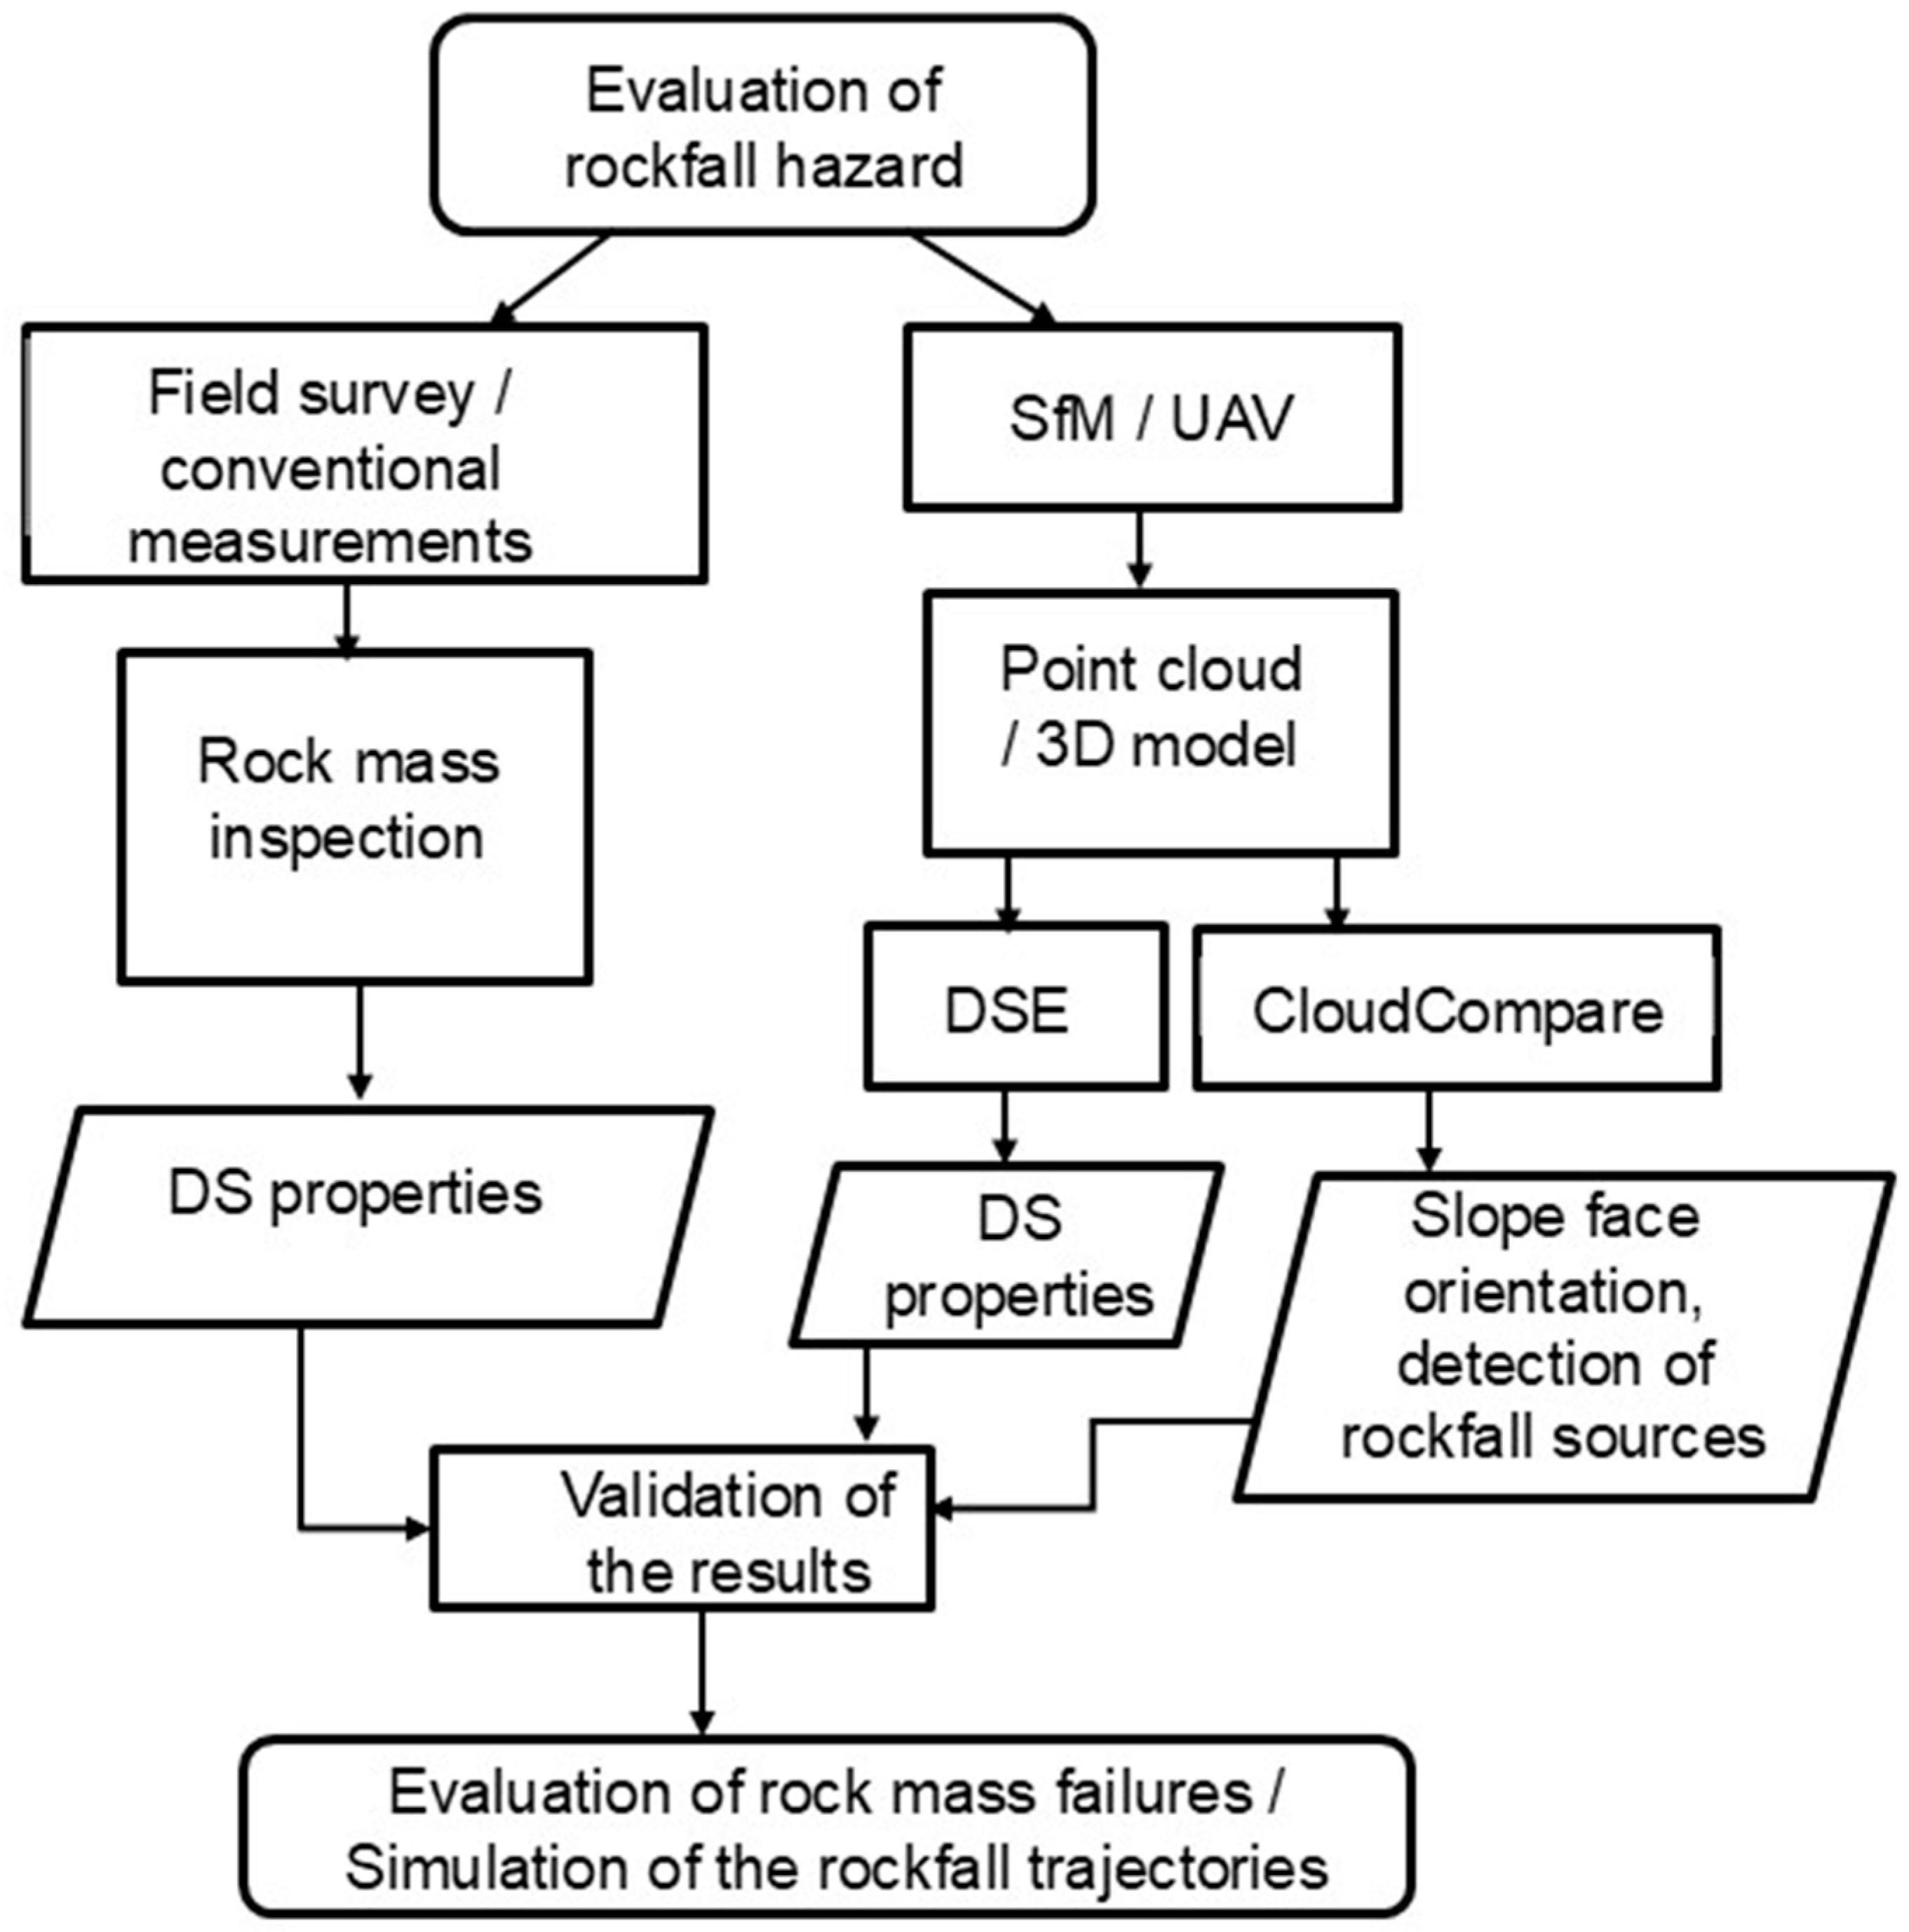
Figure 3.
Flowchart of the methodology applied for the purposes of this study. (SfM: structure from motion; UAV: Unmanned Aerial Vehicle; DSE: Discontinuity Set Extractor; DS: Discontinuity Set).
Figure 3.
Flowchart of the methodology applied for the purposes of this study. (SfM: structure from motion; UAV: Unmanned Aerial Vehicle; DSE: Discontinuity Set Extractor; DS: Discontinuity Set).
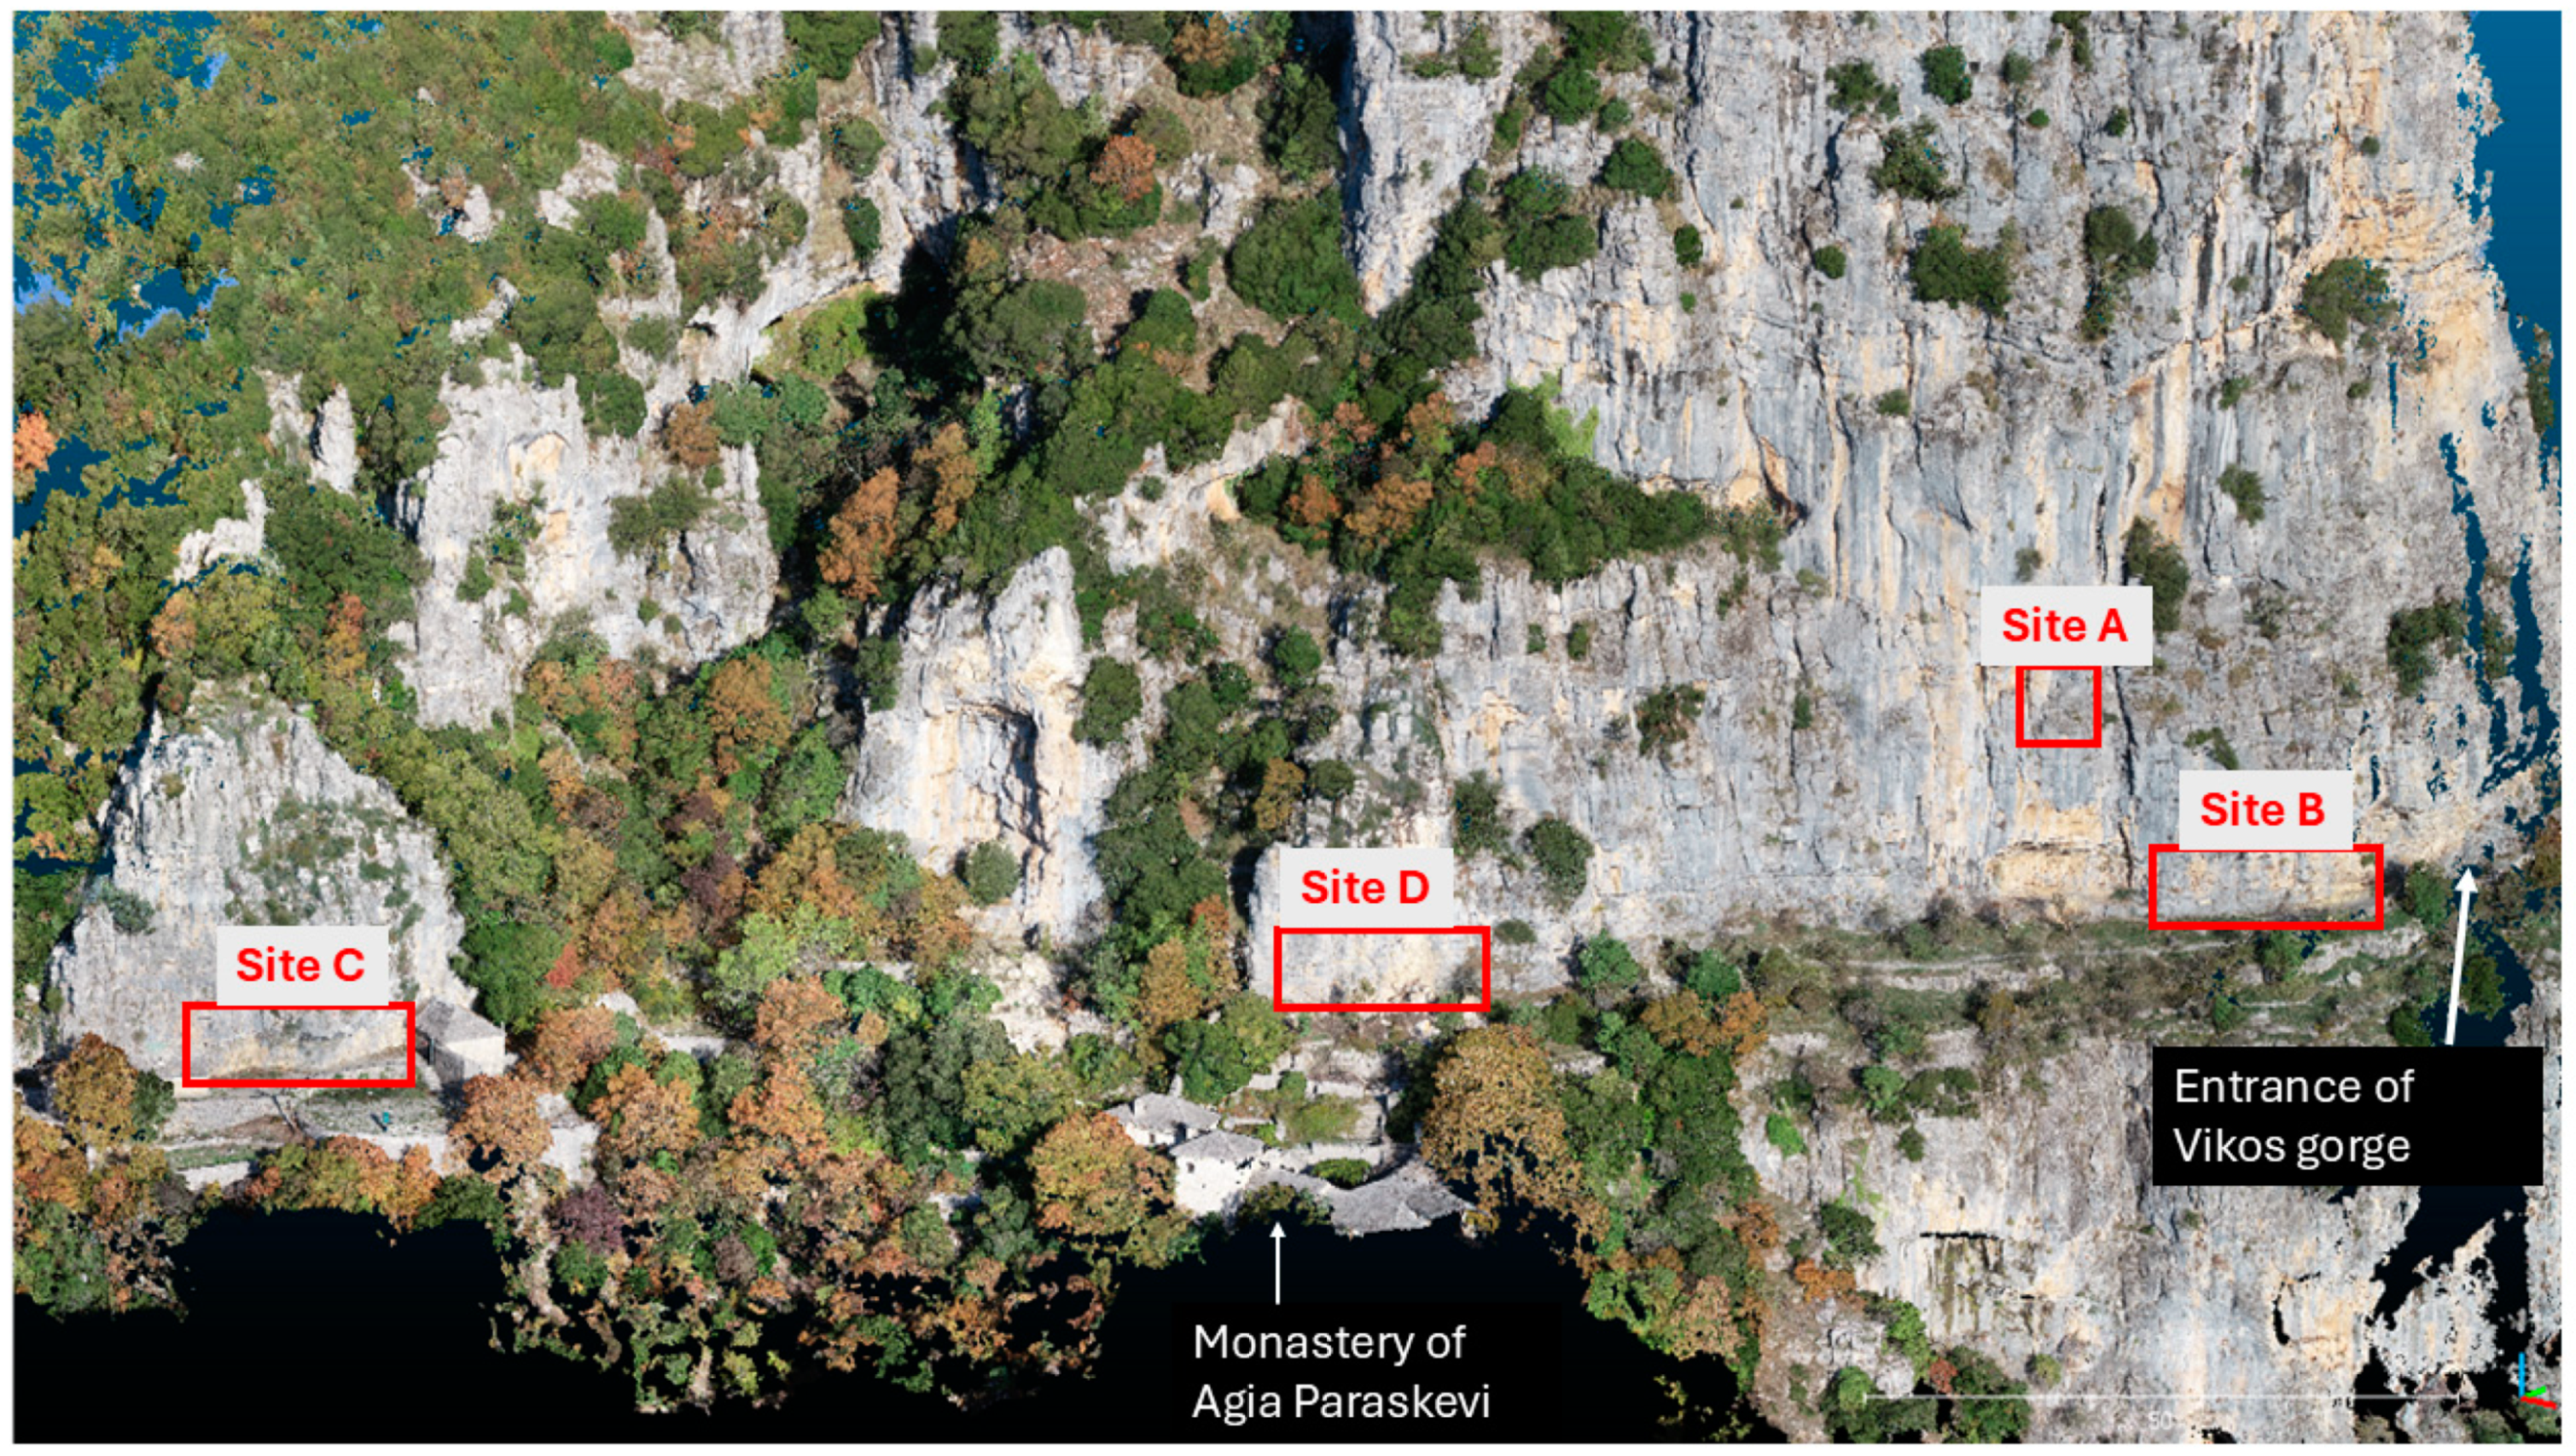
Figure 4.
Rock slope of the study area delineating the sites where traditional (site D) and UAV-based structural analysis (sites A, B, and C) were carried out. In addition, the location of the Monastery of Agia Paraskevi and the entrance to Vikos Gorge are shown.
Figure 4.
Rock slope of the study area delineating the sites where traditional (site D) and UAV-based structural analysis (sites A, B, and C) were carried out. In addition, the location of the Monastery of Agia Paraskevi and the entrance to Vikos Gorge are shown.
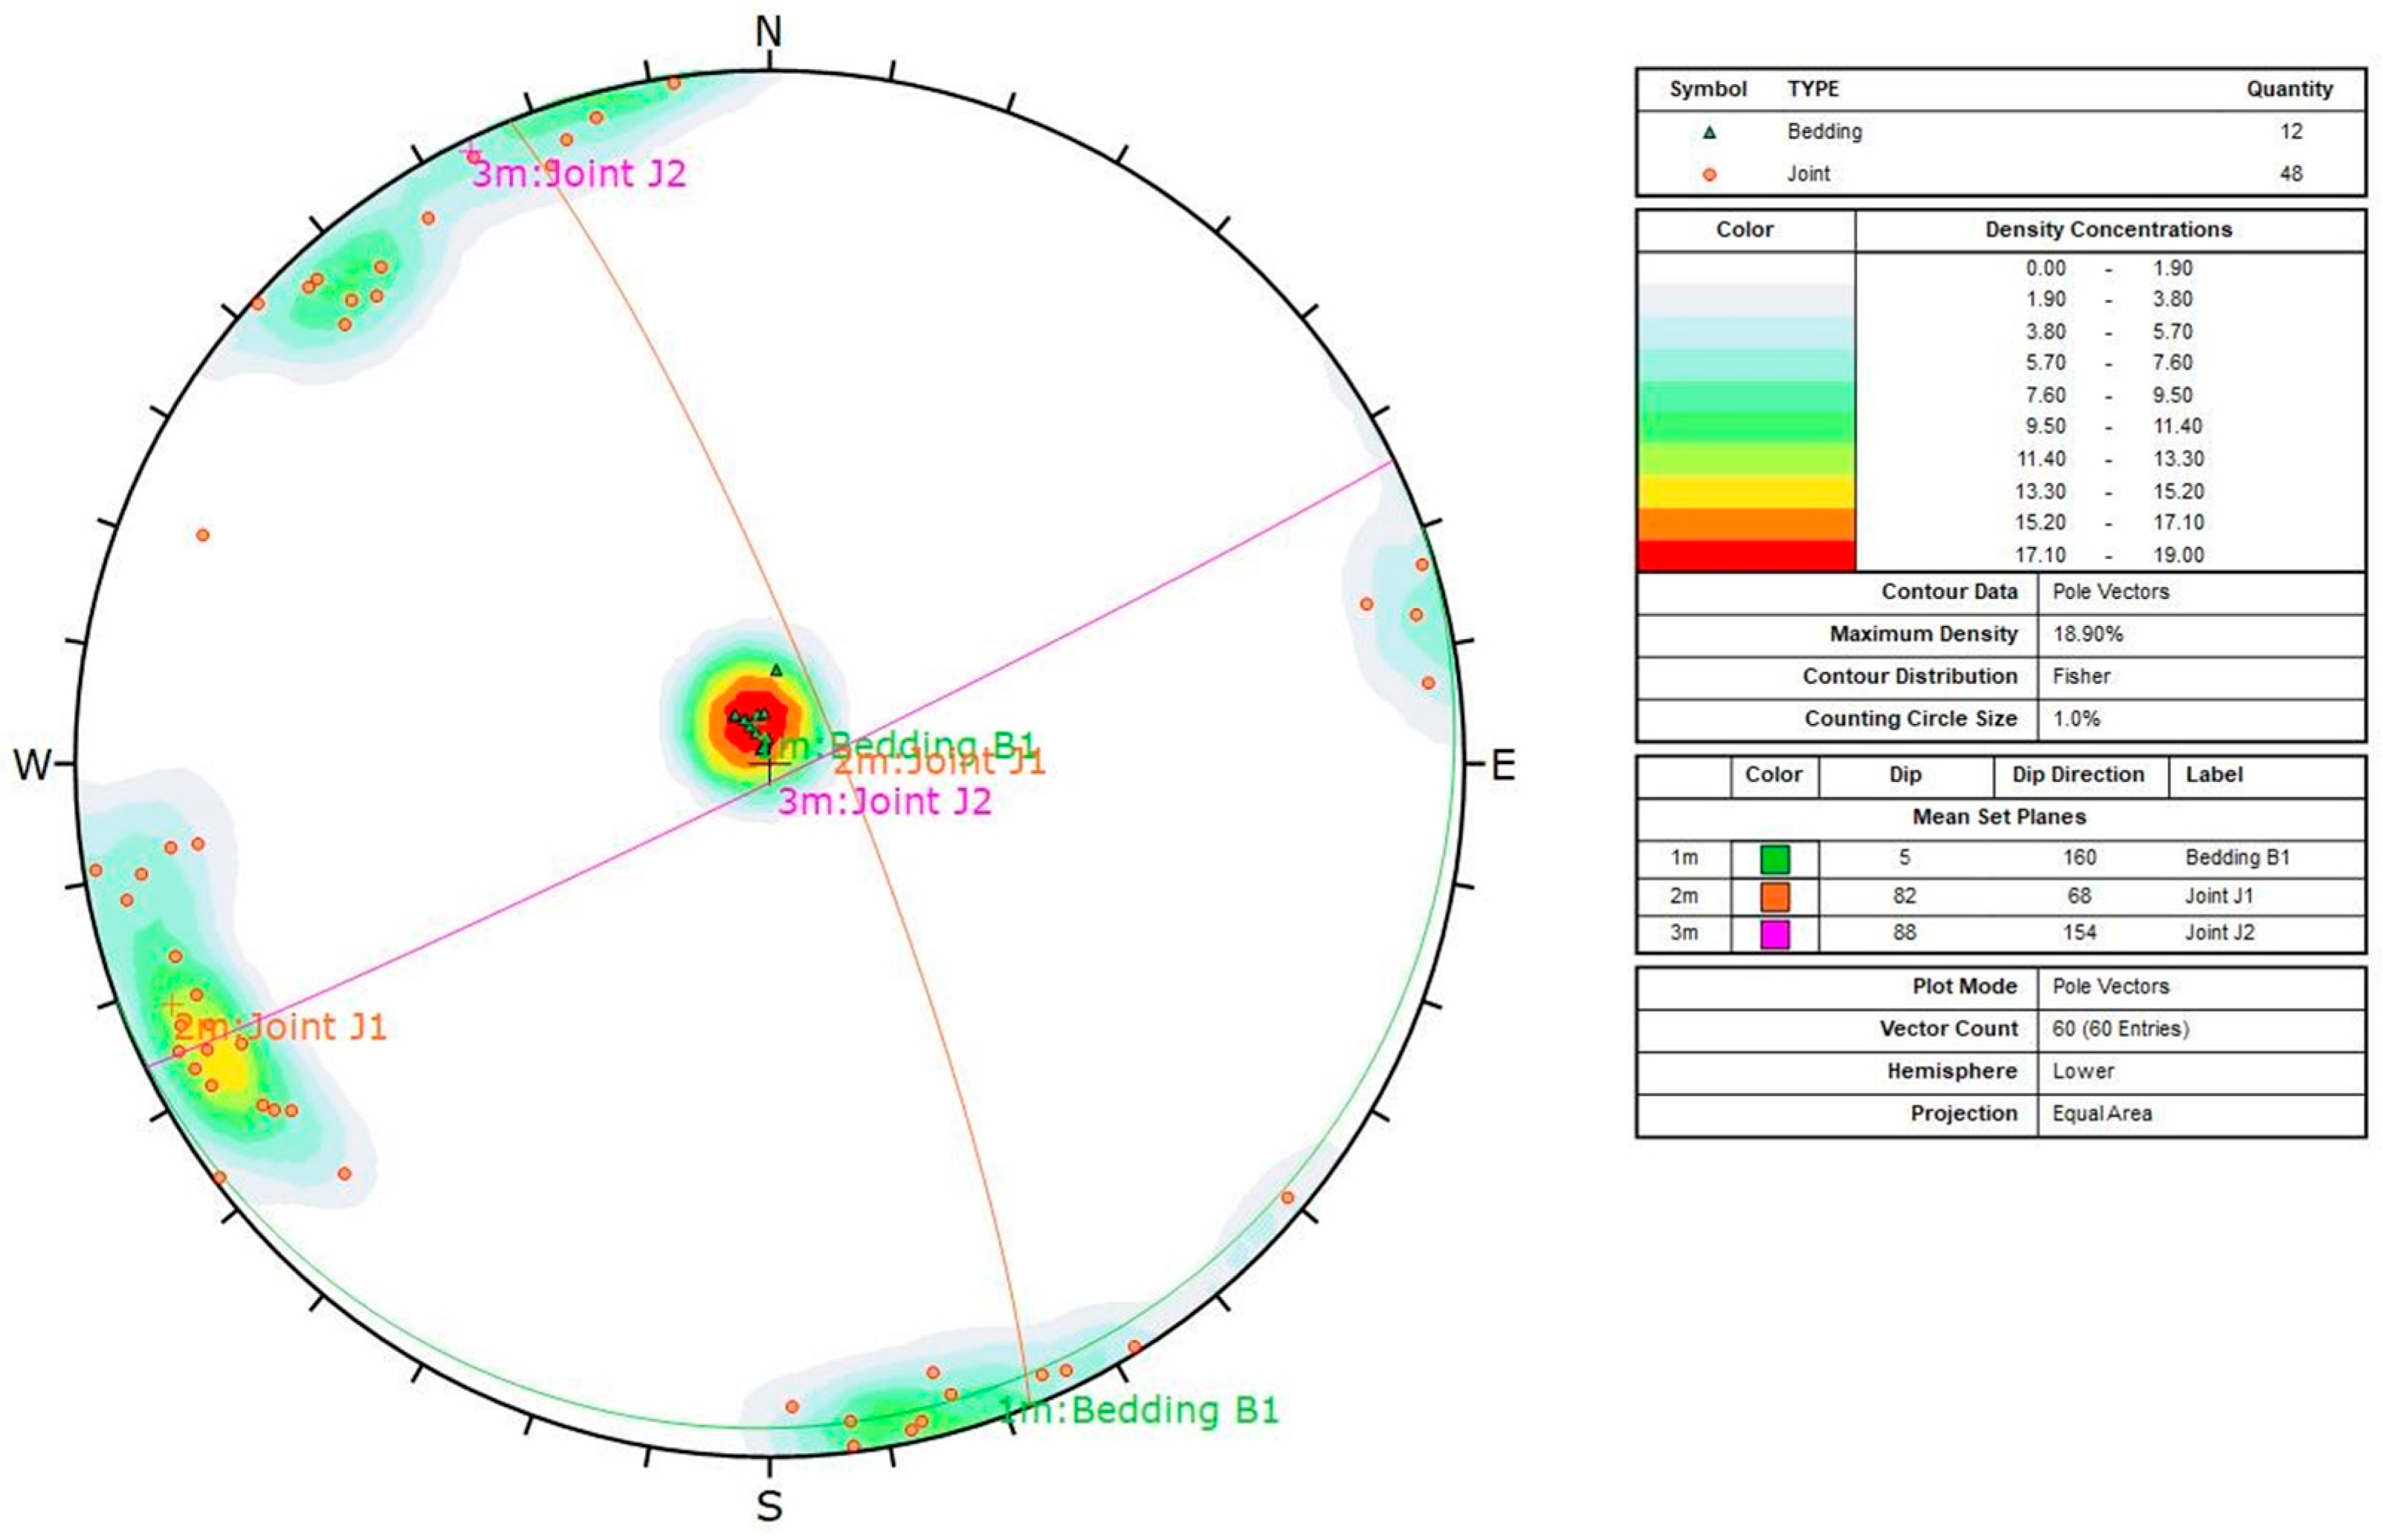
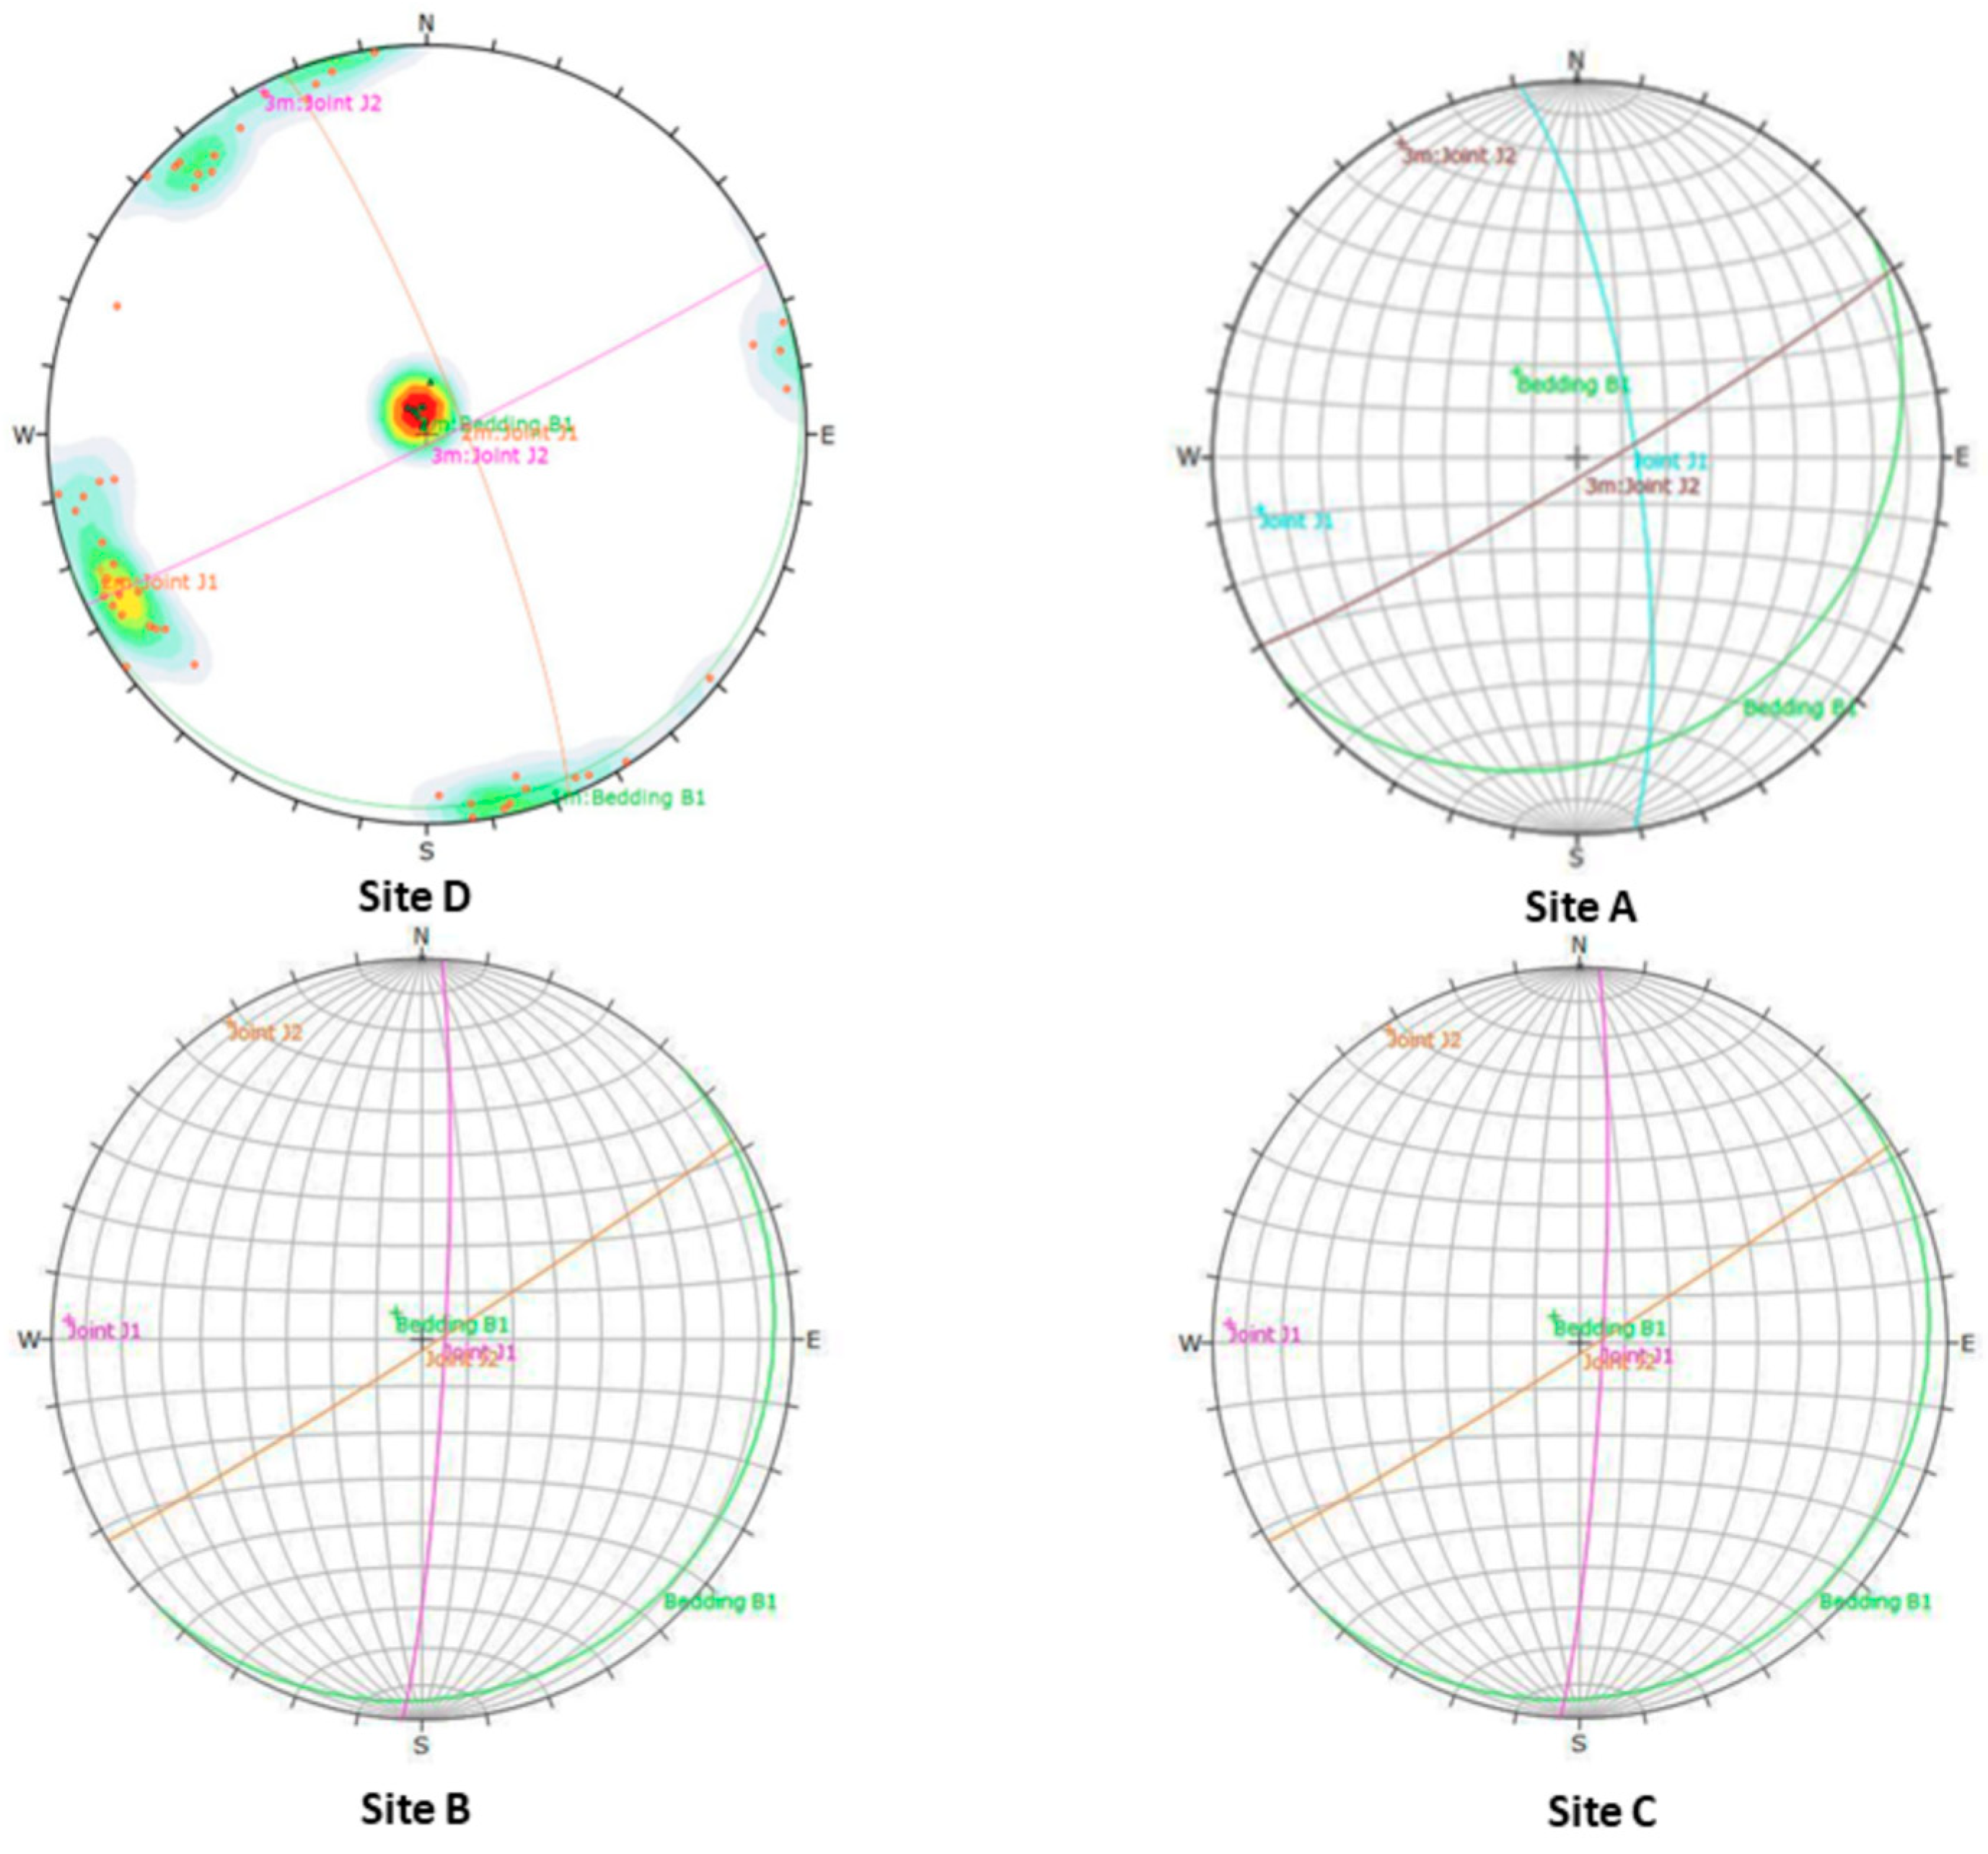
Figure 5.
Stereographic projection (lower hemisphere, equal area) of discontinuity poles and main sets resulting from geological compass-derived data (site D).
Figure 5.
Stereographic projection (lower hemisphere, equal area) of discontinuity poles and main sets resulting from geological compass-derived data (site D).
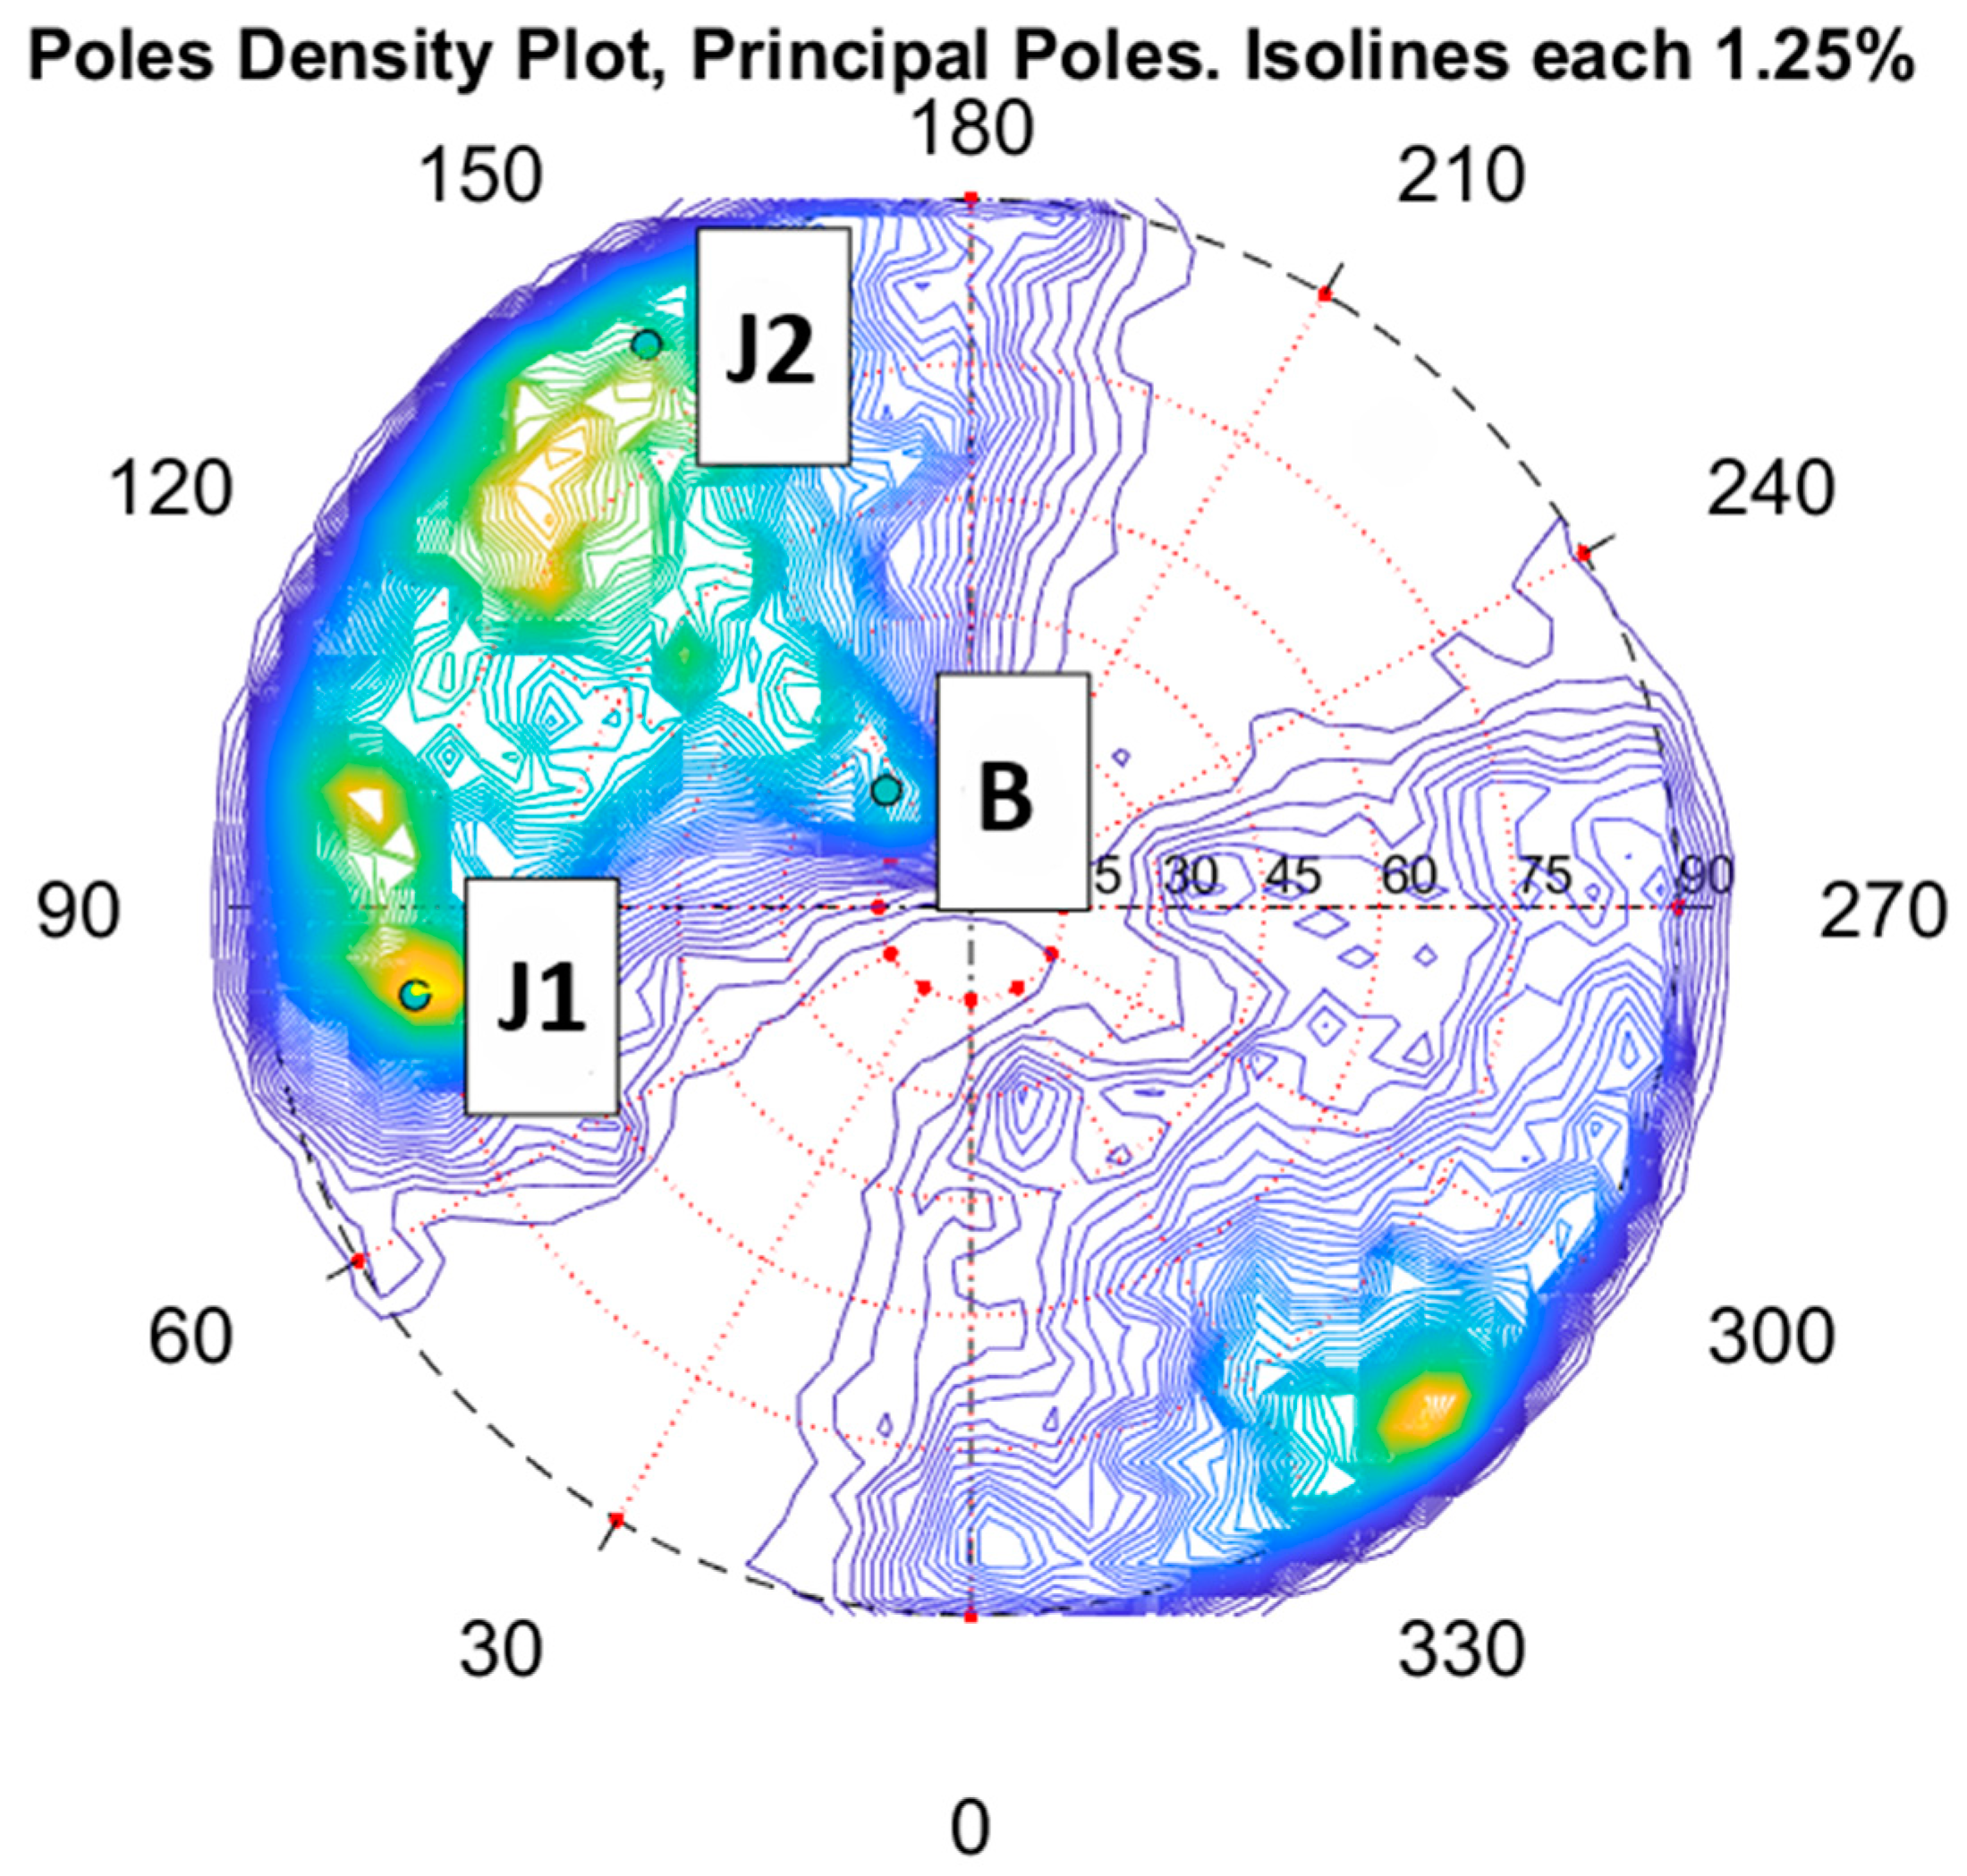
Figure 6.
Site A. Stereonet of the density of the normal vector’s poles developed based on the Discontinuity Set Extractor (DSE).
Figure 6.
Site A. Stereonet of the density of the normal vector’s poles developed based on the Discontinuity Set Extractor (DSE).
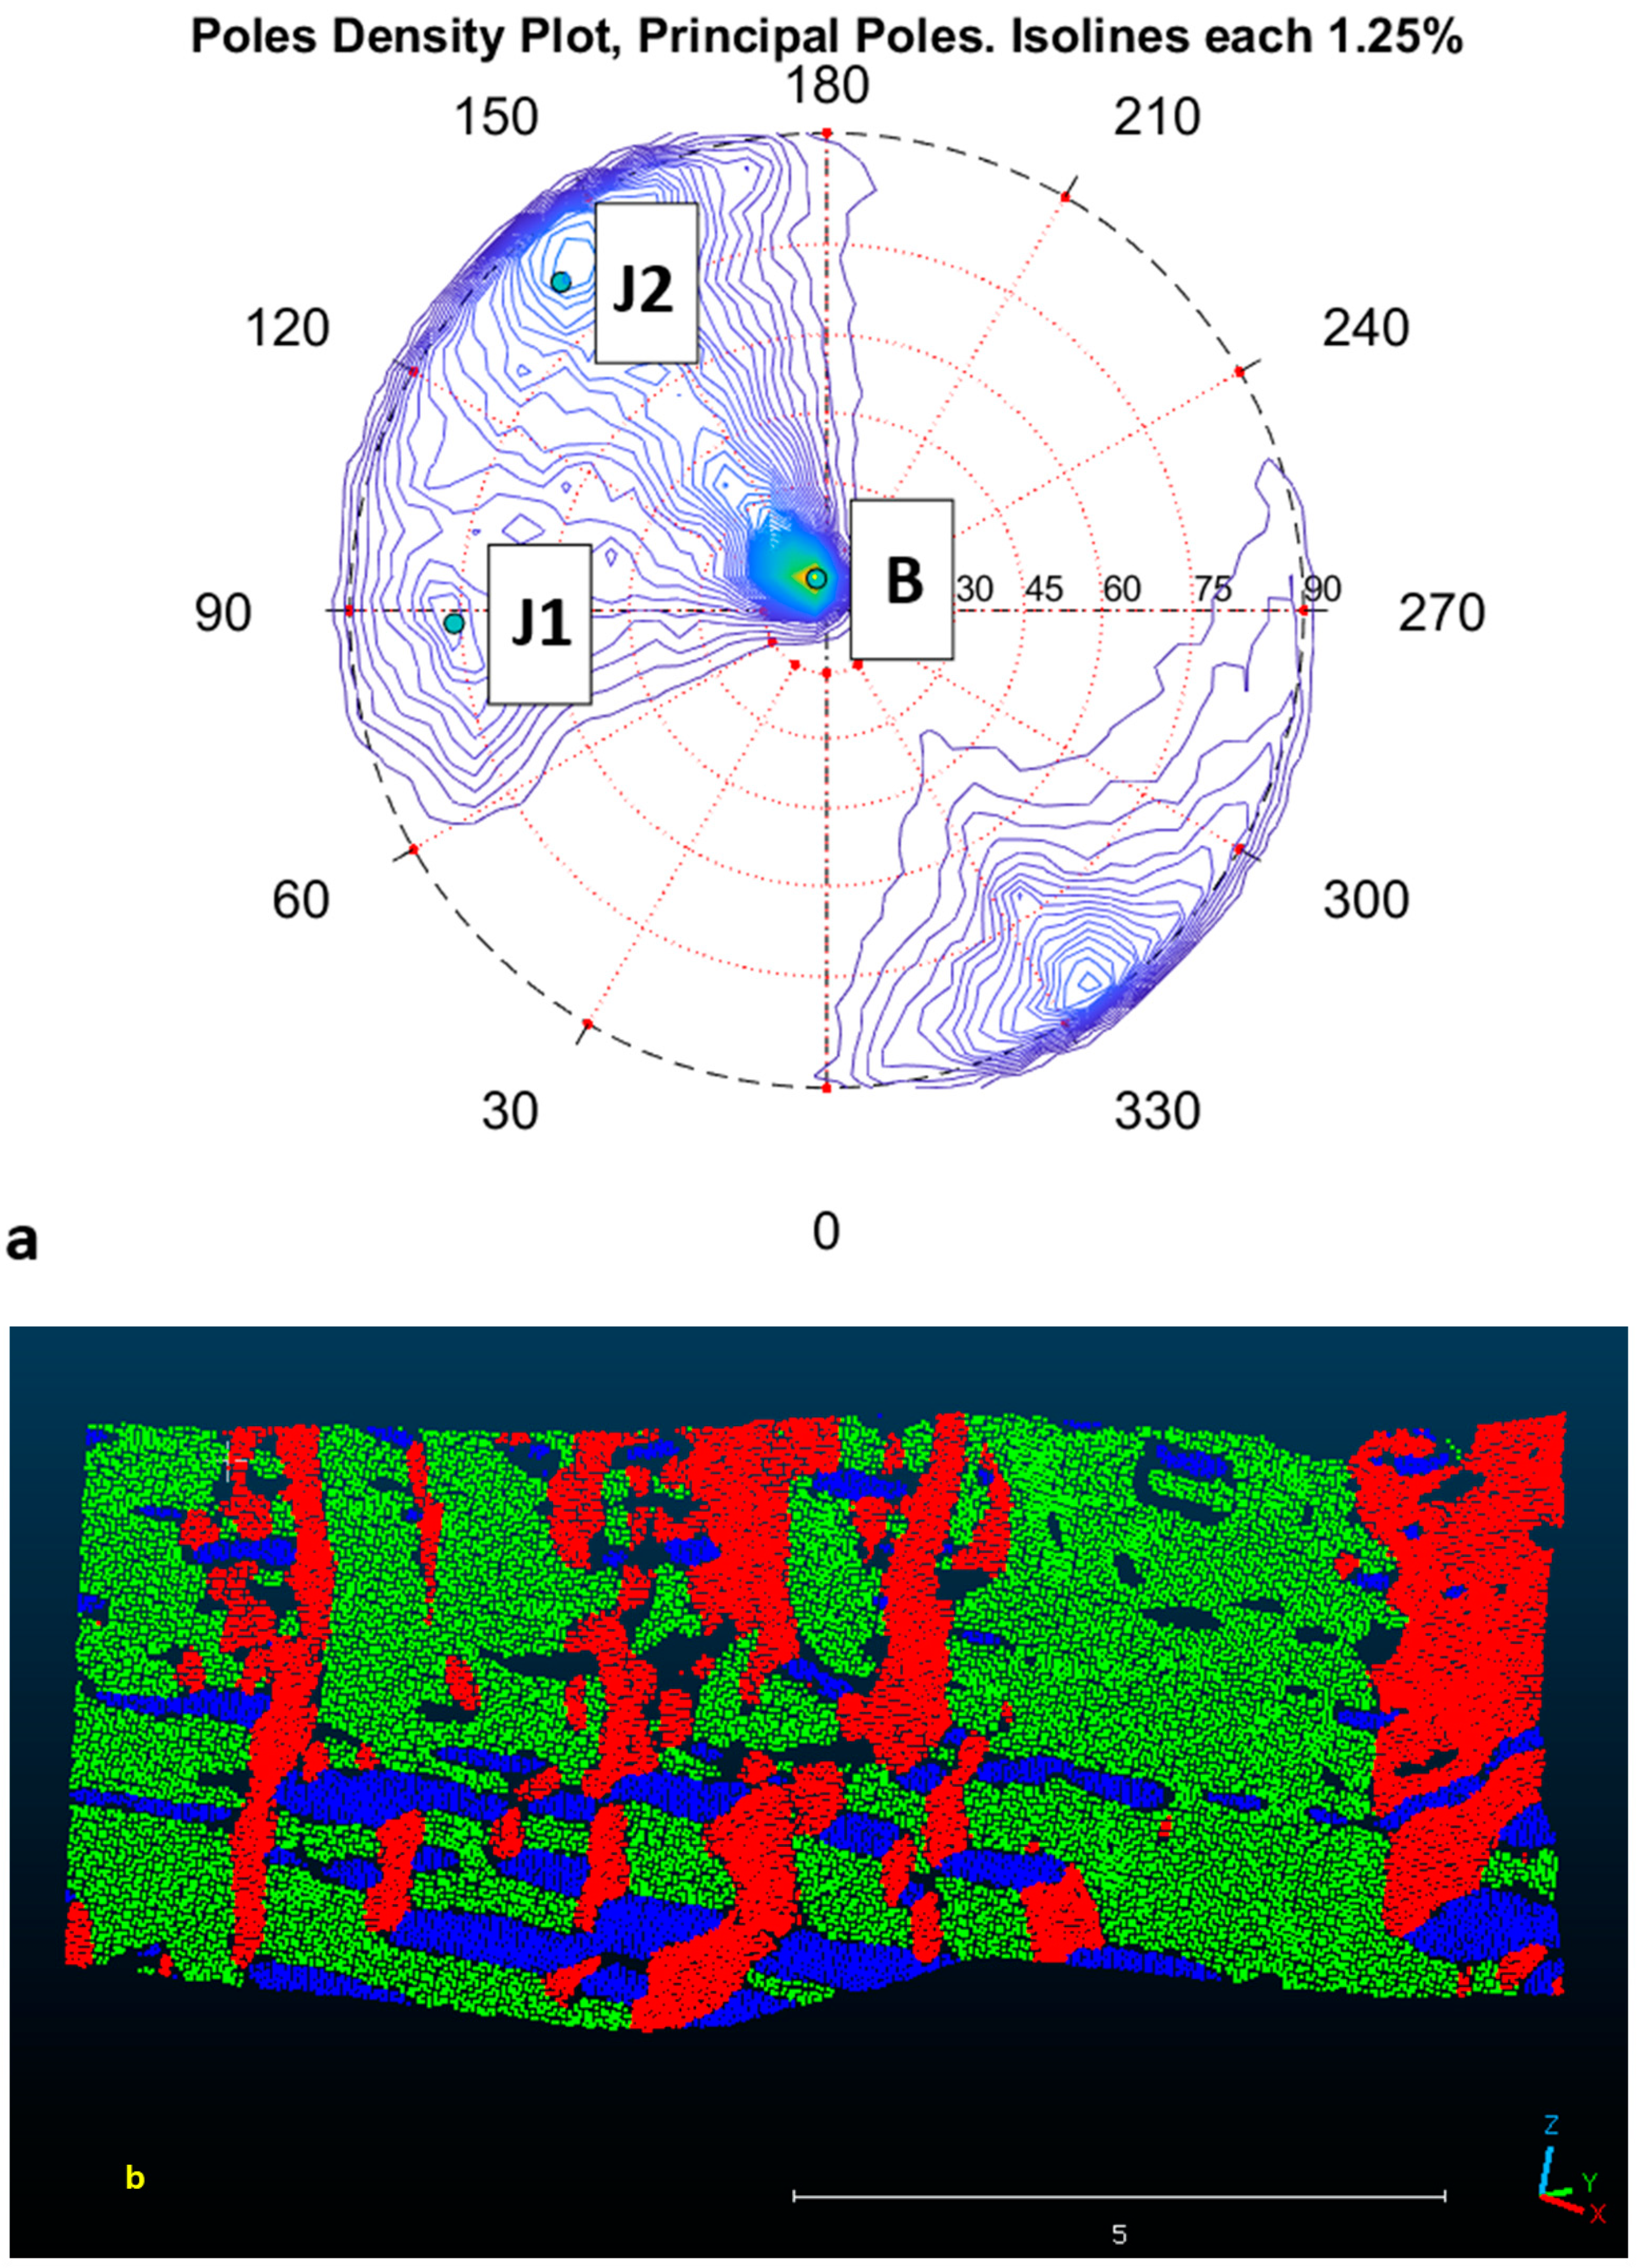
Figure 7.
Site B. (a) Stereonet of the density of the normal vector’s poles developed based on the Discontinuity Set Extractor (DSE). (b) Three-dimensional view of the discontinuity sets defined by the DSE; bedding is shown in blue, J1 in red, and J2 in green. It should be noted that the export of the DSE provides a chromatic identification of the discontinuity sets without indicating the orientation of each joint.
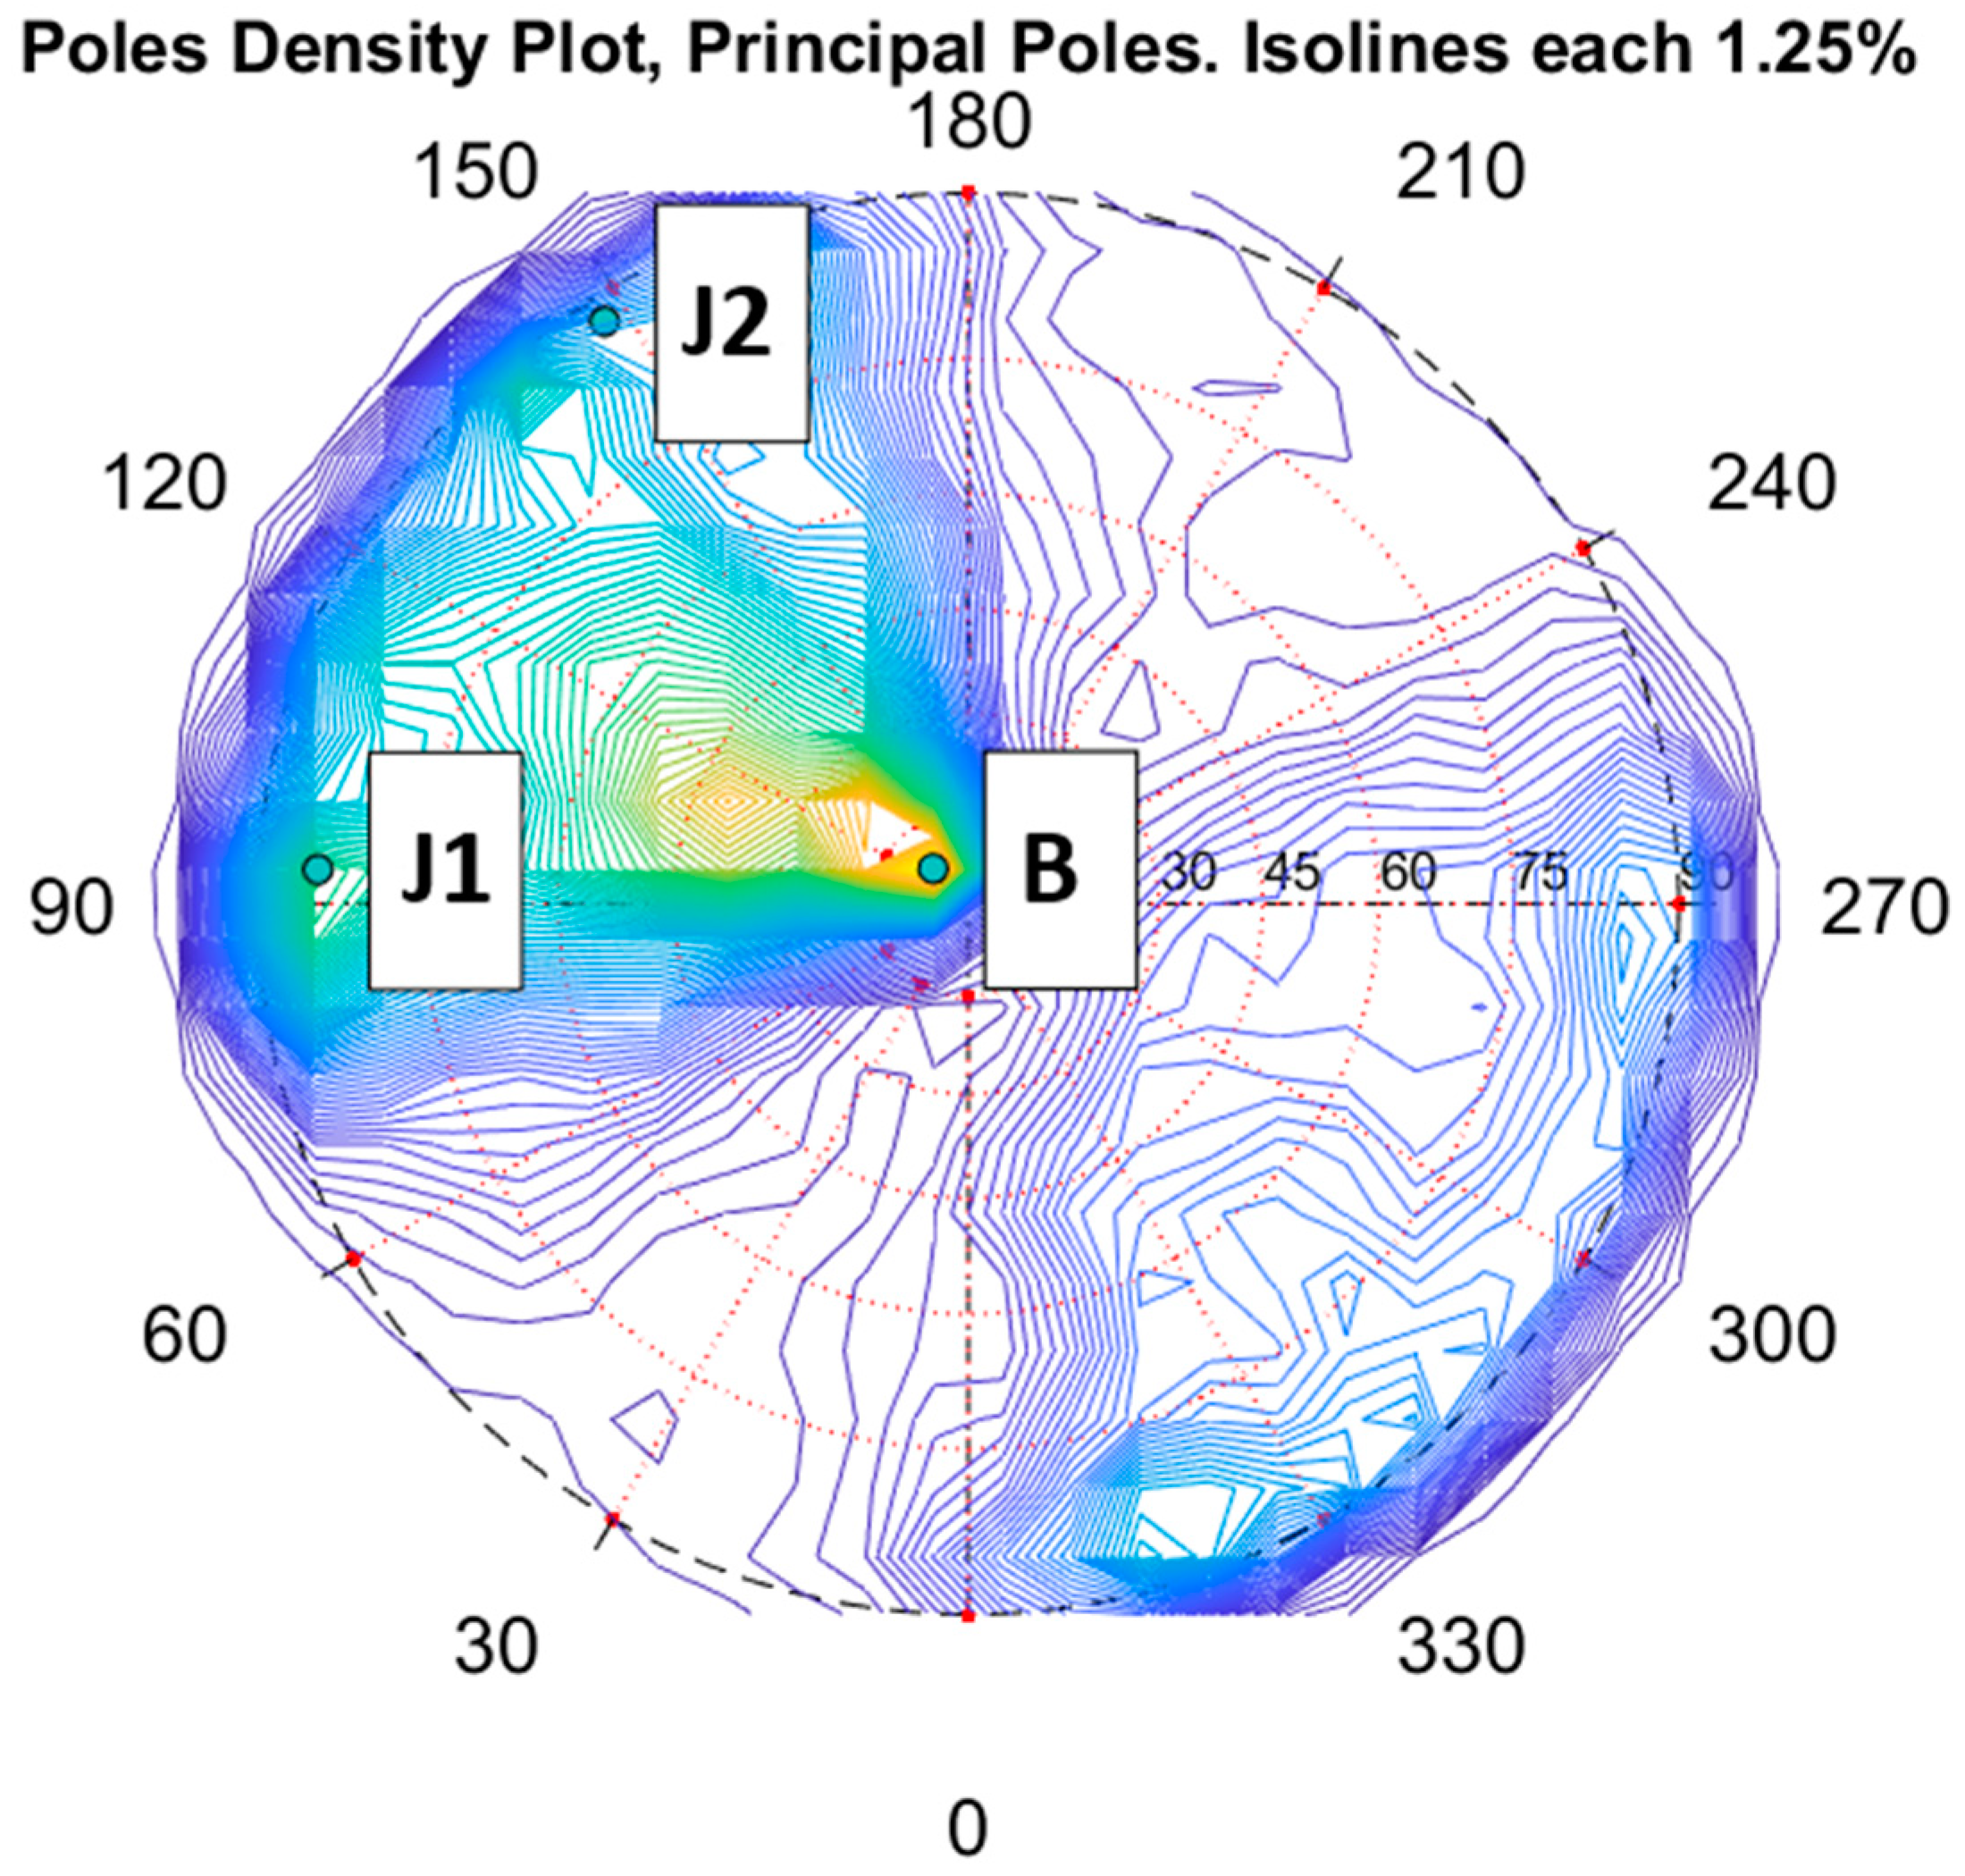
Figure 8.
Site C. Stereonet of the density of the normal vector’s poles developed based on the Discontinuity Set Extractor (DSE).
Figure 8.
Site C. Stereonet of the density of the normal vector’s poles developed based on the Discontinuity Set Extractor (DSE).
Figure 9.
Stereographic projection (lower hemisphere, equal area) of discontinuity poles and main sets based on geological field survey (site D) and UAV-derived data (Sites A, B, and C). The green color indicates the bedding, the red color indicates J1, and the orange color indicates J2.
Figure 9.
Stereographic projection (lower hemisphere, equal area) of discontinuity poles and main sets based on geological field survey (site D) and UAV-derived data (Sites A, B, and C). The green color indicates the bedding, the red color indicates J1, and the orange color indicates J2.
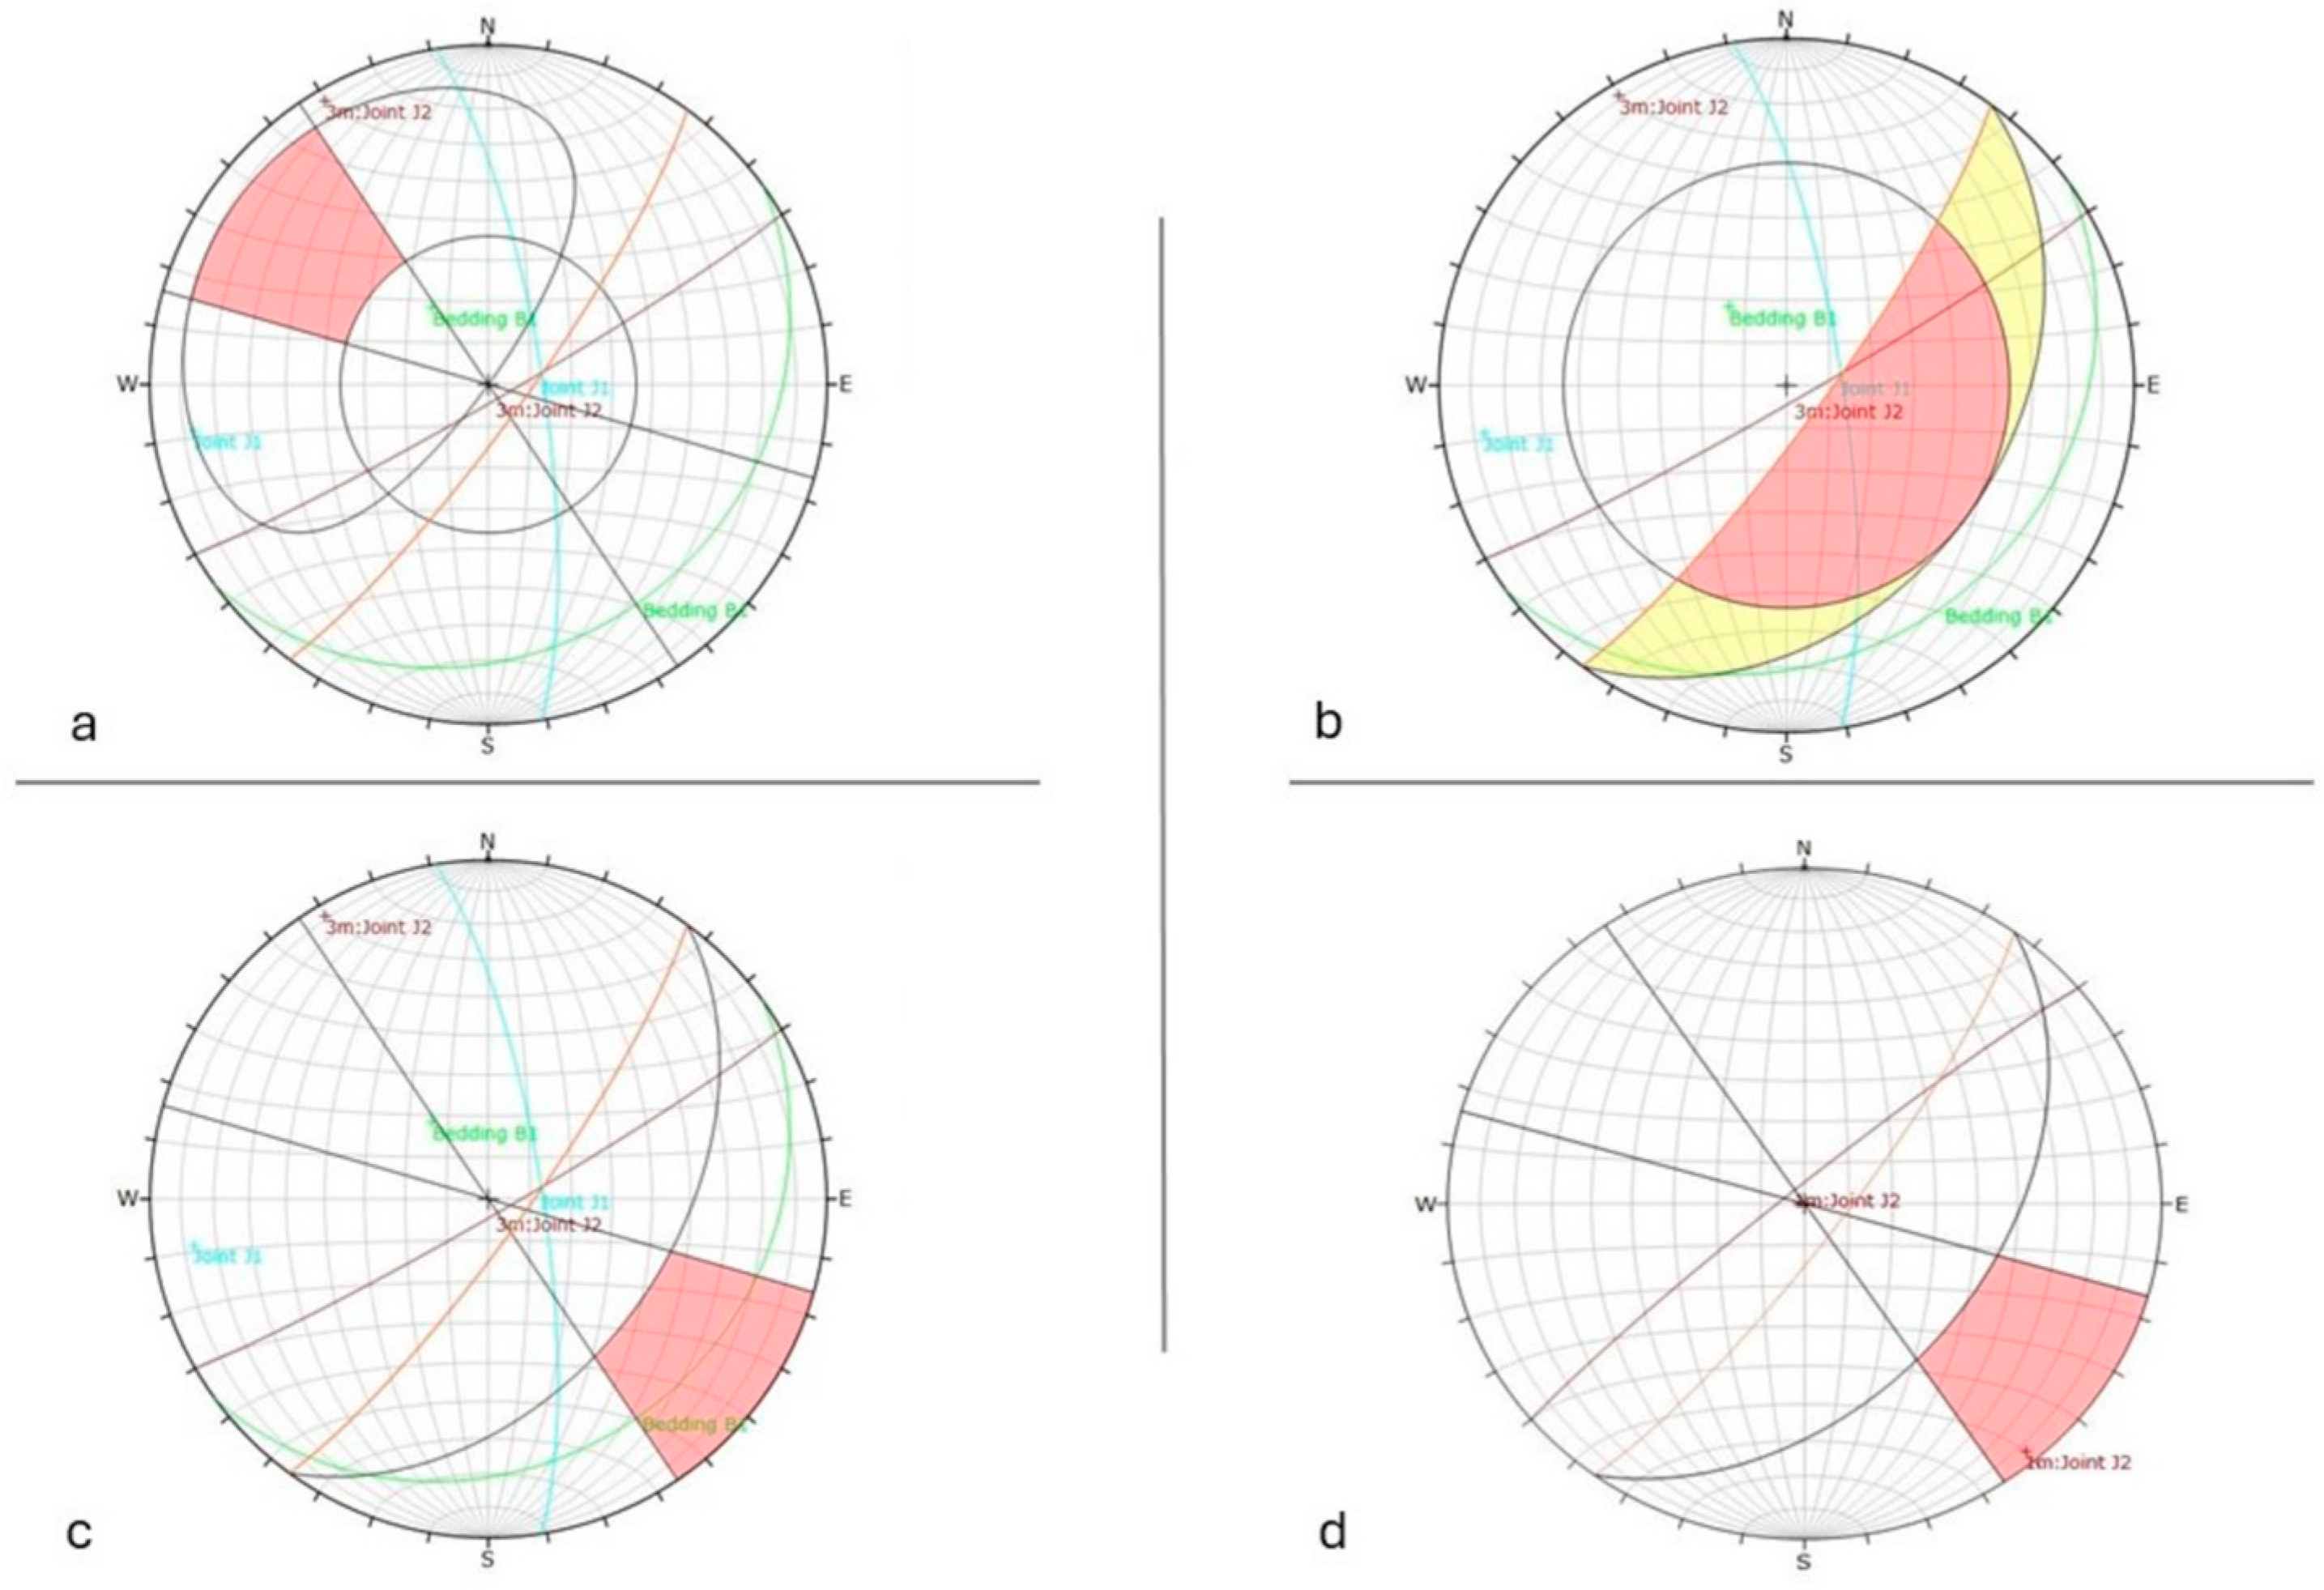
Figure 10.
Kinematic analysis for (a) planar sliding, (b) wedge failure, (c) toppling phenomena, and (d) toppling for vertical joints of similar strike with a slope face that dips into the slope.
Figure 10.
Kinematic analysis for (a) planar sliding, (b) wedge failure, (c) toppling phenomena, and (d) toppling for vertical joints of similar strike with a slope face that dips into the slope.
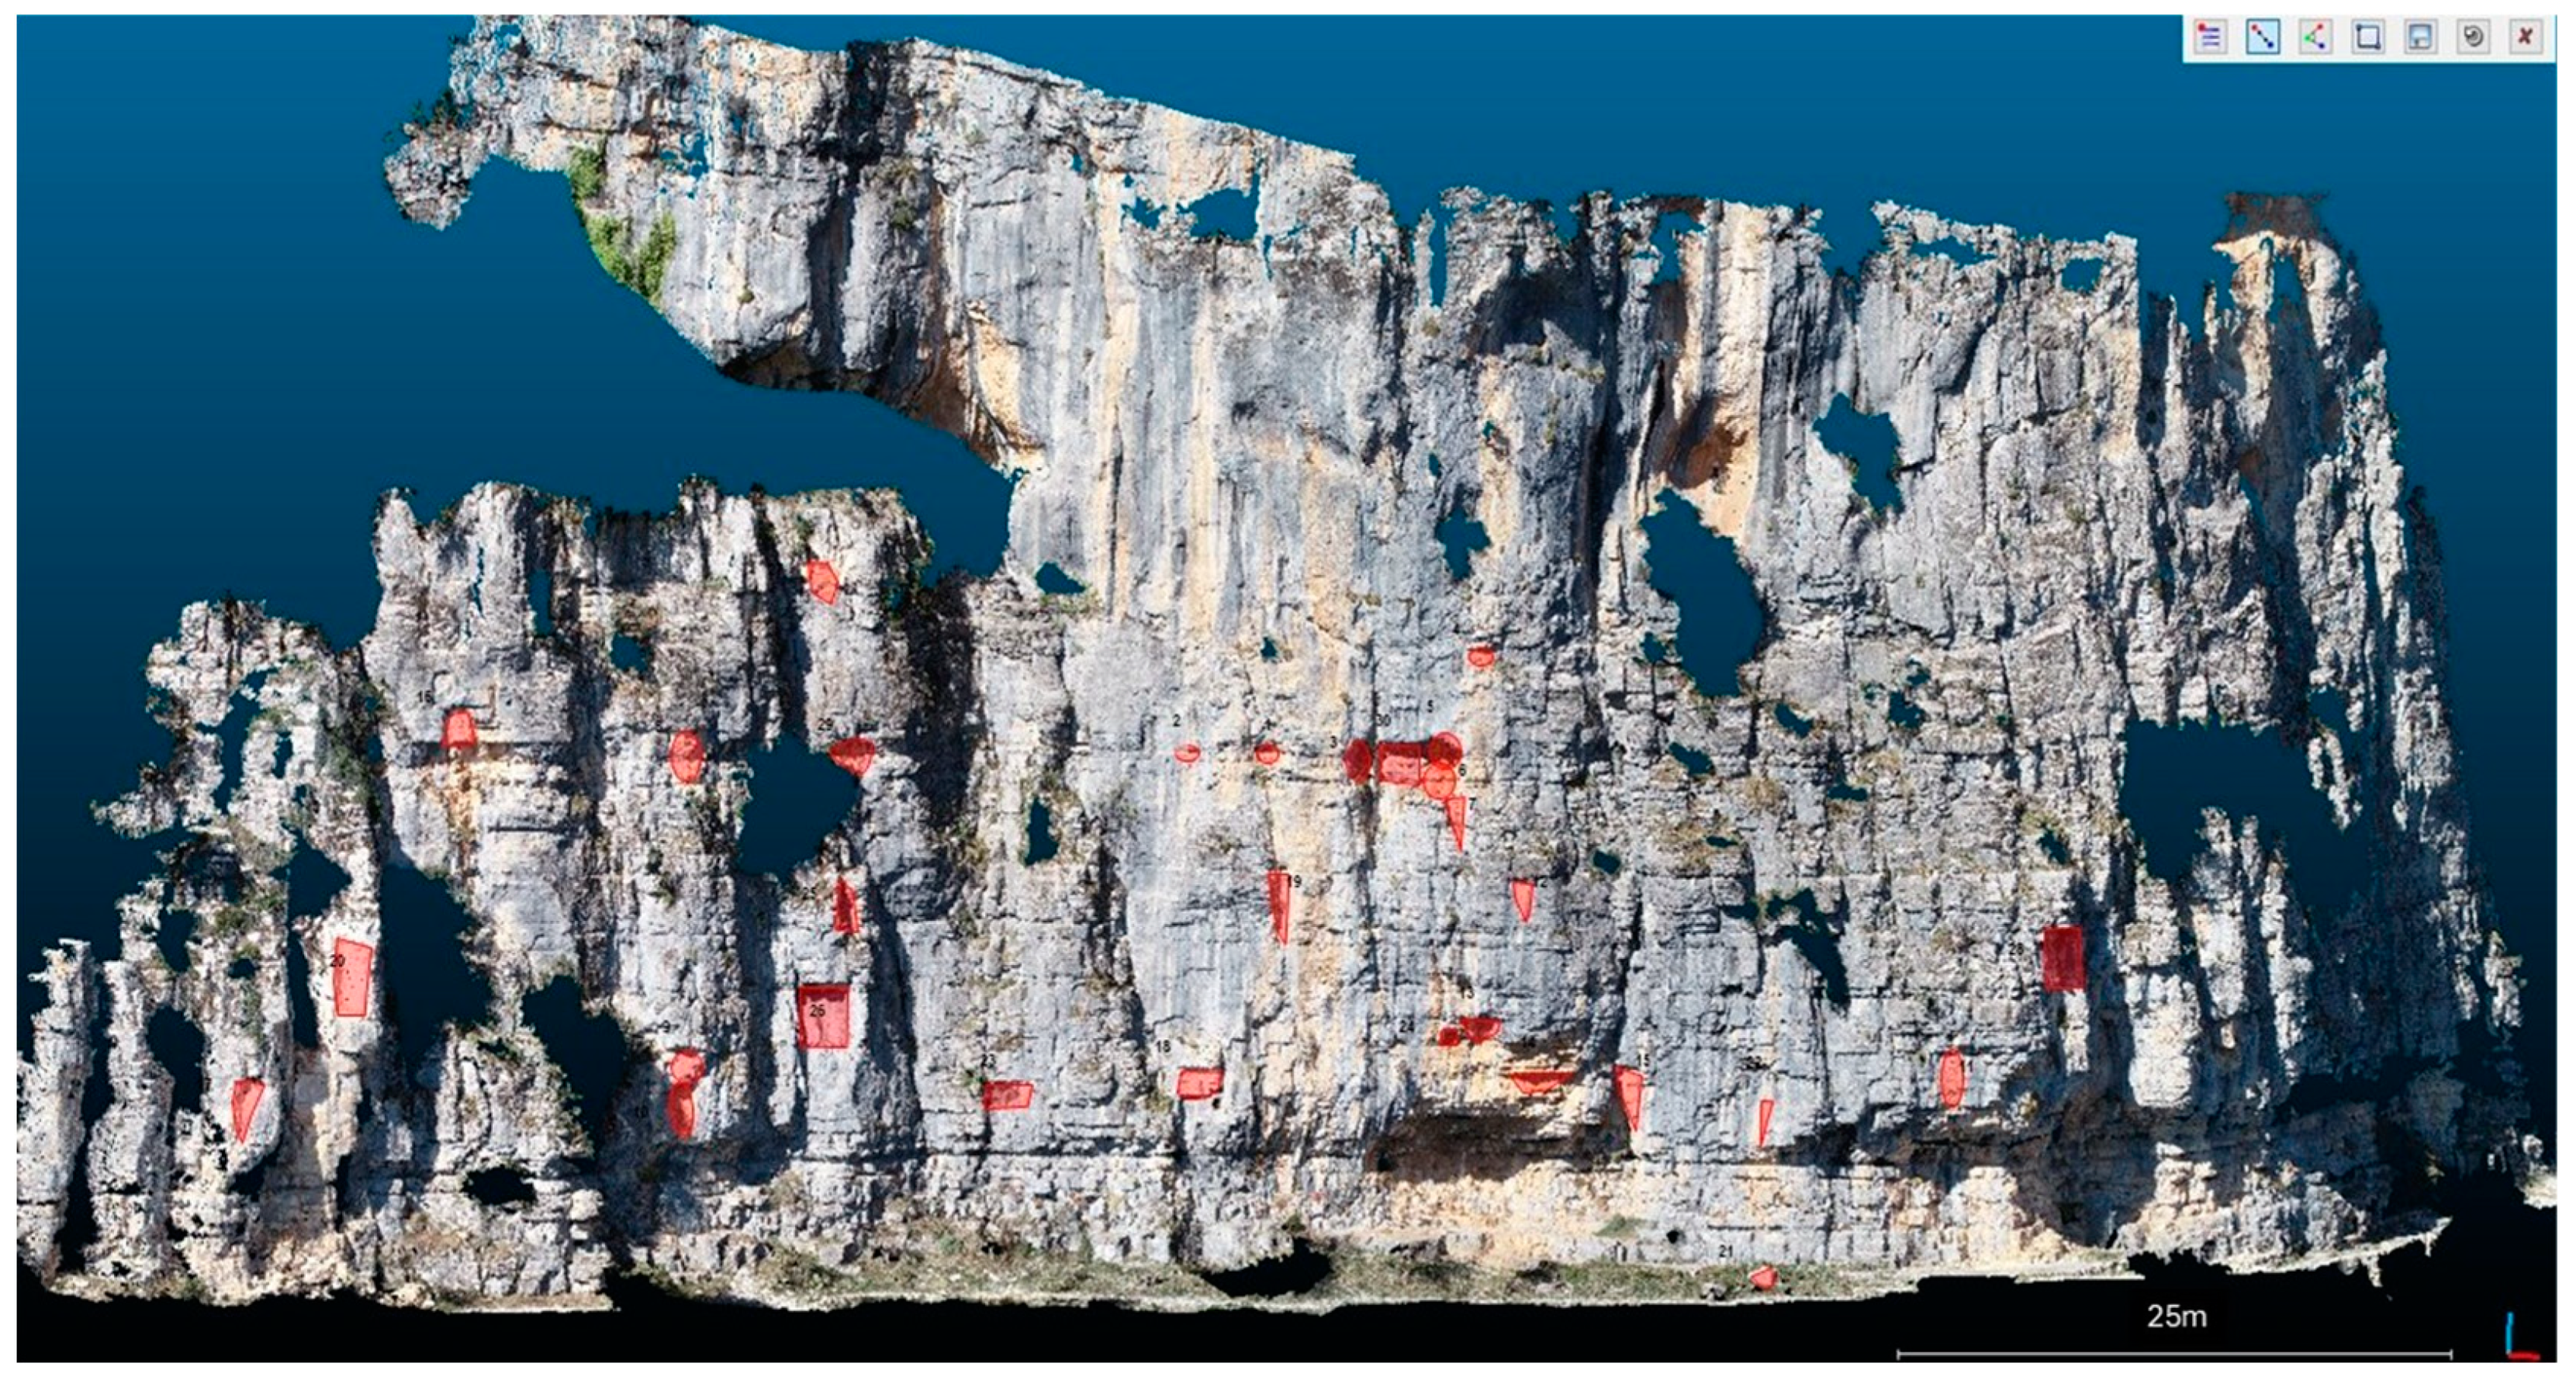
Figure 11.
Overview of the areas from where rock blocks had been detached (source areas), depicted with red color.
Figure 11.
Overview of the areas from where rock blocks had been detached (source areas), depicted with red color.
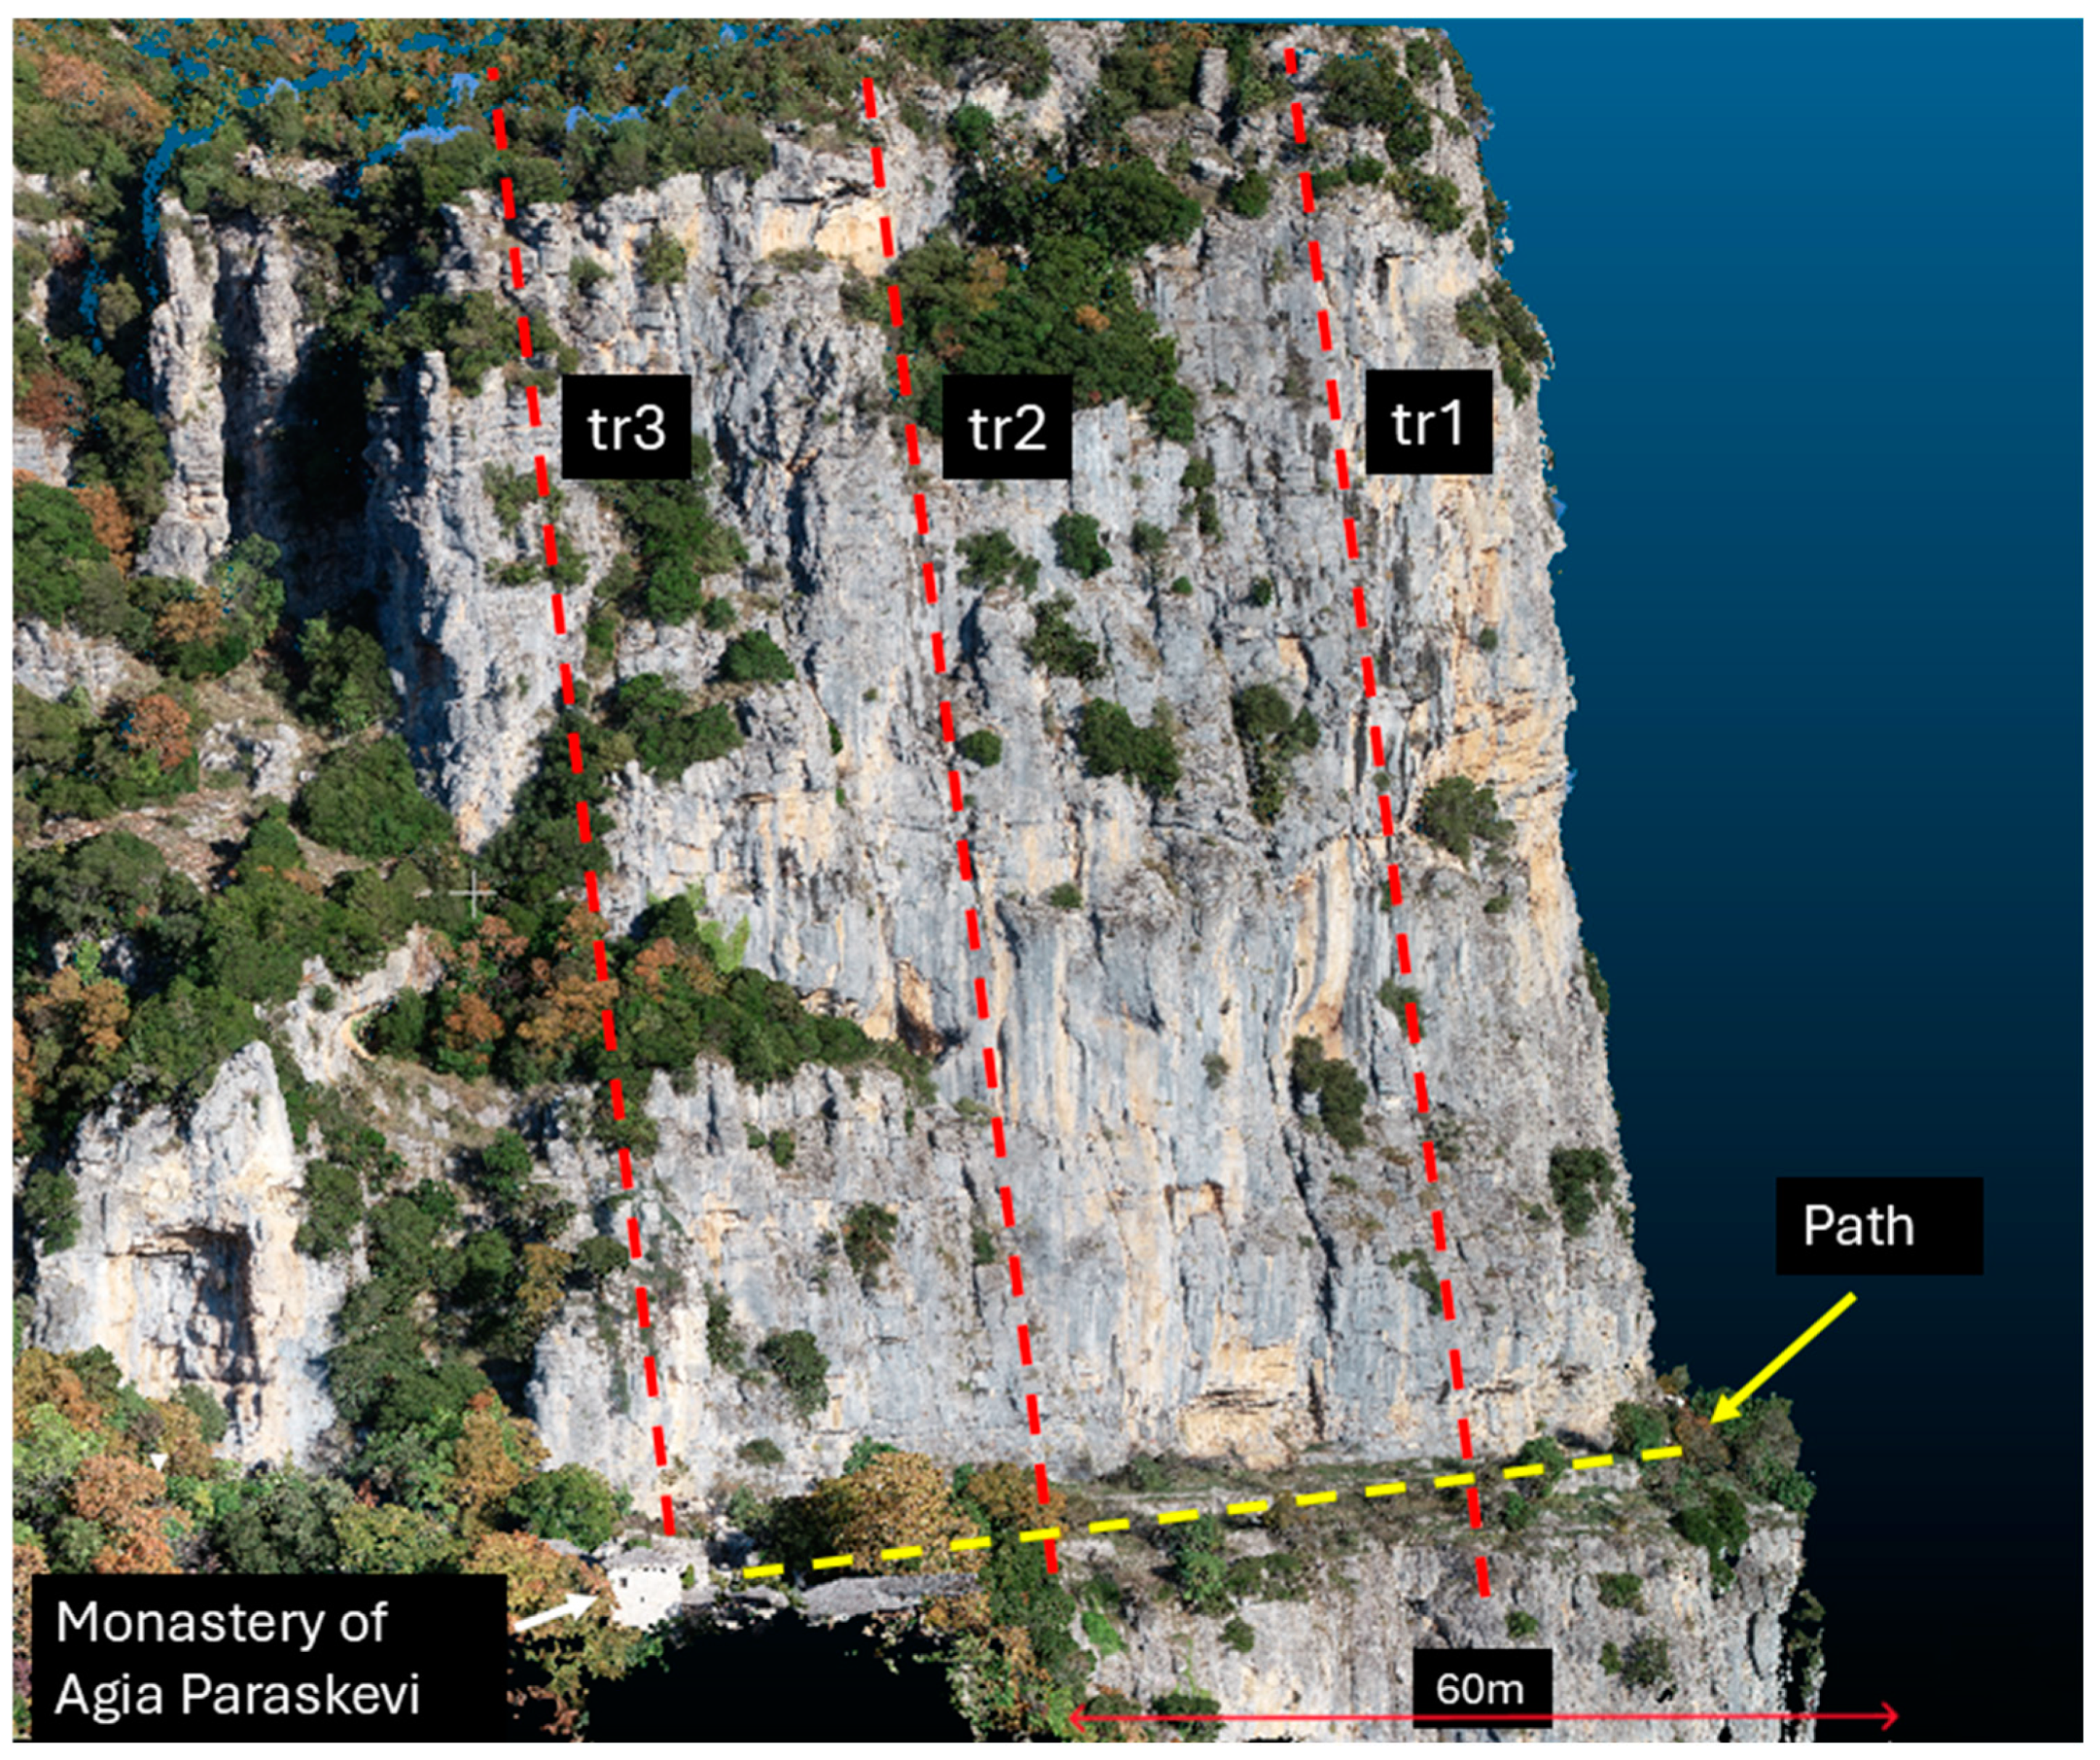
Figure 12.
Traces of the trajectories (tr1, tr2, and tr3) used to determine the parameters of the rockfall. The path is shown as yellow dashed line and trajectories as red.
Figure 12.
Traces of the trajectories (tr1, tr2, and tr3) used to determine the parameters of the rockfall. The path is shown as yellow dashed line and trajectories as red.
Figure 13.
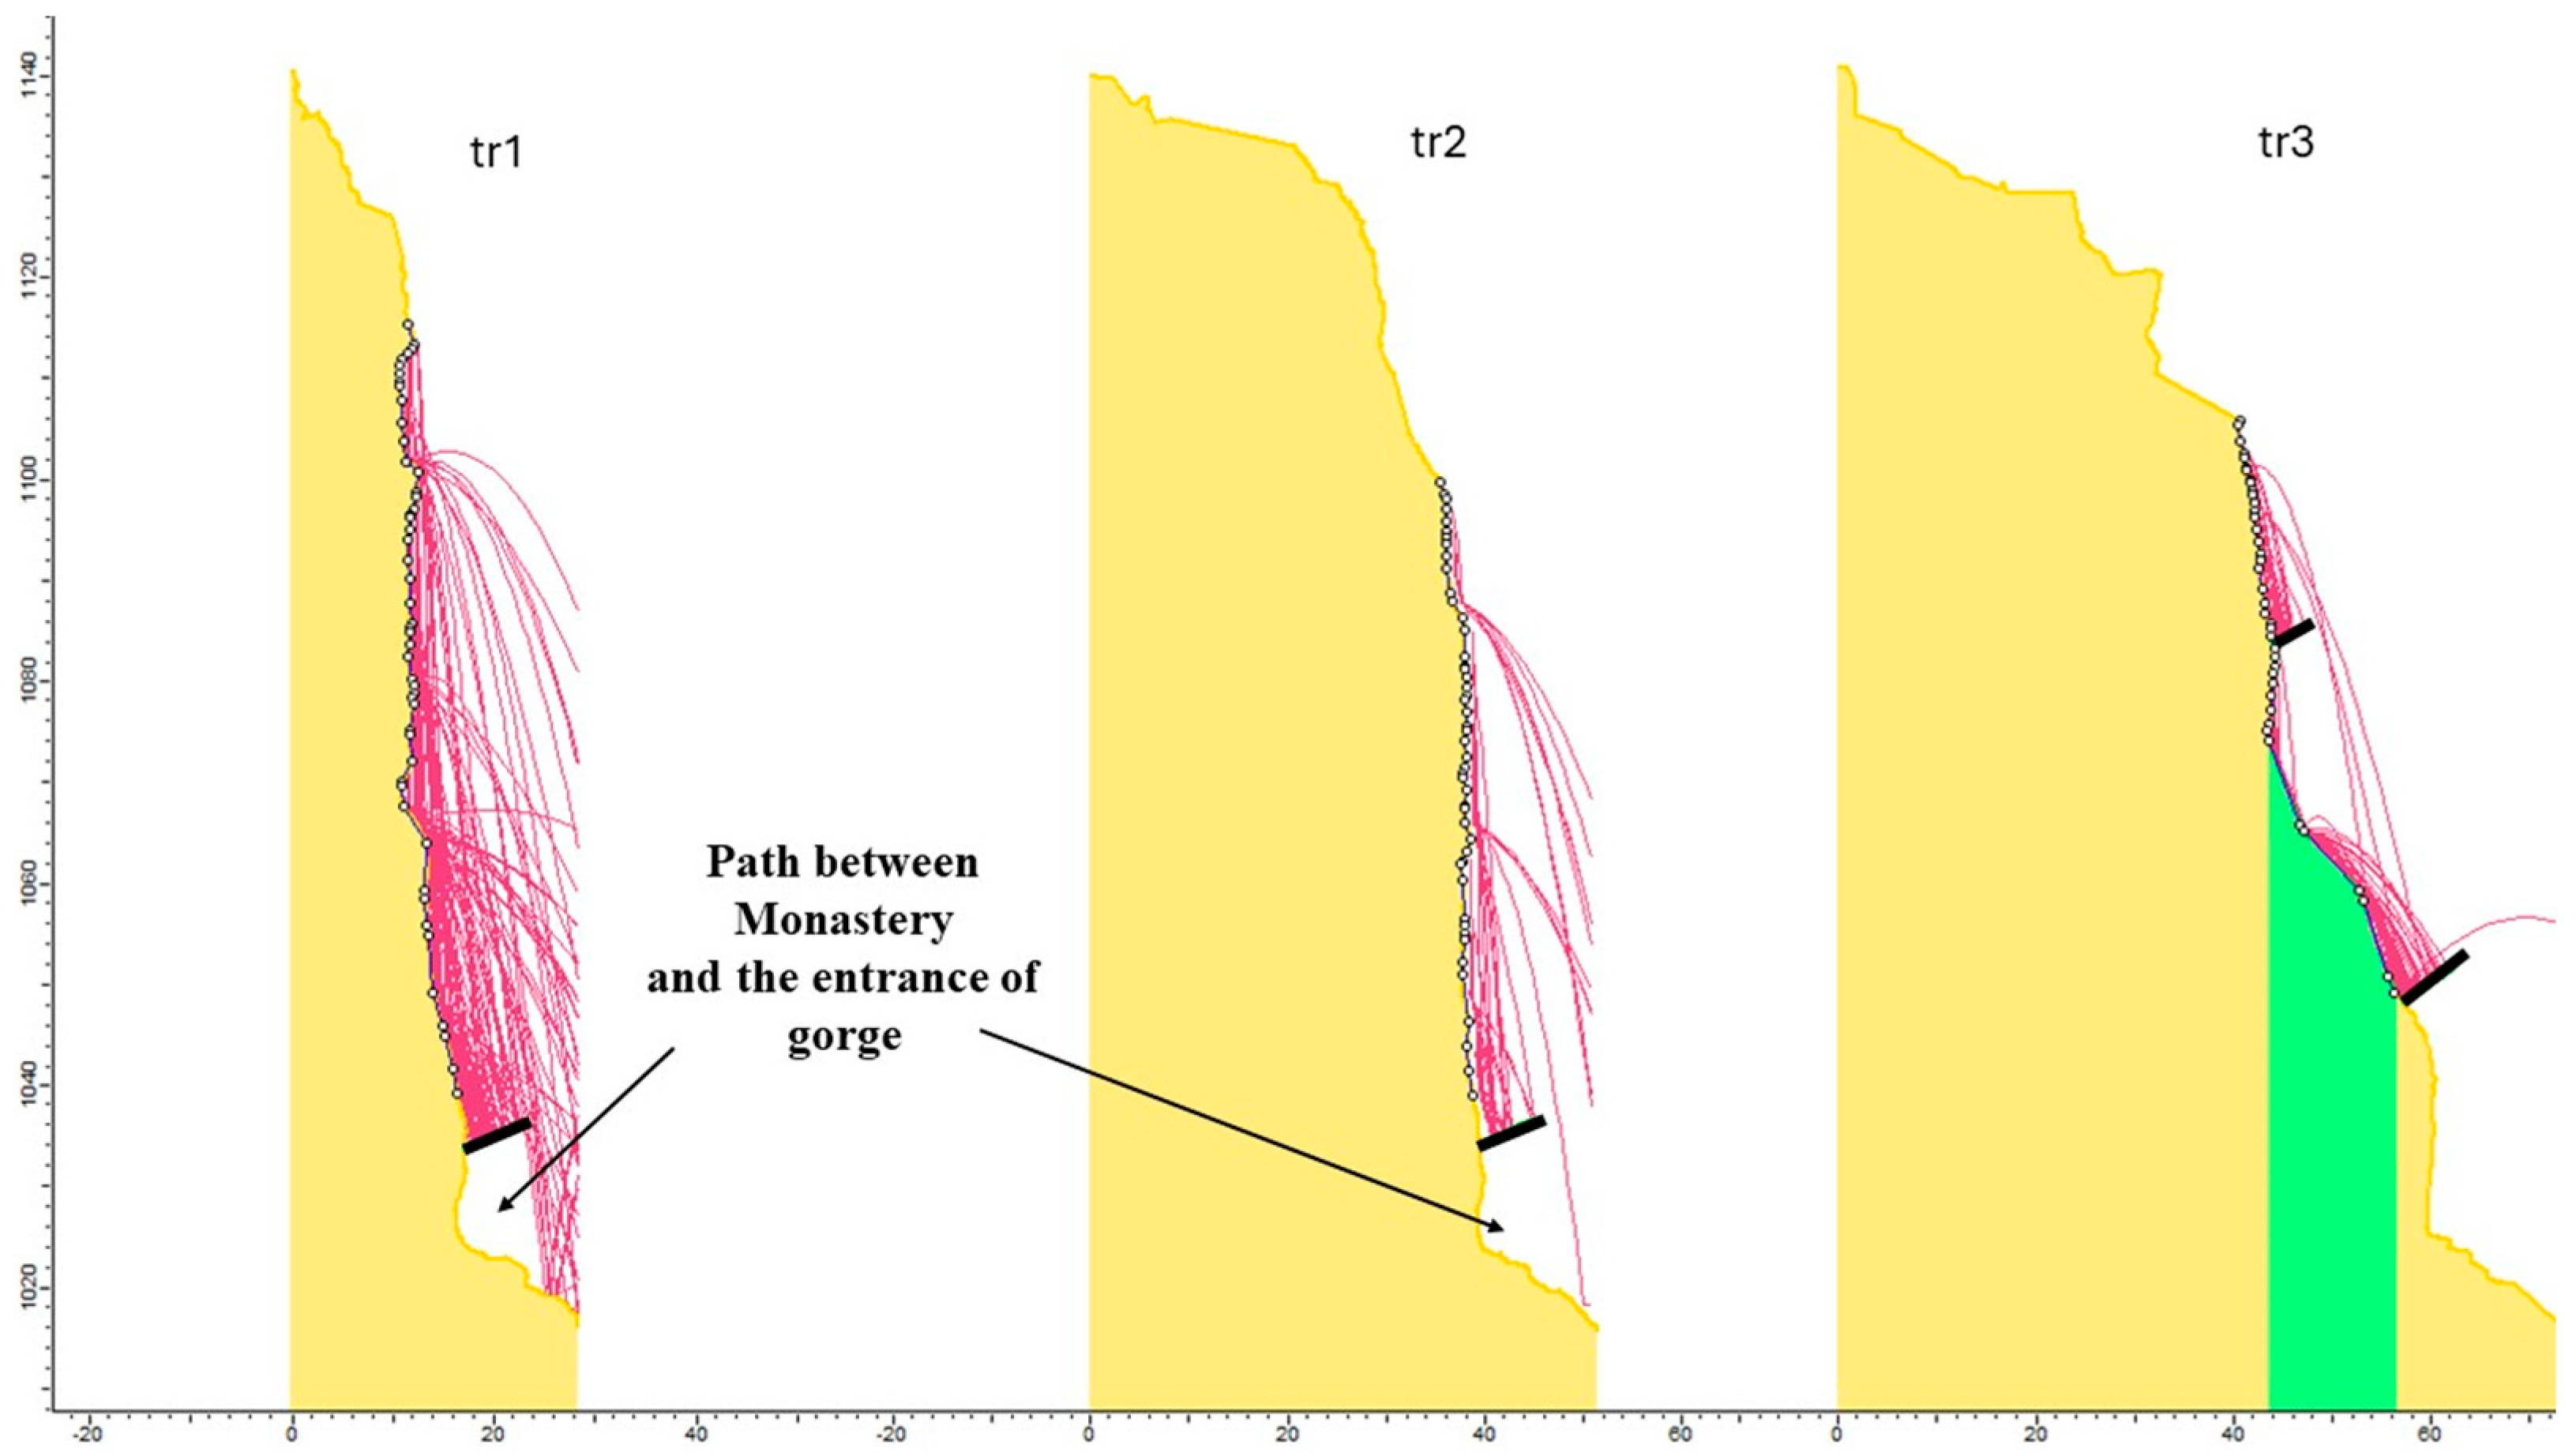
Two-dimensional rockfall trajectories, tr1, tr2, and tr3, in the area between the Monastery of Agia Paraskevi (northeast of Monodendri village) and the entrance to the Vikos Gorge. Yellow color refers to the clean hard bedrock,green color to bedrock with little soil or vegetation and red color to rockfall trajectories. The location of suggested barriers is also shown as a black-color line segment.
Figure 13.
Two-dimensional rockfall trajectories, tr1, tr2, and tr3, in the area between the Monastery of Agia Paraskevi (northeast of Monodendri village) and the entrance to the Vikos Gorge. Yellow color refers to the clean hard bedrock,green color to bedrock with little soil or vegetation and red color to rockfall trajectories. The location of suggested barriers is also shown as a black-color line segment.
Table 1.
Discontinuity sets and their characteristics in terms of dip and dip direction resulting from the field-based survey at site D.
Table 1.
Discontinuity sets and their characteristics in terms of dip and dip direction resulting from the field-based survey at site D.
| S/N | Set | Dip/Dip Direction |
|---|
| 1 | Β Bedding | 5°/160° |
| 2 | J1 Joint | 82°/068° |
| 3 | J2 Joint | 88°/154° |
Table 2.
Discontinuity sets and their characteristics in terms of dip and dip direction at site A.
Table 2.
Discontinuity sets and their characteristics in terms of dip and dip direction at site A.
| S/N | Set | Dip/Dip Direction |
|---|
| 1 | Β Bedding | 23°/144° |
| 2 | J1 Joint | 77°/081° |
| 3 | J2 Joint | 86°/150° |
Table 3.
Discontinuity sets and their characteristics in terms of dip and dip direction at site B.
Table 3.
Discontinuity sets and their characteristics in terms of dip and dip direction at site B.
| S/N | Set | Dip/Dip Direction |
|---|
| 1 | Β Bedding | 08°/162° |
| 2 | J1 Joint | 76°/088° |
| 3 | J2 Joint | 83°/141° |
Table 4.
Discontinuity sets and their characteristics in terms of dip and dip direction at Site C.
Table 4.
Discontinuity sets and their characteristics in terms of dip and dip direction at Site C.
| S/N | Set | Dip/Dip Direction |
|---|
| 1 | Β Bedding | 08°/135° |
| 2 | J1 Joint | 85°/093° |
| 3 | J2 Joint | 88°/148° |
Table 5.
Comparison of major discontinuity levels (dip/dip direction) defined by the DSE at sites A, B, and C, as well as by the geological compass at site D.
Table 5.
Comparison of major discontinuity levels (dip/dip direction) defined by the DSE at sites A, B, and C, as well as by the geological compass at site D.
| Set | Field Survey Measurements | DSE |
|---|
| | Site D | Site A | Site B | Site C |
|---|
| | Dip/Dip Direction | Dip/Dip Direction | Dip/Dip Direction | Dip/Dip Direction |
|---|
| B | 05°/160° | 23°/144° | 08°/162° | 08°/135° |
| J1 | 82°/068° | 77°/081° | 76°/088° | 85°/093° |
| J2 | 88°/154° | 86°/150° | 83°/141° | 88°/148° |
Table 6.
Volumes of fallen blocks detected on the rock slope.
Table 6.
Volumes of fallen blocks detected on the rock slope.
| S/N | Volume V (m3) | S/N | Volume V (m3) | S/N | Volume V (m3) |
|---|
| 1 | 0.42 | 11 | 0.70 | 21 | 0.28 |
| 2 | 0.07 | 12 | 0.49 | 22 | 0.10 |
| 3 | 0.95 | 13 | 2.53 | 23 | 0.59 |
| 4 | 0.44 | 14 | 0.74 | 24 | 0.16 |
| 5 | 2.77 | 15 | 0.52 | 25 | 1.37 |
| 6 | 2.33 | 16 | 0.54 | 26 | 2.89 |
| 7 | 0.66 | 17 | 1.10 | 27 | 0.50 |
| 8 | 0.88 | 18 | 0.43 | 28 | 3.33 |
| 9 | 0.59 | 19 | 2.07 | 29 | 0.98 |
| 10 | 1.17 | 20 | 3.20 | 30 | 2.51 |
Table 7.
Outcome of the trajectory simulations executed by RocFall software.
Table 7.
Outcome of the trajectory simulations executed by RocFall software.
| Trajectory | Length (m) | Block Weight (kg) | Rt | Rn | Total Kinetic Energy (kJ) |
|---|
| tr1 | 150 | 3978 | 0.99 | 0.53 | 2831 |
| tr2 | 170 | 3978 | 0.99 | 0.53 | 1850 |
| tr3 | 181 | 3978 | 0.99 | 0.53 | 1933 |
| 0.85 | 0.35 |


