Article

Experimental Investigation of Embedment Depth Effects on the Rocking Behavior of Foundations

by
Mohamadali Moradi
1,
Ali Khezri
2,
Seyed Majdeddin Mir Mohammad Hosseini
1,
Hongbae Park
3 and
Daeyong Lee
3,*
1
Department of Civil and Environmental Engineering, Amirkabir University of Technology, Tehran 159163-4311, Iran
2
Energy Innovation Research Center for Wind Turbine Support Structures, Kunsan National University, 558 Daehak-ro, Gunsan-si 54150, Jeollabuk-do, Republic of Korea
3
Department of Wind Energy, The Graduate School, Kunsan National University, 558 Daehak-ro, Gunsan-si 54150, Jeollabuk-do, Republic of Korea
*
Author to whom correspondence should be addressed.
Geosciences 2024, 14(12), 351; https://doi.org/10.3390/geosciences14120351
Submission received: 21 October 2024 / Revised: 8 December 2024 / Accepted: 12 December 2024 / Published: 18 December 2024
(This article belongs to the Special Issue Geotechnical Earthquake Engineering and Geohazard Prevention)

Abstract

:
Shallow foundations supporting high-rise structures are often subjected to extreme lateral loading from wind and seismic activities. Nonlinear soil–foundation system behaviors, such as foundation uplift or bearing capacity mobilization (i.e., rocking behavior), can act as energy dissipation mechanisms, potentially reducing structural demands. However, such merits may be achieved at the expense of large residual deformations and settlements, which are influenced by various factors. One key factor which is highly influential on soil deformation mechanisms during rocking is the foundation embedment depth. This aspect of rocking foundations is investigated in this study under varying subgrade densities and initial vertical factors of safety (FSv), using the PIV technique and appropriate instrumentation. A series of reduced-scale slow cyclic tests were performed using a single-degree-of-freedom (SDOF) structure model. This study first examines the deformation mechanisms of strip foundations with depth-to-width (D/B) ratios of 0, 0.25, and 1, and then explores the effects of embedment depth on the performance of square foundations, evaluating moment capacity, settlement, recentering capability, rotational stiffness, and damping characteristics. The results demonstrate that the predominant deformation mechanism of the soil mass transitions from a wedge mechanism in surface foundations to a scoop mechanism in embedded foundations. Increasing the embedment depth enhances recentering capabilities, reduces damping, decreases settlement, increases rotational stiffness, and improves the moment capacity of the foundations. This comprehensive exploration of foundation performance and soil deformation mechanisms, considering varying embedment depths, FSv values, and soil relative densities, offers insights for optimizing the performance of rocking foundations under lateral loading conditions.

1. Introduction

In response to the numerous high-acceleration events recorded in recent earthquakes, there has been rising interest within the engineering community in understanding the seismic response of soil–structure systems under conditions that exceed conventional design limits. While performance-based design, which incorporates the nonlinear behavior of structural elements, has been a standard practice in superstructure design for years, the application of this concept in foundation design as a viable seismic retrofitting practice is commonly neglected [1]. In this regard, innovative non-structural methods have been developed to control seismic responses, among which the rocking isolation design philosophy is becoming increasingly recognized as a promising concept in mitigating seismic forces on structures.
Previous observations have shown that the soil–foundation system can offer significant potential in seismic force control and energy dissipation through geometric nonlinearity (i.e., foundation uplift and sliding) and material nonlinearity (i.e., bearing capacity mobilization). Examples of high-rise structures supported by shallow foundations are abundant, with rocking and uplift effects extensively studied across various types, including bridges [2,3,4], buildings [5,6,7,8,9,10,11,12], and wind turbine towers [13,14,15].
As for bridge foundations, Deng et al. [3] introduced a direct displacement-based design approach for the seismic design of rocking shallow foundations subjected to earthquake loading. Their method incorporates a multilinear model to represent the nonlinear moment–rotation behavior, along with a new empirical relationship that connects initial rotational stiffness with moment capacity. Antonellis et al. [4] conducted large-scale shake table tests on bridge columns supported by two shallow foundations—one with aligned loading and the other skewed. Their findings showed that for peak drift ratios up to 6.9%, the rocking foundations performed well, with residual drift ratios of 0.5 to 0.9%, depending on backfill conditions, minimal settlement, and no structural damage.
In the context of building foundations, Gelagoti et al. [10] compared conventional and rocking isolation designs through the numerical analysis of a one-bay, two-story reinforced concrete frame. They found that while both systems performed well under moderate seismic shaking, the rocking-isolated system was superior during very strong shaking, surviving with no column damage and non-negligible, repairable damage to beams and non-structural elements. Liu et al. [11] and Liu [12] investigated the performance of two-story-one-bay buildings in a series of centrifuge tests. They indicated that a balanced design, where the rocking foundation and structural fuse are intended to yield at approximately the same load, results in a well-controlled seismic-resisting system with much lower seismic ductility demands on structural components. Conversely, if the footing is restrained from rocking, the ductility demand on structural components is significantly higher than if the foundation were allowed to rock.
Ajaei and El Naggar [13] explored using the rocking foundation concept to adapt shallow wind turbine foundations for higher-capacity turbines. They found that relaxing the no-uplift regulation during normal operations allows the installation of larger turbines on foundations initially designed for smaller ones, without compromising safety or serviceability. Ifeobu et al. [14] investigated the long-term laterally cyclic behavior of onshore wind turbine foundations using Particle Image Velocimetry (PIV) through a series of centrifuge tests. They indicated that accumulated settlement and rotation can potentially reach the serviceability limit state (SLS) design limit outlined by current design guidelines. Wang and Ishihara [15] compared two Winkler models to assess the impact of foundation uplift on wind turbine seismic loads. One model simulated foundation uplift, while the other did not. Their findings showed that including foundation uplift reduced the tower base moment but increased the bending moment in the foundation cross-section. In this context, common wind turbine support structure codes and guidelines address the potential for foundation uplift under specific loading conditions. DNVGL-ST-0126 [16] requires that the foundation withstand repeated gapping cycles without negative effects, ensuring the stress state at the interface maintains soil plane shape stability beneath the foundation throughout its operational lifespan. DNV allows gapping up to the center of gravity of the foundation in some load cases. Meanwhile, IEC 61400-6 [17] recommends a zero-gapping criterion to keep the foundation in full contact with the soil in certain load cases, preventing soil capacity or stiffness degradation, but does allow gapping under specific conditions if certain requirements are met.
Primary challenges in adopting the rocking isolation design philosophy include potential excessive rotation and settlement of the foundation, risk of structure overturning, and uncertainty in soil properties, which collectively limit its widespread use [18]. Excessive deformation is a key concern, for which soil improvement techniques like shallow compaction [1,19,20,21,22,23,24], geotextile reinforcement [20,25], unattached piles [26,27,28], and soil–cement grids [29] have been studied. Moreover, due to the kinematic and cyclic nature of earthquake loading, failures within the soil–foundation system and structural overturning are relatively rare. Finally, foundations with higher safety factors exhibit less sensitivity to subgrade characteristics, reducing concerns related to uncertainties in soil parameters. While most studies on rocking foundations focus on surface foundations, embedded foundations are more commonly used in practice for several reasons, including the weakness of surface soil layers, the need for greater bearing capacity, protection against scour, and avoiding interference at ground level. As a result, embedded foundations provide a more realistic representation of a rocking system’s behavior, influencing key performance aspects such as moment capacity and settlement.
Prior studies have shown that the performance of embedded rocking foundations is considerably different from that of surface foundations. Ko et al. [30] found that side soil resistance in embedded foundations increases moment capacity, while Hakhamaneshi and Kutter [31] noted that the uplift mechanism increases and settlement decreases with embedment. Sharma and Deng [32] considered embedment depth as a part of their investigation in a series of field tests on cohesive soils. They observed that significant sliding in surface foundations was effectively mitigated by embedment, with embedded footings displaying increased uplift and reduced permanent settlement. Mousavi et al. (2022) [33] investigated the rocking performance of embedded foundations using experimental testing and numerical modeling. They reported a reduction in the rotation and settlement of the foundation when subjected to rocking motions.
A deeper understanding of the factors influencing the performance of rocking foundations and their associated soil deformation mechanisms is essential for their reliable and broader application. Foundation embedment depth plays a crucial role in rocking behavior, yet research in this area remains limited [34]. Notably, previous studies have not comprehensively characterized the soil–foundation behavior of embedded foundations in terms of key performance metrics alongside soil deformation mechanisms under varying loading and soil conditions. This gap highlights the need for a more focused and detailed investigation. This study aims to address this gap by investigating the effect of embedment depth on the rocking performance of shallow foundations under different subgrade relative densities and initial vertical factors of safety through a series of 1 g, slow cyclic loading experiments. First, a strip foundation with a PIV setup is used to examine the soil deformation mechanisms of rocking foundations with various embedment depths. Following this, a square foundation is tested to evaluate the embedment effects in terms of foundation moment capacity, damping ratio, settlement response, rotational stiffness, and recentering capability.

2. Physical Model Configuration and Test Program

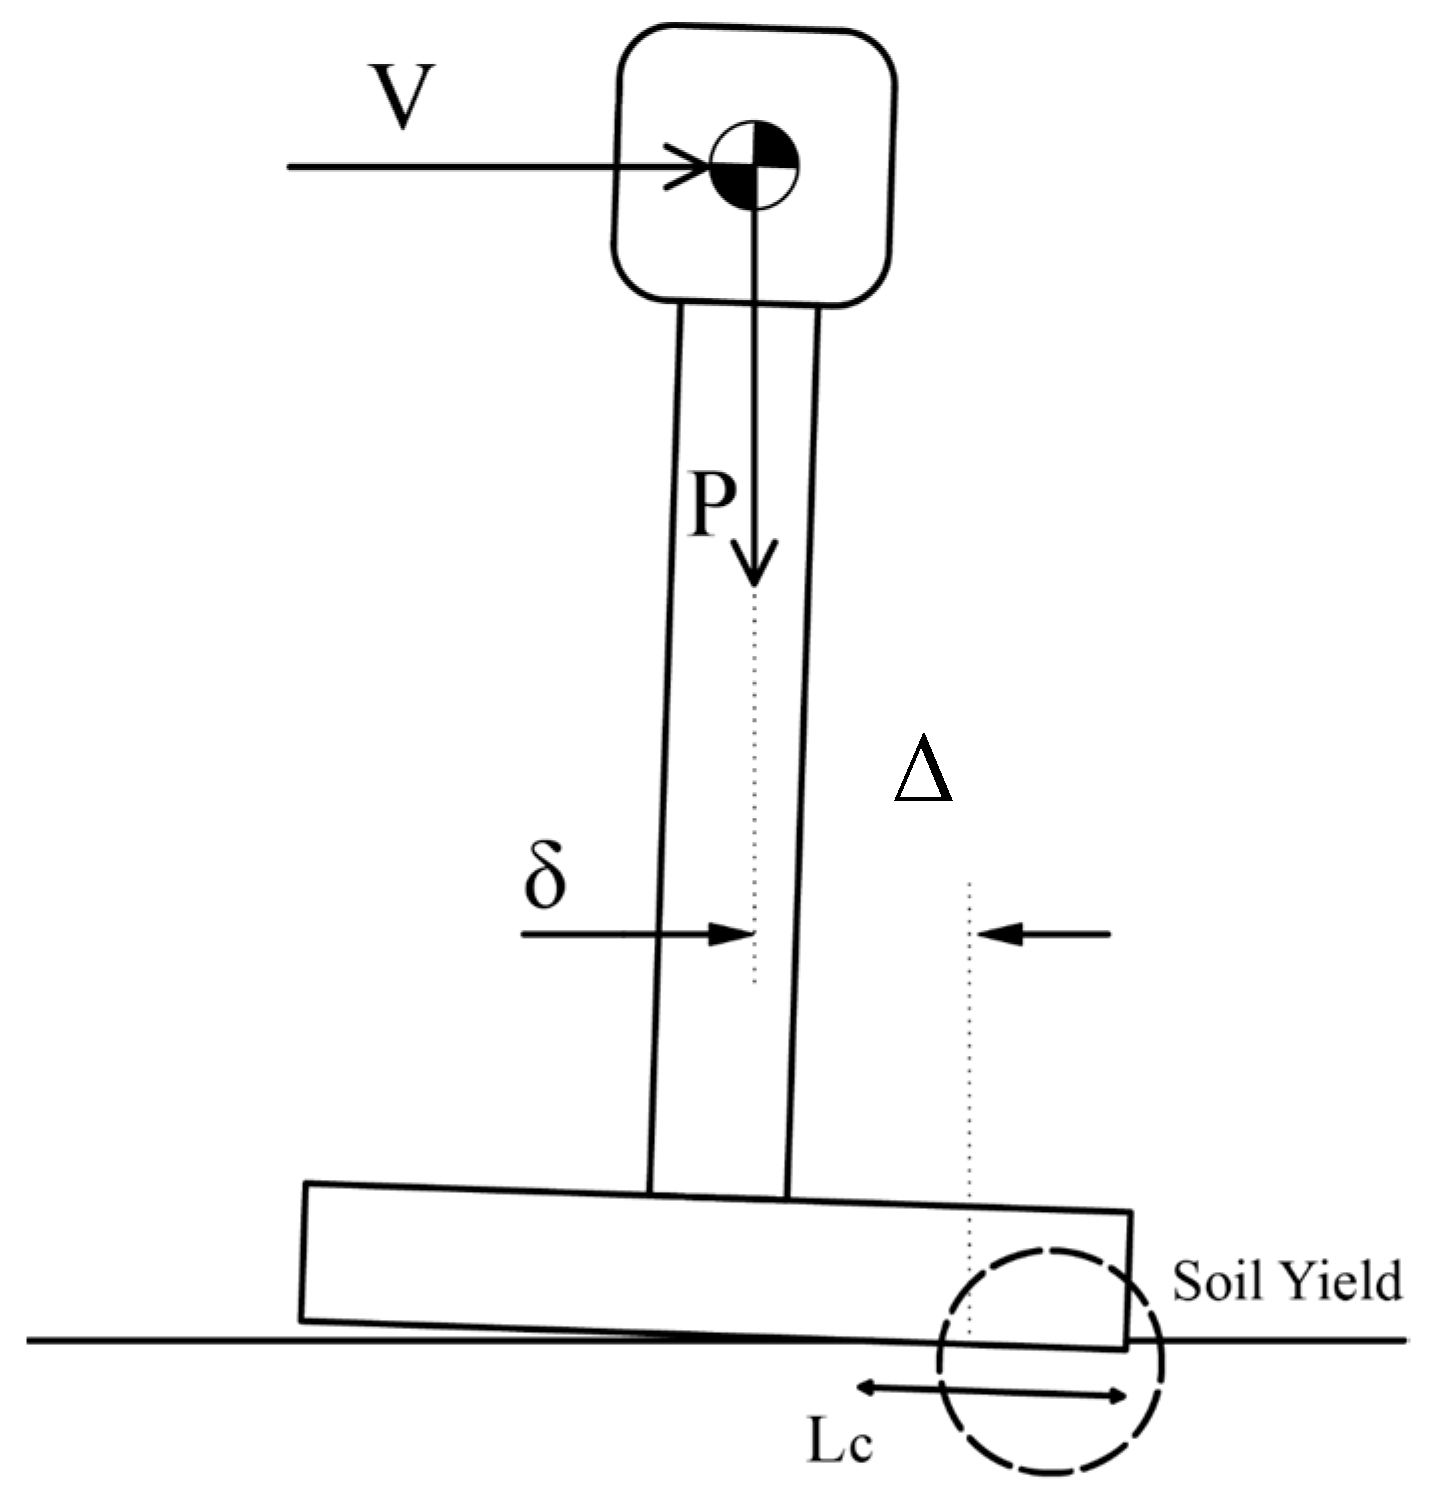
This study explores the rocking behavior of a rigid single-degree-of-freedom (SDOF) structure placed on dry sand under slow cyclic lateral loading. This section details the components of the physical model, reviews the test preparation process, describes the loading procedure, and presents the test program.

2.1. Subgrade Properties and Preparation Procedure

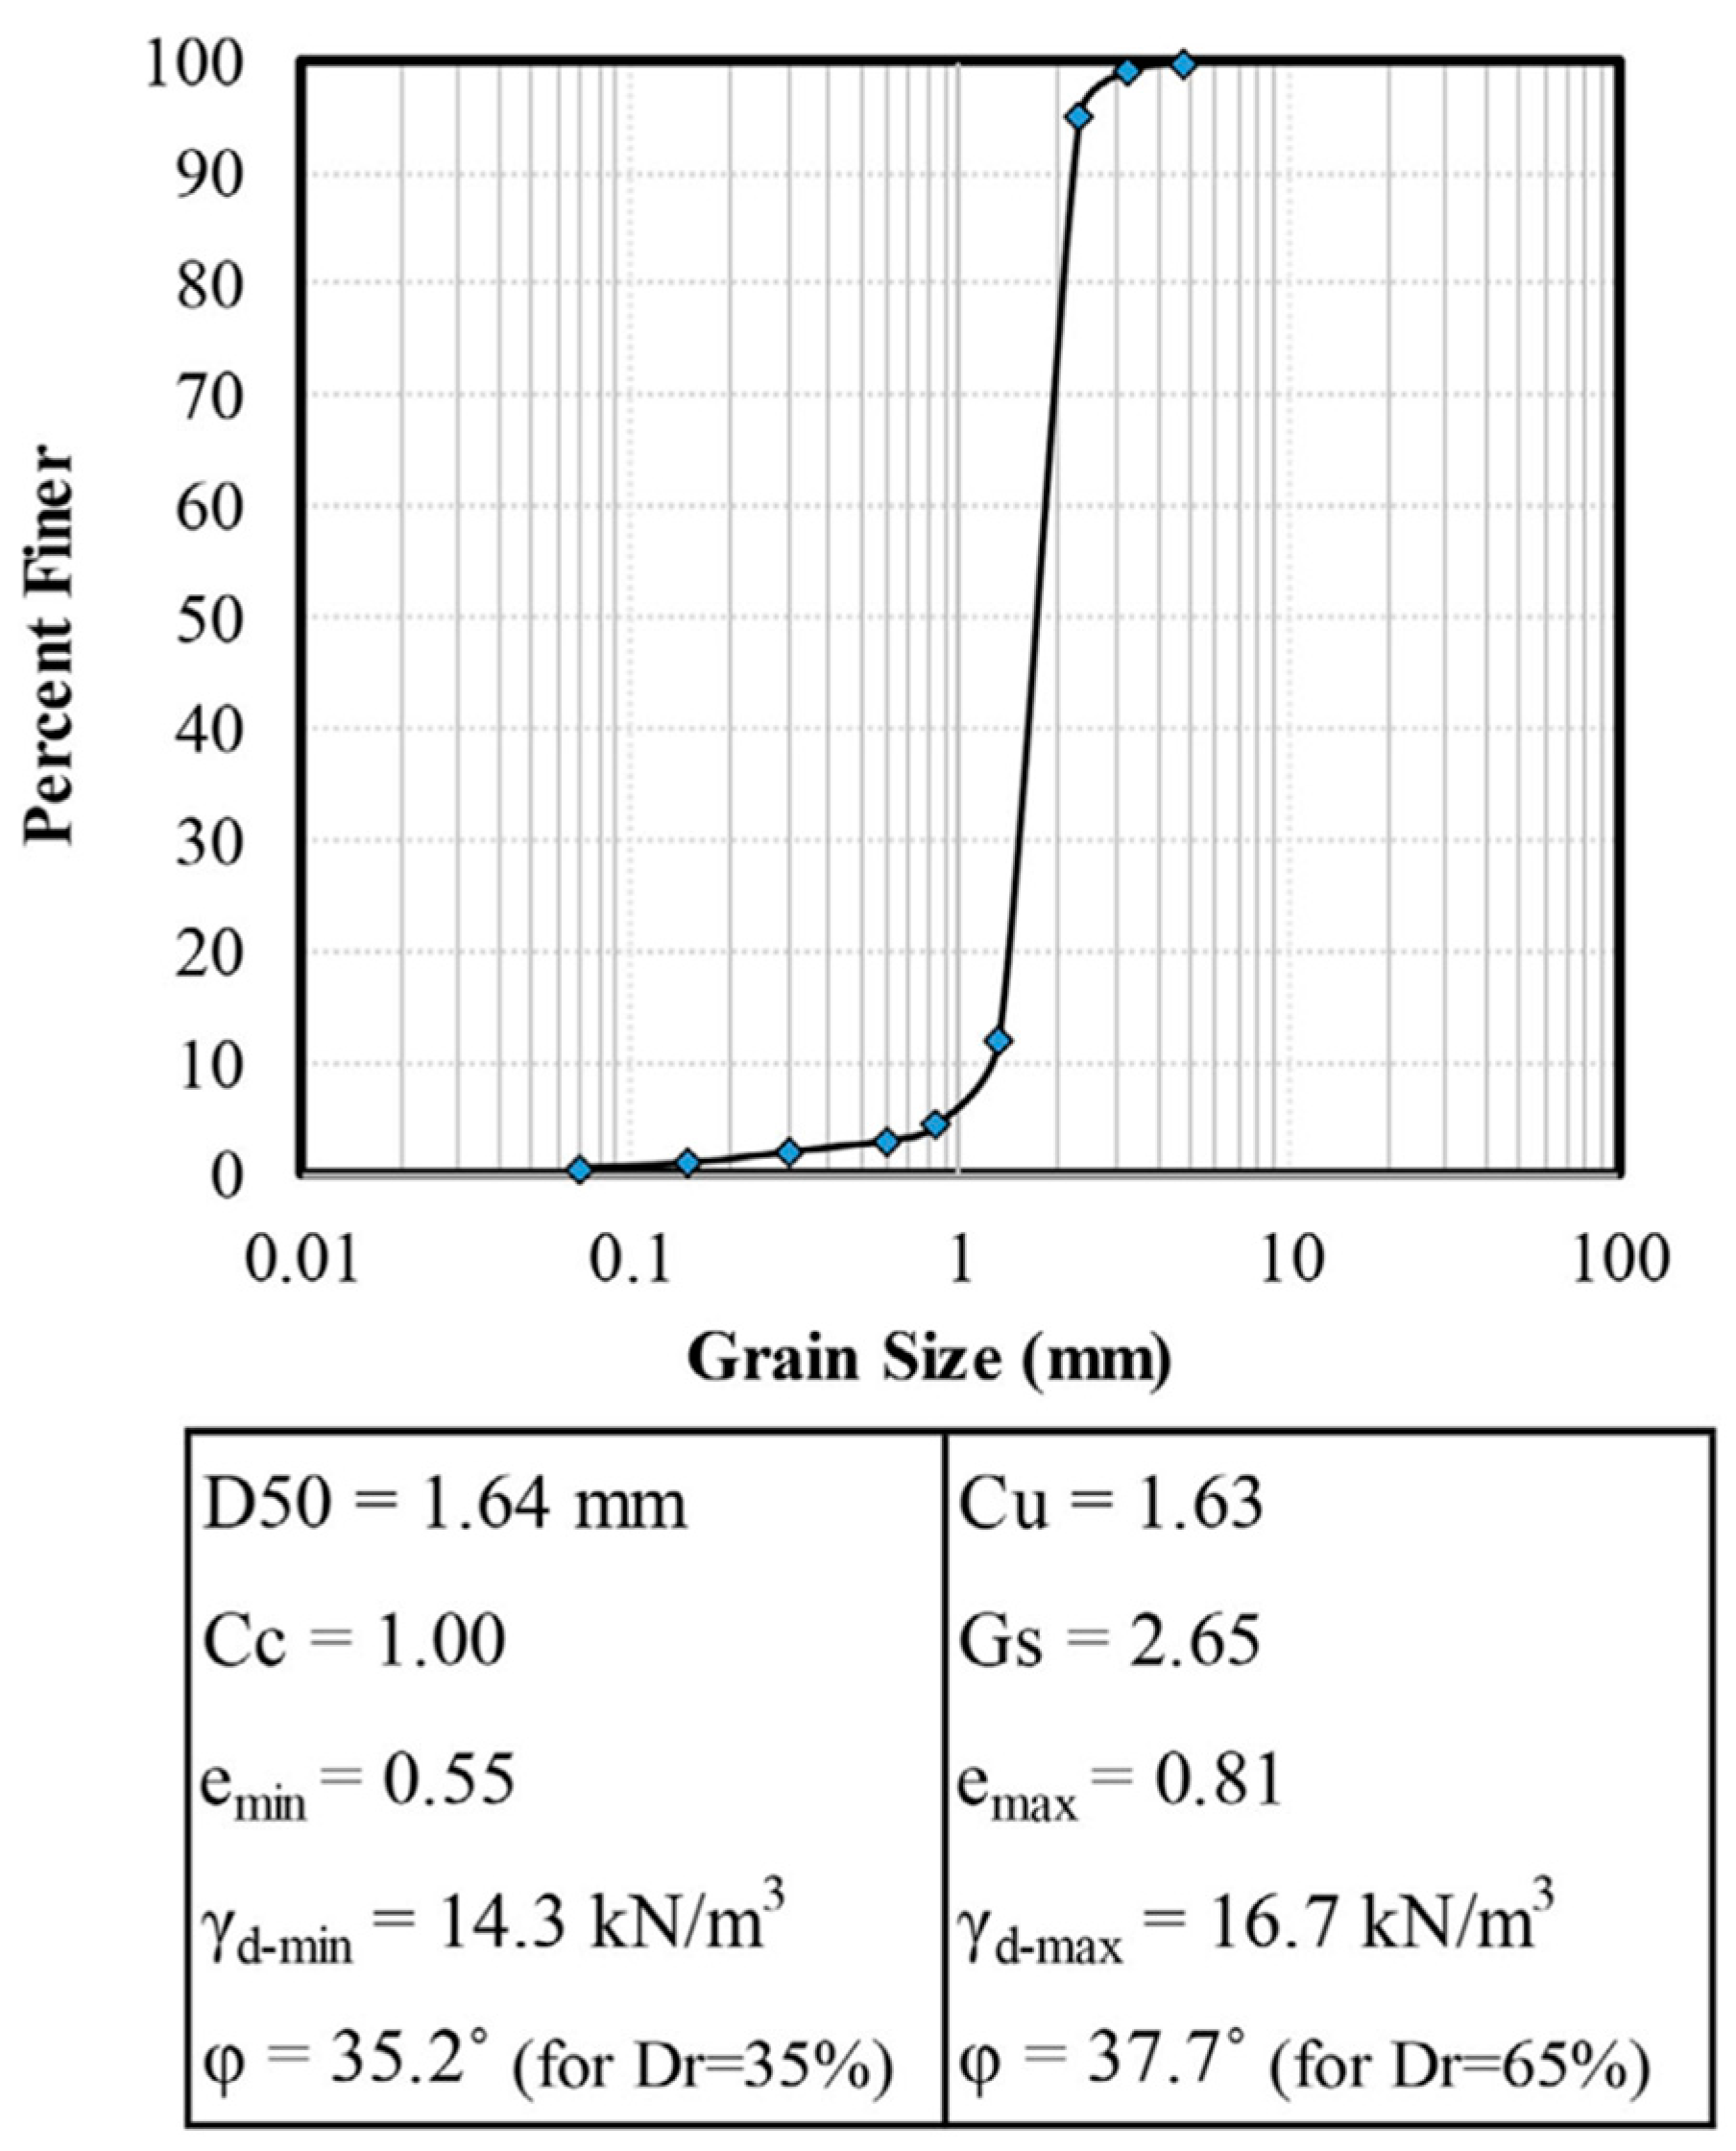
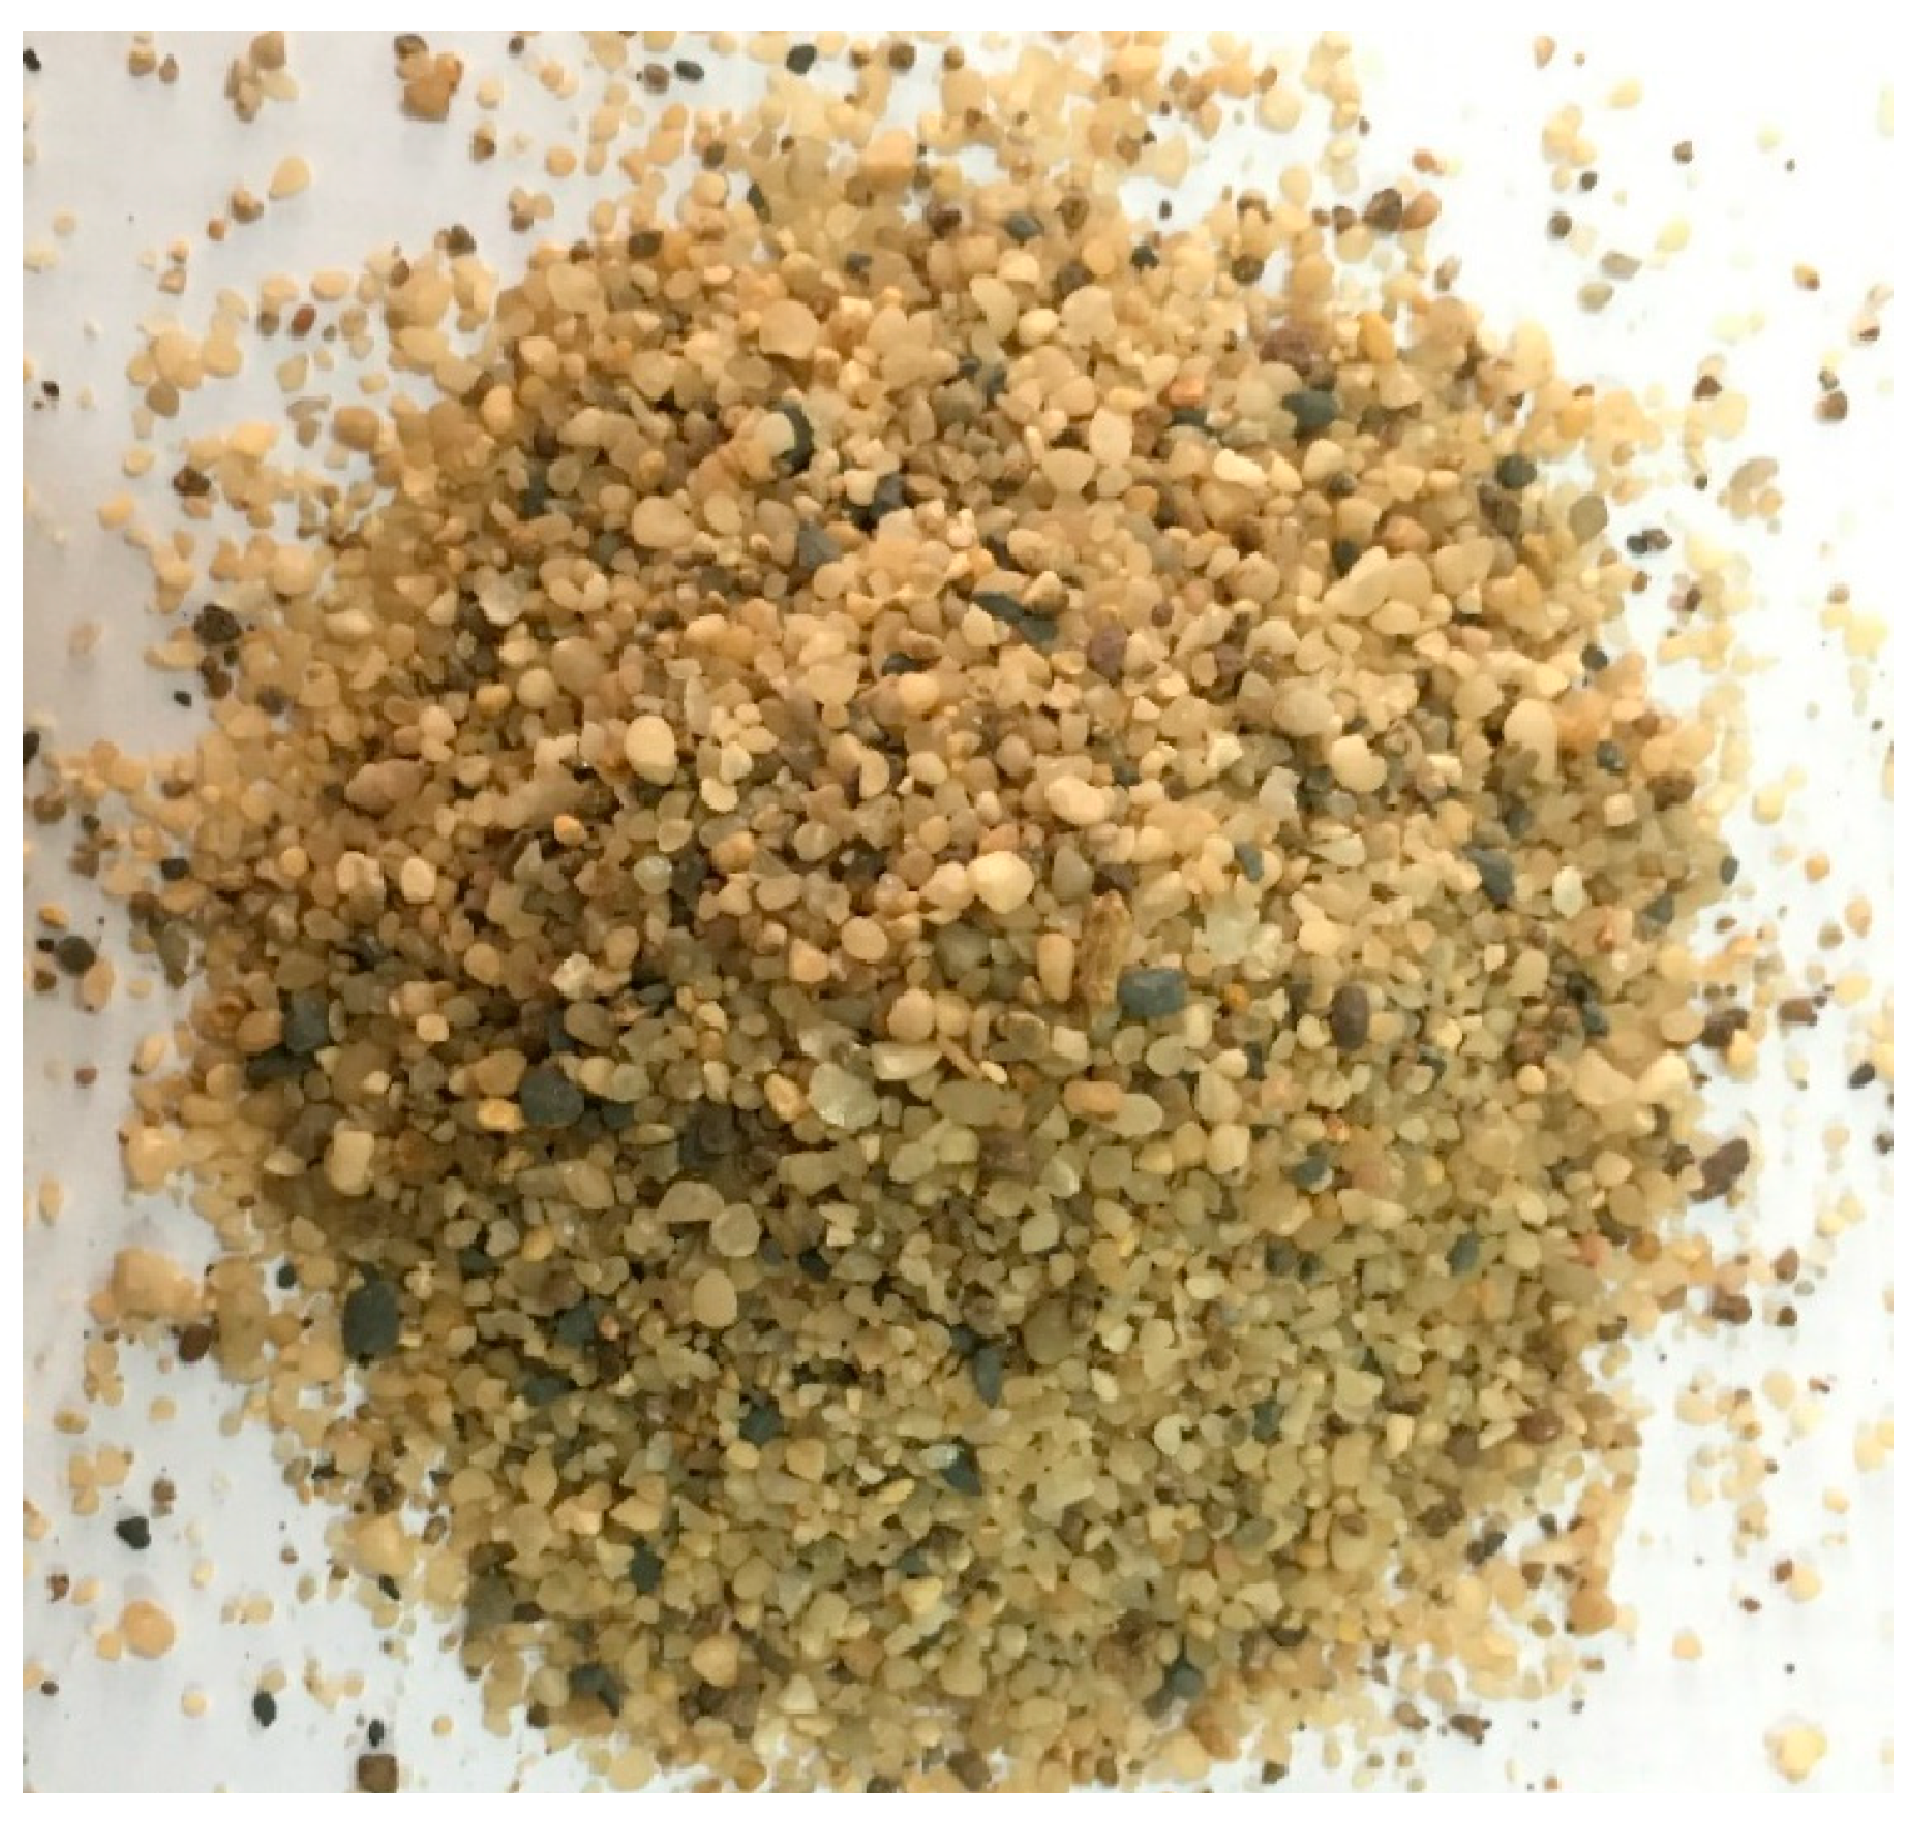
Firouzkouh dry silica sand (code D1) was used to prepare the subgrade with the desired density, employing the sand raining technique. Figure 1 shows the grain size distribution and key characteristics of the sand. Minimum and maximum void ratios (emin and emax) were determined as per ASTM D-4253 and ASTM D-4254 [35,36]. The raining height and rate were adjusted to meet the target density, with the hopper covering the entire soil tank surface to ensure uniform density. Relative densities of 35% and 65% were targeted for loose and dense subgrades, corresponding to dry unit weights of 15.4 and 16.1 kN/m3, achieved with raining heights of 10 cm and 60 cm, respectively. Uniformity was verified by measuring the density at multiple locations within the tank. This was undertaken by collecting sand in containers of known volume during the raining process and then weighing them. Table 1 shows the relative density data for three points, confirming the sand raining system produced uniform density throughout the tank. The tank dimensions are sufficiently large to eliminate any boundary effects during modeling. Specifically, for the square foundation, the tank length exceeds 8 times the foundation width in the loading direction and 5 times the width perpendicular to the loading direction. Additionally, the tank depth extends to 5 times the foundation width.

2.2. Physical Model

A soil tank with rigid walls, measuring 126 × 80 × 75 cm (length × width × height), was used to model the foundation subgrade. The structure, modeled as a single-degree-of-freedom (SDOF) system, includes a footing, a column, and a concentrated mass. These components are rigidly connected to ensure deformations occur only within the soil–foundation system. Steel plates, positioned 45 cm above the foundation base on either side of the column, provide the concentrated mass. The footings, designed in square and strip shapes, are fabricated using steel plates with a thickness of 2 cm. The column, a steel box profile 8 cm wide and 2 mm thick, is designed to behave rigidly for the loading range considered. To replicate concrete-to-subgrade friction, an abrasive sheet (sandpaper) was attached to the footing base. Direct shear tests showed friction angles between the sand and abrasive sheet of 33.6° and 35.3° for soil relative densities of 35% and 65%, respectively.
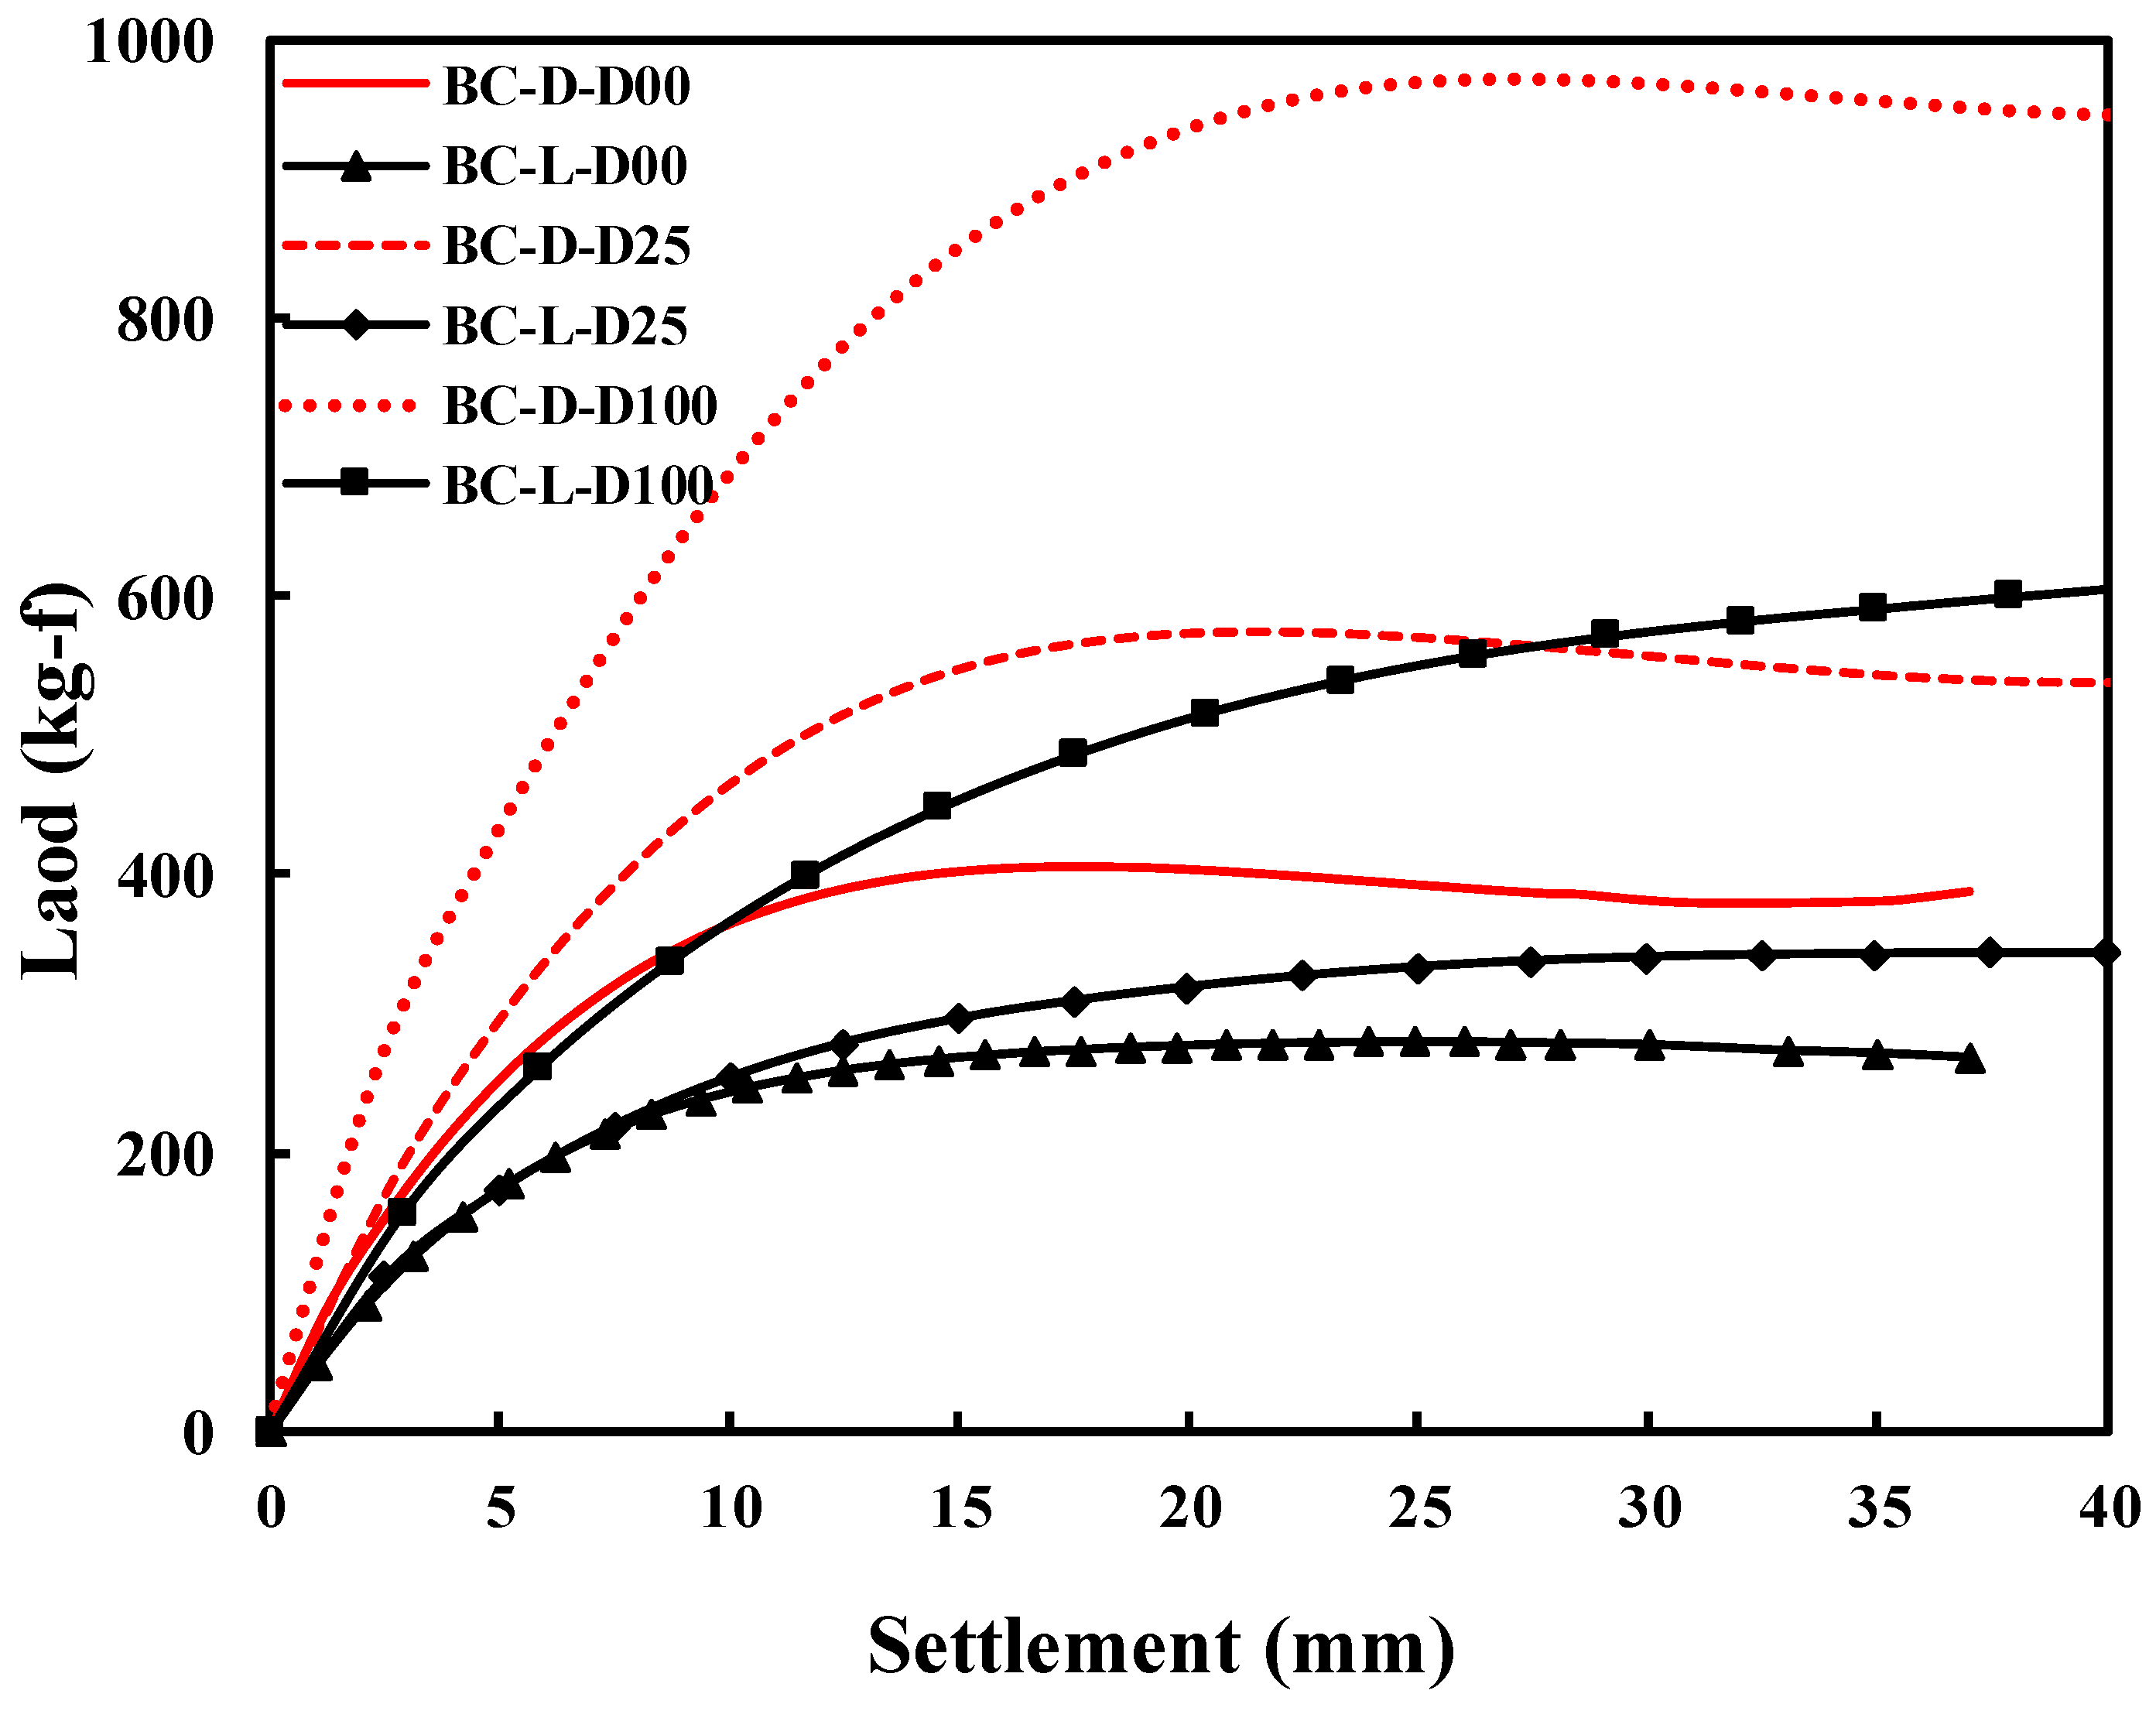
The initial vertical factor of safety (FSv) of the foundations was calculated by dividing the ultimate vertical bearing capacity of the foundation by the structure’s weight. The ultimate bearing capacity of the square foundation was determined using vertical bearing capacity tests with the vertical loading system, while the strip foundation’s capacity was obtained using the conventional bearing capacity equation and the back-calculated Nq from the square foundation bearing capacity tests. A pneumatic vertical loading system was used to conduct the bearing capacity tests, consisting of a pneumatic jack, load cell, loading shaft, and linear variable differential transformer (LVDT). The ultimate bearing capacity is defined as the load at which the load–settlement curve reaches its peak, or, if no peak is observed, the load at which the rate of change in vertical stiffness becomes constant [1,19,30]. The corresponding values at these points and complete details of the tests are provided in Table 2, while the bearing capacity test curves are shown in Figure 2. The test naming convention in Table 2 has three parts: “BC” for bearing capacity tests (constant in all related tests), “D” denotes a dense bed (Dr = 65%), “L” indicates a loose bed (Dr = 35%), and the third part indicates foundation embedment depth in millimeters.
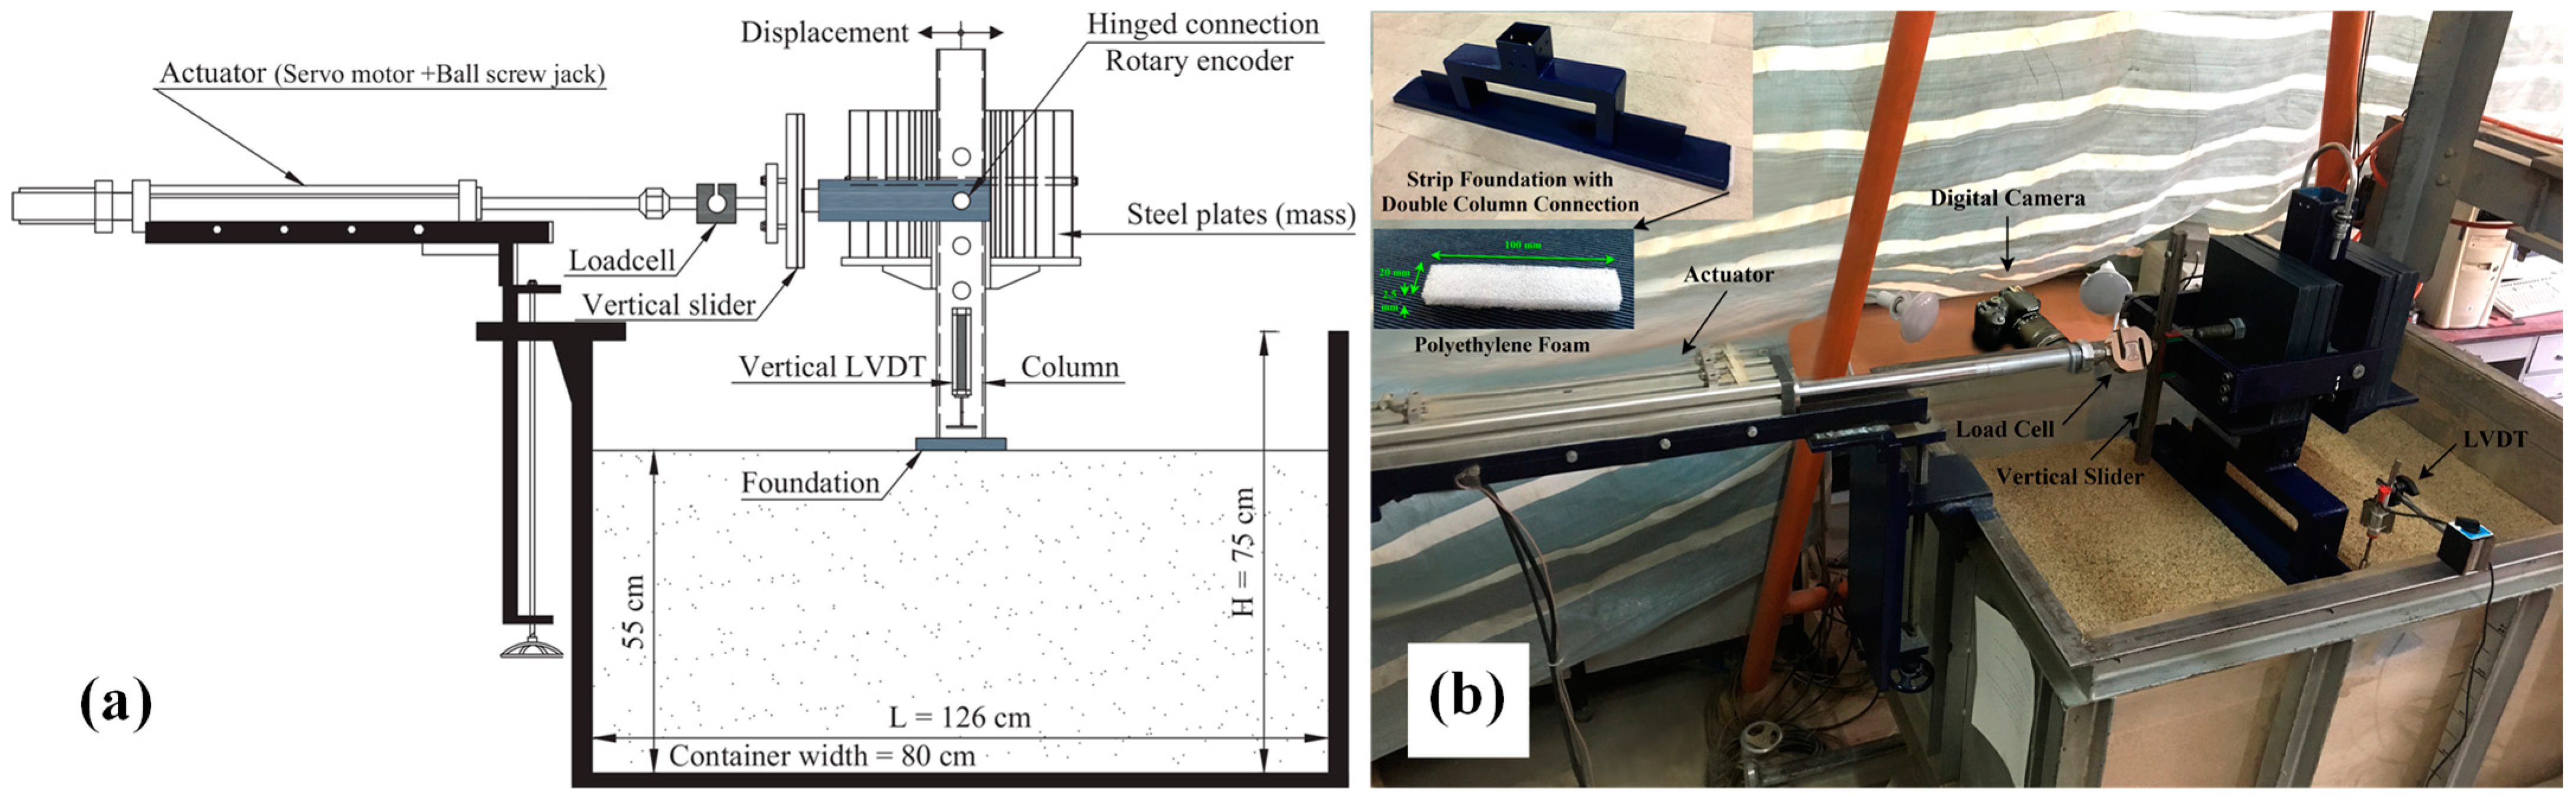
Figure 3a,b show the horizontal loading system and structural model. The center of mass of the structure is displaced horizontally by a displacement control actuator attached to the tank wall. As shown in Figure 3a, the actuator connects to the structure through shear joints and pin connections, allowing for free rotation and settlement. The actuator’s height is adjustable to ensure precise displacement at the pin connection. The vertical load, reflecting different FSv values, is provided by the combined weight of the lumped mass and structural mass of the model. A load cell measures the load applied to the structure between the actuator and shear joint. Vertical displacements are monitored using an LVDT, while a rotary encoder tracks the structure’s rotation at the pin connection. These instruments feed data to a data logger, which continuously records and transmits the information to a computer.
In Test Series 1, a strip footing with dimensions of 10 cm (width) × 79.5 cm (length) × 2 cm (thickness) was placed transversely within the tank to simulate a 2D plane strain condition. This setup allowed for the clear visibility and detection of particle movement through the Plexiglas plate.
To prevent direct contact between the Plexiglas wall and the strip footing, the foundation was made 5 mm narrower than the tank’s width, allowing for free rotation and settlement during cyclic loading. A 2.5 mm gap on each side between the foundation and the Plexiglas plates was filled with polyethylene foam sheets (Figure 3b), cut to match the foundation’s cross-sectional dimensions (2 × 10 cm) with a thickness of 2.5 mm. The foam sheets, glued to the foundation’s cross-section, prevent sand from entering the gap while still allowing the foundation to move freely. In Test Series 2, a square steel footing with a width of 15 cm and a thickness of 2 cm was used.

2.3. Loading Protocol and Testing Program

Slow cyclic lateral loading tests were conducted on strip and square foundations with the test specifications provided in Table 3. The naming convention for the strip foundation tests consists of two parts: the first part represents the foundation shape (strip) and the second part indicates the depth of the foundation in millimeters. On the other hand, the naming convention for the square foundations includes three parts: the first part represents the foundation shape (square), the second part indicates the density state of the subgrade (dense or loose), and the third part specifies the depth of the foundation in millimeters.
The aim of this study was to examine the rocking behavior of foundations with varying embedment depths and FSv values. To achieve this, different subgrade relative densities (35% for loose subgrade and 65% for dense subgrade) and different structural masses (70 kg, 120, and 300 kg) were used to create a range of FSv values. The effect of embedment depth was systematically studied by considering surface, slightly embedded (25 mm), and deeply embedded (100 mm) foundations. Based on these variables, nine tests were conducted with FSv values ranging from 2.3 to 13.9, and the test names and specifications are detailed in Table 3.
In this research, the structure model underwent slow periodic displacements using a lateral loading system under 1 g conditions. Previous studies have examined the rocking behavior of foundations under four loading conditions: 1 and 2—scaled experiments under 1 g conditions with dynamic loading (shake table) or slow cyclic loading; 3 and 4—centrifuge testing (Ng acceleration) with dynamic loading (shake table) or slow cyclic loading.
Among these methods, centrifuge testing and shake table experiments are particularly beneficial. Centrifuge testing reduces scale effects and better simulates actual stress levels, while shake tables more accurately replicate seismic events and inertial loads. Both methods are ideal for studying how various factors affect stresses and deformations in the structure and subgrade soil. However, slow cyclic loading has its own advantages when examining the rocking behavior of soil–foundation systems. It generates clearer, more organized moment–rotation and settlement–rotation diagrams than dynamic loading, allowing for a more detailed understanding of the behavior. Additionally, under slow cyclic loading, soil deformations are solely due to foundation displacements, whereas dynamic loading introduces complexities from inertia due to imposed acceleration, making the results harder to interpret [19,37,38].
The effectiveness of 1 g slow cyclic loading in studying rocking foundations is supported by prior research. Kokkali et al. [39] found a strong correlation between the results under the 1 g and centrifuge conditions, particularly in behaviors like stiffness degradation, energy dissipation, and cyclic moment overstrength. They also observed similar moment–rotation and settlement–rotation diagrams, along with comparable rotational stiffness in both testing environments. Gajan et al. [40] further demonstrated that the moment–rotation backbone curve of slow cyclic loading closely matches that of dynamic loading tests. They concluded that slow cyclic loading results can predict the performance of a soil–foundation system under dynamic loading, particularly for rigid structures [41].
For structural materials, no scaling adjustments were applied due to the rigidity of the structure. Additionally, the tests were conducted at a sufficiently slow loading rate to simulate pseudo-dynamic conditions, effectively minimizing any potential inertial effects. Reduced-scale experiments inherently fail to replicate the exact stress conditions present in the supporting soil —a limitation addressed through centrifuge modeling. This limitation is particularly significant for sand, given its stress-dependent strength and stiffness. These discrepancies, known as scale effects, require the careful interpretation of experimental results. To mitigate these effects in this study, vertical push tests were conducted on a 15 cm square foundation to evaluate the soil’s bearing capacity under all conditions prior to the main tests.
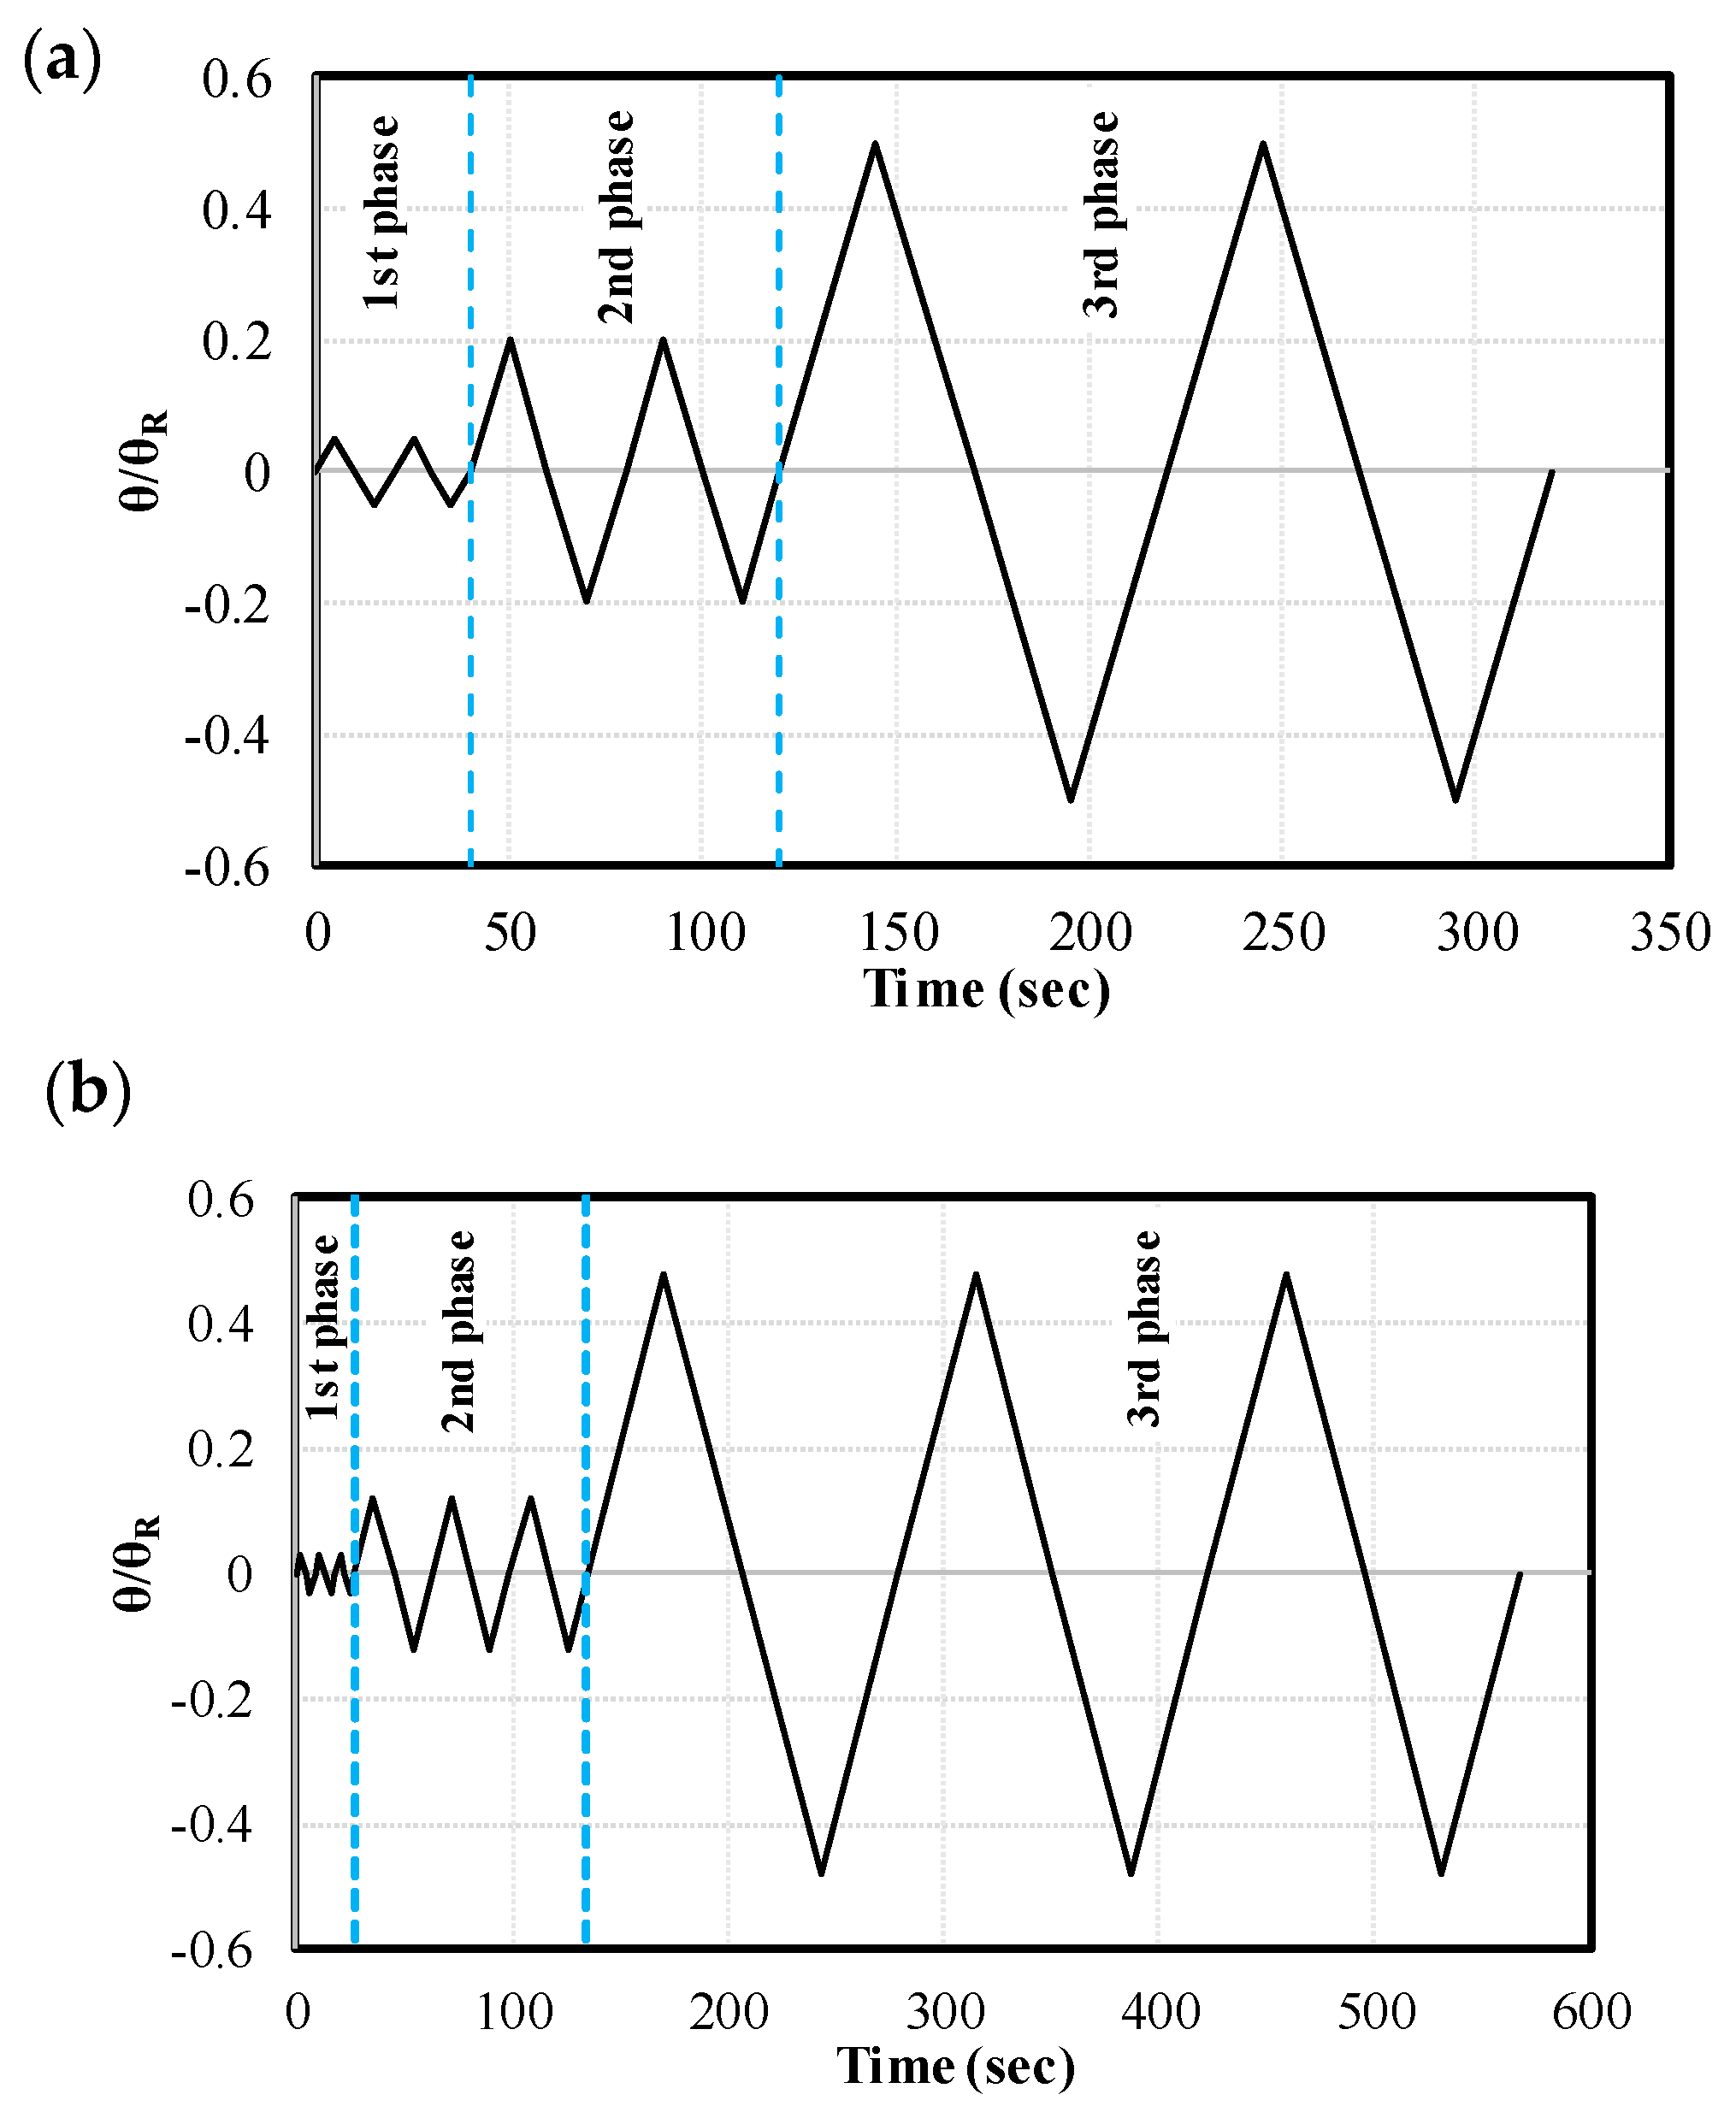
The lateral loading pattern applied to the strip footing is shown in Figure 4a. It consists of three phases with displacement amplitudes of 2.5 mm, 10 mm, and 25 mm (equivalent to θ/θR of 0.05, 0.2, and 0.5), representing small, medium, and large displacements (θ represents the rotation of the foundation relative to its initial position and θR denotes the threshold rotation for overturning the foundation resting on a rigid base). Each phase includes two similar cycles. To minimize structural inertia effects, the loading speed was set to 0.5 mm/s in the first phase and 1 mm/s in the next two phases, resulting in a total test time of 320 s. Due to the large volume of photos in the PIV tests (one image every two seconds), only two cycles were conducted per phase.
Moreover, the loading pattern applied to the square foundation is shown in Figure 4b. It includes three phases with displacement amplitudes of 2.25 mm, 9 mm, and 36 mm (equivalent to θ/θR of 0.03, 0.12, and 0.48). Each phase consists of three similar cycles. Since repeating cycles with a constant rotation amplitude did not significantly affect behavior, further repetitions were omitted. The loading speed of 1 mm/s resulted in a total test time of 567 s.

3. Image Processing Using Particle Image Velocimetry (PIV) Technique

The Particle Image Velocimetry (PIV) method, also known as Digital Image Correlation (DIC), is a velocity measurement technique that tracks and analyzes the movement of particles in a moving medium by comparing images taken at specific time intervals. PIV evolved from the Laser Doppler Velocimetry (LDV) technique, originally developed for fluid mechanics experiments to study fluid flow mechanisms. In this method, laser pulses visualize particles added to a moving fluid at different time intervals, allowing for the evaluation of the fluid flow pattern at the particle locations, assuming the particles move with the flow. As soil displacement in phenomena like landslides, earthquakes, wave propagation, and pile penetration can be viewed as slow fluid flow, the PIV method was introduced by White et al. (1993) for studying soil deformation in geotechnical research [42].
For PIV analysis, digital images can be extracted from video frames or captured directly with a digital camera. Digital cameras provide higher resolution and better image quality than video frames. Unlike fluid mechanics, where images are frequently taken from videos, the slow deformation rates of geotechnical phenomena typically permit direct image capture in geotechnical studies.
In PIV analysis, a certain level of contrast (texture) is necessary for reliable results. Fluids are typically textured with particles (colored powders) to enhance image distinction. In clay, this texture is artificially created by adding colored sand or other materials. However, sandy materials inherently possess texture due to the shape, color, and size of the sand particles, as well as the voids between them. This inherent texture is visible in Figure 5. Therefore, given the high quality of the images obtained in this study, there is no need to add additional materials to the sand to enhance texture. Two 40-watt UFO LED lamps were installed on either side of the imaging plane at an angle of approximately 45 degrees so that the camera could capture a uniformly clear view of the soil in the tank. Using two light sources positioned at an angle and on both sides of the camera prevents light reflection and shadow formation in the imaging area.
In this study, a Canon EOS 700D digital camera (resolution: 5184 × 3456 pixels) was used to capture images continuously at 2 s intervals. The camera was positioned perpendicular to the plexiglass wall, covering a 48 × 32 cm field of view. This field of view was conservatively selected to include the soil area beneath the foundation that undergoes deformation due to its movements. Various software tools are available for PIV analysis; in this study, PIVlab software (Version 2.60), developed by Thielicke in 2014 within the MATLAB framework (Version 2015a) [43], was utilized. This software analyzes particle flow by calculating displacement vectors across different frames. Each test, lasting 320 s (for strip footings), produced a total of 160 frames of the soil mass. The accuracy and precision of the PIV analyses were evaluated through repeated analyses and by comparing the displacement vector outputs for the foundation center with settlement values obtained from the LVDT sensor.
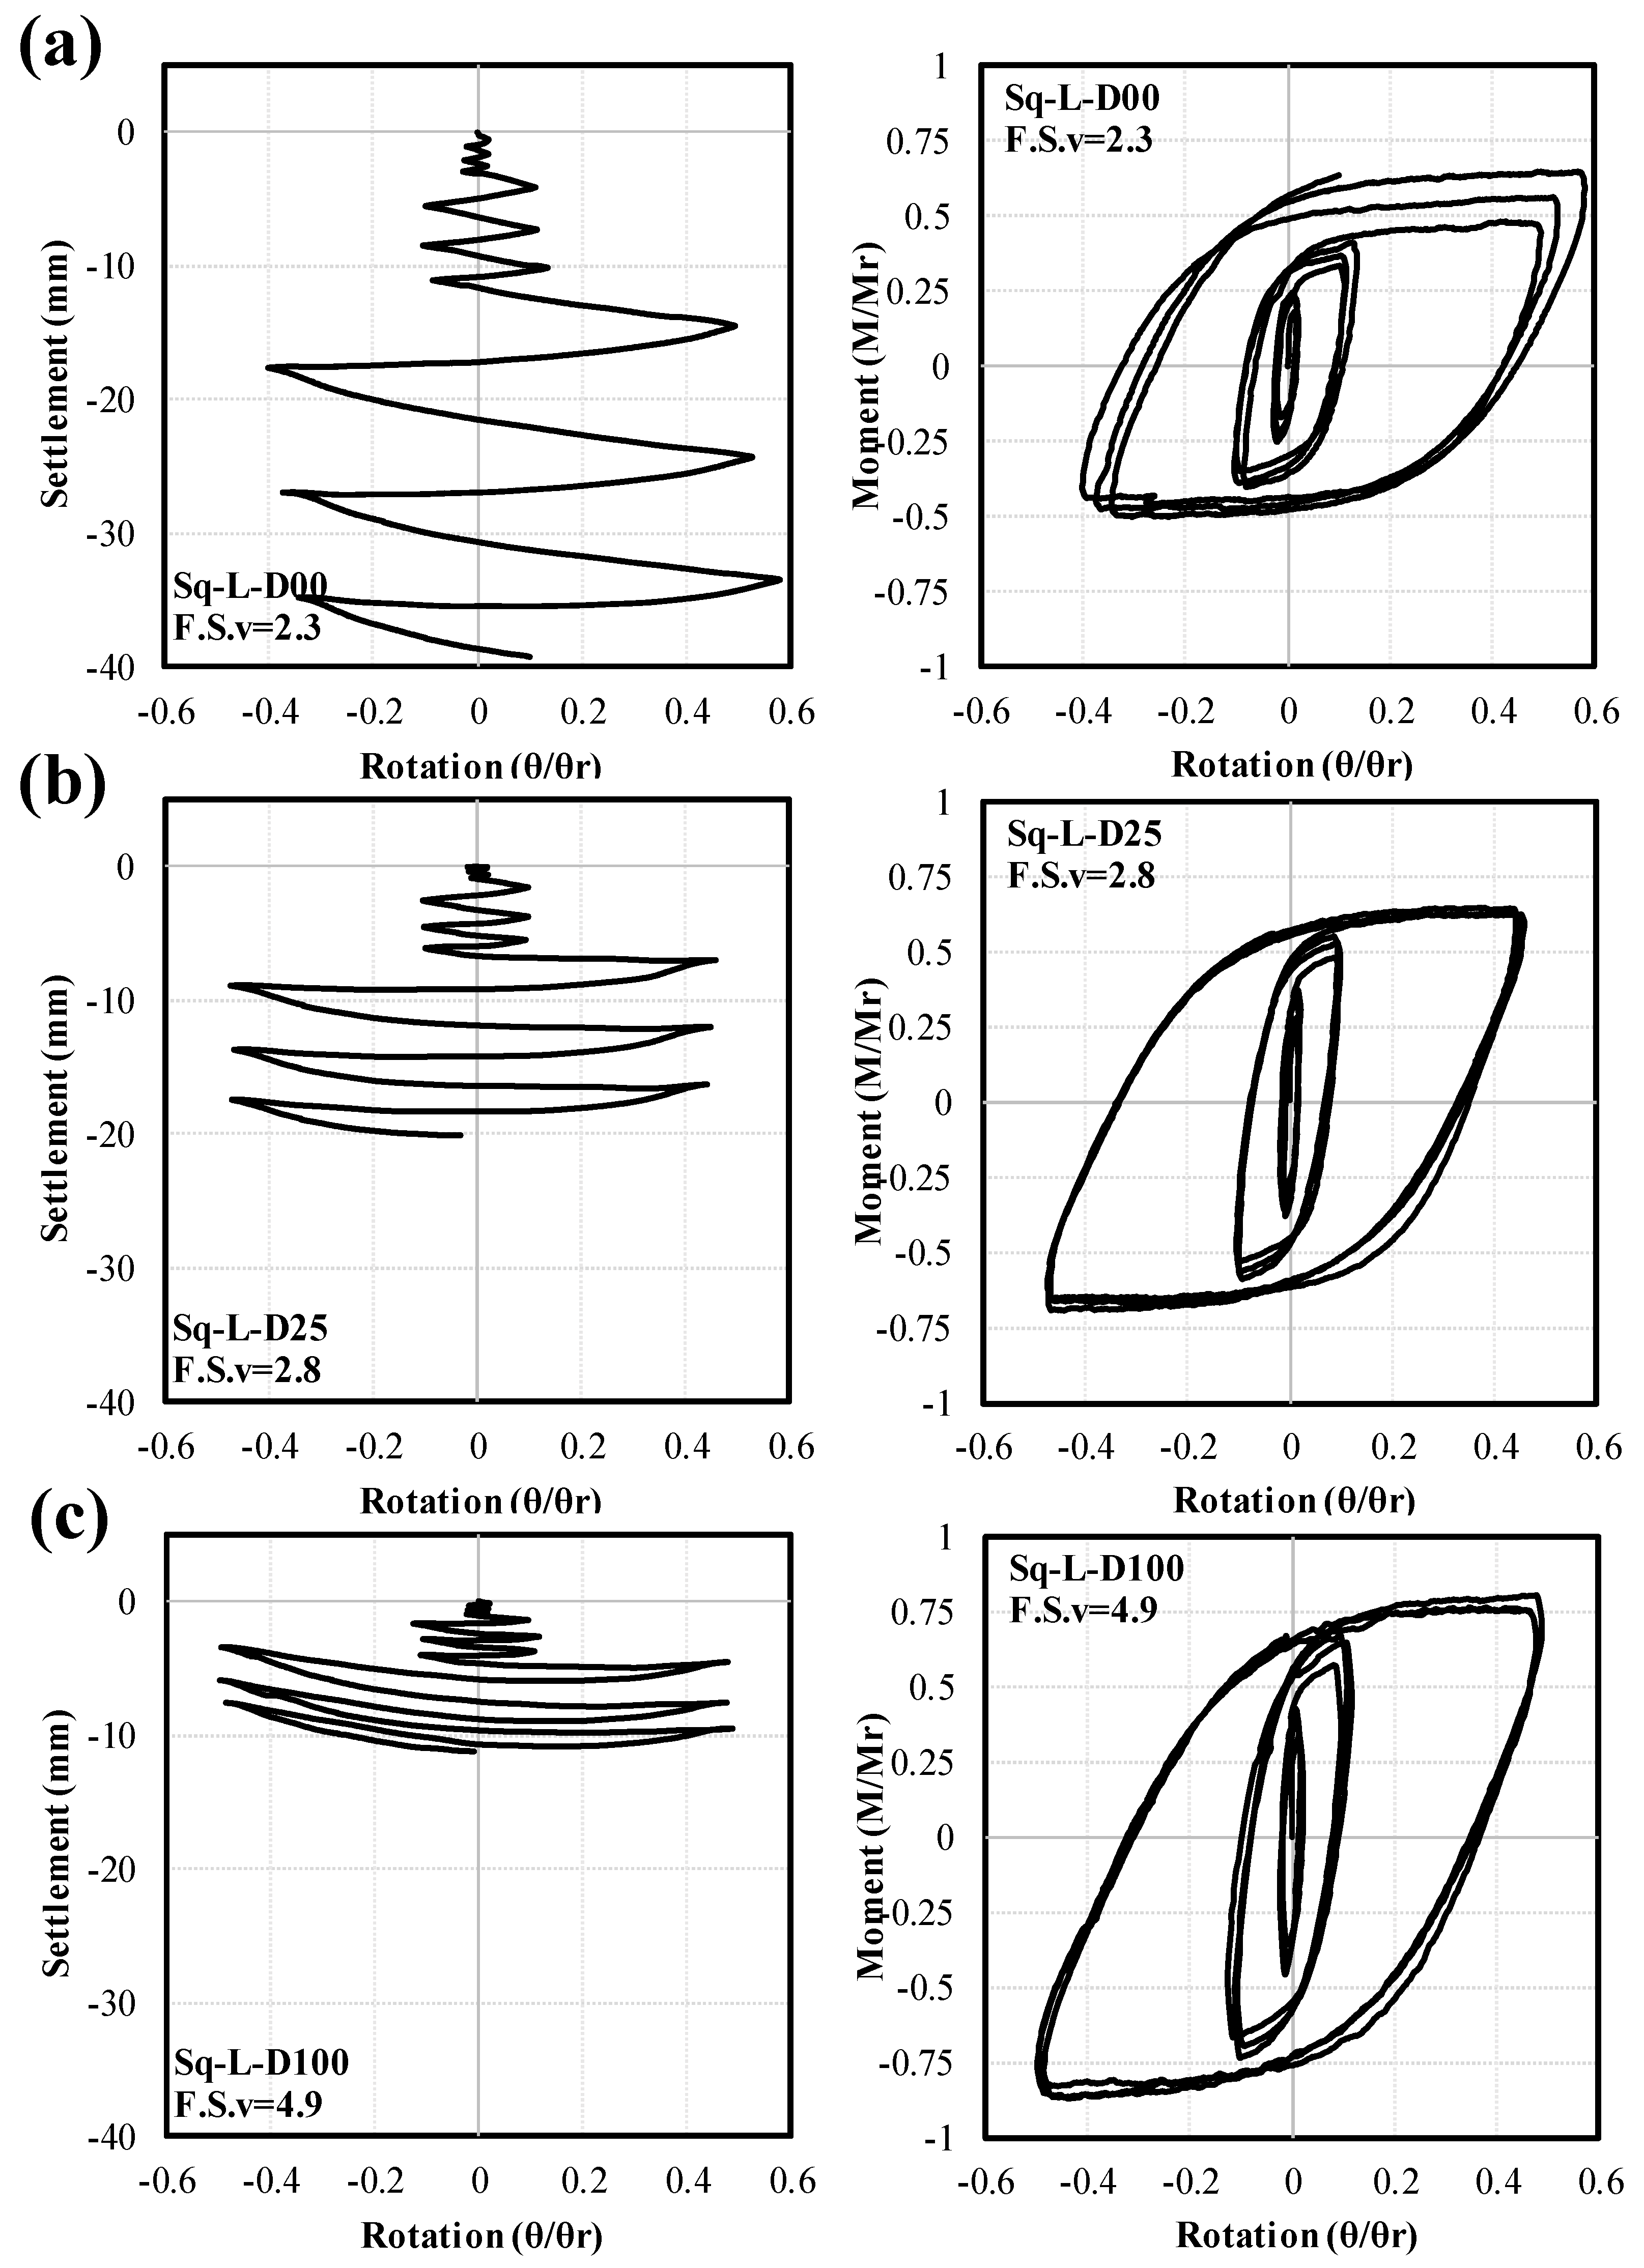
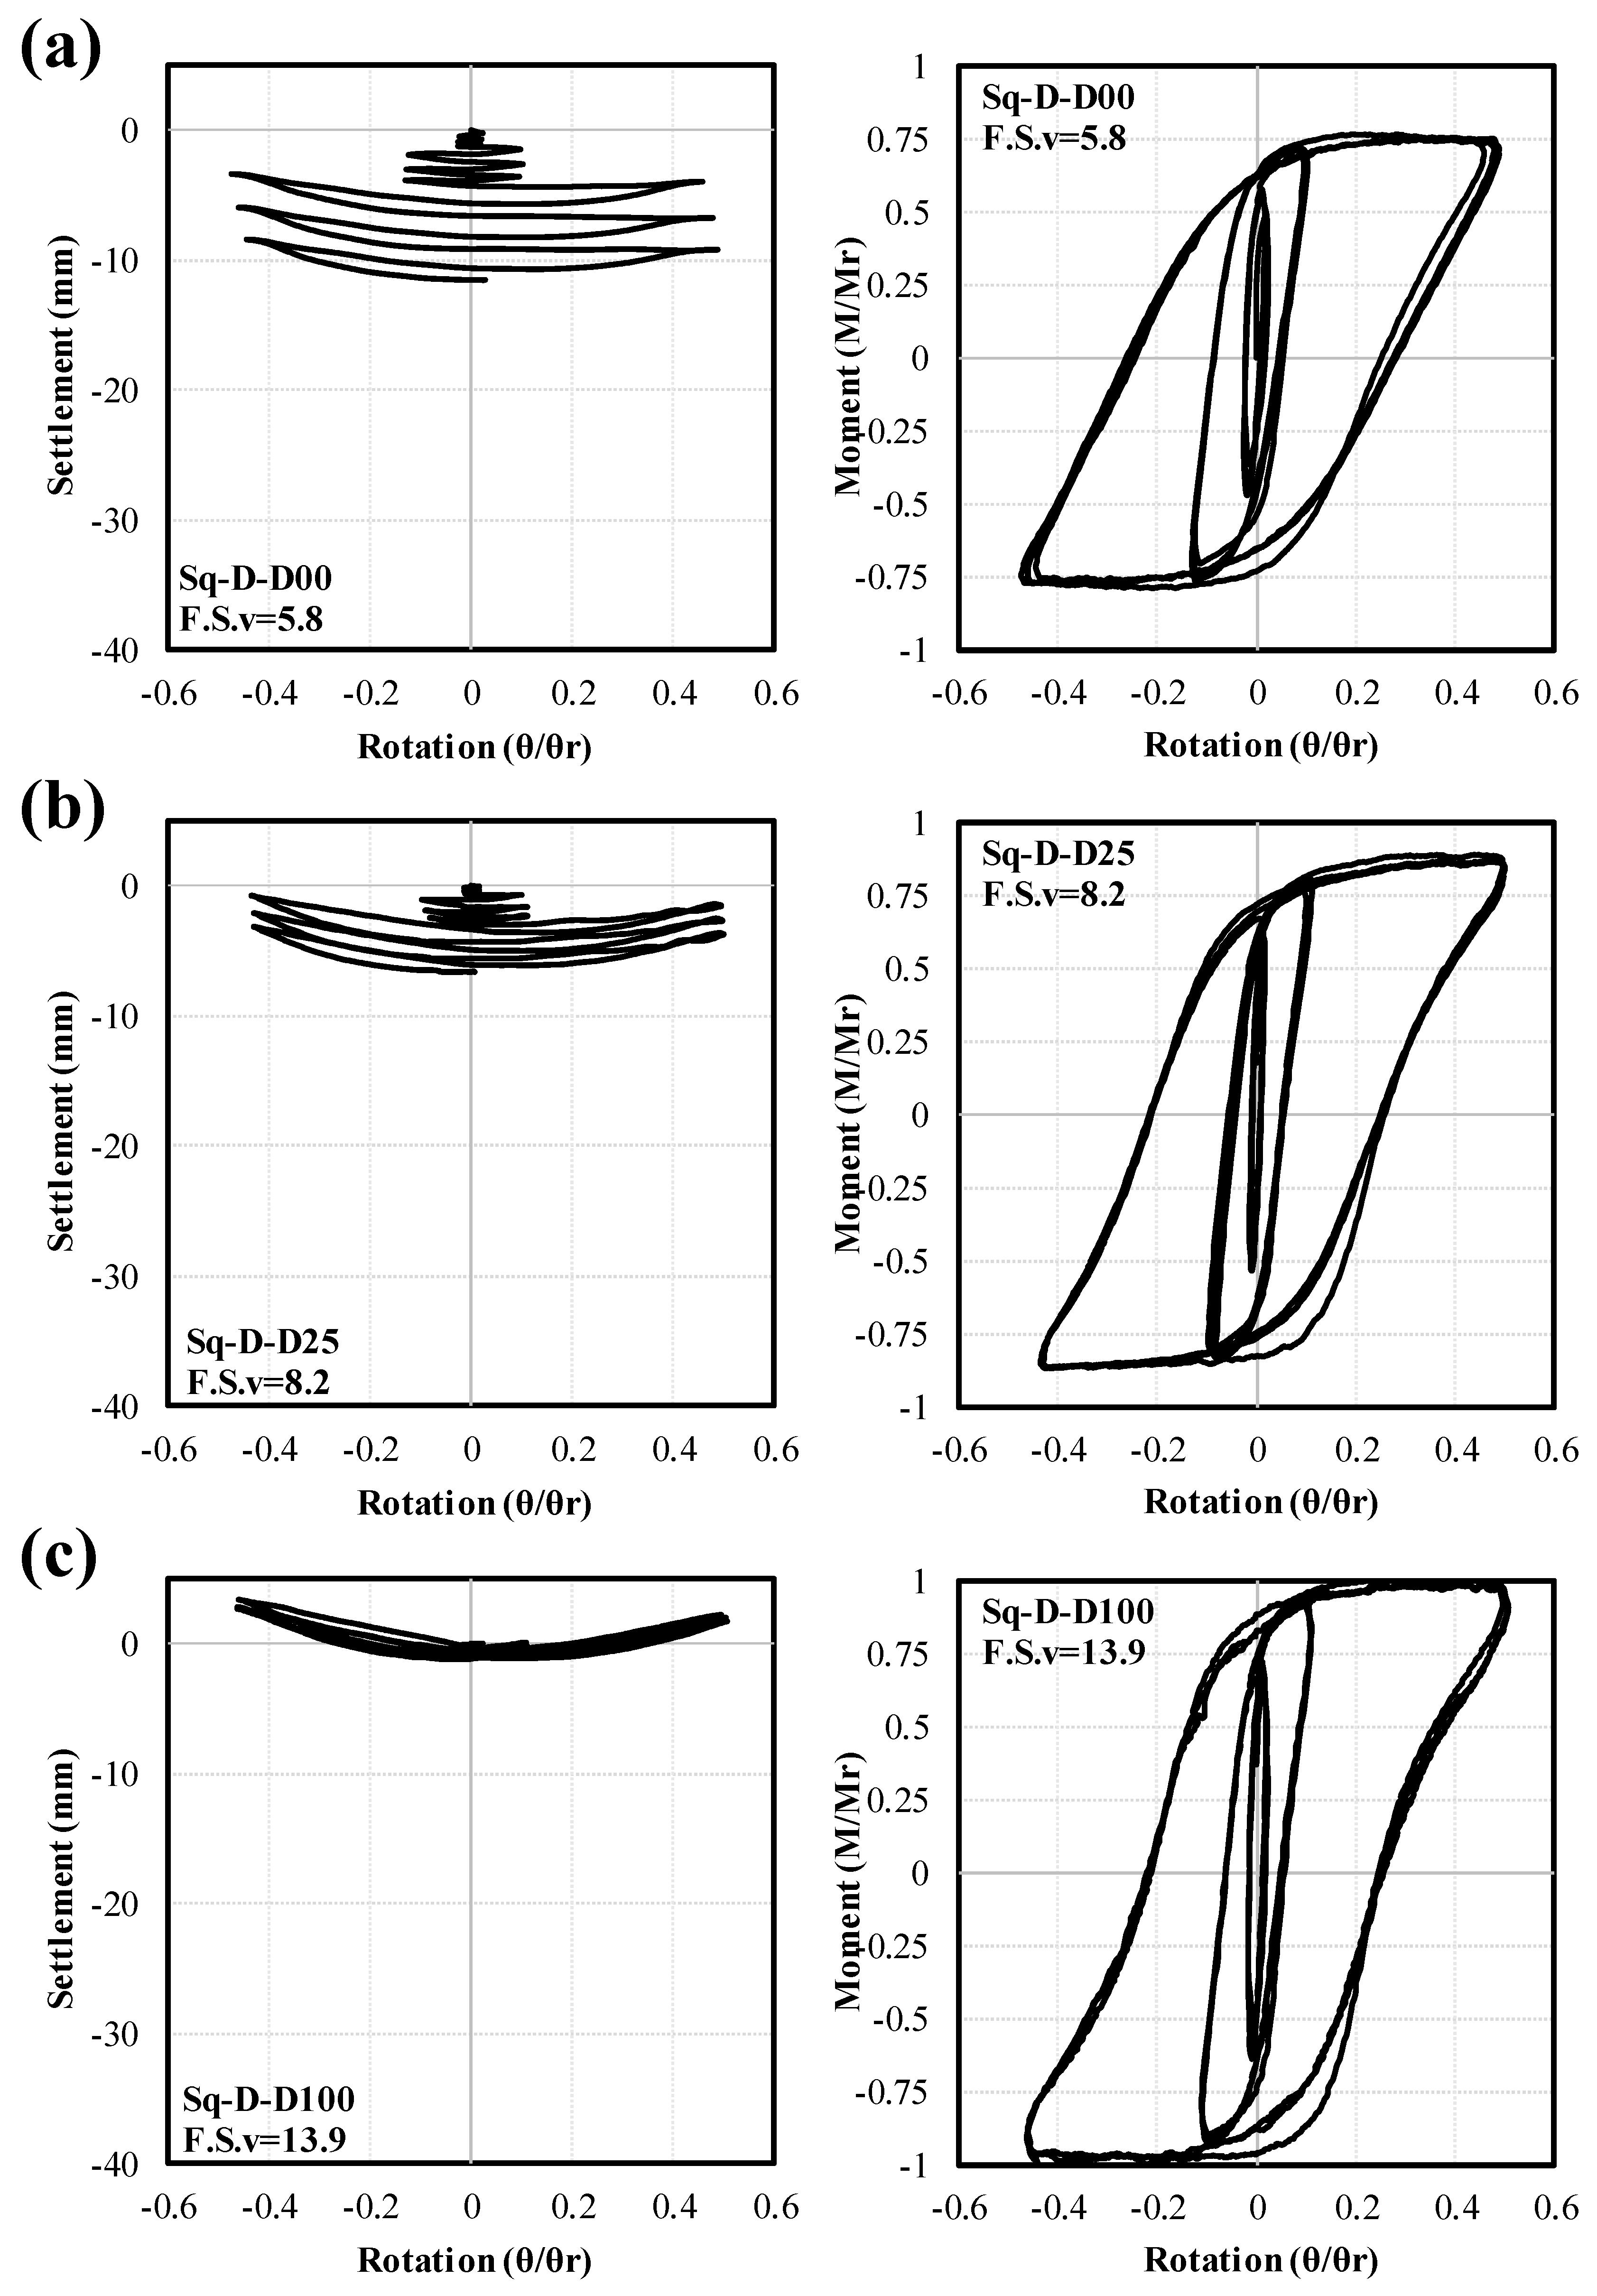
4. Results and Discussion

4.1. First Test Series

To assess the impact of embedment depth on foundation rocking behavior, three tests were conducted with identical subgrade conditions (65% density) and structure weight (300 kg) but varying embedment depths: 0, B/4, and B (Str-D00, Str-D25, and Str-D100). Figure 6 illustrates the moment–rotation and settlement–rotation responses. The results indicate that increasing embedment depth reduces settlement by 23% and 69% for the B/4 and B depths, respectively, compared to the surface foundation, while also increasing uplift. Furthermore, the moment capacity rises to 65%, 75%, and 90% of the overturning moment for the 0, B/4, and B depths, respectively.
To investigate the soil–foundation deformation mechanism during a loading quarter cycle (from zero to maximum rotation), the PIV analysis results for the third quarter cycle in the second loading phase of each experiment are shown in Figure 7. The second phase is chosen for detailed study, as the first phase shows minimal deformations and the third phase has a large rotation amplitude unlikely to occur in practice. Displacement vectors of soil particles above the foundation and the foundation’s movement are omitted (marked with red crosses), as these large displacements overshadow the more relevant surrounding soil movements.
The displacement vectors for a quarter cycle of loading, as shown in Figure 7, reveal that in surface foundations, an outward wedge deformation mechanism dominates, with a weak scoop mechanism (not shown). However, for an embedment depth of B/4, the overlying soil’s weight restricts soil escape from beneath the footing, leading to a more pronounced scoop mechanism. At an embedment depth of B, soil escape and the wedge mechanism are greatly constrained, making the scoop mechanism dominant.
The wedge deformation mechanism causes soil to displace outward from the foundation, resulting in soil heave at the surface, while the scoop mechanism displaces the soil toward the gap beneath the foundation, causing heave within that gap. In the surface foundation, significant soil escape accelerates foundation sinking. However, as embedment depth increases, reduced soil escape limits footing settlement and enhances uplift behavior. The settlement–rotation responses in Figure 6 shows that in the test with an embedment depth of B, uplift occurs even in the first phase (with minimal foundation rotation), whereas in the surface foundation test, uplift only appears in the third phase, when rotation is substantial.
This section examines the deformation mechanism of soil particles during a complete cycle to understand how permanent soil deformation occurs. Rocking causes the soil particles beneath the foundation to move downward, resulting in settlement. This displacement and the associated settlement are due to soil densification beneath the foundation and the outward escape of soil particles from under the foundation.
The PIV analysis results for a full cycle in the second phase, shown in Figure 8, indicate that in surface foundations, the primary settlement mechanism is soil escape from beneath the foundation, with minimal soil densification. As embedment depth increases, the soil escape mechanism is restricted by the overlying soil’s weight. For the foundation with an embedment depth of B, soil escape becomes negligible, and the slight settlement observed is mainly due to soil densification. These results show that the main cause of settlement during rocking motion is soil escape due to the wedge mechanism, while the scoop mechanism, even when fully developed, contributes little to final settlement. However, the scoop mechanism can absorb significant energy during rocking motions due to the formation of an extensive slip surface and the displacement of a large soil mass.

4.2. Second Test Series

The foundation’s static safety factor significantly influences its rocking behavior. Therefore, this series of experiments is divided into two groups for comparison: high safety factor (dense subgrade, low structural weight) and low safety factor (loose subgrade, high structural weight). Figure 9 and Figure 10 present the moment–rotation and settlement–rotation responses for foundations with different embedment depths. The following sections will analyze the behavior of these foundations across varying embedment depths, focusing on the moment capacity, settlement, damping ratio, rotational stiffness, and recentering ratio.
Based on the above-shown results, the following can be inferred:

4.2.1. Moment Capacity

A comparison of the diagrams for low and high safety factors (Figure 9 and Figure 10) reveals that as the foundation’s safety factor increases, its moment capacity also increases. The general relationship for the moment capacity of a foundation is shown in Equation (1). The normalized moment capacity (on which the diagrams of this study are based) was also calculated by dividing the moment capacity of the foundation by the overturning moment of a rigid foundation on a rigid base (Mr = P*L/2).
M u l t = P   L 2 1 A c A
M u l t M r = 1 A c A
In the equations above, P represents the structure’s weight and L is the foundation dimension in the direction of horizontal loading. Ac is the foundation area needed to support the structure’s weight during rocking, while A is the total foundation area. The Ac/A ratio is inversely related to the foundation’s vertical static safety factor. Therefore, an increase in normalized moment capacity as the safety factor increases (corresponding to a decrease in the Ac/A ratio) is predictable.
In embedded foundations, several additional factors influence moment capacity. These include passive soil pressure on the loaded side of the foundation (indicative of foundation thickness), active soil pressure on the unloaded side, the weight of the soil above the foundation, and soil shear along the sides of the foundation (perpendicular to the loading direction), as illustrated in Figure 11. Together, these components enhance moment capacity as embedment depth increases. A comparison of the graphs reveals that with increases in embedment depth to 25 mm and 100 mm, the moment capacity in tests with a low safety factor rises by 16% and 45%, respectively. In contrast, for tests with a high safety factor, the increases are 13% and 33%, respectively.

4.2.2. Configuration of the Moment–Rotation Diagrams

The moment–rotation graphs in Figure 9 and Figure 10 indicate that in tests with a high safety factor, the graphs are S-shaped and slender, particularly at large rotation amplitudes, while in tests with a low safety factor, they appear thick and elliptical. Furthermore, in both high and low safety factor tests, increasing embedment depth causes the graphs to become more S-shaped and slender.
This variation in shape can be attributed to differences in the contact area between the foundation and the soil during rocking motions. In foundations with a high safety factor, the contact area is small during the loading quarter cycle, resulting in a significant uplift on the unloaded side. In contrast, foundations with a low safety factor exhibit a larger contact area, leading to considerable settlement and wedge-shaped deformation toward the outer side, which causes the foundation to sink into the soil (sinking mechanism) and results in minimal uplift on the unloaded side. Additionally, increasing embedment depth enhances bearing capacity and soil confinement around the foundation, reducing soil escape beneath it, decreasing settlement on the loaded side during the loading quarter cycle, and strengthening the foundation’s uplift behavior.
The effect of the reduced contact area between the foundation and the soil, along with increased uplift, on the shape of the moment–rotation curves can be explained by considering the P-Δ effect and the recentering characteristics (illustrated in Figure 12). In foundations with a high safety factor and greater embedment depth, the smaller soil–foundation contact area increases the distance between the center of mass of the structure and the center of the soil–foundation contact surface (Δ value). Consequently, the moment generated by the P-Δ effect, which aids in returning the structure to its initial equilibrium (zero rotation), increases. This means that less force is required to restore the structure to equilibrium, resulting in a slimmer, S-shaped graph.
In contrast, for foundations with a low safety factor and shallow embedment depth, applying displacement toward zero rotation results in a minimal P-Δ effect due to the large contact area and significant sinking into the soil. As a result, force must be applied from the start of the unloading quarter cycle to return the foundation to its initial equilibrium state. This difference in unloading paths leads to elliptical-shaped loops for these foundations.

4.2.3. Recentering Characteristics

The recentering of a system refers to its ability to minimize residual displacements during loading and unloading cycles. The most effective systems both dissipate energy and exhibit minimal residual displacement after unloading. Figure 13 shows an idealized moment–rotation diagram of a foundation during rocking motions.
According to Figure 13, the recentering capability is defined as follows:
R c = 1 z d
In the equation, d is the maximum rotation in the cycle and z is the residual rotation at moment zero. For a rigid foundation on a rigid base, z = 0, making the recentering ratio one. If the foundation’s safety factor is one, no uplift occurs, and the recentering ratio is zero. Based on the definition of the recentering ratio and Figure 13, it is evident that as the recentering ratio increases, the damping ratio typically decreases.
Figure 14 shows the recentering ratio for foundations with varying embedment depths, categorized by high and low safety factors. As expected, foundations with a high safety factor have a significantly higher recentering ratio than those with a low safety factor. Additionally, the recentering ratio increases with embedment depth, as discussed earlier.
Figure 14 illustrates that for foundations with a low safety factor, the recentering ratio increases during the second and third phases as the rotation amplitude grows. Conversely, for foundations with a high safety factor, the recentering ratio decreases. This disparity is primarily attributed to changes in soil densification throughout the various loading phases. In loose sand (low safety factor), increasing rotation amplitude leads to subgrade densification due to rocking motions. This, in turn, reduces the soil–foundation contact area and increases the P-Δ effects, which enhances self-centering in the loose soil. In contrast, for foundations on dense sand, rocking motions can decrease subgrade density due to soil failure, resulting in a larger contact area and diminished P-Δ effects, thereby reducing self-centering.

4.2.4. Rotational Stiffness

Rotational stiffness is a critical factor in analyzing the behavior of rocking foundations. Figure 15 provides a schematic diagram of the applied moment and the corresponding rotation for a loading cycle. The rotational stiffness of the foundation is equal to the slope of the line connecting the maximum and minimum points on the moment–rotation loop, which is determined by the following equation:
K θ = 2 M m a x 2 θ m a x
Figure 16 shows the rocking stiffness of foundations with both low and high safety factors. As observed, the stiffness decreases with increasing rotation of the foundation, which is due to the lack of substantial increase in moment with increasing foundation rotation. Foundations with a high safety factor exhibit greater stiffness than those with a low safety factor. Additionally, as the foundation’s embedment depth increases, the rocking stiffness also rises, consistent with the increase in moment capacity discussed earlier.

4.2.5. Foundation Damping

As mentioned earlier, one of the key advantages of the soil–foundation system during rocking motions is its significant energy dissipation compared to conventional foundation designs. The damping ratio is defined as the ratio of energy absorbed within a hysteresis loop to the elastic energy, as illustrated in Figure 15. This ratio is calculated using the following equations:
Δ E elastic   = 1 2 K θ 2 θ m a x 2 2
ζ = Δ E cycle   4 π Δ E elastic  
Figure 17 presents the damping coefficient values for foundations with different embedment depths, categorized by low and high safety factors. Notably, as the safety factor increases, the damping coefficient decreases. Additionally, the damping ratio also decreases with greater embedment depth. This trend is evident in the moment–rotation hysteresis loops, which become narrower as safety factors and embedment depths increase. This behavior results from lower unloading stiffness and improved recentering properties in foundations with higher safety factors and deeper embedments. Furthermore, the decrease in the damping ratio can be attributed to reduced plastic deformations, smaller displacements, and the limited formation of failure surfaces in the foundations as safety factors and embedment depths increase.

4.2.6. Foundation Settlement Trajectory

One of the key parameters in assessing the rocking behavior of foundations is their settlement during cyclic loading, often viewed as a weakness of the rocking system. However, the primary goal of the rocking isolation approach is to prevent severe structural damage or the collapse of the superstructure during extreme earthquakes, such as the failure of the Fukae Bridge piers in the 1995 Kobe earthquake. Thus, settlements of several tens of centimeters can be seen as an achievement compared to complete structural failure. Additionally, methods like increasing soil compaction and other ground improvement techniques can help limit and control foundation settlement during rocking motions to acceptable levels.
The trajectories of foundation settlement at the end of each loading cycle in Figure 18, along with the settlement–rotation diagrams in Figure 9 and Figure 10, indicate that settlement values decrease with increasing foundation embedment depth. Furthermore, uplift behavior during the quarter cycles of loading improves with a greater embedment depth and safety factor. As the safety factor rises, mechanisms like subgrade densification, the formation of failure wedges, and soil escape from beneath the foundation are restricted, leading to reduced settlement during the loading and unloading quarter cycles. Increased embedment depth further limits failure wedge formation and soil escape, enhancing uplift behavior and reducing settlement.
Figure 18b demonstrates that foundation settlement in the Sq-D-D100 test is significantly limited compared to other tests. This behavior can be understood by analyzing the three key deformation mechanisms occurring in the soil beneath the foundation during rocking motions, as illustrated in Figure 19. The densification mechanism increases soil compaction beneath the foundation as it experiences repeated loading and unloading cycles. The wedge deformation mechanism causes the soil to move outward from the foundation, leading to soil heave at the soil surface. Finally, the scoop deformation mechanism displaces soil toward the gap beneath the foundation, also causing a heave in the gap area.
The primary cause of foundation settlement during rocking is soil escape due to the wedge mechanism, with densification as a secondary factor. Although the scoop mechanism may fully develop, it does not significantly affect the final settlement. However, it can absorb a substantial amount of energy during rocking motions due to the creation of an extensive slip surface and significant soil displacement [44].
As the foundation’s safety factor increases, the subgrade densification mechanism becomes more restricted. Additionally, greater embedment depth limits the formation of failure wedges and prevents soil from escaping beneath the foundation. In the Sq-D-D100 test, both primary mechanisms of foundation settlement (densification and wedge mechanisms) are minimized due to the high safety factor and deep embedment. Consequently, the settlement of these foundations is significantly lower compared to other tests across various loading cycles.
An important observation in the Sq-D-D100 test is that settlement decreases during the first cycle of phase 3 (seventh cycle of loading), indicating the significant uplift behavior of the foundation. To investigate this, the behavior of a deeply embedded strip foundation with a high safety factor (100 mm embedment depth and a safety factor of 17.3) was examined using the PIV technique.
Figure 20 pertains to the PIV results of the second cycle of the third phase, revealing that during the first loading quarter cycle (Figure 20a), the soil beneath the loaded edge moves toward the unloaded edge of the foundation due to the scoop mechanism, creating heaving in the gap beneath the unloaded edge of the foundation and reducing soil compaction. Some of this displaced soil is compacted again during the foundation’s return in the second quarter cycle (unloading, Figure 20b), while some moves back toward the unloaded edge. This behavior repeats in the opposite direction during the next two quarter cycles of loading and unloading (Figure 20c,d). The displacement vectors of the entire cycle indicate that only minimal settlement occurred at the two corners of the foundation, while the center experienced no settlement and even slight uplift (Figure 20e).
As a result, it is evident that during this cycle, the soil beneath the foundation merely shifts, with no permanent settlement occurring. The main reason is the inability of soil particles to escape from beneath the foundation due to the high embedment depth and the lack of further compaction due to the already compacted soil bed and the structure’s low weight. Additionally, during the quarter cycles of loading, some sand falls into the significant gap created at the unloaded edge of the foundation, as shown in the magnified picture in Figure 20. This fallen sand adds to the soil volume beneath the foundation, reducing settlement and potentially causing uplift at the end of the cycle. As a result, the center of the foundation experienced no settlement and even showed a slight uplift during this loading cycle.

5. Conclusions

In recent years, severe earthquakes have driven researchers to seek methods that limit forces and deformations on structures, preserving their integrity during seismic events. One promising approach in foundation design is the rocking isolation method, where the foundation is allowed to uplift, mobilizing bearing capacity and triggering deformation mechanisms in the soil under intense shaking. While research has primarily focused on surface foundations, in practice, foundations are often embedded due to factors like weak surface soils, the need for greater bearing capacity, or scour protection. This study explores the distinct seismic behavior of embedded foundations compared to surface ones. In this study, the rocking behavior of foundations with varying embedment depths is investigated through physical modeling under 1 g conditions and slow cyclic loading. The key findings are as follows:
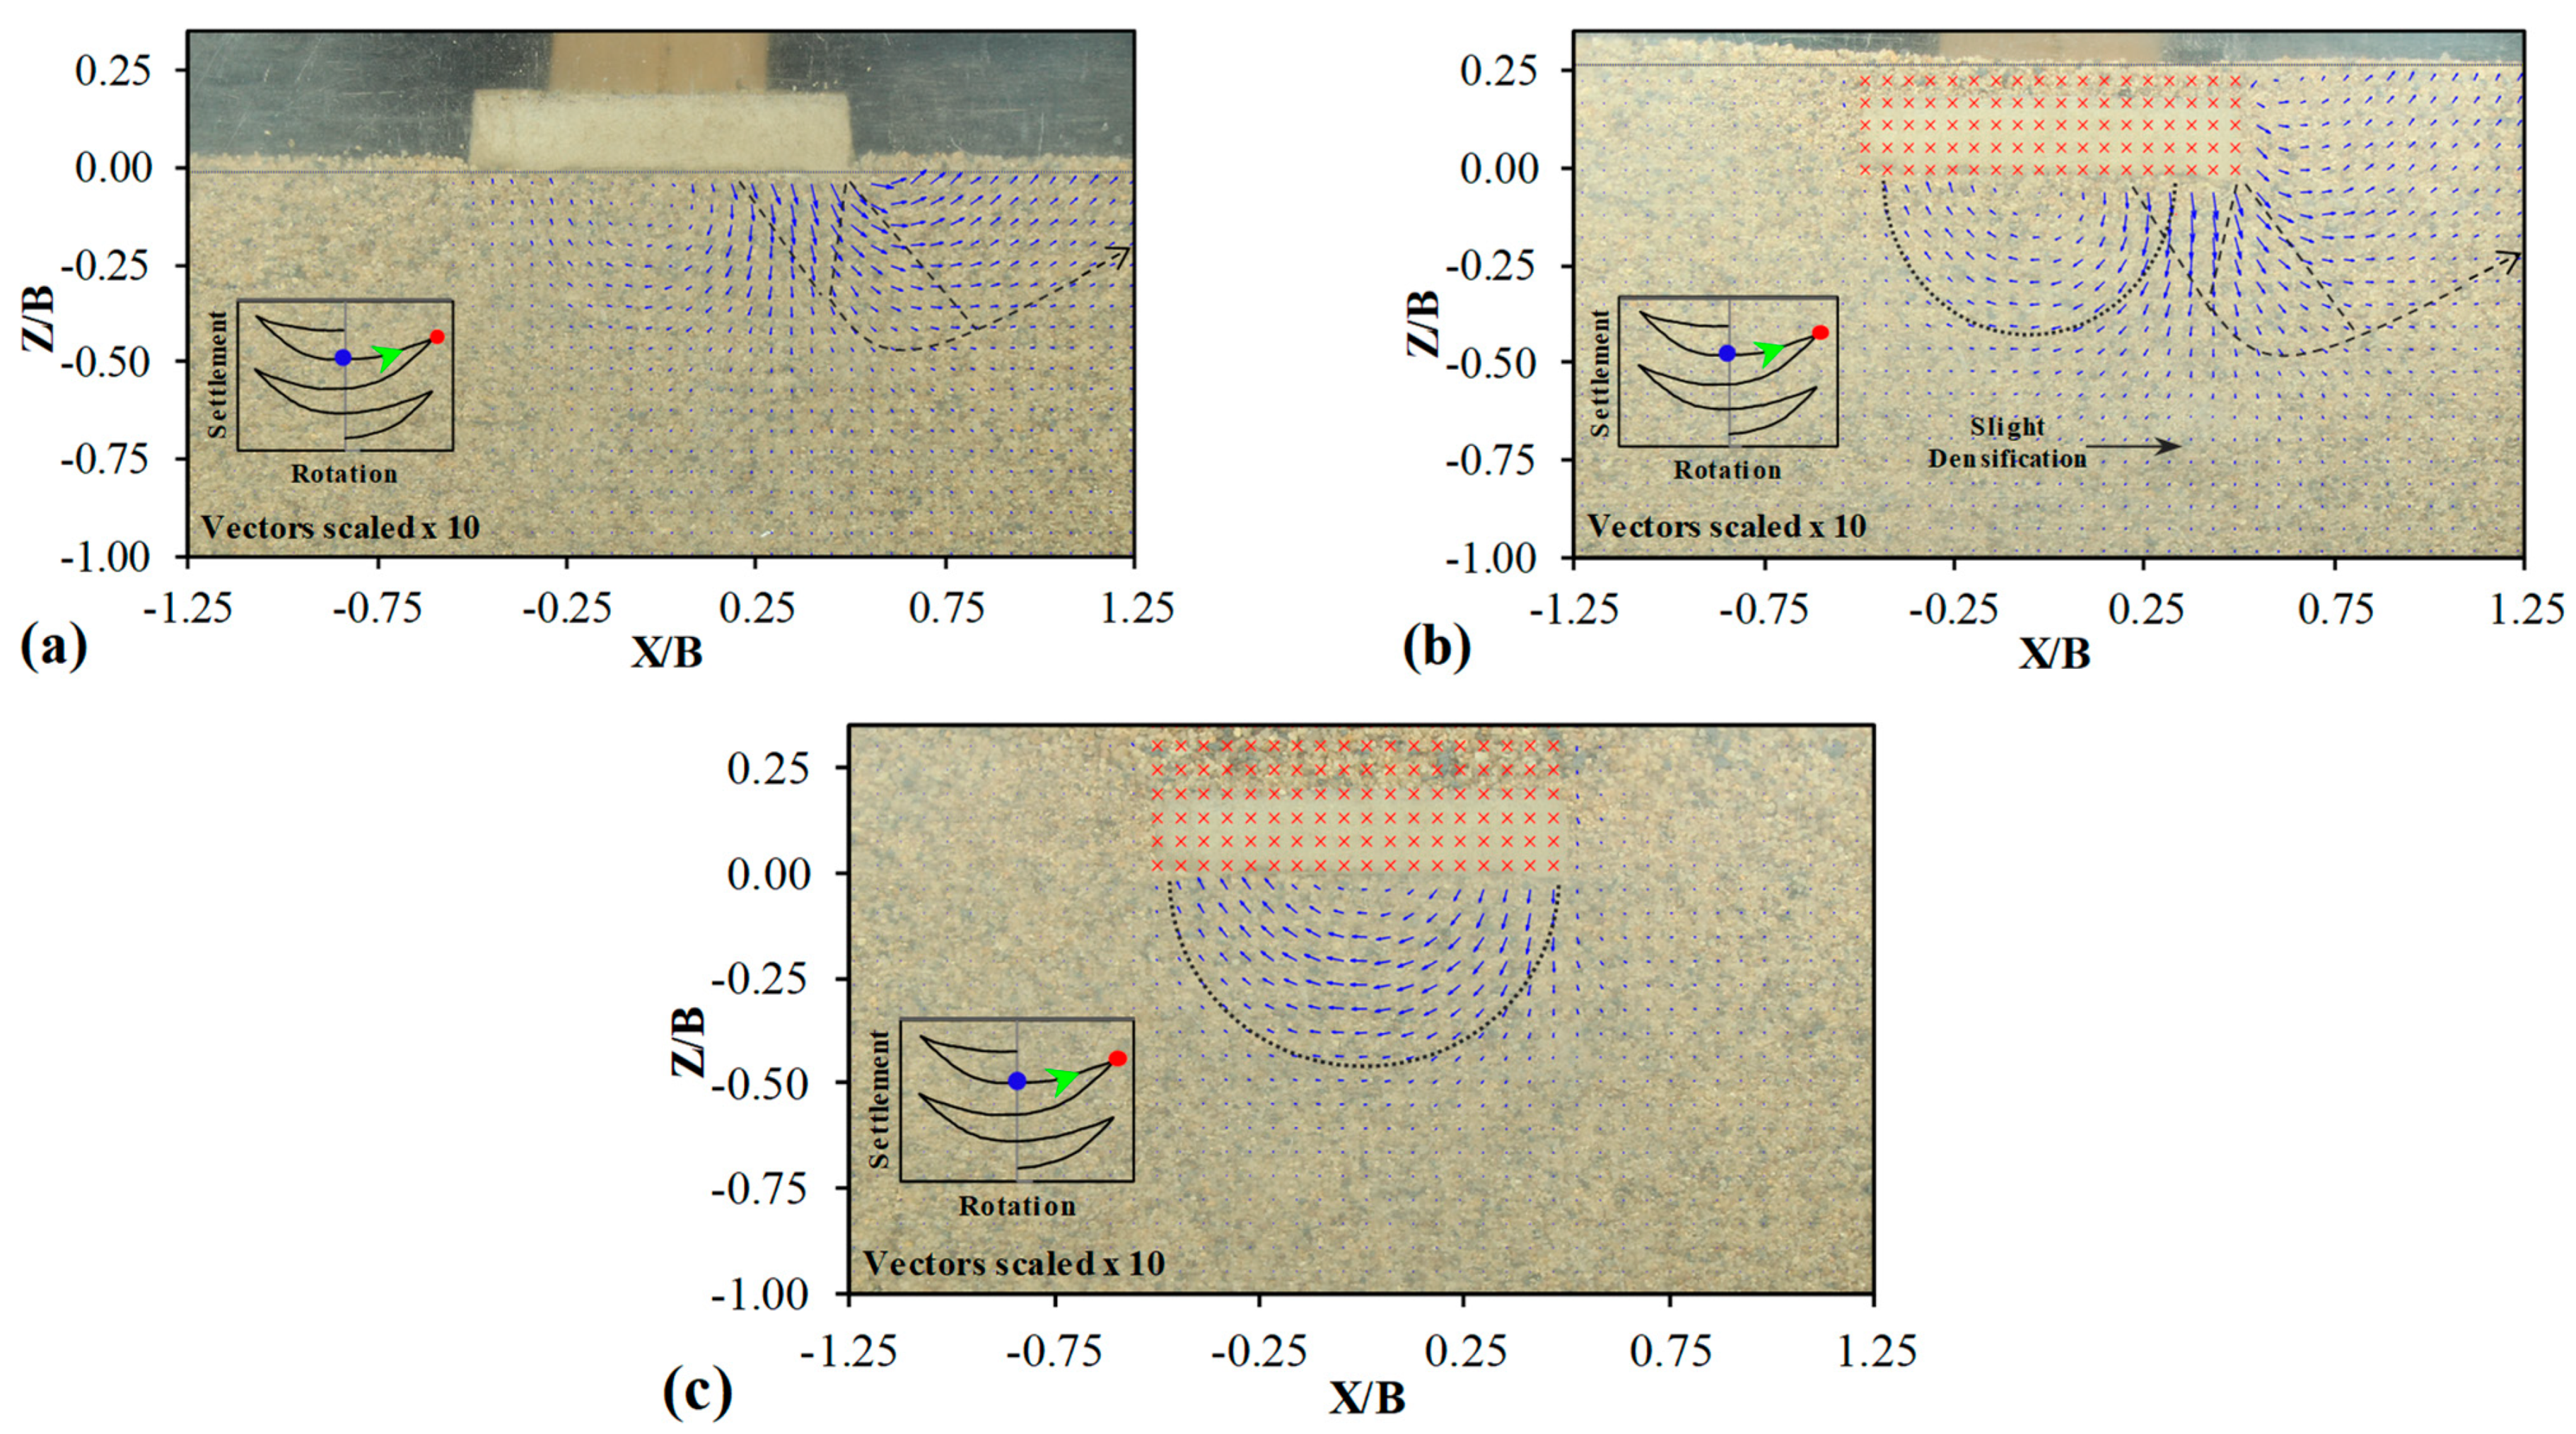
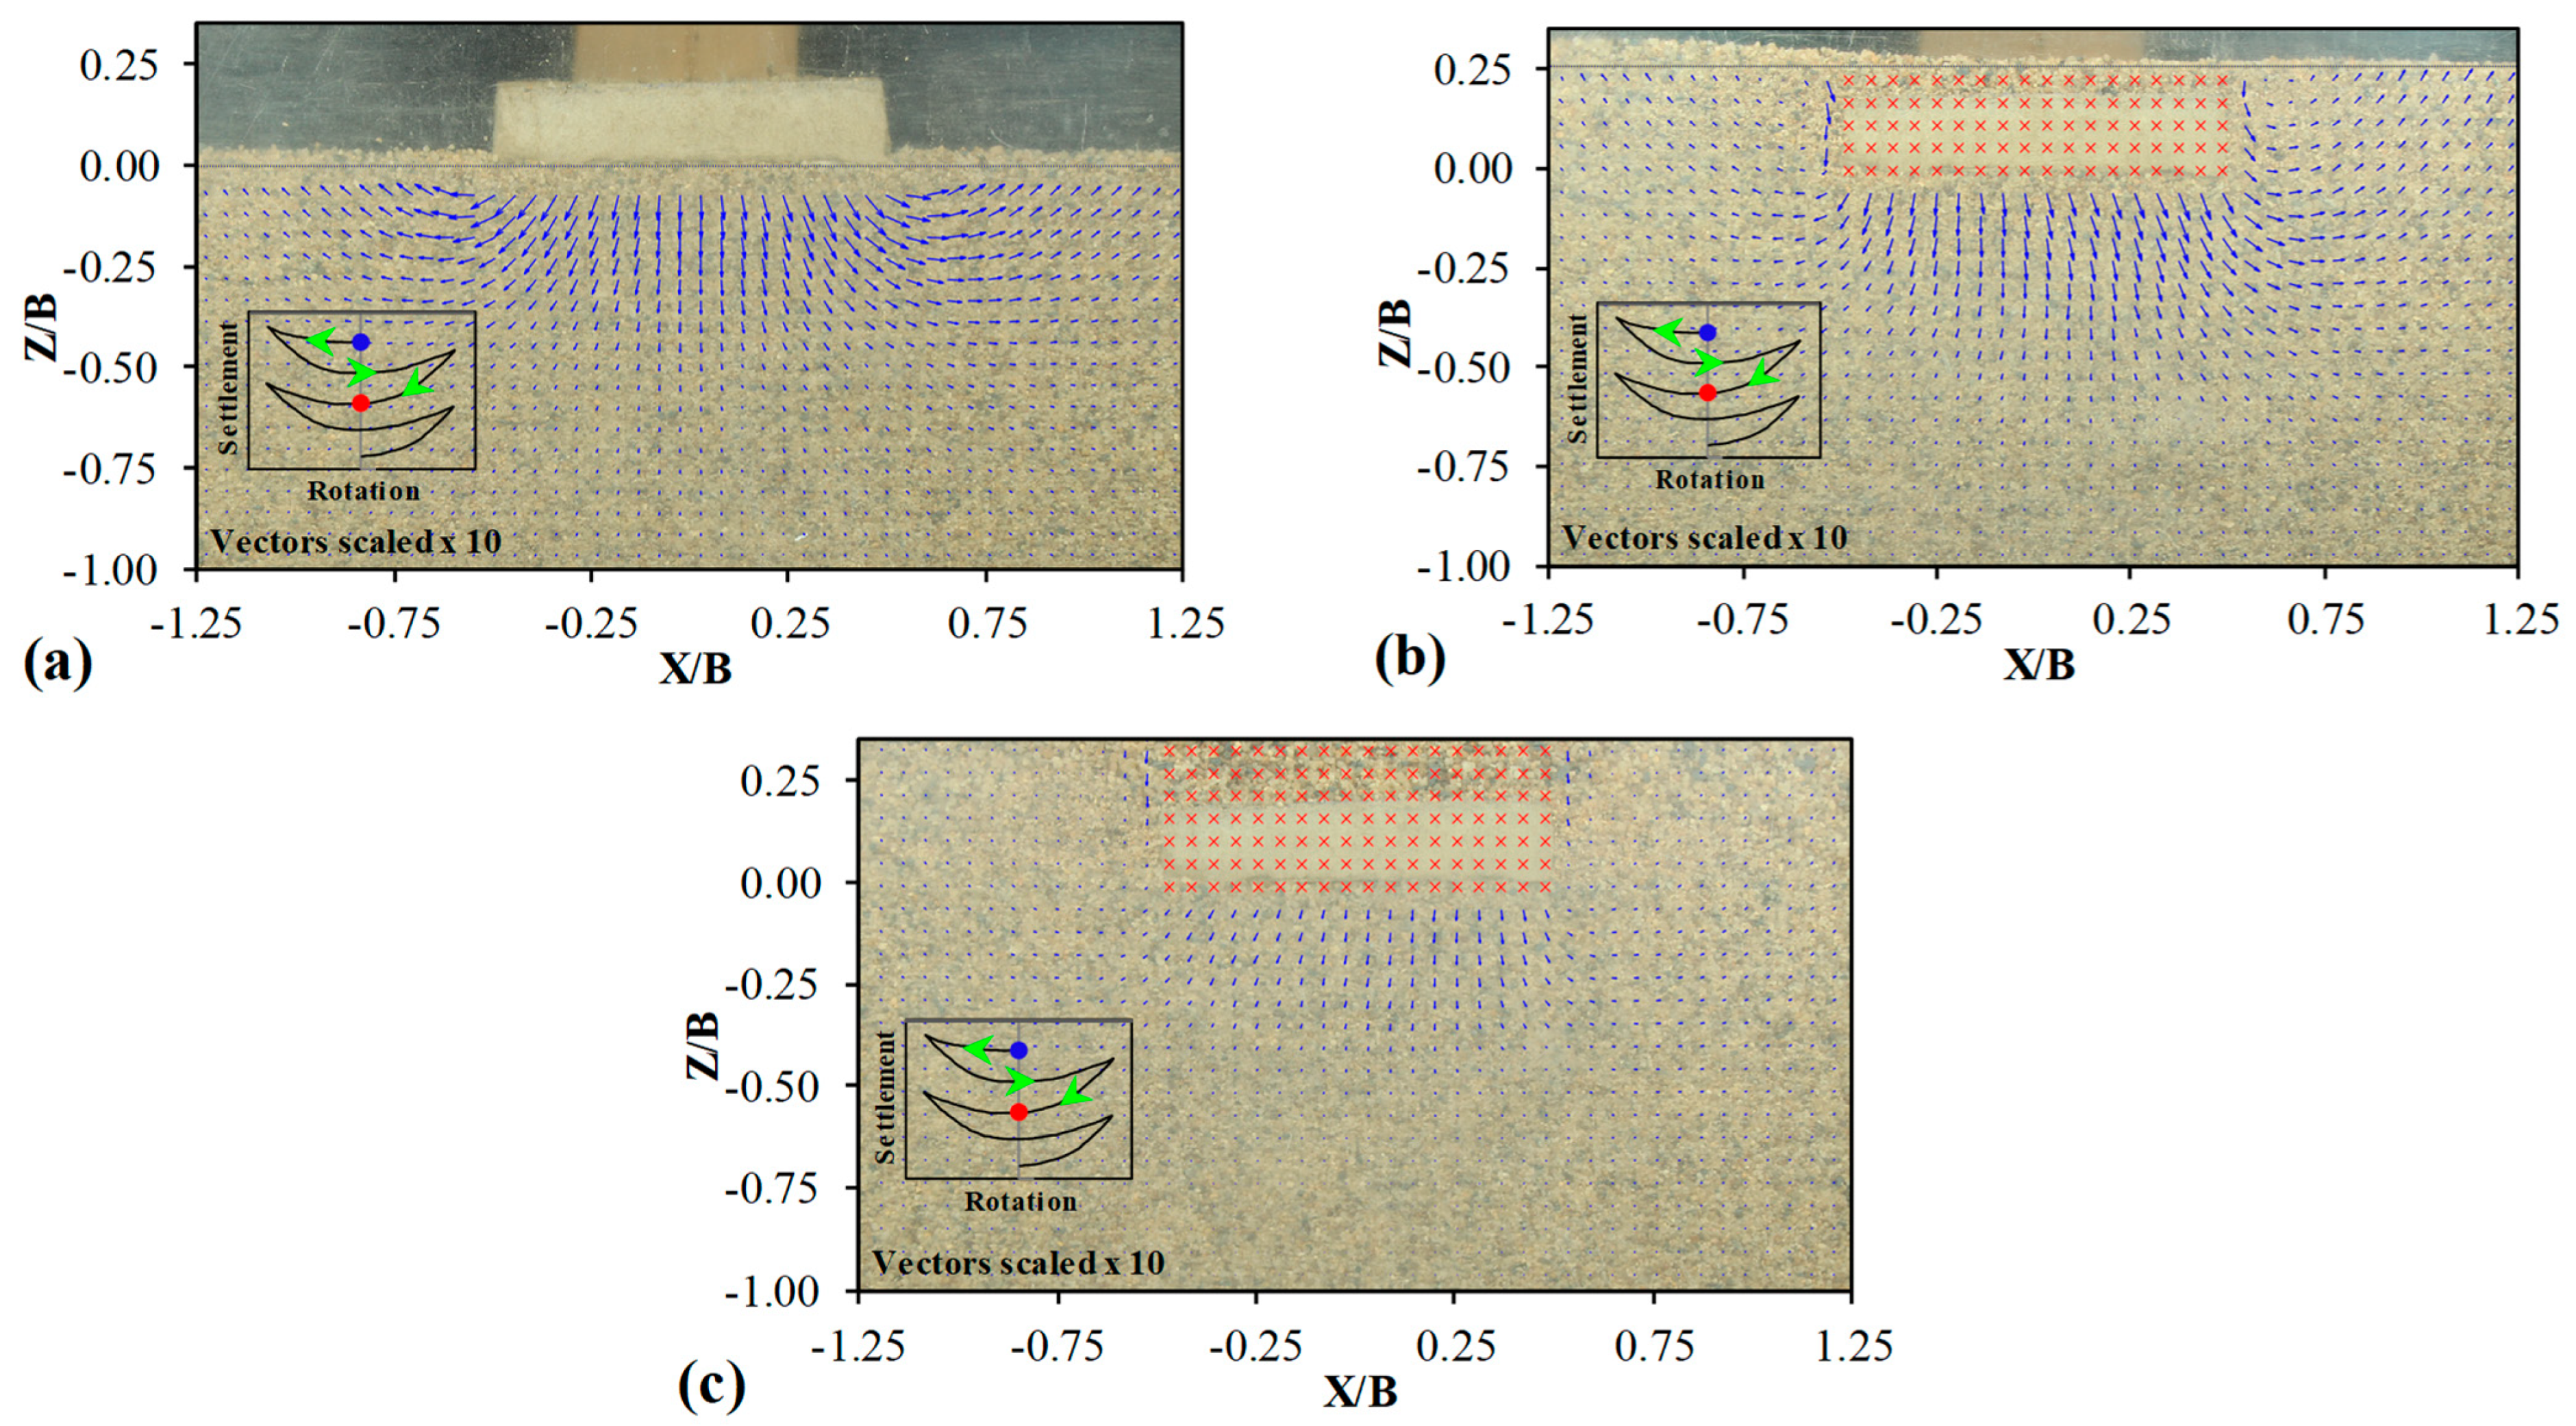
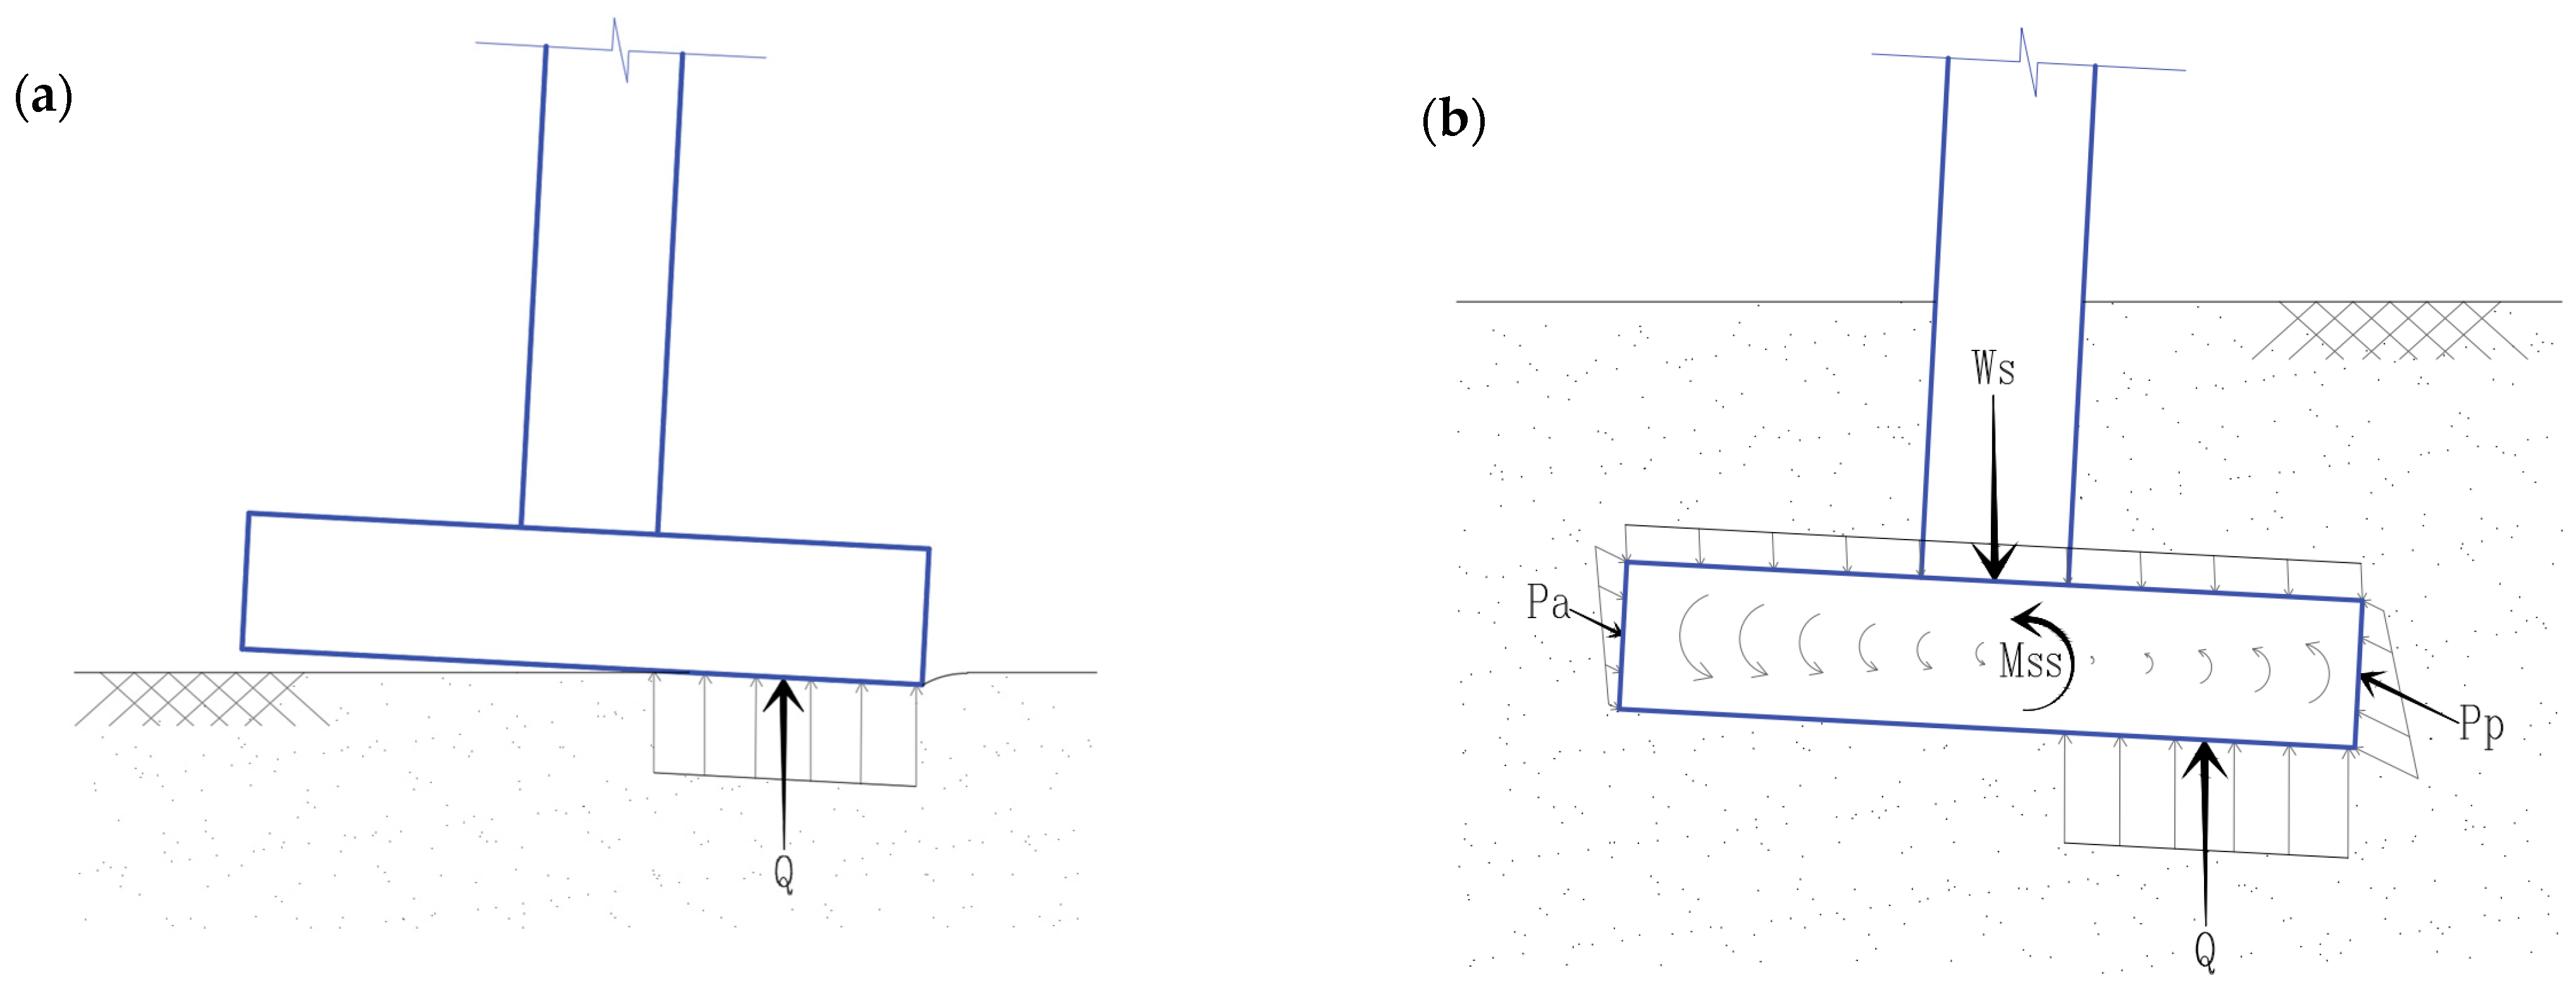
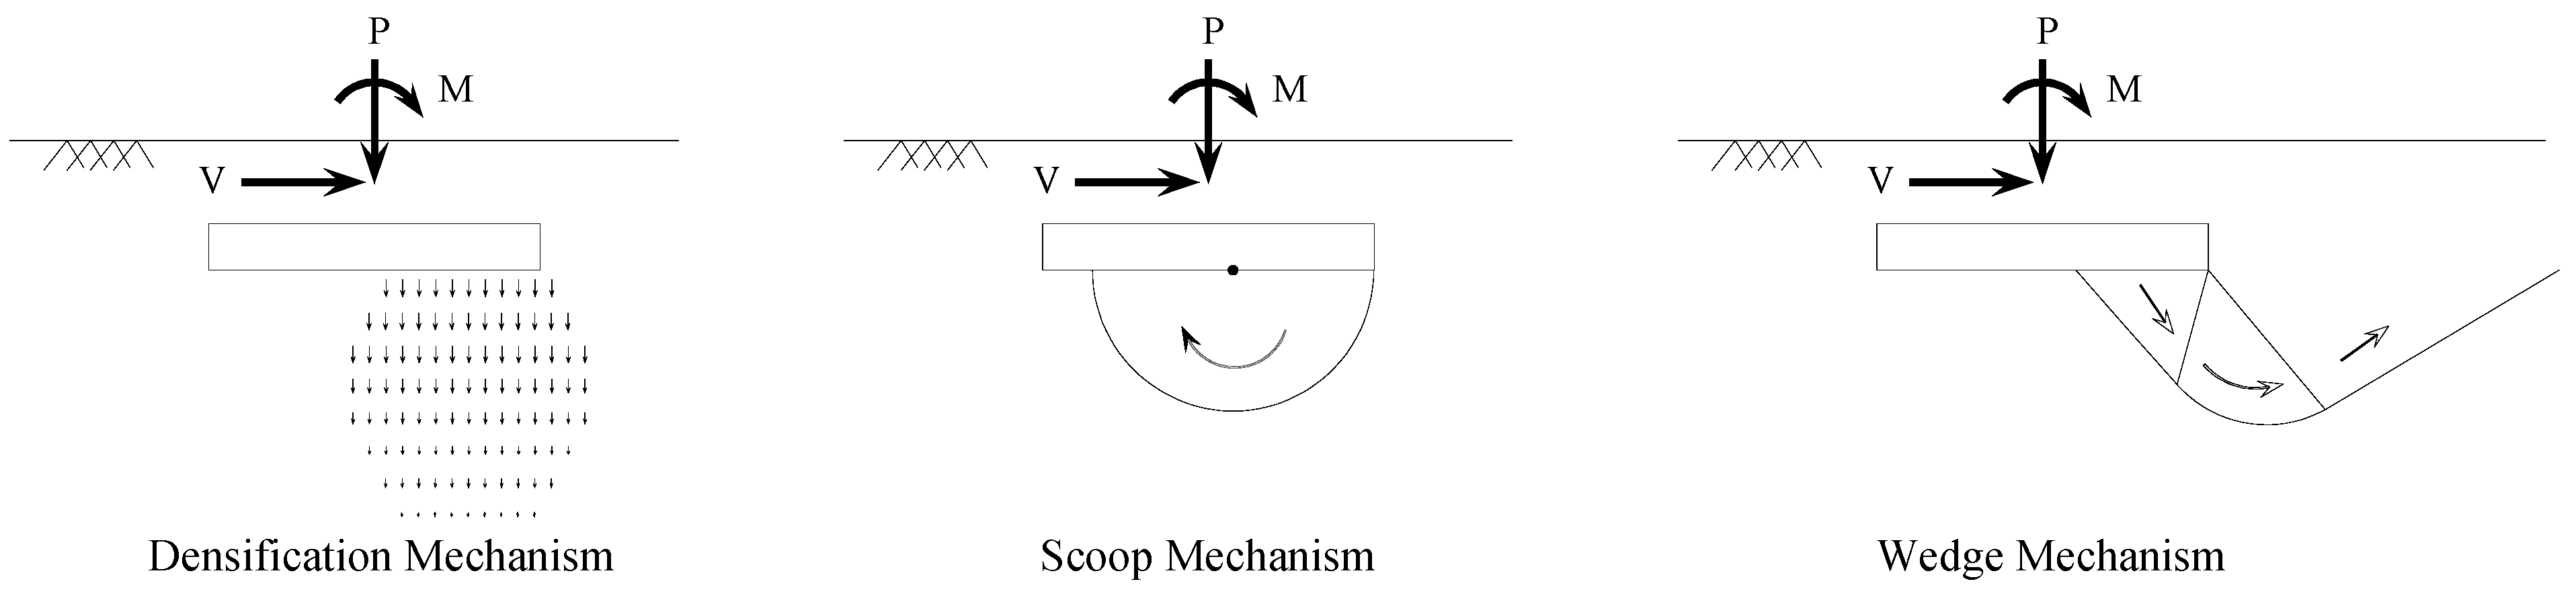
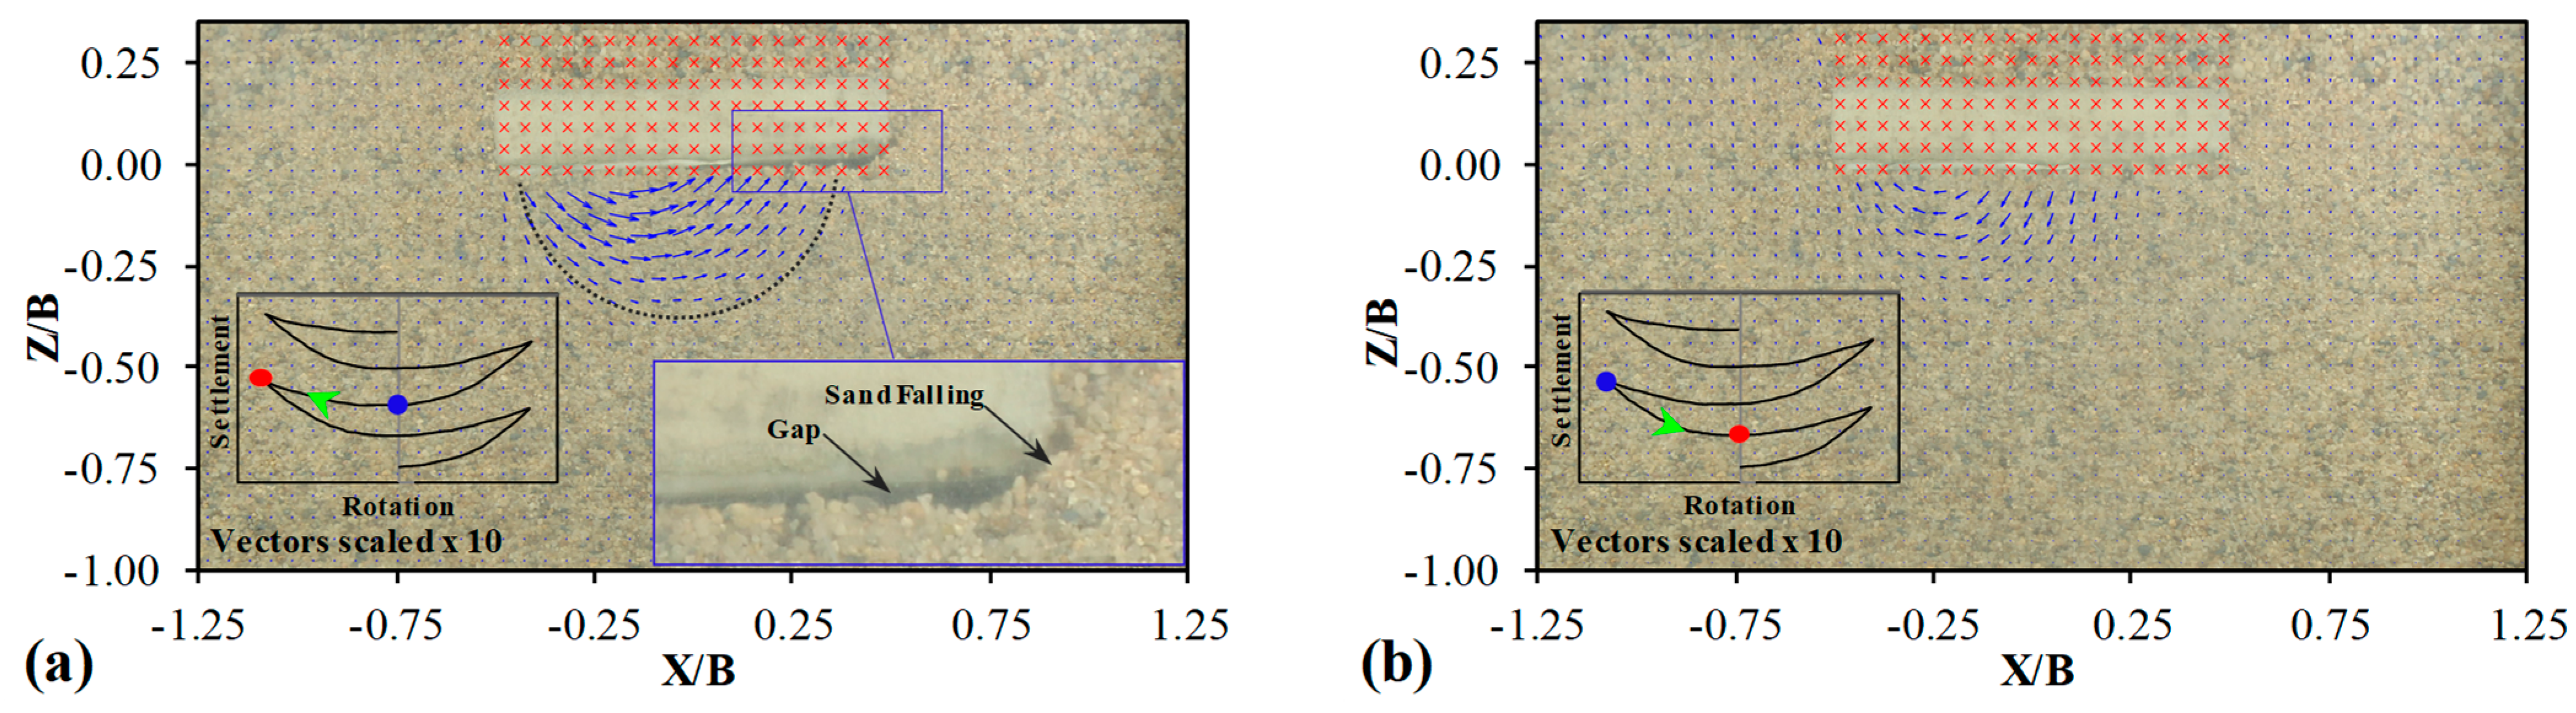
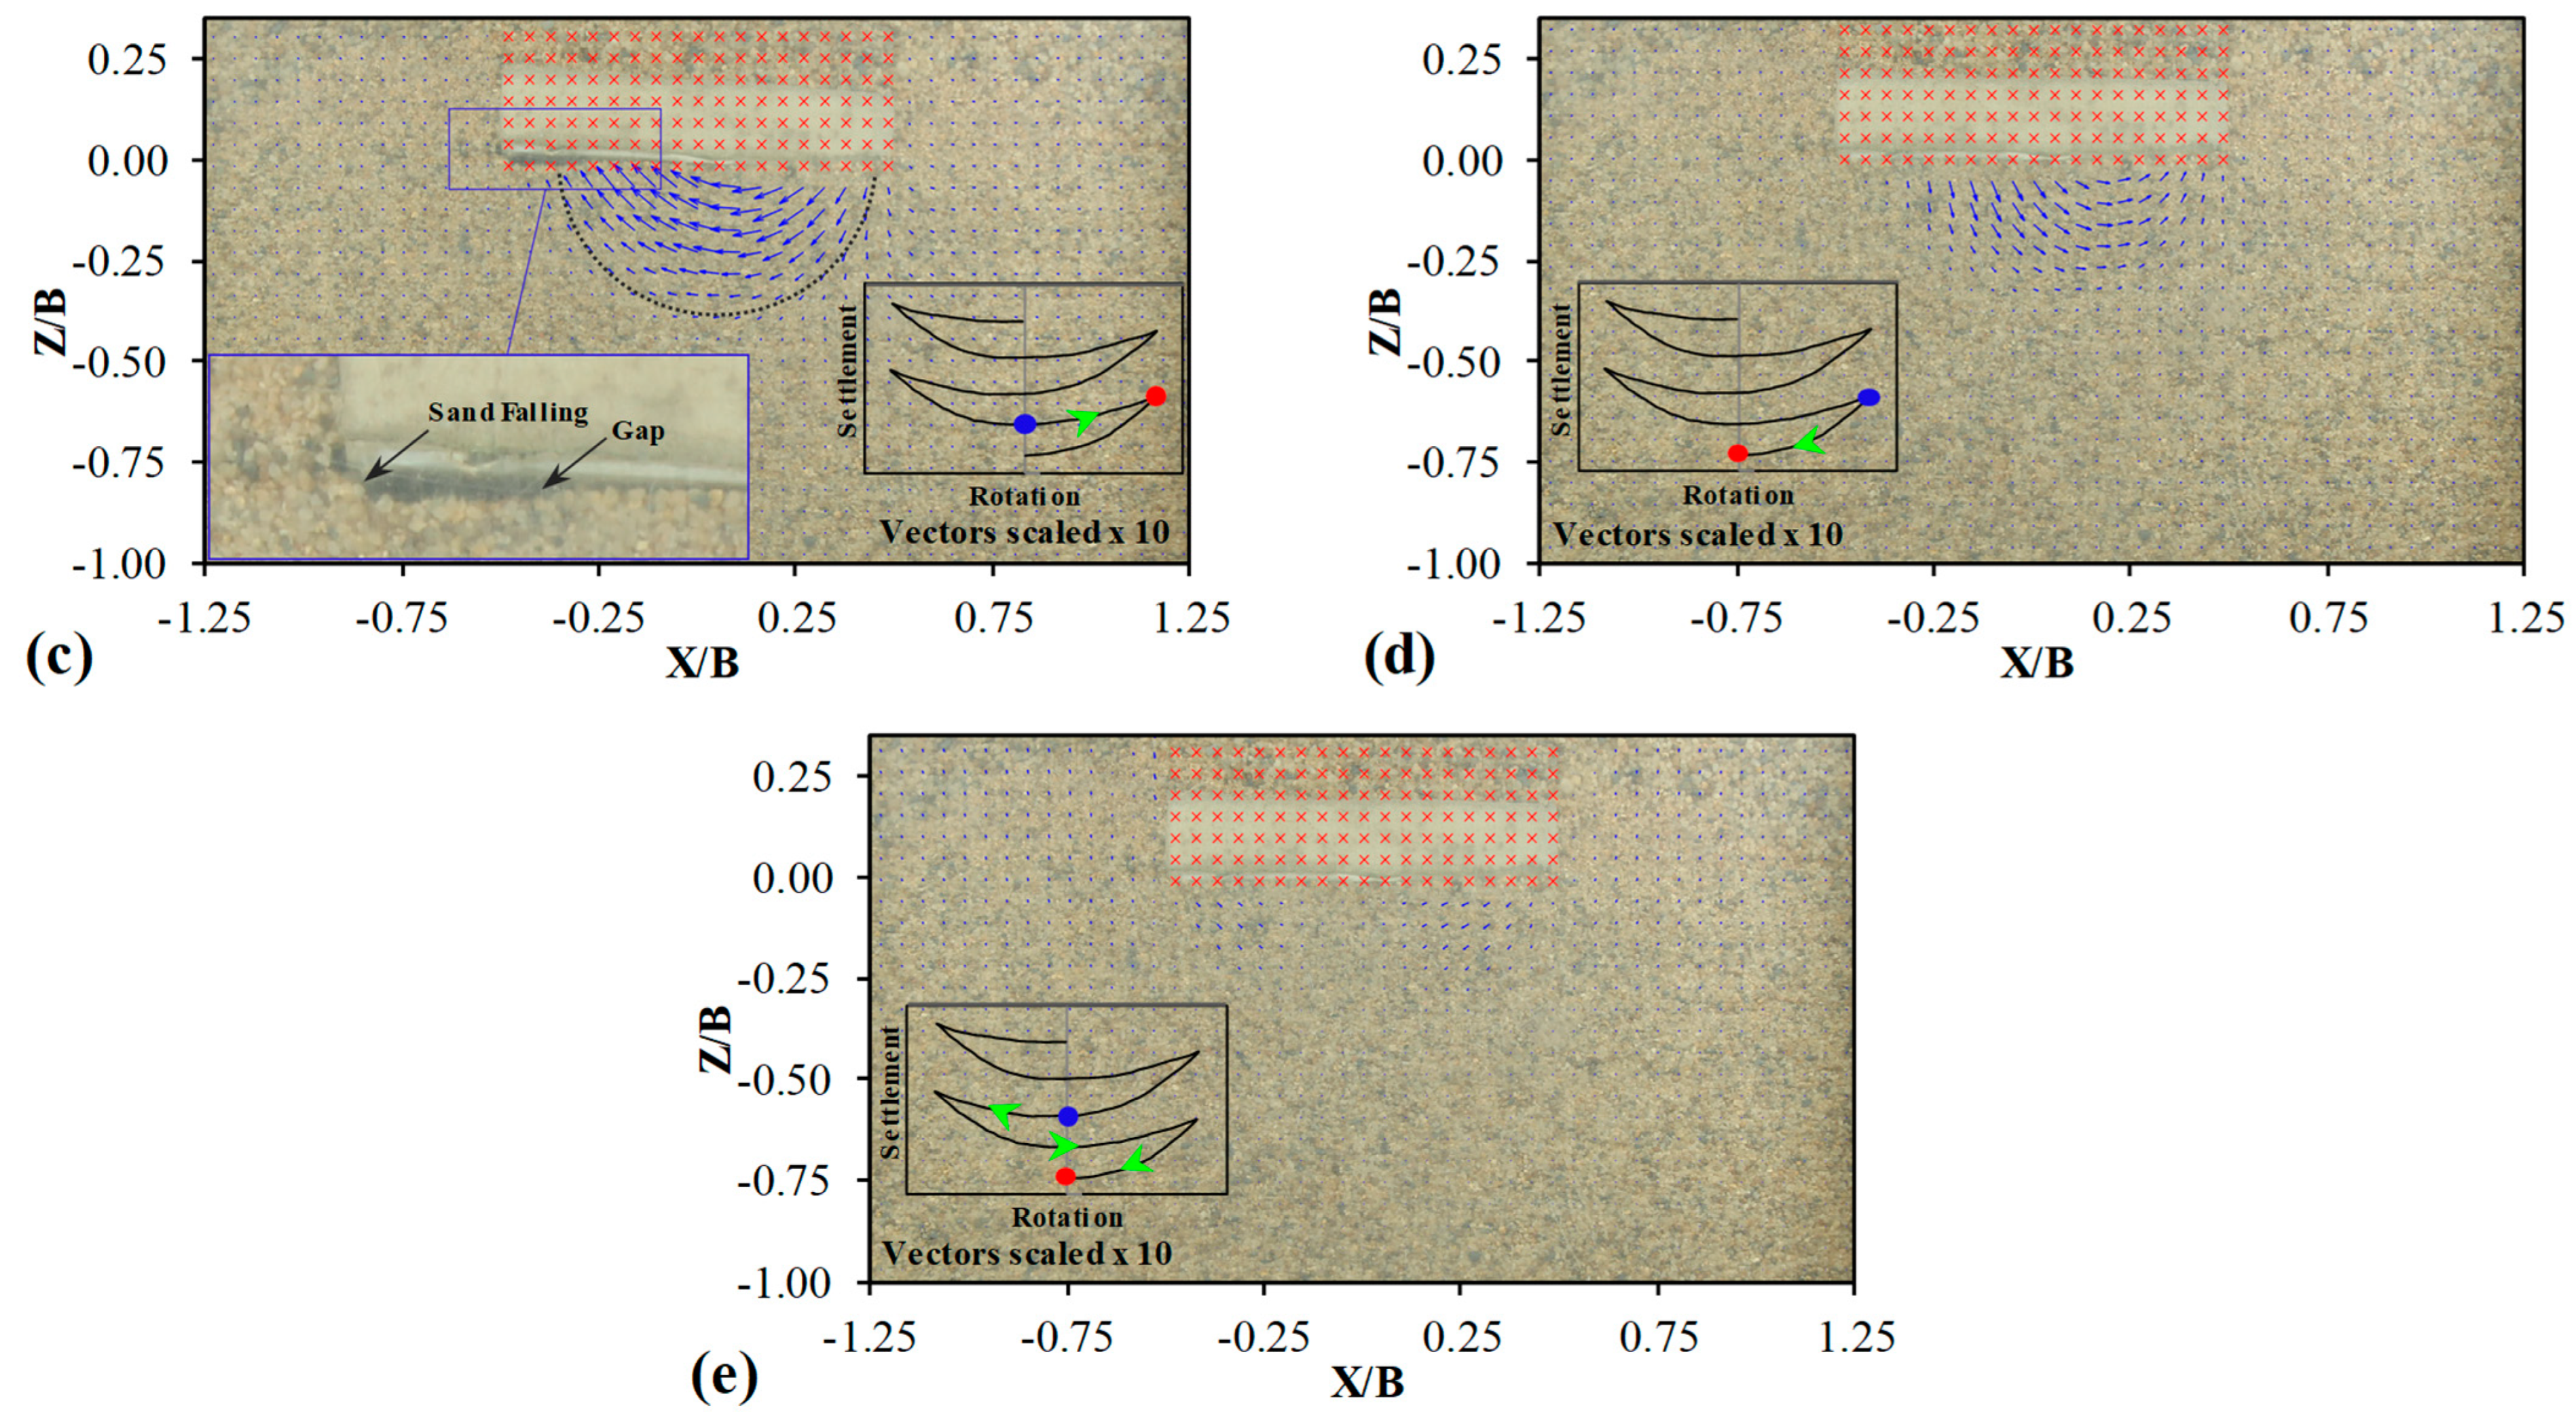
The soil deformation mechanisms during the quarter loading cycles include densification beneath the toe (loaded edge), outward wedge deformation, and scoop beneath the foundation.
As a foundation’s embedment depth increases, the outward wedge deformation mechanism becomes more restricted. In experiments with an embedment depth of B, soil movement from beneath the foundation is minimal. In contrast, for surface foundations, both outward wedge deformation and toe densification occur simultaneously, leading to greater foundation settlement.
The final settlement of the foundation stems from two mechanisms: soil densification beneath the foundation during loading and unloading quarter cycles, and soil escape from beneath the foundation during loading quarter cycles. As embedment depth increases, the influence of the soil escape mechanism diminishes. Although the scoop mechanism may fully develop, it does not significantly impact the final settlement. However, it can absorb considerable energy during rocking motions by creating a slip surface and inducing substantial soil displacement.
The moment capacity of the foundation increases with embedment depth due to passive and active soil pressure acting in front of and behind the foundation’s thickness, the weight of the overlying soil, and shear effects from the side faces in contact with the soil.
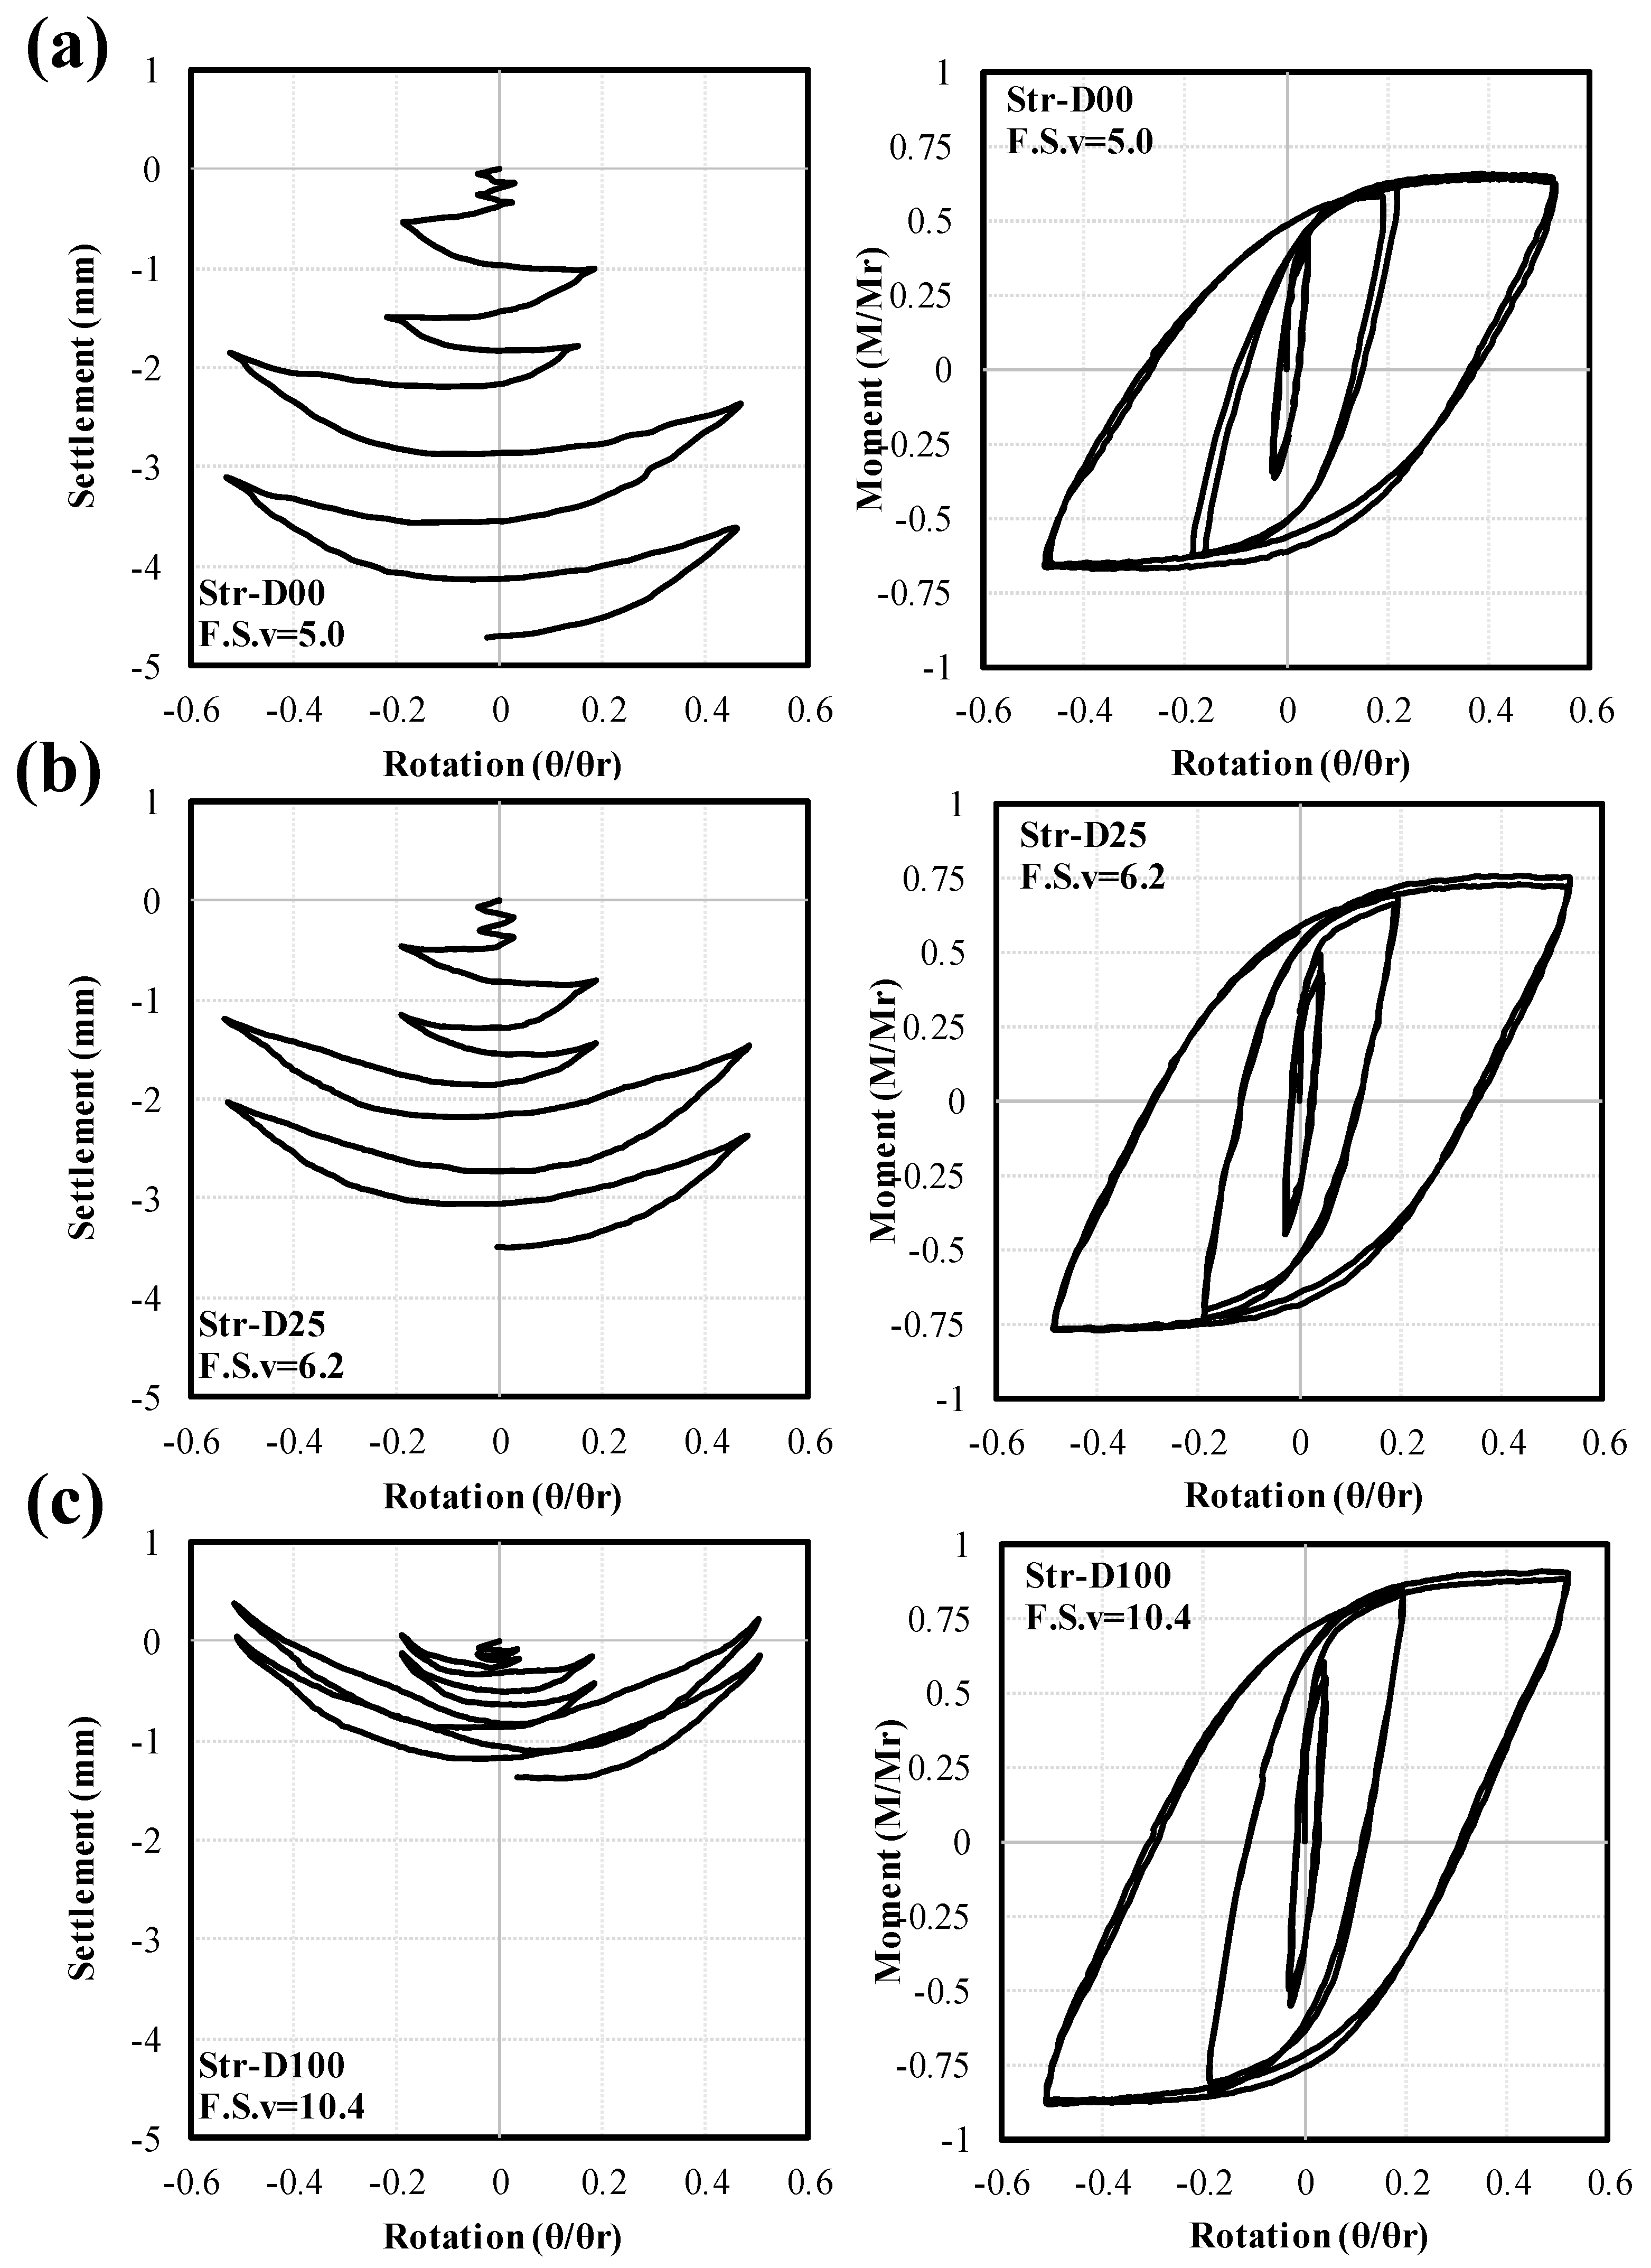
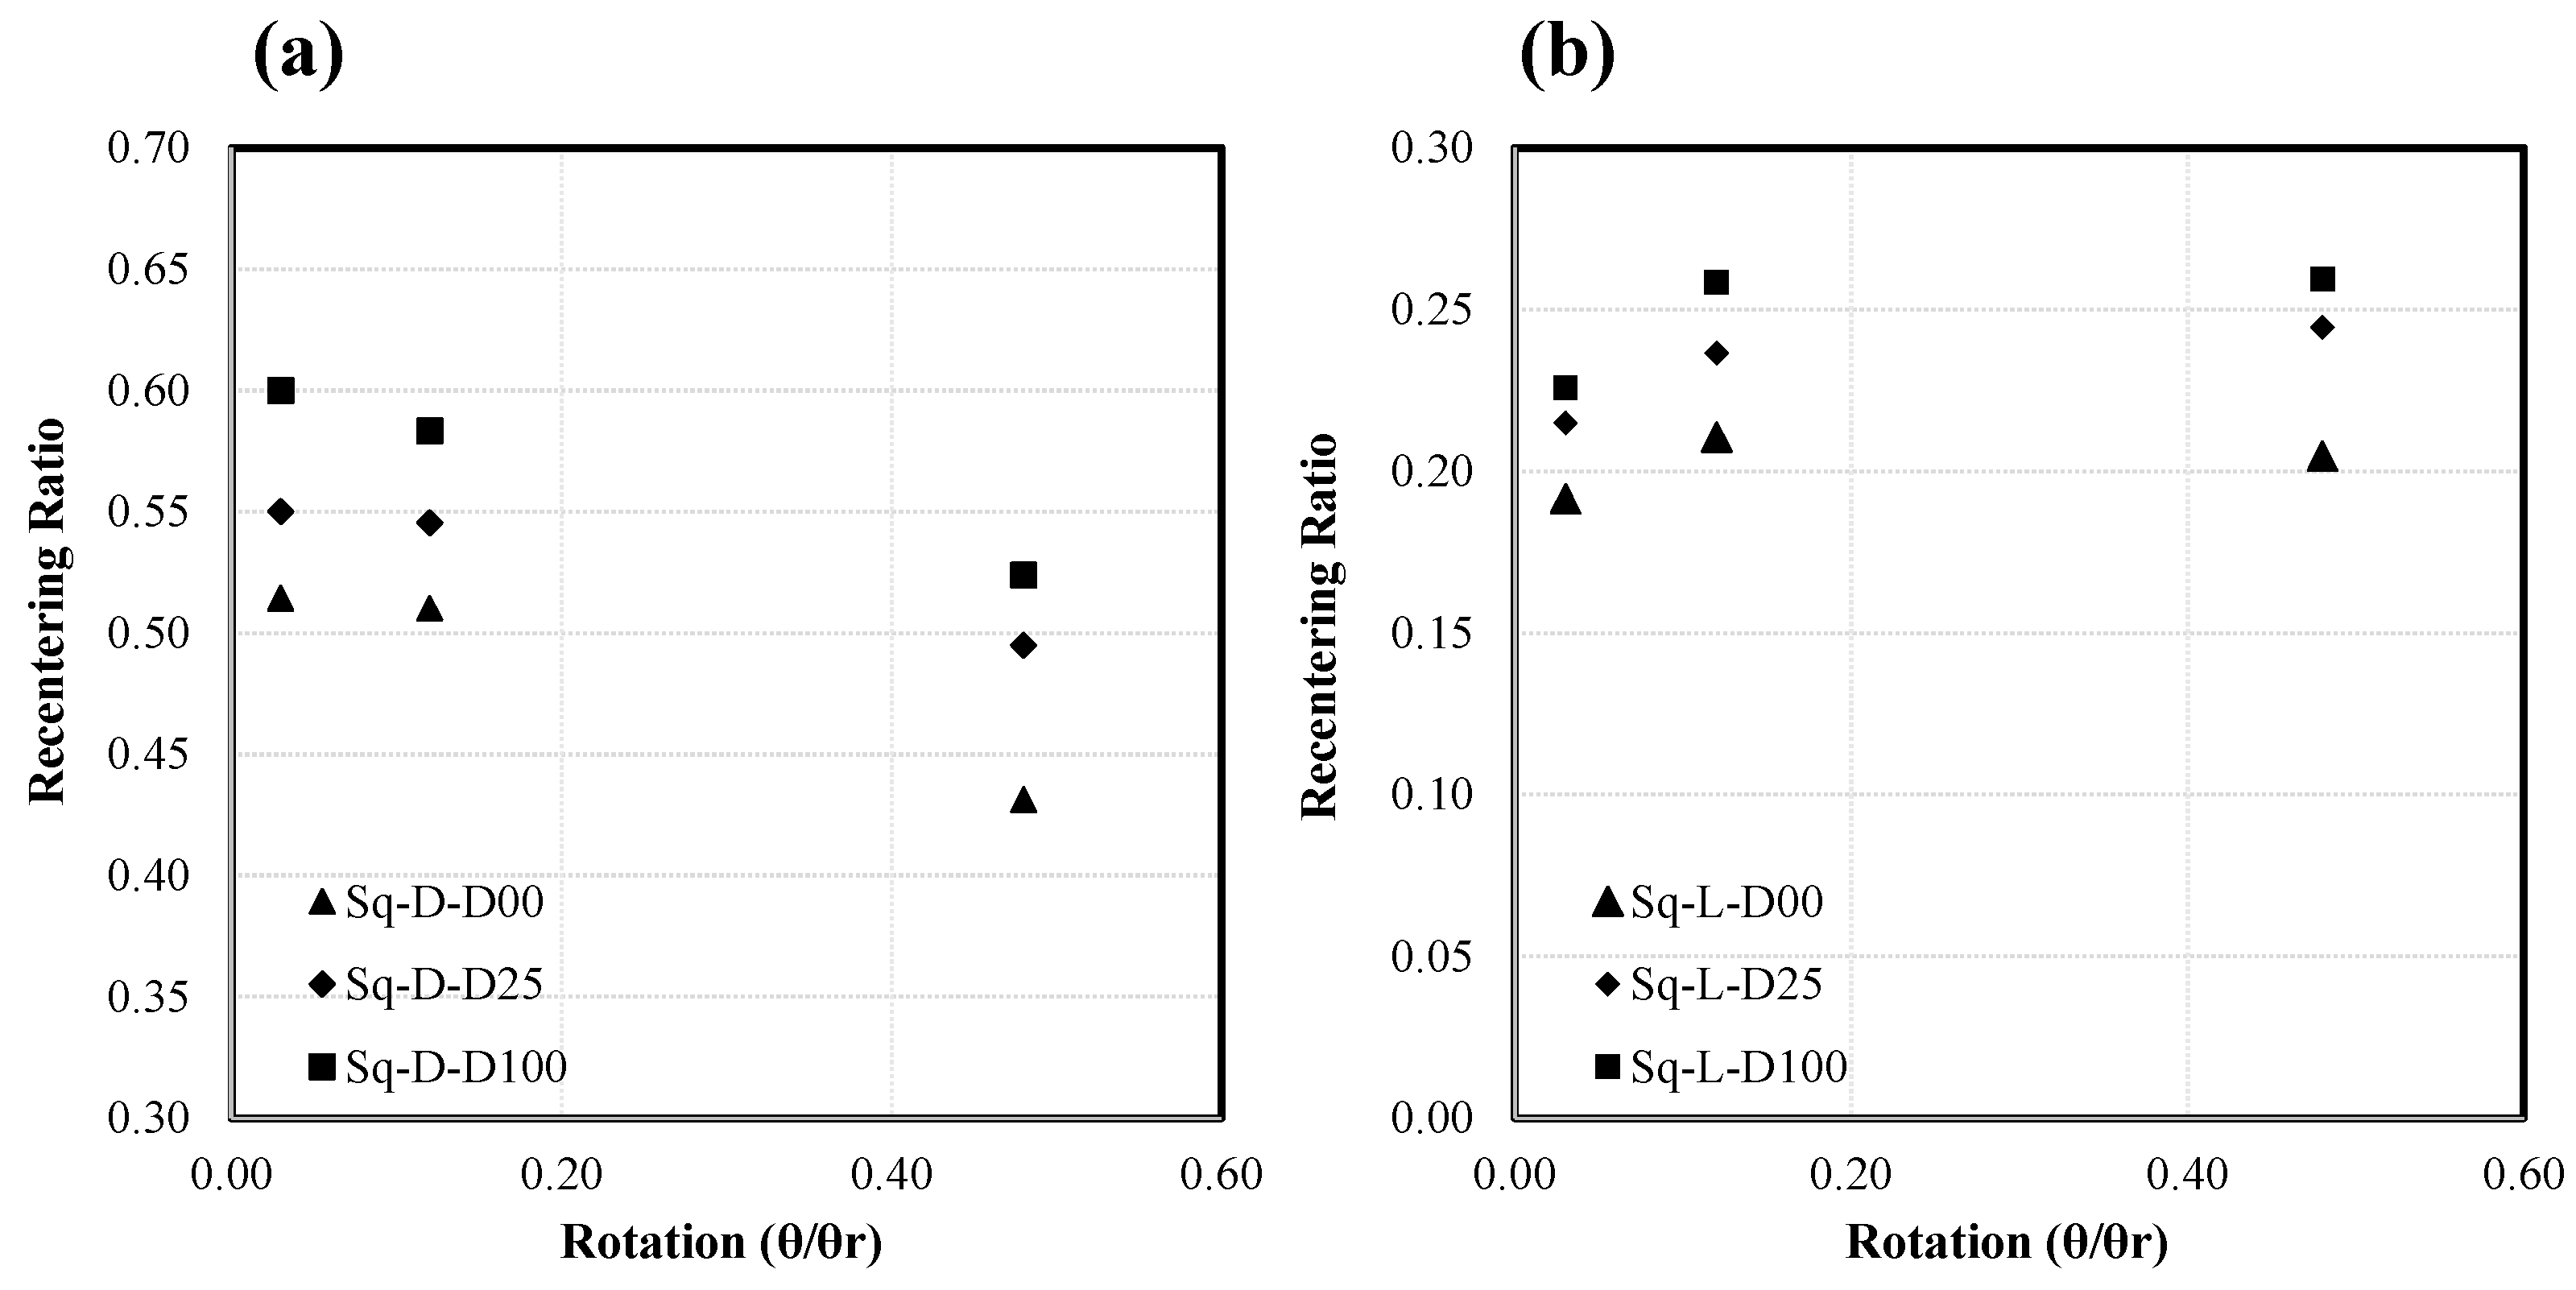
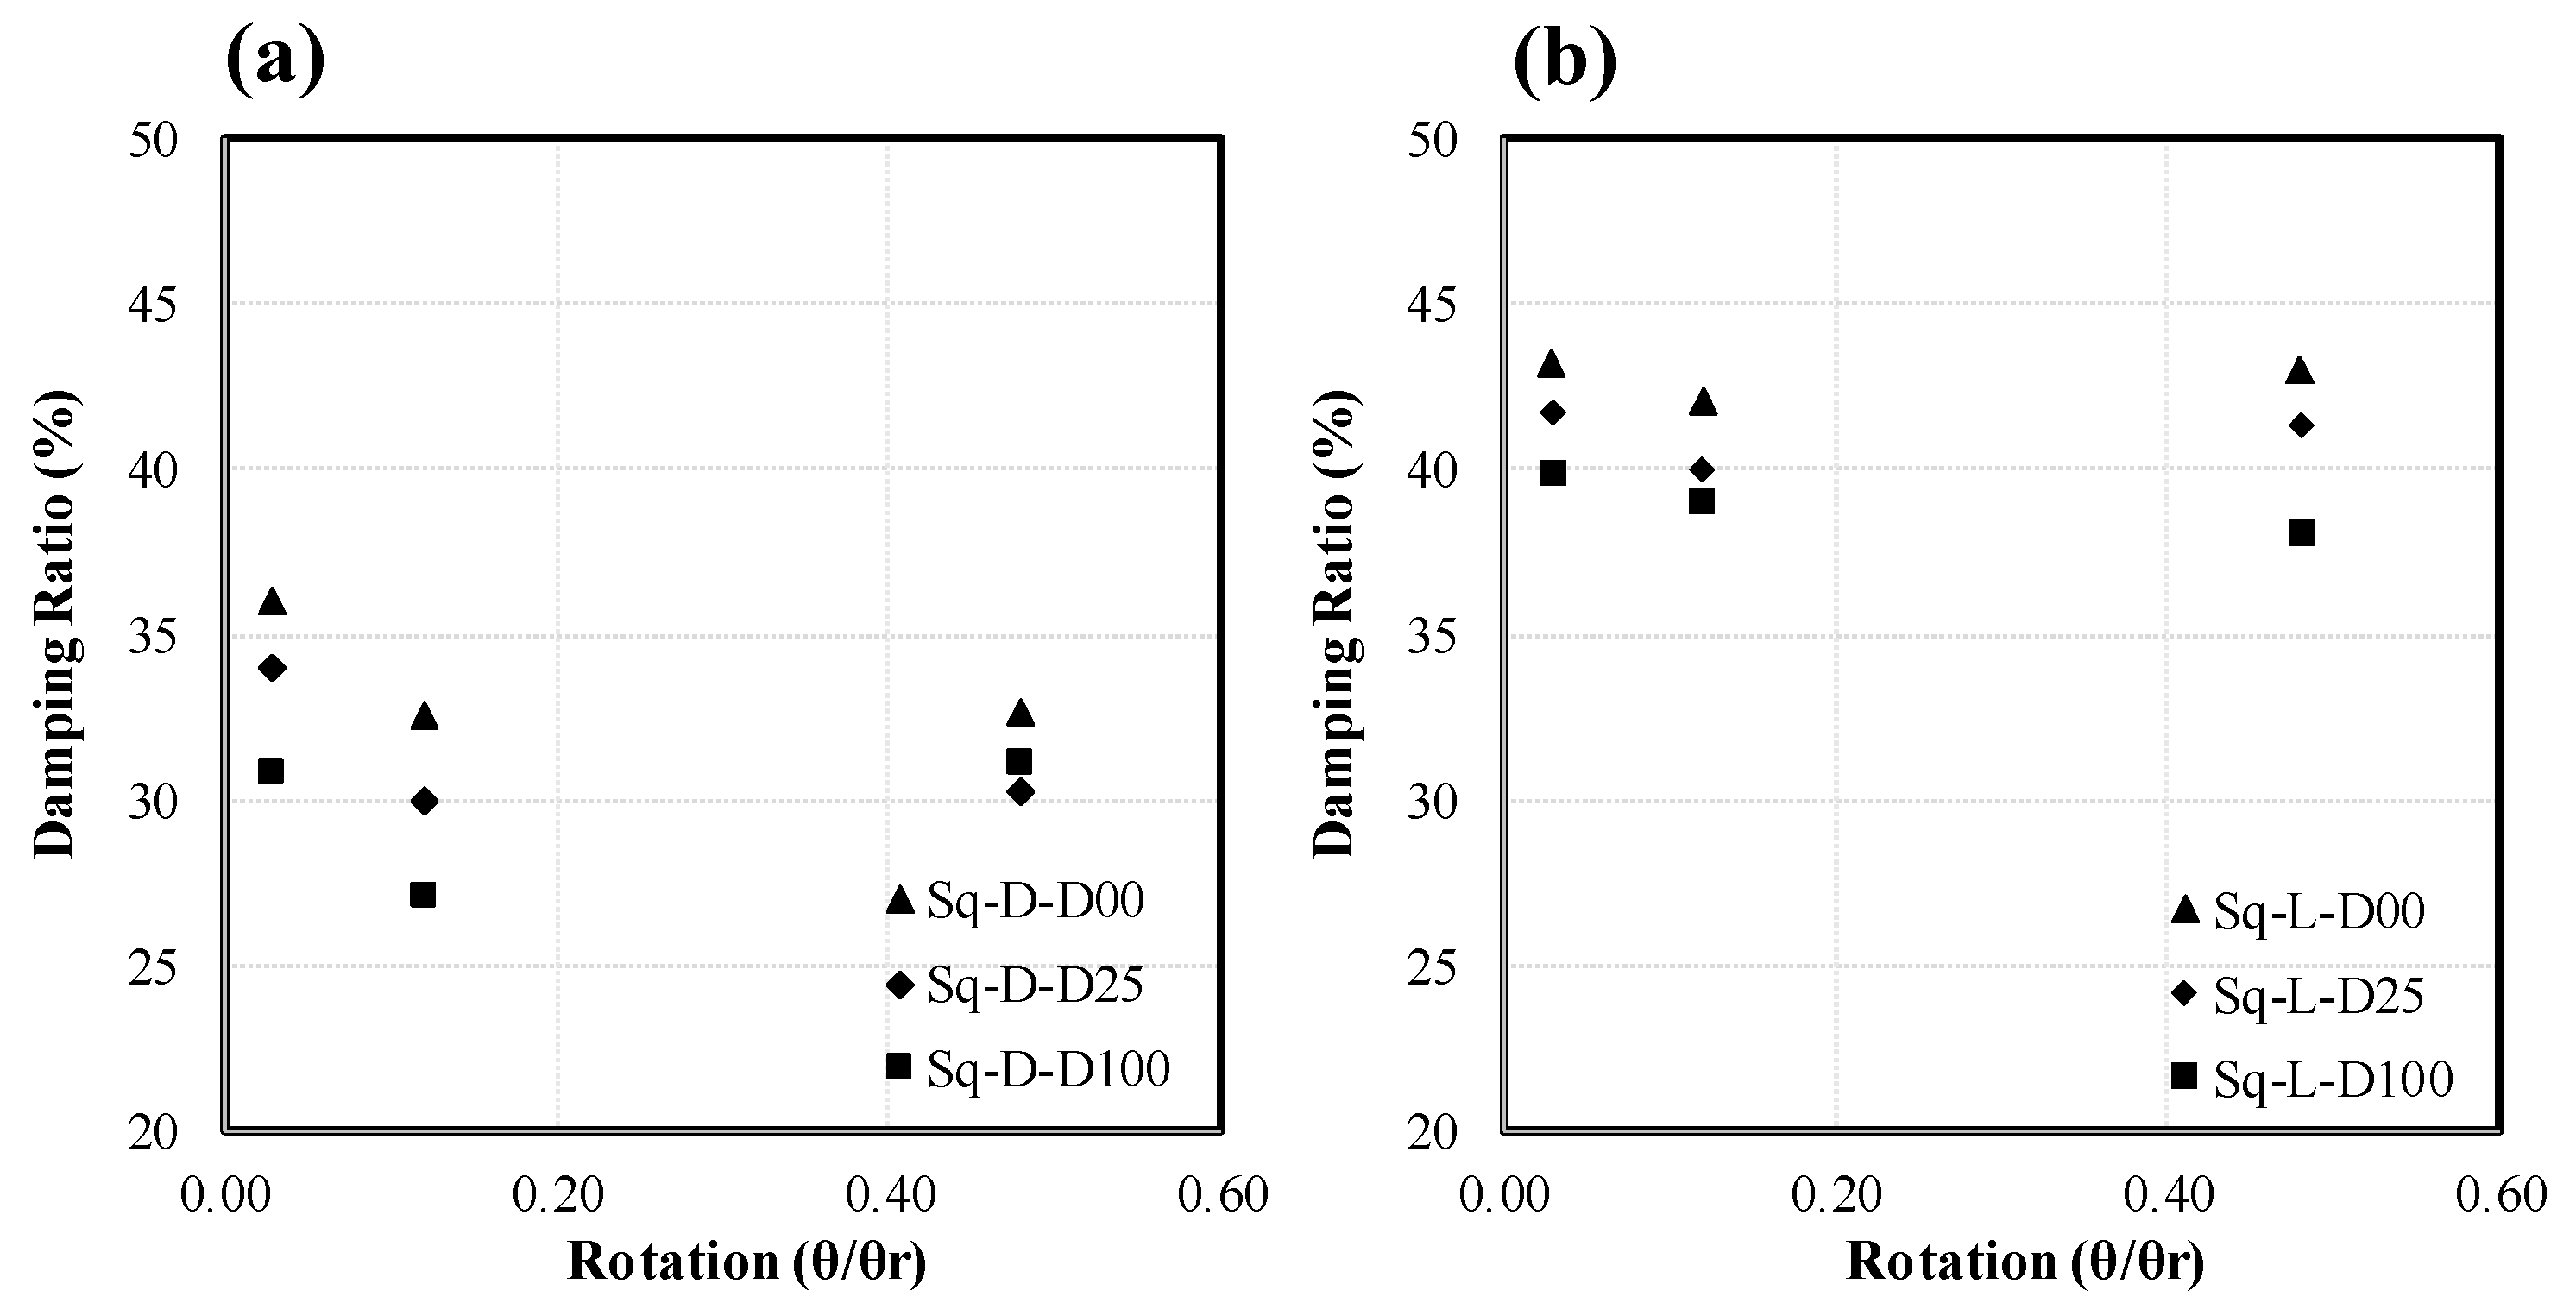
As the foundation’s factor of safety and embedment depth increase, the moment–rotation curves become narrower and more S-shaped, resulting in greater recentering and reduced damping.
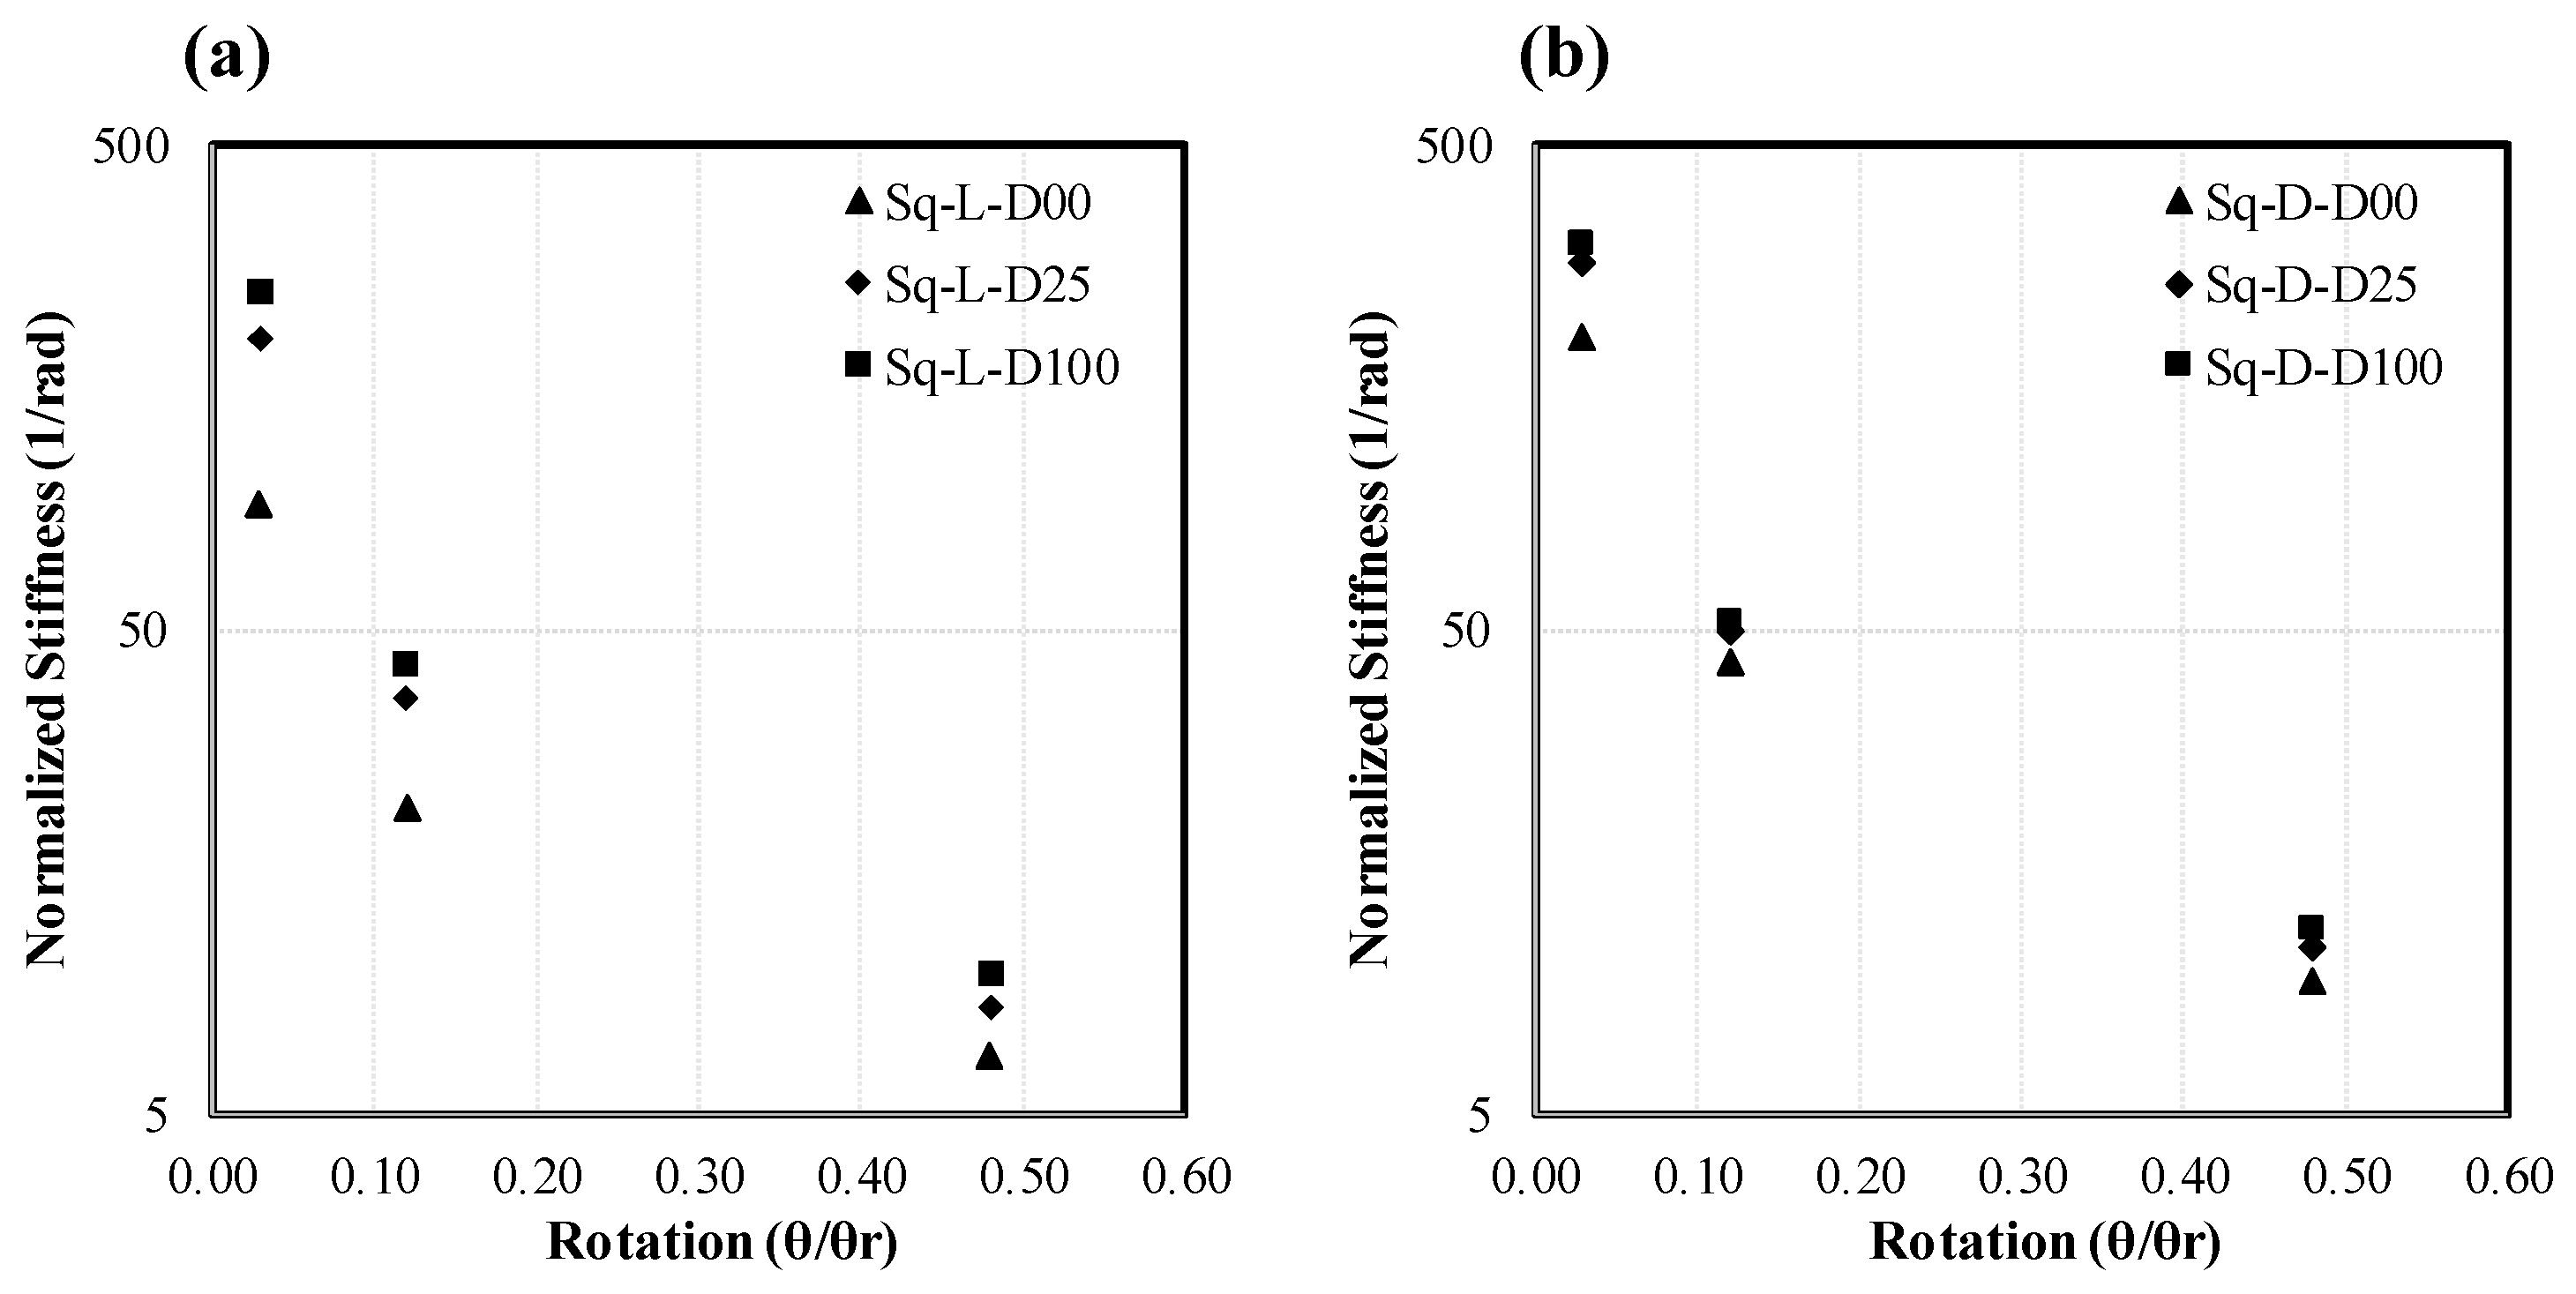
As the foundation’s factor of safety and embedment depth increase, the rocking stiffness of the foundation also rises, attributed to the enhanced moment capacity.
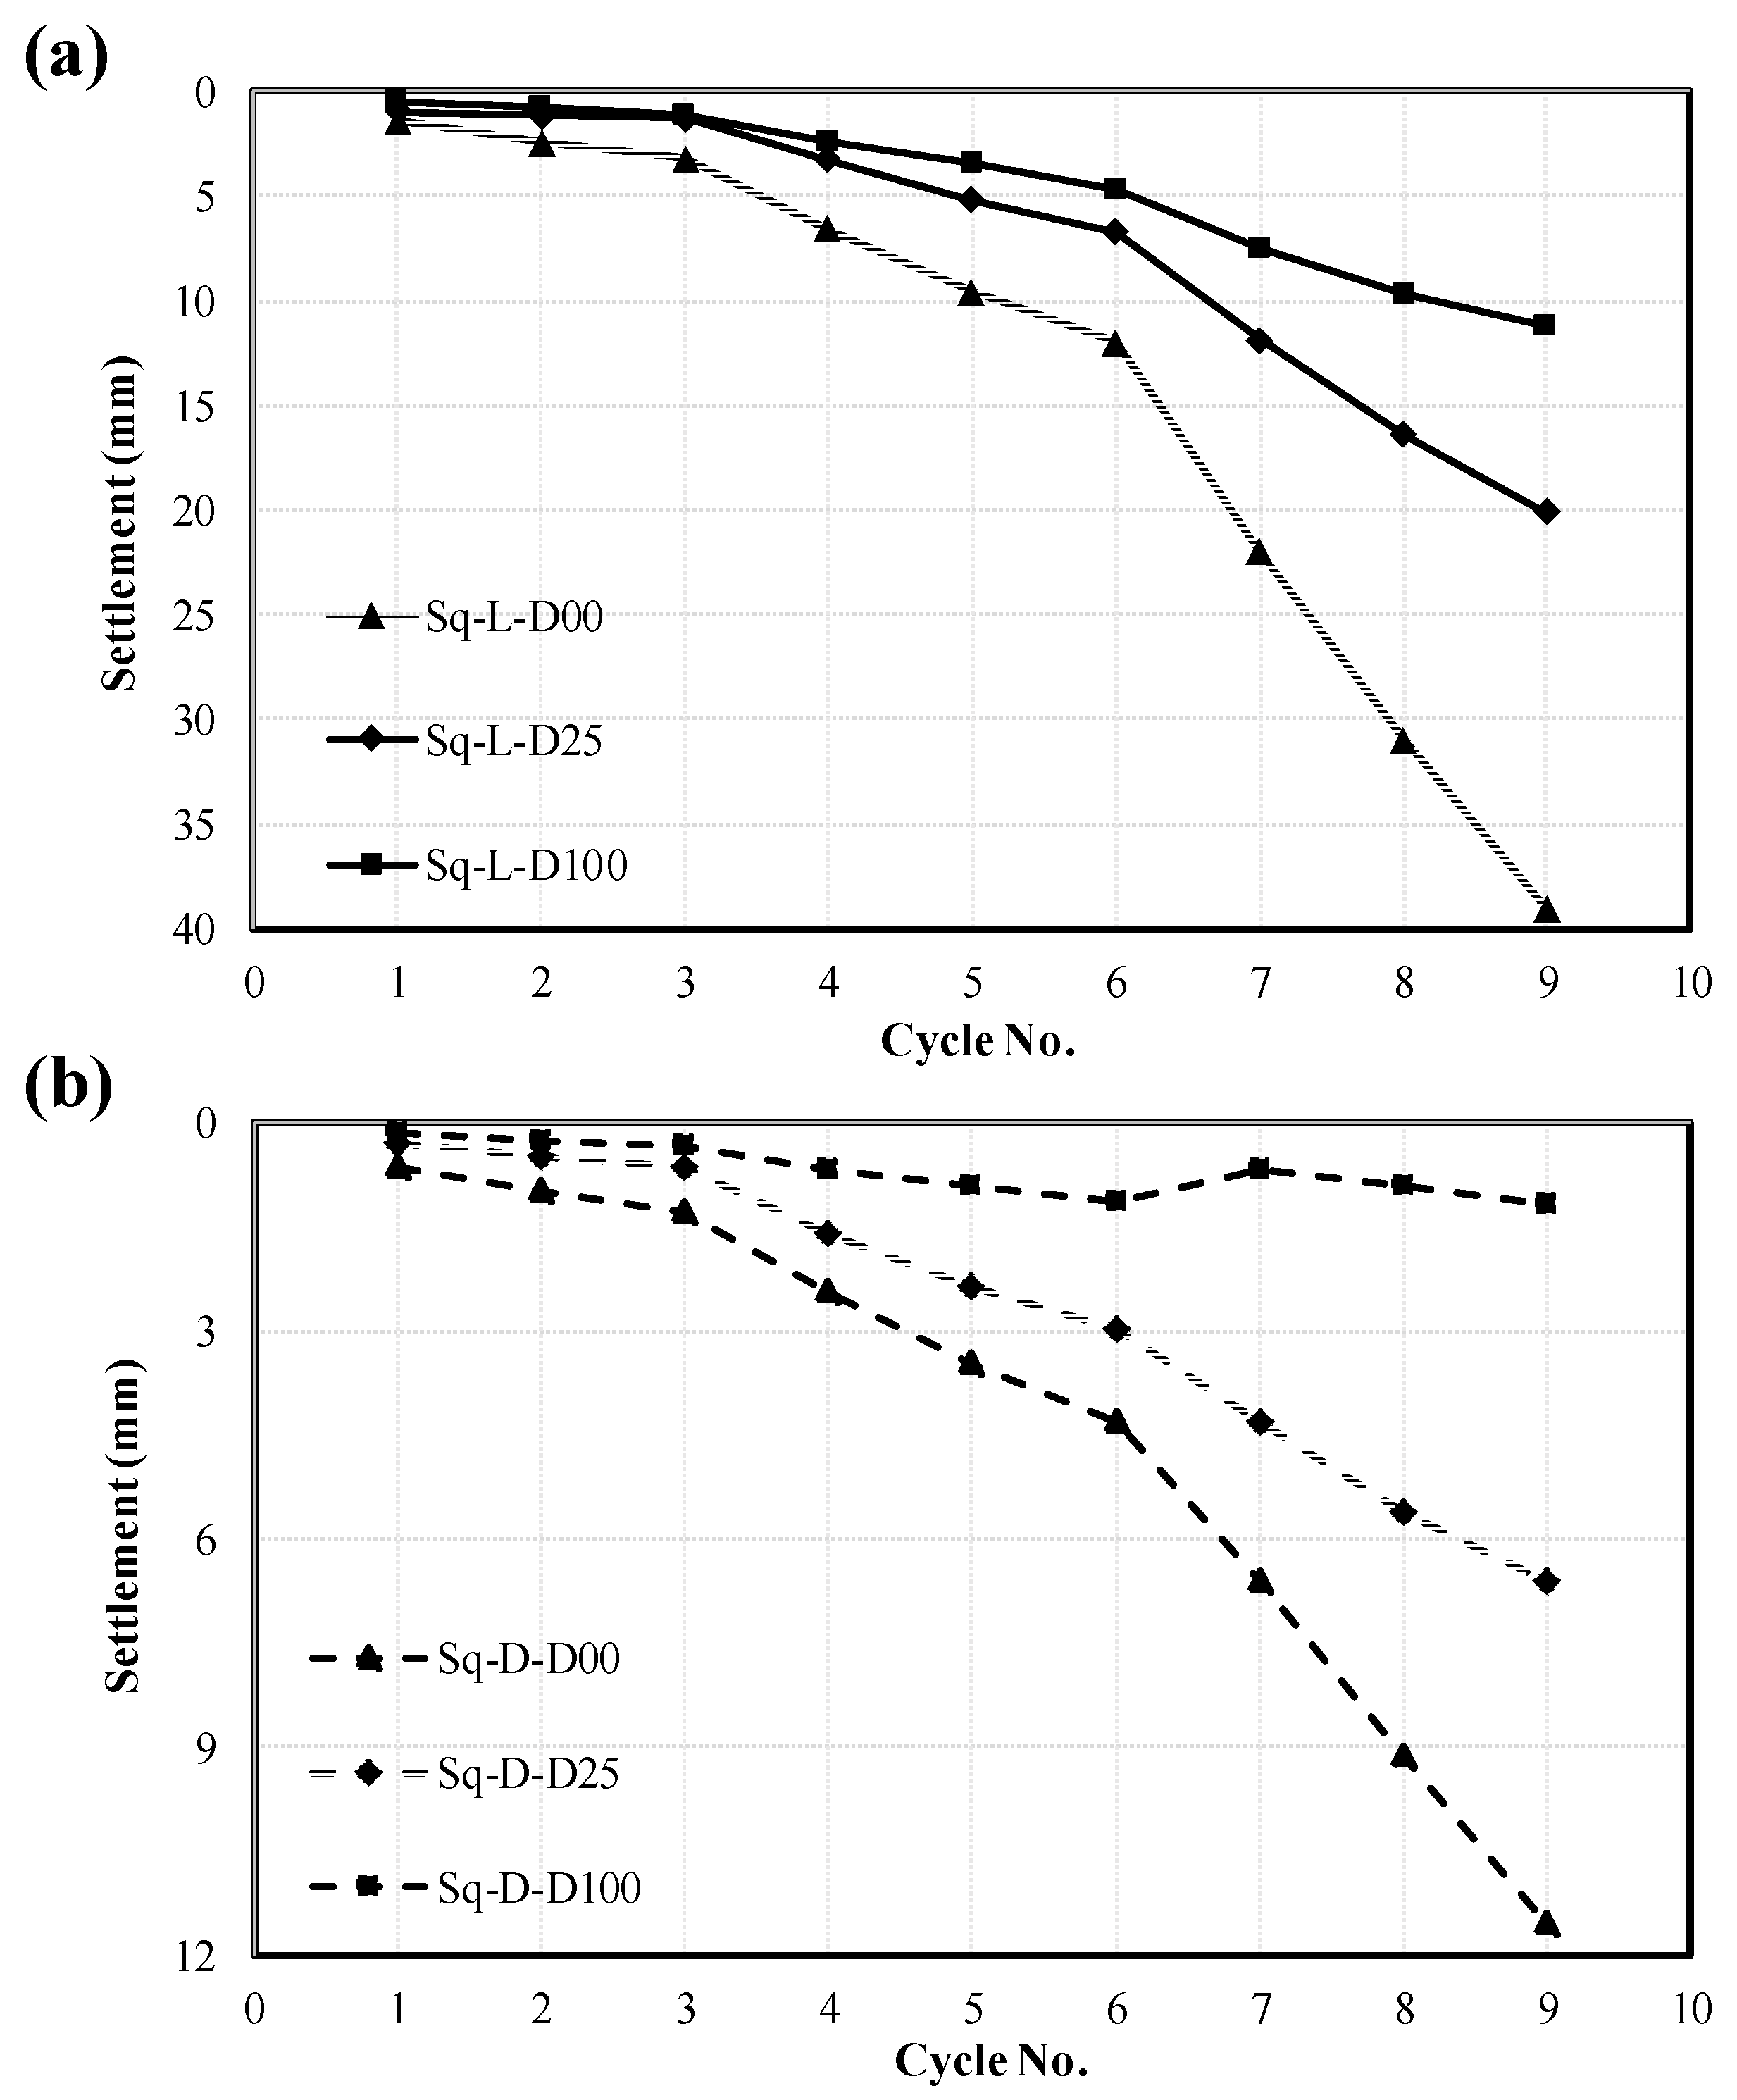
As the foundation’s factor of safety and embedment depth increase, settlement during loading cycles decreases. This reduction is primarily due to the restriction of the outward wedge deformation mechanism of the soil mass.

Author Contributions

Conceptualization, M.M., A.K. and S.M.M.M.H.; methodology, M.M., A.K. and S.M.M.M.H.; software, M.M.; formal analysis, M.M. and A.K.; investigation, M.M. and A.K.; resources, S.M.M.M.H. and D.L.; data curation, M.M., A.K. and H.P.; writing—original draft preparation, M.M. and A.K.; writing—review and editing, M.M., S.M.M.M.H. and D.L.; visualization, A.K. and H.P.; supervision, S.M.M.M.H. and D.L. All authors have read and agreed to the published version of the manuscript.

Funding

This work was supported by the Human Resources Development of the Korea Institute of Energy Technology Evaluation and Planning (KETEP) grant funded by the Korea government Ministry of Trade, Industry & Energy (No. 20214000000180).

Data Availability Statement

The data presented in this study are available upon request from the corresponding author. The data is not publicly available for privacy reasons.

Conflicts of Interest

The authors declare no conflicts of interest.

References

  1. Kokkali, P.; Abdoun, T.; Anastasopoulos, I. Centrifuge modeling of rocking foundations on improved soil. J. Geotech. Geoenviron. Eng. 2015, 141, 04015041. [Google Scholar] [CrossRef]
  2. Kutter, B.L.; Deng, L.; Kunnath, S. Estimation of Displacement Demand for Seismic Design of Bridges with Rocking Shallow Foundations; Missouri University of Science and Technology: St. Rolla, MO, USA, 2010. [Google Scholar]
  3. Deng, L.; Bruce, L.K.; Kunnath, S. Seismic design of rocking shallow foundations: Displacement-based methodology. J. Bridge Eng. 2014, 19, 04014043. [Google Scholar] [CrossRef]
  4. Antonellis, G.; Gavras, A.G.; Panagiotou, M.; Kutter, B.L.; Guerrini, G.; Sander, A.C.; Fox, P.J. Shake table test of large-scale bridge columns supported on rocking shallow foundations. J. Geotech. Geoenviron. Eng. 2015, 141, 04015009. [Google Scholar] [CrossRef]
  5. American Society of Civil Engineers. Seismic Evaluation and Retrofit of Existing Buildings; American Society of Civil Engineers: Reston, VA, USA, 2014. [Google Scholar]
  6. Kutter, B.L.; Moore, M.; Hakhamaneshi, M.; Champion, C. Rationale for shallow foundation rocking provisions in ASCE 41-13. Earthq. Spectra 2016, 32, 1097–1119. [Google Scholar]
  7. Hakhamaneshi, M.; Kutter, B.L.; Moore, M.; Champion, C. Validation of ASCE 41-13 modeling parameters and acceptance criteria for rocking shallow foundations. Earthq. Spectra 2016, 32, 1121–1140. [Google Scholar] [CrossRef]
  8. Kelly, T.E. Tentative seismic design guidelines for rocking structures. Bull. N. Z. Soc. Earthq. Eng. 2009, 42, 239–274. [Google Scholar] [CrossRef]
  9. Kourkoulis, R.; Gelagoti, F.; Anastasopoulos, I. Rocking isolation of frames on isolated footings: Design insights and limitations. J. Earthq. Eng. 2012, 16, 374–400. [Google Scholar] [CrossRef]
  10. Gelagoti, F.; Kourkoulis, R.; Anastasopoulos, I.; Gazetas, G. Rocking Isolation of Low-Rise Frame Structures Founded on Isolated Footings. Earthq. Eng. Struct. Dyn. 2013, 41, 1177–1197. [Google Scholar] [CrossRef]
  11. Liu, W.; Hutchinson, T.C.; Kutter, B.L.; Hakhamaneshi, M.; Aschheim, M.A.; Kunnath, S.K. Demonstration of Compatible Yielding between Soil-Foundation and Superstructure Components. J. Struct. Eng. 2013, 139, 1408–1420. [Google Scholar] [CrossRef]
  12. Liu, W. Balancing the Beneficial Contributions of Foundation Rocking and Structural Yielding in Moment-Frame and Fram-wall Building Systems. Ph.D. Dissertation, University of California, San Diego, CA, USA, 2014. [Google Scholar]
  13. Ajaei, B.B.; El Naggar, M.H. Re-purposing of shallow wind turbine foundations for power capacity increase. Soil Dyn. Earthq. Eng. 2023, 171, 107959. [Google Scholar] [CrossRef]
  14. Ifeobu, C.U.; Abadie, C.N.; Haigh, S. Cyclic response of shallow onshore wind turbine foundations in dense sand. In Proceedings of the 5th International Conference on Geotechnics for Sustainable Infrastructure Development, Hanoi, Vietnam, 14–15 December 2023. [Google Scholar]
  15. Wang, L.; Ishihara, T. A study of the effects of foundation uplift on the seismic loading of wind turbine tower and shallow foundation using a new dynamic Winkler model. Eng. Struct. 2020, 219, 110745. [Google Scholar] [CrossRef]
  16. DNVGL-ST-0126; Support Structures for Wind Turbines. DNV GL: Oslo, Norway, 2018.
  17. IEC 61400-6:2020; Wind Energy Generation Systems—Part 6: Tower and Foundation Design Requirements. International Electrotechnical Commission: Geneva, Switzerland, 2020.
  18. Gajan, S. Data-Driven Modeling of Peak Rotation and Tipping-Over Stability of Rocking Shallow Foundations Using Machine Learning Algorithms. Geotechnics 2022, 2, 781–801. [Google Scholar] [CrossRef]
  19. Anastasopoulos, I.; Kourkoulis, R.; Gelagoti, F.; Papadopoulos, E. Rocking response of SDOF systems on shallow improved sand: An experimental study. Soil Dyn. Earthq. Eng. 2012, 40, 15–33. [Google Scholar] [CrossRef]
  20. Asli, M.S.; Hosseini, S.M.M.M.; Jahanirad, A. Effect of soil reinforcement on rocking isolation potential of high-rise bridge foundations. Soil Dyn. Earthq. Eng. 2018, 115, 142–155. [Google Scholar] [CrossRef]
  21. Arabpanahan, M.; Mirghaderi, S.R.; Hosseini, A.; Ghalandarzadeh, A. Dynamic rocking response of “SDOF-embedded foundation” systems using shake table experiments. Soil Dyn. Earthq. Eng. 2021, 140, 106431. [Google Scholar] [CrossRef]
  22. Zeng, X.; Steedma, R.S. Bearing capacity failure of shallow foundations in earthquakes. Geotechnique 1998, 48, 235–256. [Google Scholar] [CrossRef]
  23. Gajan, S.; Kutter, B.L. Capacity, settlement, and energy dissipation of shallow footings subjected to rocking. J. Geotech. Geoenviron. Eng. 2008, 134, 1129–1141. [Google Scholar] [CrossRef]
  24. Loli, M.; Knappett, J.A.; Brown, M.J.; Anastasopoulos, I.; Gazetas, G. Centrifuge modeling of rocking-isolated inelastic RC bridge piers. Earthq. Eng. Struct. Dyn. 2014, 43, 2341–2359. [Google Scholar] [CrossRef]
  25. Newgard, J.; Hewitt, J.; Foster, T.; Hutchinson, T.; McCartney, J. Rocking Foundations on Geosynthetic-Improved Sand. In E3S Web of Conferences; EDP Sciences: Les Ulis, France, 2024; Volume 569, p. 10001. [Google Scholar] [CrossRef]
  26. Allmond, J.D.; Kutter, B.L. Design considerations for rocking foundations on unattached piles. J. Geotech. Geoenviron. Eng. 2014, 140, 04014058. [Google Scholar] [CrossRef]
  27. Ko, K.W.; Ha, J.G.; Park, H.J.; Kim, D.S. Centrifuge modeling of improved design for rocking foundation using short piles. J. Geotech. Geoenviron. Eng. 2019, 145, 04019031. [Google Scholar] [CrossRef]
  28. Guan, Z.; Chen, X.; Li, J. Experimental investigation of the seismic performance of bridge models with conventional and rocking pile group foundations. Eng. Struct. 2018, 168, 889–902. [Google Scholar] [CrossRef]
  29. Khosravi, M.; Boulanger, R.W.; Wilson, D.W.; Olgun, C.G.; Tamura, S.; Wang, Y. Dynamic Centrifuge Tests of Structures with Shallow Foundations on Soft Clay Reinforced by Soil-Cement Grids. Soils Found. 2017, 57, 501–513. [Google Scholar] [CrossRef]
  30. Ko, K.-W.; Ha, J.-G.; Park, H.-J.; Kim, D.-S. Soil-rounding effect on embedded rocking foundation via horizontal slow cyclic tests. J. Geotech. Geoenviron. Eng. 2018, 144, 04018004. [Google Scholar] [CrossRef]
  31. Hakhamaneshi, M.; Kutter, B.L. Effect of footing shape and embedment on the settlement, recentering, and energy dissipation of shallow footings subjected to rocking. J. Geotech. Geoenviron. Eng. 2016, 142, 04016070. [Google Scholar] [CrossRef]
  32. Sharma, K.; Deng, L. Field testing of rocking foundations in cohesive soil: Cyclic performance and footing mechanical response. Can. Geotech. J. 2020, 57, 828–839. [Google Scholar] [CrossRef]
  33. Mousavi, H.; Naseri, S.; Mir Mohammad Hosseini, S.M. Effect of embedment depth on the rocking isolation behavior of foundations: An experimental and numerical study. Arab. J. Geosci. 2022, 15, 286. [Google Scholar] [CrossRef]
  34. Esmatkhah Irani, A.; Hajialilue-Bonab, M.; Assadi-Langroudi, A.; Maleki Tabrizi, E. Pore-pressure-dependent performance of rocking foundations. Soil Dyn. Earthq. Eng. 2024, 183, 108772. [Google Scholar] [CrossRef]
  35. ASTM D-4253; Standard Test Methods for Maximum Index Density and Unit Weight of Soils Using a Vibratory Table. ASTM International: West Conshohocken, PA, USA, 2019.
  36. ASTM D-4254; Standard Test Methods for Minimum Index Density and Unit Weight of Soils and Calculation of Relative Density. ASTM International: West Conshohocken, PA, USA, 2016.
  37. Khezri, A.; Moradi, M.; Mir Mohammad Hosseini, S.M.; Park, H.; Lee, D. Effect of Footing Shape on the Rocking Behavior of Shallow Foundations. Buildings 2024, 14, 573. [Google Scholar] [CrossRef]
  38. Khezri, A.; Hosseini, S.M.M.M.; Moradi, M.; Maleki, M.; Rahmani, F. An experimental study on the rocking behavior of circular and square footings under slow-cyclic loading. Innov. Infrastruct. Solut. 2022, 7, 228. [Google Scholar] [CrossRef]
  39. Kokkali, P.; Anastasopoulos, I.; Abdoun, T.; Gazetas, G. Static and cyclic rocking on sand: Centrifuge versus reduced-scale 1 g experiments. In Geotechnical Earthquake Engineering: Géotechnique Symposium in Print 2015; ICE Publishing: London, UK, 2015. [Google Scholar]
  40. Gajan, S.; Kutter, B.L.; Phalen, J.D.; Hutchinson, T.C.; Martin, G.R. Centrifuge modeling of load-deformation behavior of rocking shallow foundations. Soil Dyn. Earthq. Eng. 2005, 25, 773–783. [Google Scholar] [CrossRef]
  41. Ko, K.W.; Ha, J.G.; Park, H.J.; Kim, D.S. Comparison between cyclic and dynamic rocking behavior for embedded shallow foundation using centrifuge tests. Bull. Earthq. Eng. 2018, 16, 5171–5193. [Google Scholar] [CrossRef]
  42. White, D.; Take, W.; Bolton, M. Measuring Soil Deformation in Geotechnical Models Using Digital Images and PIV Analysis; CRC Press: Boca Raton, FL, USA, 2001. [Google Scholar]
  43. Thielicke, W. The Flapping Flight of Birds: Analysis and Application. Ph.D. Thesis, University of Groningen, Groningen, The Netherlands, 2014. [Google Scholar] [CrossRef]
  44. Moradi, M.; Mir Mohammad Hosseini, S.M.; Khezri, A. Investigation of Rocking Mechanism of Shallow Foundations on Sand via PIV Technique. Earthq. Eng. Struct. Dyn. 2023, 52, 1762–1784. [Google Scholar] [CrossRef]
Figure 1. Particle size distribution curve and geotechnical properties of the sand.
Geosciences 14 00351 g001
Figure 2. Bearing capacity curves of square foundations at varying embedment depths and subgrade conditions.
Geosciences 14 00351 g002
Figure 3. The horizontal loading system utilized: (a) schematic depiction; (b) actual view.
Geosciences 14 00351 g003
Figure 4. The displacement pattern applied to (a) strip foundation and (b) square foundation.
Geosciences 14 00351 g004
Figure 5. Texture of the sand used for PIV analysis.
Geosciences 14 00351 g005
Figure 6. Moment–rotation and settlement–rotation responses of foundations with embedment depths of (a) 0; (b) 25 mm; and (c) 100 mm.
Geosciences 14 00351 g006
Figure 7. Soil particle displacement during the second-phase quarter cycle of loading for foundations with embedment depths of (a) 0; (b) 25 mm; and (c) 100 mm.
Geosciences 14 00351 g007
Figure 8. Soil particle displacement during an entire cycle of the second phase for foundations with embedment depths of (a) 0; (b) 25 mm; and (c) 100 mm.
Geosciences 14 00351 g008
Figure 9. Moment–rotation and settlement–rotation responses for square foundations with embedment depths of (a) 0; (b) 25 mm; and (c) 100 mm on loose subgrade.
Geosciences 14 00351 g009
Figure 10. Moment–rotation and settlement–rotation responses for square foundations with embedment depths of (a) 0; (b) 25 mm; and (c) 100 mm on dense subgrade.
Geosciences 14 00351 g010
Figure 11. Soil–foundation forces contributing to moment capacity in (a) a surface foundation; and (b) an embedded foundation.
Geosciences 14 00351 g011
Figure 12. P-Δ effect in recentering the foundation toward zero rotation.
Geosciences 14 00351 g012
Figure 13. Idealized moment–rotation diagram during cyclic loading.
Geosciences 14 00351 g013
Figure 14. The recentering ratio of square foundations with (a) high FSv and (b) low FSv for different embedment depths of 0, 25 mm, and 100 mm.
Geosciences 14 00351 g014
Figure 15. Definition and method of calculation of rotational stiffness and damping.
Geosciences 14 00351 g015
Figure 16. Rotational stiffness of square foundations with (a) high FSv and (b) low FSv for different embedment depths of 0, 25 mm, and 100 mm.
Geosciences 14 00351 g016
Figure 17. The damping ratio of square foundations with (a) high FSv and (b) low FSv at different embedment depths of 0, 25 mm, and 100 mm.
Geosciences 14 00351 g017
Figure 18. The settlement trajectory of square foundations with (a) high FSv and (b) low FSv at different embedment depths of 0, 25 mm, and 100 mm.
Geosciences 14 00351 g018
Figure 19. Identified soil deformation mechanisms of rocking foundations [44].
Geosciences 14 00351 g019
Figure 20. Soil particle displacements during the first loading quarter cycle (a), first unloading quarter cycle (b), second loading quarter cycle (c), second unloading quarter cycle (d), and a complete cycle of the third phase of loading (e) for a strip foundation with a high safety factor.
Geosciences 14 00351 g020aGeosciences 14 00351 g020b
Table 1. Measured relative densities for raining heights considered.
Test No.Raining
Height
(cm)
Container No.Container Mass (gr)Container Vol. (cm3)Full Container Weight (gr)Unit
Weight
(gr/cm3)
Void
Ratio (e)
Relative
Density (%)
Ave.
Relative
Density (%)
110176.464110611.530.7273335
277.164110651.540.72135
373.263710551.540.72135
260176.464111101.610.64565
277.164111121.610.6436565
373.263711001.600.64764
Table 2. Specifications of the bearing capacity tests conducted.
Test IDFooting ShapeSubgrade Relative Density (%)Footing Embedment Depth (mm)Bearing Capacity (kg-f)Bearing Capacity (kPa)
BC-D-D00Square65%0405177
BC-D-D25Square65%25575250
BC-D-D100Square65%100975425
BC-L-D00Square35%0280122
BC-L-D25Square35%25335146
BC-L-D100Square35%100550239
Table 3. Specifications of the bearing capacity tests.
Test IDFooting ShapeSubgrade Relative Density (%)Footing Embedment Depth (mm)Structural Mass (kg) F S v Footing Static Stress (kPa)
Test Series 1
Str-D00Strip65%003005.038
Str-D25Strip65%253006.238
Str-D100Strip65%10030010.438
Test Series 2
Sq-D-D00Square65%00705.831
Sq-D-D25Square65%25708.231
Sq-D-D100Square65%1007013.931
Sq-L-D00Square35%001202.353
Sq-L-D25Square35%251202.853
Sq-L-D100Square35%1001204.953
Disclaimer/Publisher’s Note: The statements, opinions and data contained in all publications are solely those of the individual author(s) and contributor(s) and not of MDPI and/or the editor(s). MDPI and/or the editor(s) disclaim responsibility for any injury to people or property resulting from any ideas, methods, instructions or products referred to in the content.

