Article

Desertification Assessment Using the Modified Mediterranean Desertification and Land Use Model in a Karst Plateau

by
Umberto Samuele D’Ettorre
,
Isabella Serena Liso
*,
Vincenzo Parisi
and
Mario Parise
Earth and Environmental Sciences Department, University Aldo Moro, 70125 Bari, Italy
*
Author to whom correspondence should be addressed.
Geosciences 2024, 14(12), 320; https://doi.org/10.3390/geosciences14120320
Submission received: 28 October 2024 / Revised: 21 November 2024 / Accepted: 22 November 2024 / Published: 25 November 2024

Abstract

:
Desertification is among the most severe environmental problems in many countries at present, and threatens the integrity of natural environments and the sustainability of related natural resources. This work aims to assess proneness to desertification in the Alta Murgia karst plateau (Apulia, Southern Italy) through the integration of the modified Mediterranean Desertification and Land Use model (MEDALUS) with a GIS-based approach. The model includes indexes for climate, vegetation, soil, and management, all combined to assess environmentally sensitive areas (ESAs) regarding desertification. Given the karst features of the study area, the management index was modified and renamed the Karst Management Quality Index (KMQI). This modification was made by incorporating the Karst Disturbance Index (KDI), based on a series of indicators divided into five categories: geomorphology, hydrology, atmosphere, biota, and cultural factors. According to the model, the results indicated that the whole area (97%) is within the Critical type of ESA, with no area being assessed as the “Non-Affected” or “Potential” type. A total of 57% of the study area falls into Critical sub-type 2, 32% falls into sub-type 3, and 8% falls into sub-type 1. The remaining percentage (3%) belong to a non-optimal category, i.e., the Fragile type (sub-type F3) class. The obtained results could be explained, more than by climatic or ecological factors, by a series of anthropogenic activities carried out over the years that strongly modified and disturbed the original karst landscape, with a highly negative impact on the Alta Murgia karst.

1. Introduction

Desertification is one of the most critical environmental problems in the world in terms of ecosystems integrity, economic losses, and social issues. As defined by the 1994 United Nations Convention to Combat Desertification [1], desertification is a form of land degradation in drylands resulting from various causes, including climatic variations and human activities. Therefore, desertification does not only mean the expansion of the classic concept of deserts (such as the Sahara or the Kalahari) because it is necessary to consider other environmental factors that could reach critical levels as a consequence of anthropogenic activities [2]. Moreover, this phenomenon extends beyond drylands, which are particularly vulnerable to land degradation due to environmental factors such as low rainfall, low soil moisture, and poor soils, as well as anthropogenic factors such as a high human water resources demand [3,4,5,6,7]. Statistics show that about a quarter of Earth’s land, corresponding to an area of over 3.6 billion hectares, is presently at risk of desertification, and around 250 million people are directly affected by this problem [1,8].
Mediterranean Desertification and Land Use (MEDALUS [9]), is one of the most widely used methodologies to assess land desertification. It was initially developed for Mediterranean areas at the local, national, and regional scales [10,11,12,13]. However, due to the simplicity and flexibility of the model’s parameters, MEDALUS has been used in many other regions worldwide [14,15,16,17]. The original methodology is based on a comprehensive analysis of 15 variables, categorized into four main “qualities”: climate, soil, vegetation, and management, with the latter defined as “degree of human-induced stress” [9]. In the first step of the model approach, the values for every variable were reclassified based on a variable/score classification system and introduced to a geographical information system (GIS). A generalized evaluation was then conducted to produce four quality indicators: Soil Quality Index (SQI), Vegetation Quality Index (VQI), Climate Quality Index (CQI), and Management Quality Index (MQI). These indicators were calculated as the geometric mean of the corresponding scores of the relevant variables. After the computation of the four indices for each quality, the environmentally sensitive areas (ESAs) to desertification were calculated by taking the geometric mean of the corresponding quality indicators.
The Alta Murgia plateau, in the Apulian karst (SE Italy), represents one of the most interesting environments of this region, being almost entirely characterized by soluble rocks at the outcrop [18]. Apulia has the arid/semi-arid climate typical of the Mediterranean area, and is particularly susceptible to desertification due to unsuitable climatic conditions and negative human activities. In addition, karst is a very fragile environment, characterized by high physical anisotropy; such an environment, and to the resources stored therein (soil, water, cave systems, biota), could be damaged very easily, whilst restoration practices, when possible, are often highly time-consuming and expensive [19,20] and not entirely effective. The MEDALUS approach was applied in Apulia on many occasions, also using different parameters and indexes compared to the original model [21,22,23,24].
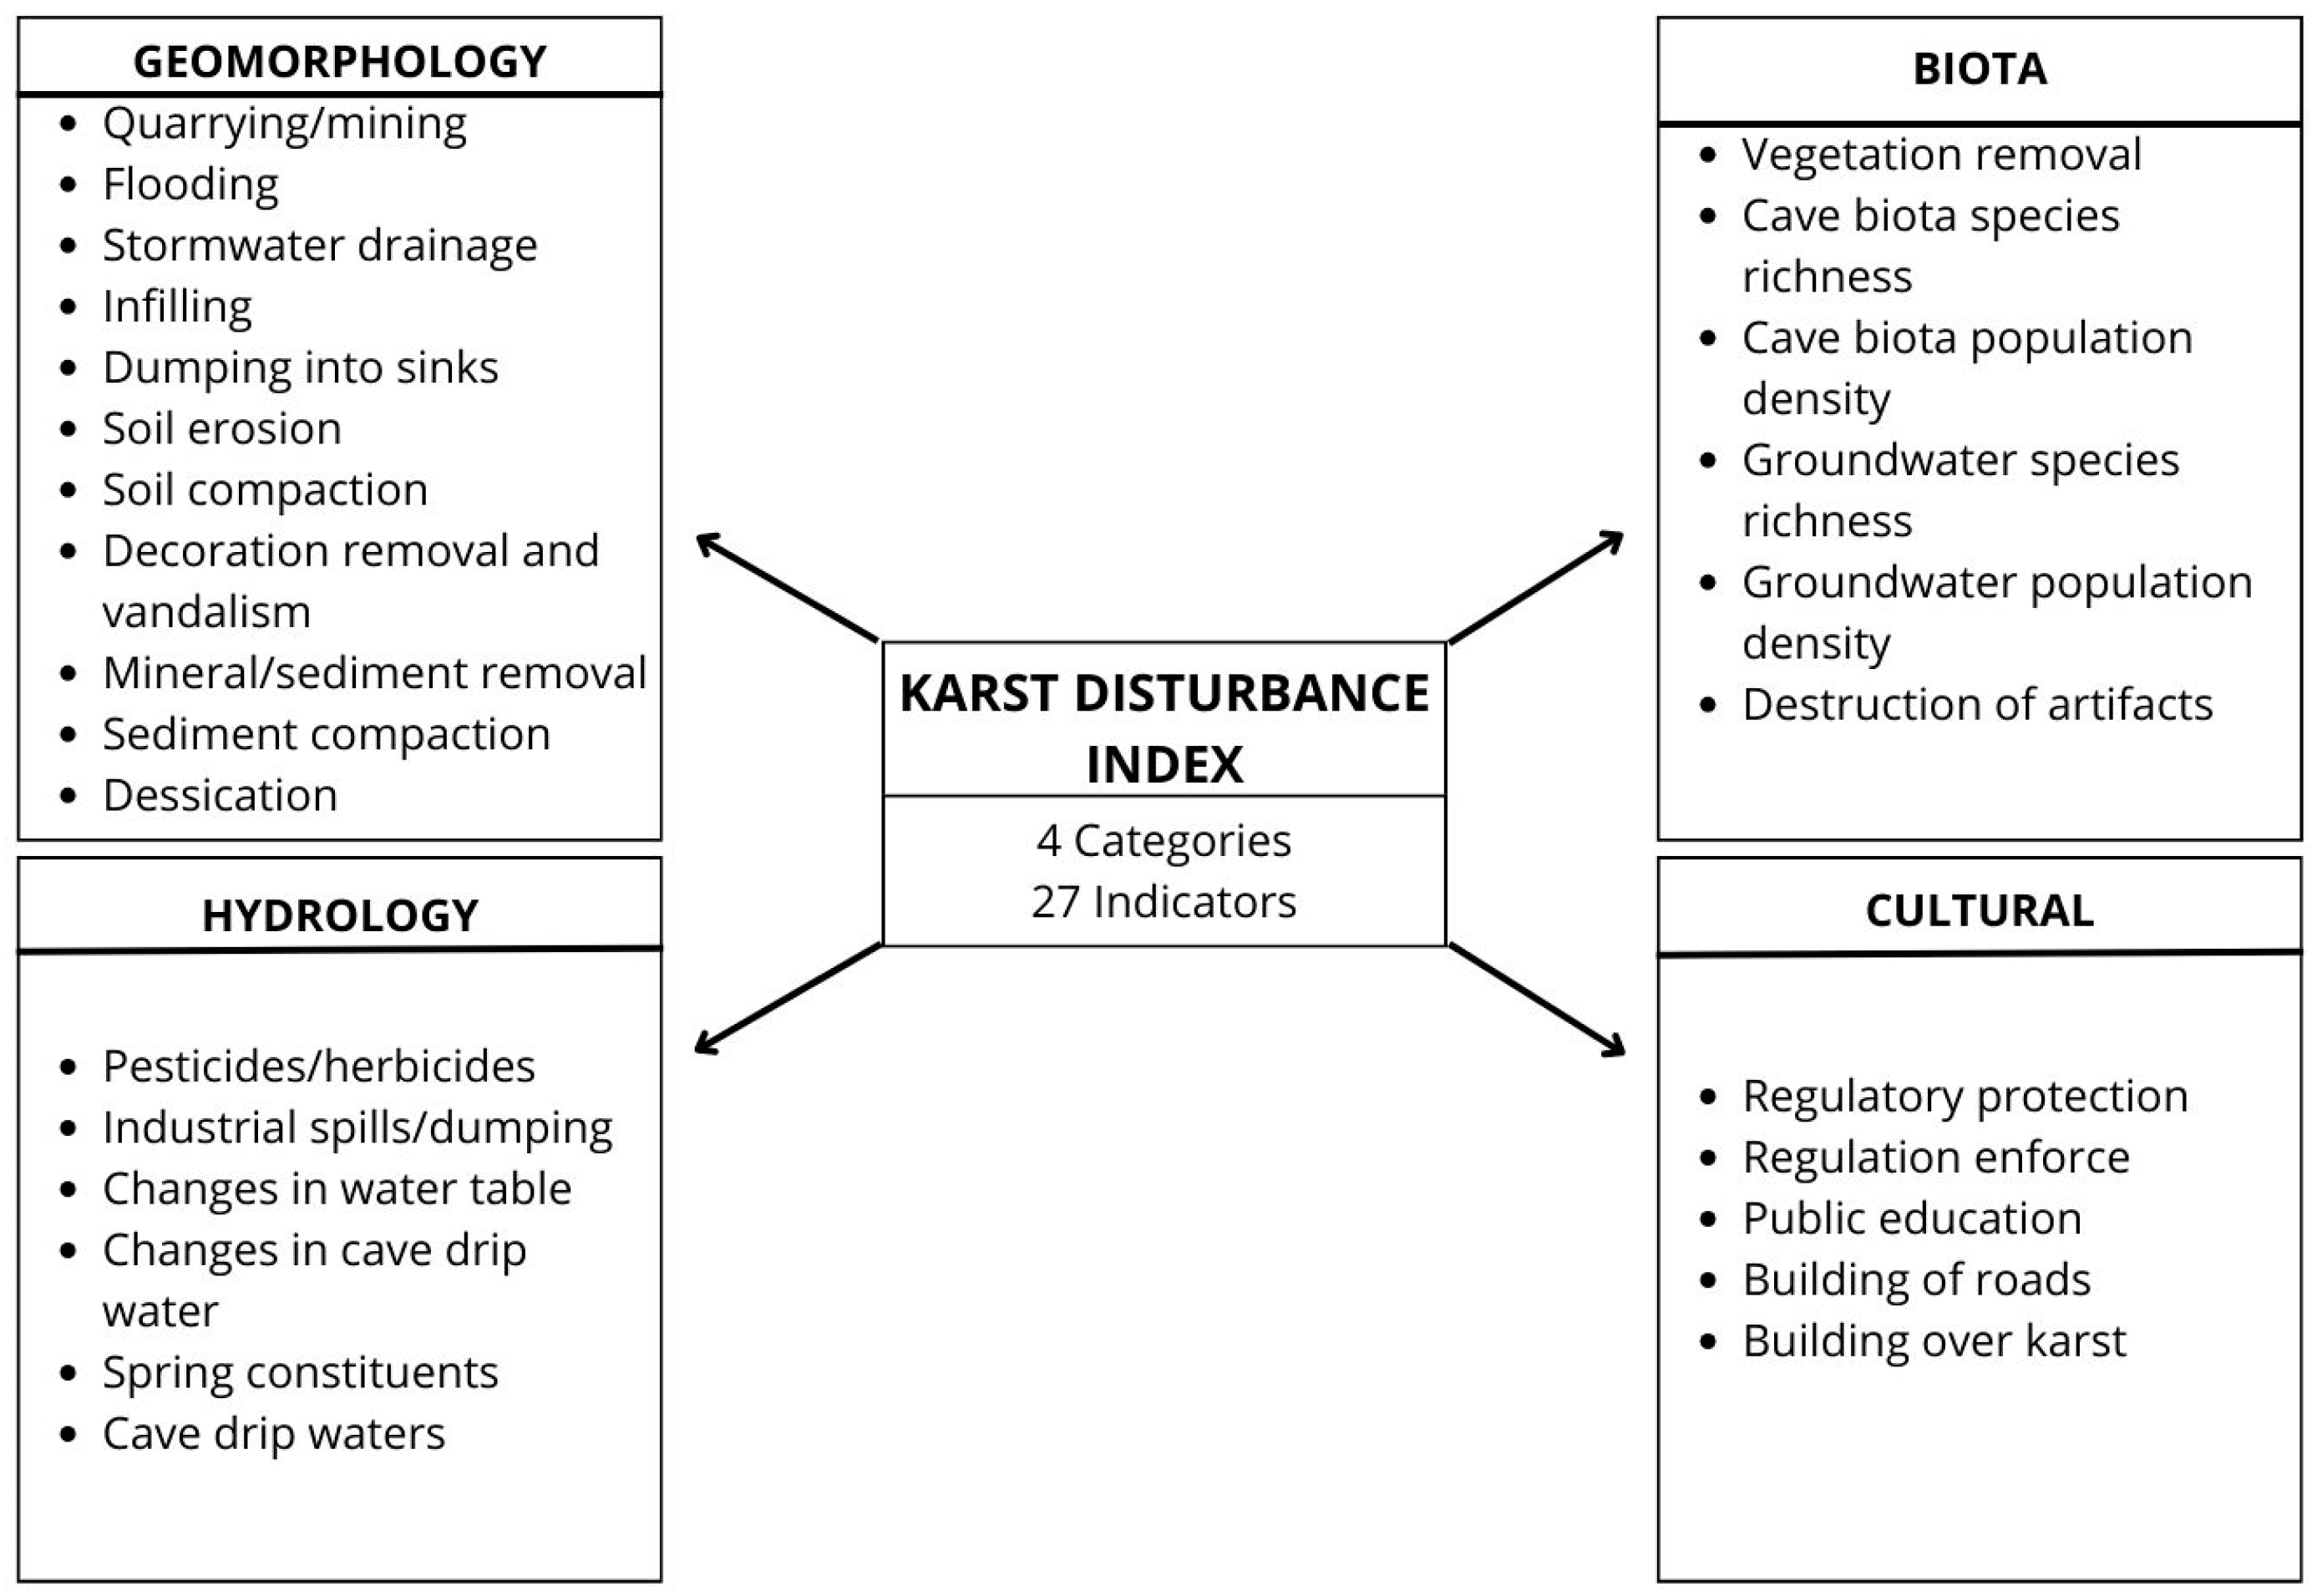
This study aims to map and assess the environmentally sensitive areas to desertification in the Alta Murgia karst plateau by using a modified MEDALUS GIS-based methodology. Unlike previous studies, the main modification applied to the model allows us to consider the peculiar features of the study area deriving from its karst geomorphology and hydrology. The aim of this work is also to assess the degree of disturbance in the karst environment, mainly resulting from a series of human activities that may exacerbate vulnerability to desertification within the study area. In fact, the original MEDALUS methodology offers limited information regarding the assessment of the human factor and its environmental impacts, providing only a broad, less detailed evaluation in the Management Quality Index instructions for calculation. This approach hinders the identification of potential anthropogenic causes and, consequently, the formulation of effective restoration and prevention strategies. Attempts have been made to resolve aspect through including the Karst Disturbance Index [25,26], which consists of many environmental indicators subdivided into the following five broad categories: geomorphology, hydrology, atmosphere, biota, and cultural. The calculation of the KDI allows for the modification of the Management Quality Index, facilitating the identification of a more detailed set of factors (both human and non-human) influencing the study area at a local scale.

2. Study Area and Database

The Alta Murgia karst plateau contains many different elements of historical, landscape, naturalistic, and scientific interest [27,28]. For this reason, it became a National Park in 2004, with an area of approximately 1250 km2. At the beginning of 2019, the management of Alta Murgia National Park decided to make the territory a candidate to become a Geopark. In 2021, along with a large area of the Apulia region, the territory was announced as a new aUGGp (aspiring UNESCO Global Geopark) by the Italian National Commission of UNESCO [29]; recently (9 September 2024), it became a UNESCO Geopark.
The climate of Alta Murgia plateau has a semi-arid regime, characterized by hot and dry summers and moderately cold and rainy winters; the rain tends toward the Mediterranean type, with a mean annual precipitation of about 550 mm/y [30,
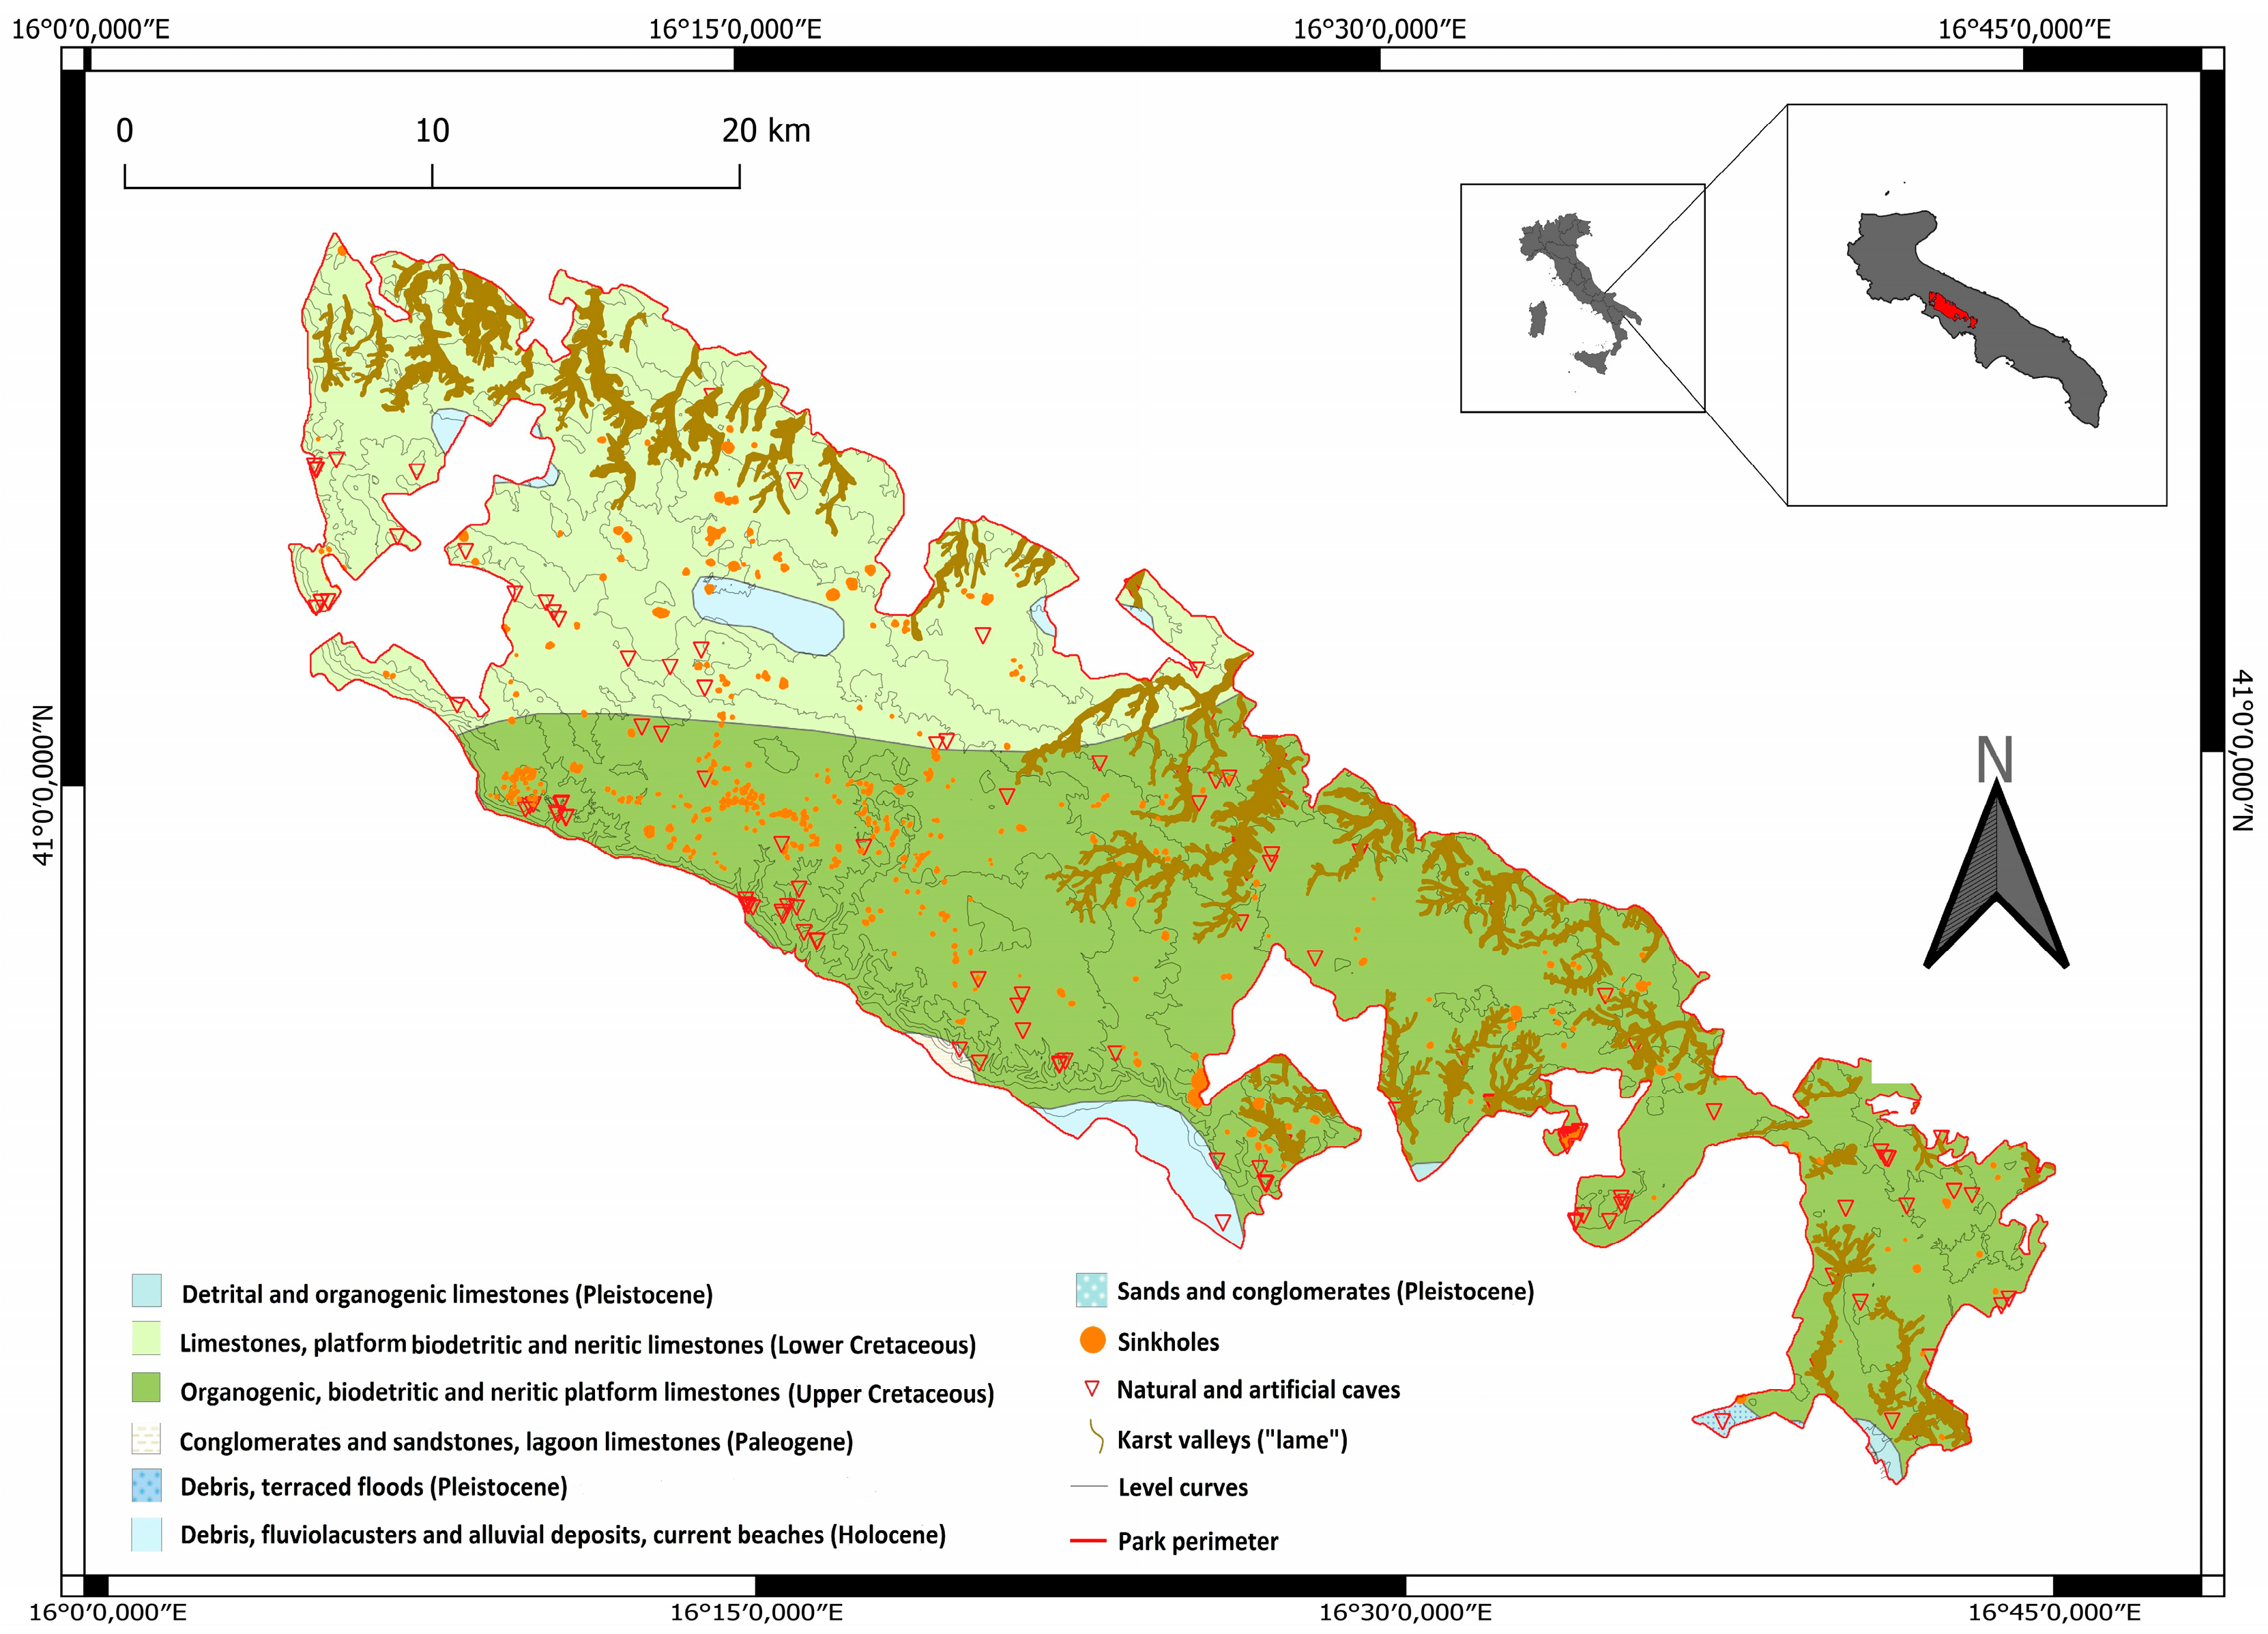
31]. The entire plateau shows typical aspects of karst geomorphology: the altitude ranges from sea level to 700 m a.s.l., with a widespread presence of underground voids, wide depressions (sinkholes, dolines, endorheic basins), shallow valleys with flat bottoms (locally named “lame”), and limestone outcrops [18,32,33] (Figure 1).
Before the 1970s, the most common activities in the plateau were related to pasture, with large uncultivated portions of land; there is evidence of a centuries-old balance between the environment and the pastoral agricultural system. Starting from the 1980s and leading up to the 1990s, an intensive transformation from pasture to arable land was registered due to a public program of financial support by the European Community. This land conversion occurred thanks to the use of heavy machinery for stone removal operations, which had a negative impact on the original karst landscape, particularly the epikarst [37,38]. In fact, as a result of this intense conversion of land cover, many karst landforms were highly disturbed and, in some cases, destroyed (this was, for instance, the case for many solution dolines [39]). Moreover, surface erosion and loss of soil, even at low topographic gradients, often occurred during the most intense rainstorms [40,41].
In this study, the data used to map the environmentally sensitive areas to desertification include the digital elevation model (DEM), land use, soil data, and climatic data (rainfall and temperatures) (Table 1). The DEM, with a spatial resolution of 8 m, acquired between 2006 and 2007, was extracted from the geodatabase of the Apulia region and used to retrieve the slope and aspect gradients [42]. Land use data were acquired from the CORINE Land Cover 2018 map [43], with a spatial resolution of 100 m, while soil data were obtained from an eco-pedological map of Italy [44]. To acquire more accurate soil parameters, some geomorphological characteristics (presence of valleys and sinkholes) were taken into account through the use of vectorial files from the Apulian Regional Territorial Landscape Plan [34]. Historical rainfall and temperature data, at monthly intervals, were extracted from the hydrological annals of Apulia, managed by the Regional Service of Civil Protection. They were collected for eight climate monitoring stations located in the study area.
Since the original data derive from several sources with different resolutions, the spatial scale was processed to obtain a consistent pixel size within the raster quality maps derived from GIS analyses.

3. Methodology

The methodology used for this study is based on the MEDALUS framework, which was established by the European Commission and become one of the most widely used models in desertification assessment. The original method uses four quality indexes to identify the ESAs (environmentally sensitive areas), namely, the Soil Quality Index (SQI), the Climate Quality Index (CQI), the Vegetation Quality Index (VQI), and the Management Quality Index (MQI). Each indicator is obtained by means of sub-indicators, which are also classified. The values of the weights for each class vary from 1 (least sensitive to desertification) to 2 (most sensitive to desertification), with values between 1 and 2 representing relative vulnerability [9]. The framework used for this study has some variations, with one of the most remarkable being represented by the addition of the Karst Disturbance Index (KDI) [25,26] as a sub-indicator for the evaluation of the management quality index, which is renamed the Karst Management Quality Index (KMQI) (Figure 2). Given the karst nature of the study area, this integration is of great importance to effectively depict the main geological and hydrological characters of the territory. All the quality indexes of the model, including the final index for the ESAs, were produced via geometric means in a geographical information system (GIS) through maps in raster format.

3.1. Soil Quality Index

Soil is one of the most relevant factors involved in desertification processes. In semi-arid regions, soil fertility is often compromised because of the low rainfall, high evaporation, and restricted leaching, which could lead to the accumulation of soluble salts, and therefore cause saline conditions [45]. Moreover, soils in karst environments are generally thin and not very fertile, deriving from a dissolution process that leads to a poor mineral basis and very low rates of soil formation, making its loss a virtually irreversible process at the human time scale [46]. The Soil Quality Index (SQI) quantifies the soil’s vulnerability to the erosion of fine particles by wind and rain, also considering the uniformity and significance of the soil distribution [47]. The SQI is calculated according to the original model using the following equation [9]:
SQI = (texture × parent material × rock fragment × depth × slope × drainage)1/6
Table 2 shows the weights attributed to each sub-index relating to soil properties.
Soil texture was obtained from the eco-pedological map of Alta Murgia [44]; this contains three soil types (luvisol, cambisol, and phaeozem), classified according to the Food and Agriculture Organization (FAO). Haplic luvisol is the most common soil class in the karst plateau, which is generally well drained and characterized by a clayey texture with a mixed mineralogy [48].
The scores assigned to the sub-indexes of soil depth, drainage, and rock fragments were evaluated considering the presence of sinkholes and valleys (indicated in the geomorphological map of the study area) and the impact of negative agricultural practices such as stone clearing and crushing, which significantly reduced the available soil thickness and drainage in many areas of Alta Murgia, together with other human actions such as the opening and/or widening of limestone quarries [49,50] and the destruction/closure of underground voids.

3.2. Climate Quality Index

The Climate Quality Index (CQI) reflects the variability of climatic conditions affecting land degradation and desertification. Precipitation is the most important factor, playing an important role in the drainage regime and soil water capacity [9,51,52]. According to the original MEDALUS model, CQI was determined by three parameters: rainfall, aridity and slope aspect (Table 3).
Aridity was calculated using the Bagnouls–Gaussen bioclimatic aridity index, defined using the following equation [9]:
B G I = i = 1 n 2 t i P i k
where t is the average monthly air temperature in °C, k is a coefficient indicating the number of months in which 2t > p, and Pi is the average rainfall of month i. Slope aspect affects the micro-quality climate and the soil moisture through the distribution of solar irradiation at the surface. Consequently, high surficial irradiation implies high levels of evaporation and a low soil moisture rate, favoring the degradation of vegetation and erosion by water and wind [9,53,54]. The following equation provides the expression of the CQI [9].
CQI = (rainfall × aridity × aspect)1/3
The slope aspect, which plays an important role in influencing vegetation patterns, hydrological rainfall, and rill erosion (especially in arid and semiarid areas) [55,56], was extracted from the DEM, while rainfall and temperature data were recorded at eight monitoring stations in the surroundings of the study area. The CQI map was obtained through the interpolation of the eight rain gauges using the ordinary kriging geostatistical method.

3.3. Vegetation Quality Index

Vegetation promotes water infiltration, reduces precipitation–runoff, and improves soil structure and cohesion by increasing the quantity of organic matter [10]. Vegetation indicators provide information on how vegetation plays a positive role in mitigating the impacts of desertification and land degradation processes. According to the original model, to determine the Vegetation Quality Index (VQI), four parameters were considered and evaluated: fire risk, erosion protection, drought resistance, and vegetation cover [9].
To determine and index these parameters, the CORINE land cover map (2018) was been used, replacing the vegetational types provided by the MEDALUS model with the land use class codes (Table 4). The CORINE land cover classes’ matches and weights assigned were verified by consulting satellite images.
Based on CORINE 2018, the areas used for agricultural purposes cover > 46% of the total area, the pastures or areas potentially used for grazing cover > 37%, while forests cover only about 10% of the total study area. VQI was calculated using the following equation [9]:
VQI = (fire risk × erosion protection × drought resistance × vegetation cover)1/4

3.4. Karst Management Quality Index

Human activities greatly influence land degradation and desertification processes, especially in karst areas, which are highly susceptible to anthropogenic disturbance due to the important exploitable resources hosted therein [57]. In karst land there is a direct connection between the surface and the underground, so negative actions occurring at the surface have a significant impact on the environment. Quarrying and mineral extraction [58,59,60], vegetation removal, agricultural practices, and illegal waste disposal [19,61,62,63] can be considered some of the most impactful practices. Subsurface karst features such as cave systems and karst aquifers are also easily affected by climate changes and anthropogenic activity occurring both above and below the ground surface [20,40,64,65,66,67]. In this study, the original MEDALUS Management Quality Index (MQI) was modified by introducing the Karst Management Quality Index (KMQI) in order to fully consider the impact of anthropogenic disturbances on the karst environment. The Karst Management Quality Index is calculated by the following equation:
KMQI = (land use intensity × karst disturbance index)1/2
Land use intensity was evaluated in cropland (CLUI, intensity of land cultivation index, from [23]), pastureland (livestock density index, LDI), forests, urban/industrial infrastructure, mining areas, and sparse vegetation areas with possible use for grazing or cropland (Table 5).

Karst Disturbance Index

The Karst Disturbance Index (KDI) represents a hierarchal index developed in order to holistically analyze anthropogenic disturbances in karst terrains by accounting for economic, scientific, and cultural factors [25,26]. To date, KDI is the only methodology attempting to determine the degree of human impact on karst environments and has been applied at several locations worldwide, from the Mediterranean area to Florida, USA, Jamaica, New Zealand, Mexico, and Africa [26,62,68,69,70,71,72,73,74]. KDI utilizes a regional approach that is able to identify local details of human disturbance that may be specific to the karst landscape, and comprises 31 indicators, subdivided into five broad categories: geomorphology, atmosphere, hydrology, biota, and cultural [26]. According to van Beynen and Townsend [25], for each applicable indicator, a score from 0 to 3 was assigned based on the degree of disturbance: 0 means no human impact, 1 indicates localized and not severe disturbance, and 3 indicates severe disturbance. Indicators not applicable to the study area were removed from the KDI evaluation, while applicable indicators with inadequate data to assign a disturbance score were classified as lack of data (LD). The degree of confidence for the KDI was calculated by dividing the total number of LDs by the total number of indicators in the study area, resulting in a score between 0 and 1. An LD rating < 0.1 indicates high confidence in the results of the index, while a rating > 0.4 suggests that more research is required for the full application of the index [25]. The final KDI value is then calculated by adding the scores of each evaluated indicator; then, the sum is divided by the highest possible score, obtaining a value between 0 and 1, which corresponds to the five karst disturbance level categories given in the karst disturbance index. In this study, disturbance classifications were made following those revised by North et al. (2009), where more disturbance levels were added to the initial classification provided by van Beynen and Townsend [25] (Table 6).
In this study, KDI was evaluated as a sub-index to calculate the Management Quality Index (KMQI), with the aim of emphasizing the correlation between the human activities carried out in the karst environment and the increased risk of desertification.
Figure 3 summarizes the indicators that were considered; they were categorized into four classes to achieve the goal of this research. To assess each indicator, multiple data were collected from several sources, including, but not limited to, interviews with professionals and scientists, maps, aerial photographs, satellite images, websites, and field surveys. All data sources utilized to evaluate such indicators are summarized in Table 7.

3.5. Environmentally Sensitive Area Index

The environmentally sensitive areas index (ESAI), used to determine sensitivity to desertification, was determined using SQI, CQI, VQI, and KMQI, which were combined using the following equation, following the MEDALUS approach [9]:
ESAI = (SQI × CQI × VQI × KMQI)1/4
All four indexes were integrated in the GIS raster calculator in order to obtain the final map, which identifies the areas threatened by desertification. According to Kosmas [9] the ESAI identifies three main classes of land degradation (‘‘critical’’, ‘‘fragile’’, and ‘‘potentially affected’’), which could be further differentiated into three sub-classes that describe the sensitivity to desertification risk as C3-critical > C2-critical > C1-critical > F3-fragile > F2-fragile > F1-fragile > potential > non-affected (Table 8).

4. Results

Figure 4, Figure 5, Figure 6, Figure 7 and Figure 8 show the results at the local scale, deriving from the elaboration of the different quality indices SQI, CQI, VQI, KMQI, and ESAI, respectively. In this study, the spatial distributions, expressed as a percentage (%) of the quality classes, were extracted for each considered quality index and are shown in Figure 9.

4.1. Soil Quality Index

The Soil Quality Index (SQI, Figure 4) was obtained by applying Equation (1) using five sub-indicators, namely texture, parent material, rock fragments, depth and slope, and drainage. In the study area, the SQI spatial analysis indicates that most of the study area (80%) is in the low-quality soil class, while the remaining percentage (20%) has moderate soil quality, with no area belonging to the high-quality class (Figure 9). The soil texture is mostly textually clay (luvisol/phaeozem), with small portions of the loamy to clay (cambisol) soil type, according to the FAO classification obtained from the eco-pedological map [44].

4.2. Climate Quality Index

The Climate Quality Index (CQI) was evaluated, along with its three sub-indicators (rainfall, aridity, and aspect), by applying Equation (2), and is shown in Figure 5. As stated above, the aspect map was obtained from the digital elevation model, while rainfall and aridity were calculated by using the climate data provided by the monitoring stations in the study area. The rainfall data collected and calculated for each rain gauge show that the average rainfall over 40 years (1981–2021) ranged from 586 to 657 mm. However, out of the eight stations considered, only dive provided a complete dataset for 40 years; for the others, the completed datasets covered 20 years at most. However, the impact of these incomplete data was not relevant to the CQI calculations. The amount of rainfall, considering also the temperatures provided by the climatic stations, led to low aridity values according to the Bagnouls–Gaussen bio-climatic aridity index (BGI range < 50). Regarding the slope aspect, an index of 2.00 was assigned to most of the stations, with an aspect tending mainly to the south–west. The overall analysis shows that the climate of the whole area under study is of a moderate-quality type, with no percentage falling into the high- or low-quality classes (Figure 9).

4.3. Vegetation Quality Index

The Vegetation Quality Index (VQI) was calculated using Equation (3) through the combination of the four sub-indicators, namely, fire risk, erosion protection, drought resistance, and plant cover (Figure 6). According to the Corine Land Cover classification, the vegetation in Alta Murgia corresponds to agricultural land mainly cultivated with perennial or annual crops and grasslands, with forest ecosystems being almost absent, having been replaced by Mediterranean macchia vegetation. This leads to generally low vegetation resistance to drought and erosion, and a moderate susceptibility to fire risk. The overall results show that about 59% of the vegetation in the area is a low-quality type, characterized by crops, and 41% is of a moderate vegetation quality type, mainly corresponding to natural grassland, with no areas belonging to the high-quality class (Figure 9).

4.4. Karst Disturbance Index

The Karst Disturbance Index (KDI, [25,26]) was obtained for use as a sub-indicator for the calculation of the Karst Management Quality Index (KMQI, Equation (5)).
The applied methodology shows that the study area had sufficient data to determine levels of disturbance, with only four indicators being assigned an LD designation. The indicators that were potentially applicable (LD) are as follows: spring constituents, changes in water table, cave biota species richness, and groundwater species richness, belonging to the categories of Hydrology and Biota, respectively. The total karst disturbance score of the study area was 0.63, indicating a severe degree of disturbance according to the scoring system by North et al. [26] (Table 6). Table 9 summarizes the disturbance score for each indicator considered in the study area.

4.5. Karst Management Quality Index

The Karst Management Quality Index (KMQI) was calculated by correlating the KDI with sub-indicators that took into account the land use intensity in cropland, pastureland, forests, urban/industrial infrastructure, mining areas, and sparse vegetation areas (Equation (5)). The resulting indicator provides an overview of the human impact on the karst environment in the major land use categories. The KDI value was converted to align with the scores applied in the MEDALUS model, changing from an initial value of 0.63 to a final one of 1.63. The overall results for the KMQI, deriving from the spatial analysis, indicate that about 85% of the study area has low-quality management, while about 15% has moderate-quality management, with 0% belonging to the high-quality management class (Figure 9). The obtained KMQI map is shown in Figure 7.
Figure 7. Karst Management Quality Index map in Alta Murgia.
Geosciences 14 00320 g007

4.6. Environmentally Sensitive Area Index

The Environmentally Sensitive Area Index (ESAI) was determined using the geometric mean of the previously described SQI, CQI, VQI, and KMQI, applied in the GIS environment of Equation (6). The resulting map (Figure 8) shows four spatial distributed classes. In the map, 97% of the study area is in the Critical type class, which is environmentally sensitive to desertification (ESAs); the remaining percentage (3%) shows improved scores compared to the rest, but the area still belongs to a non-optimal category, i.e., the Fragile type (sub-type F3) class. More specifically, 57% of the analyzed area falls into Critical sub-type 2, 32% into sub-type 3, and 8% into sub-type 1 (Figure 9).
Figure 8. Environmentally sensitive area index map in Alta Murgia.
Geosciences 14 00320 g008
Figure 9. Spatial distribution (%) of the quality indices in the study area.
Geosciences 14 00320 g009

5. Discussion

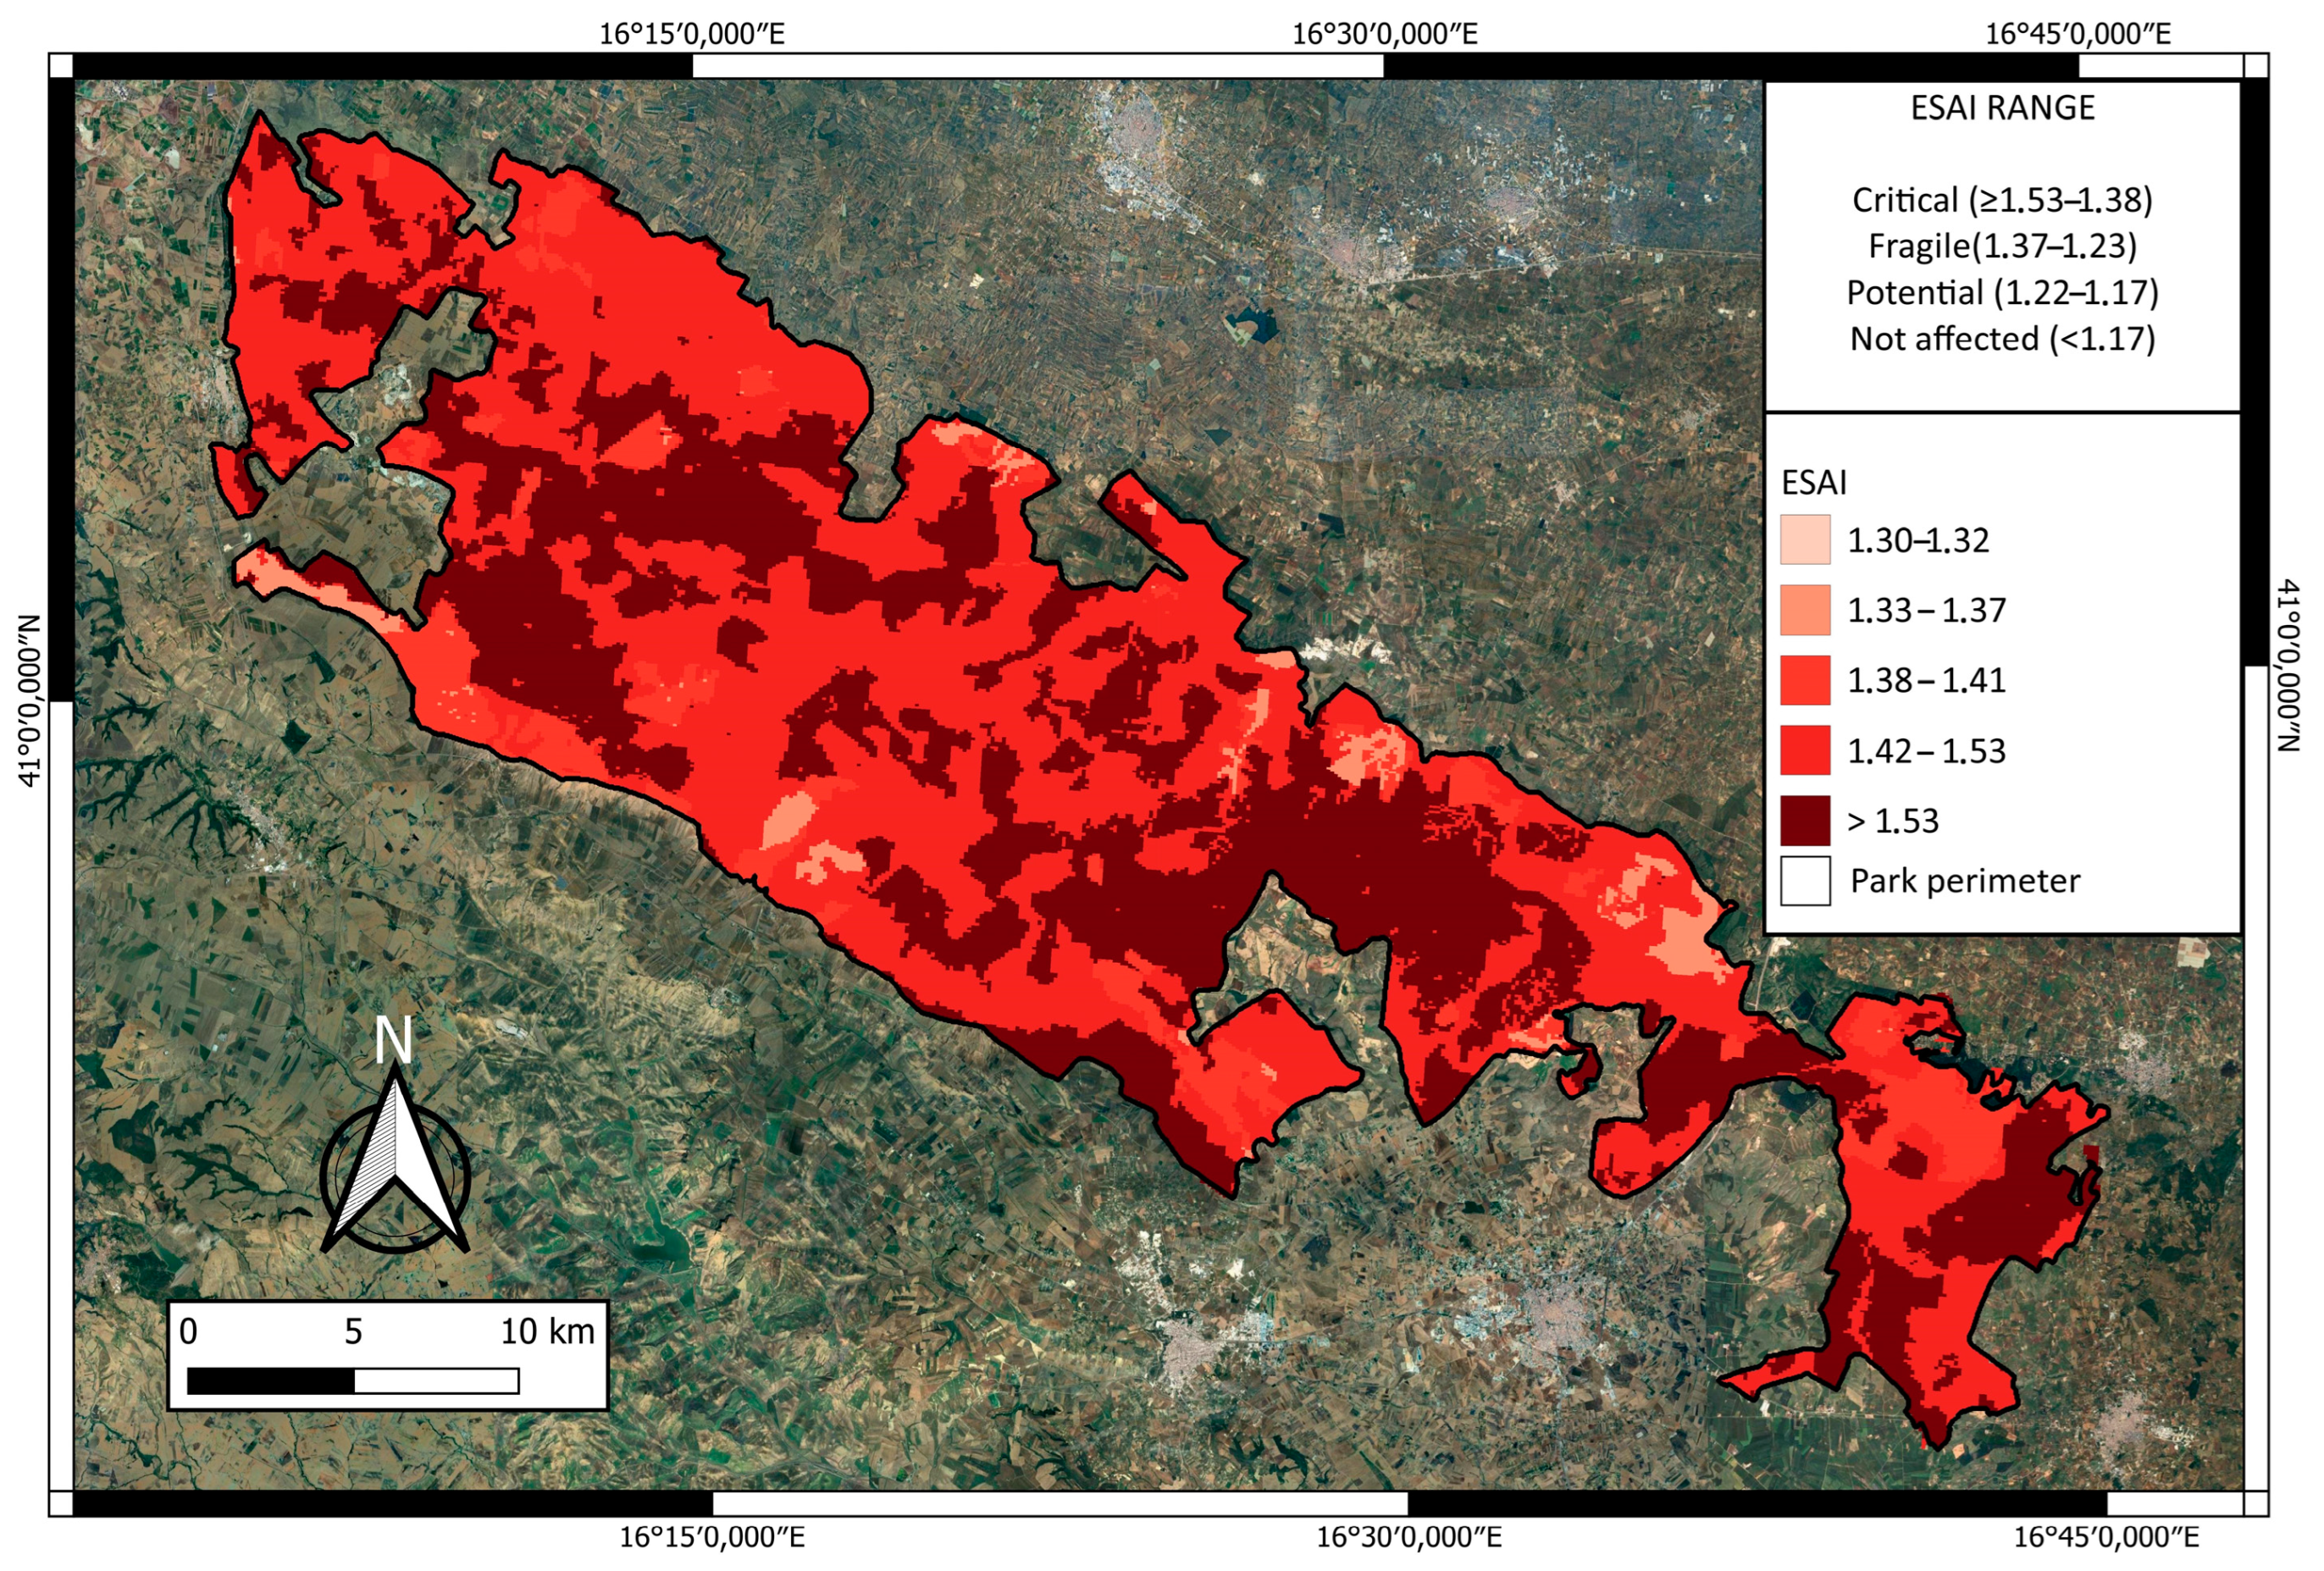
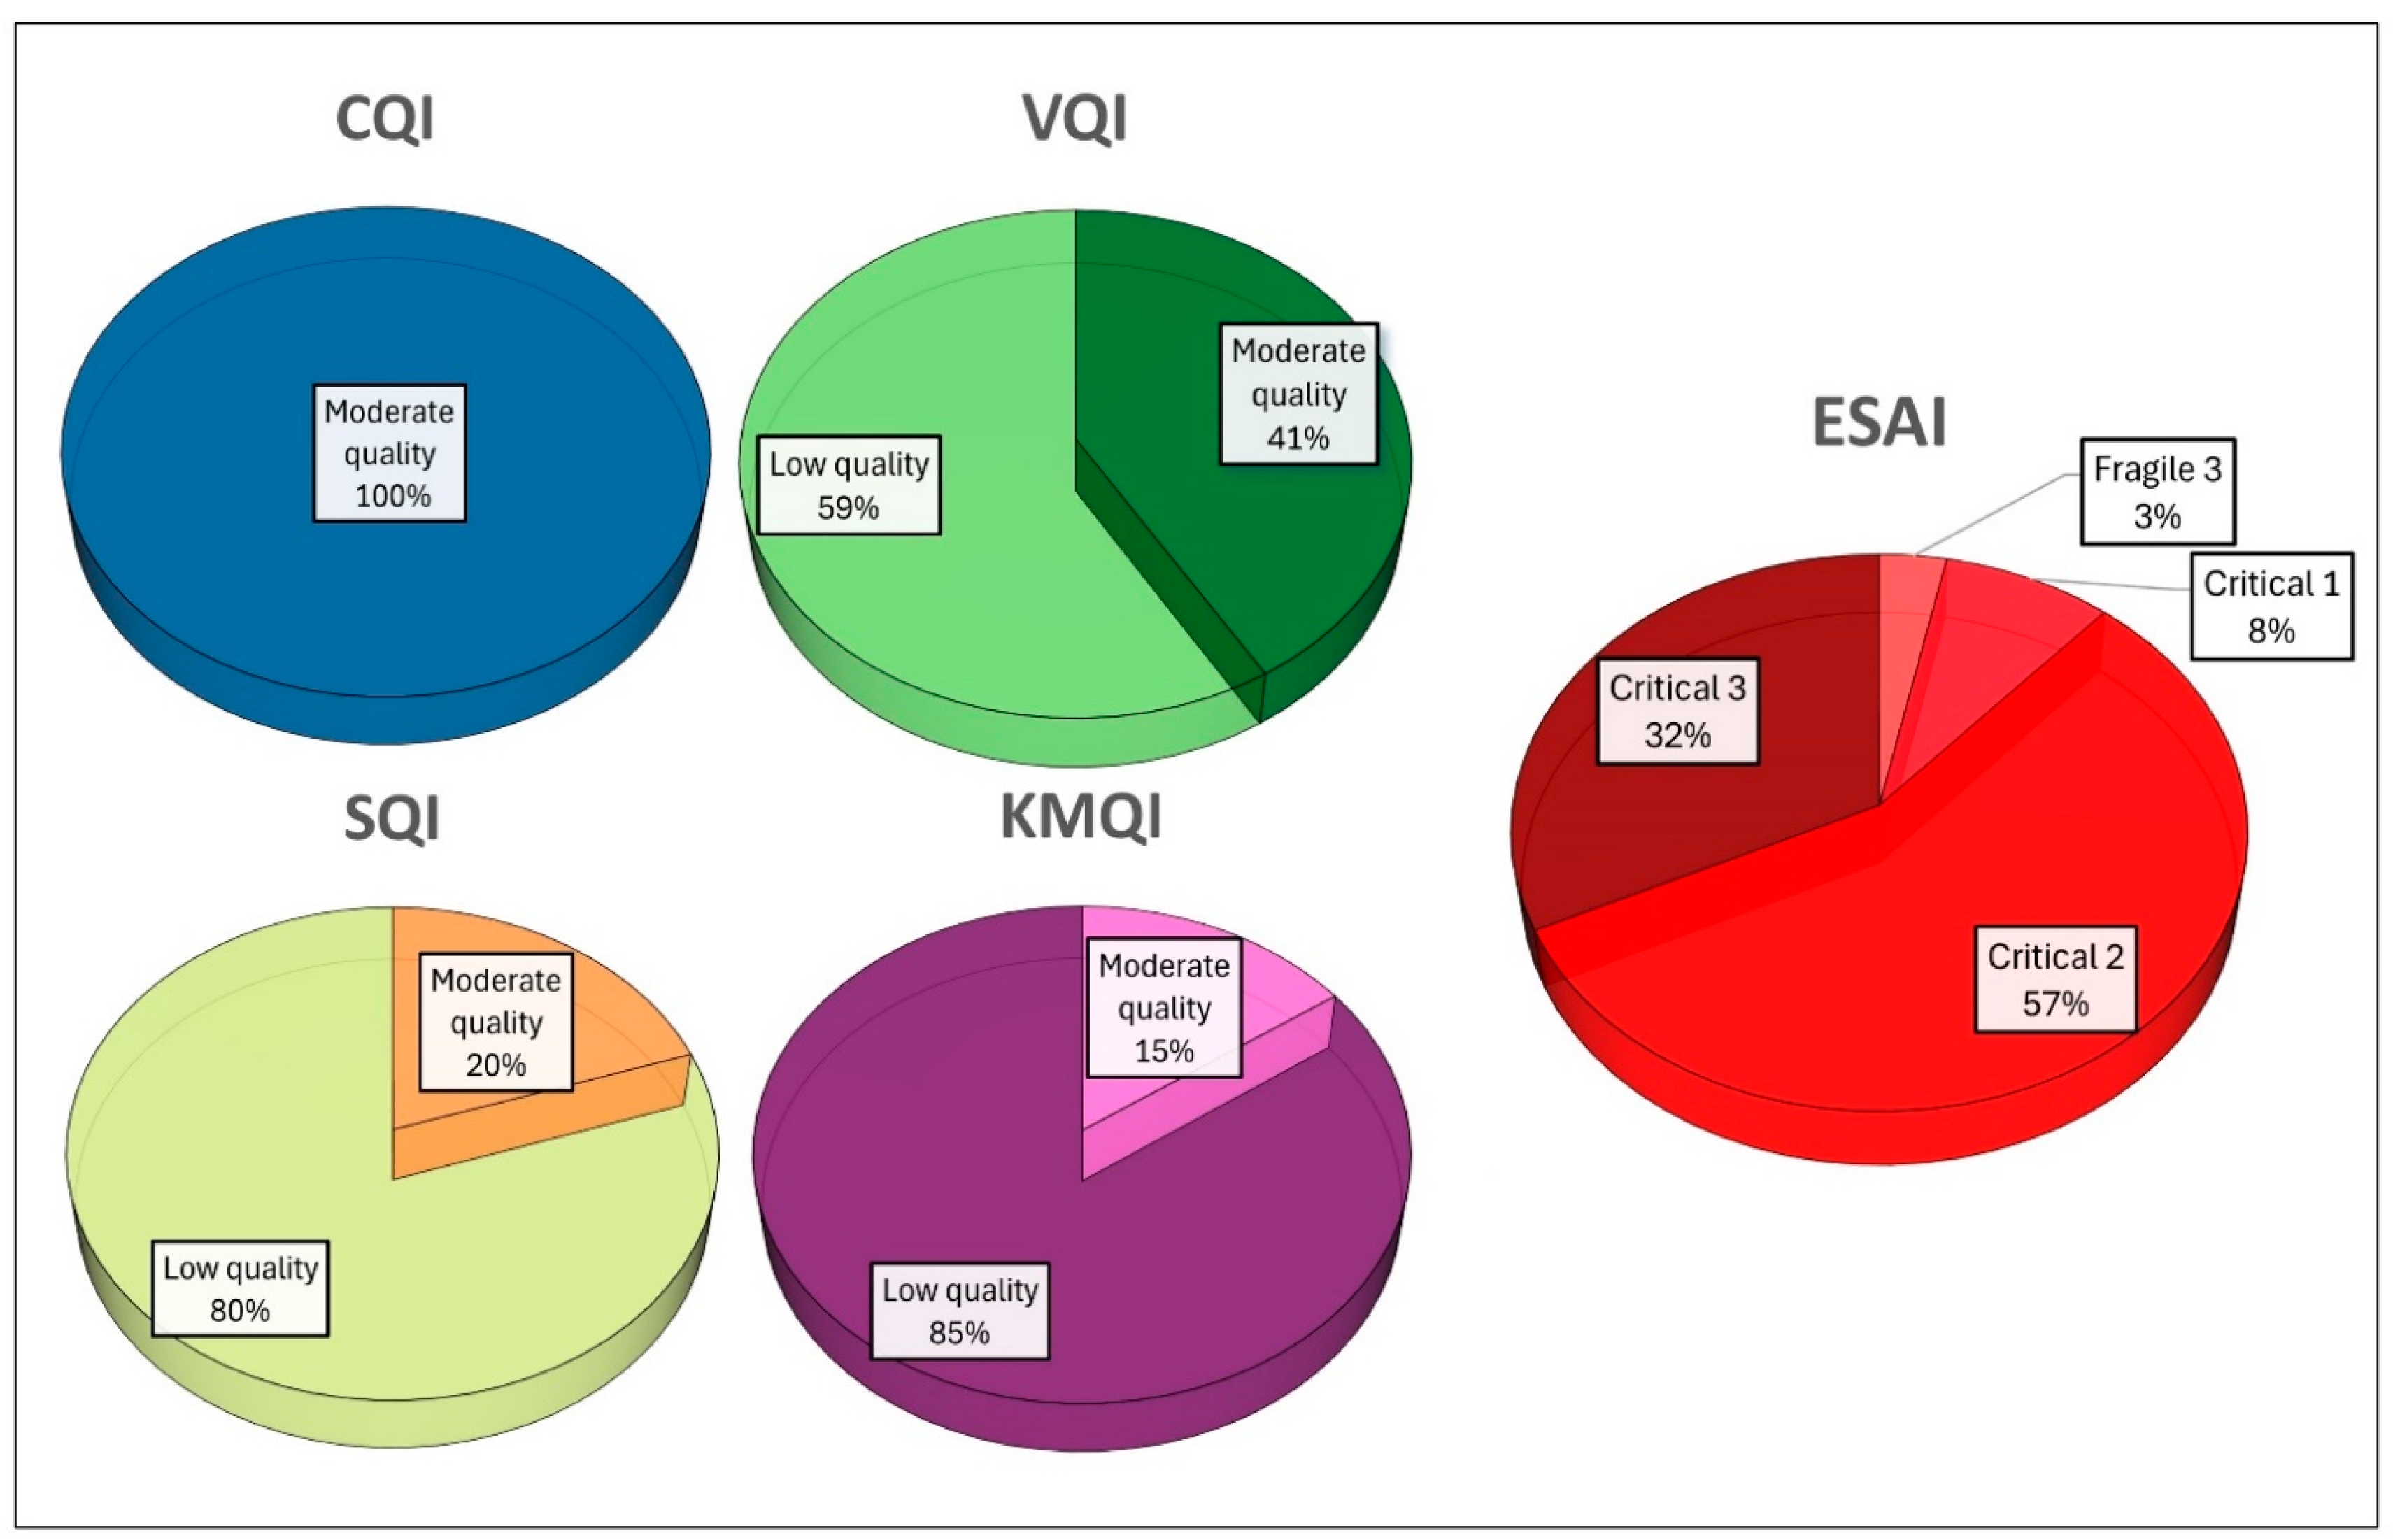
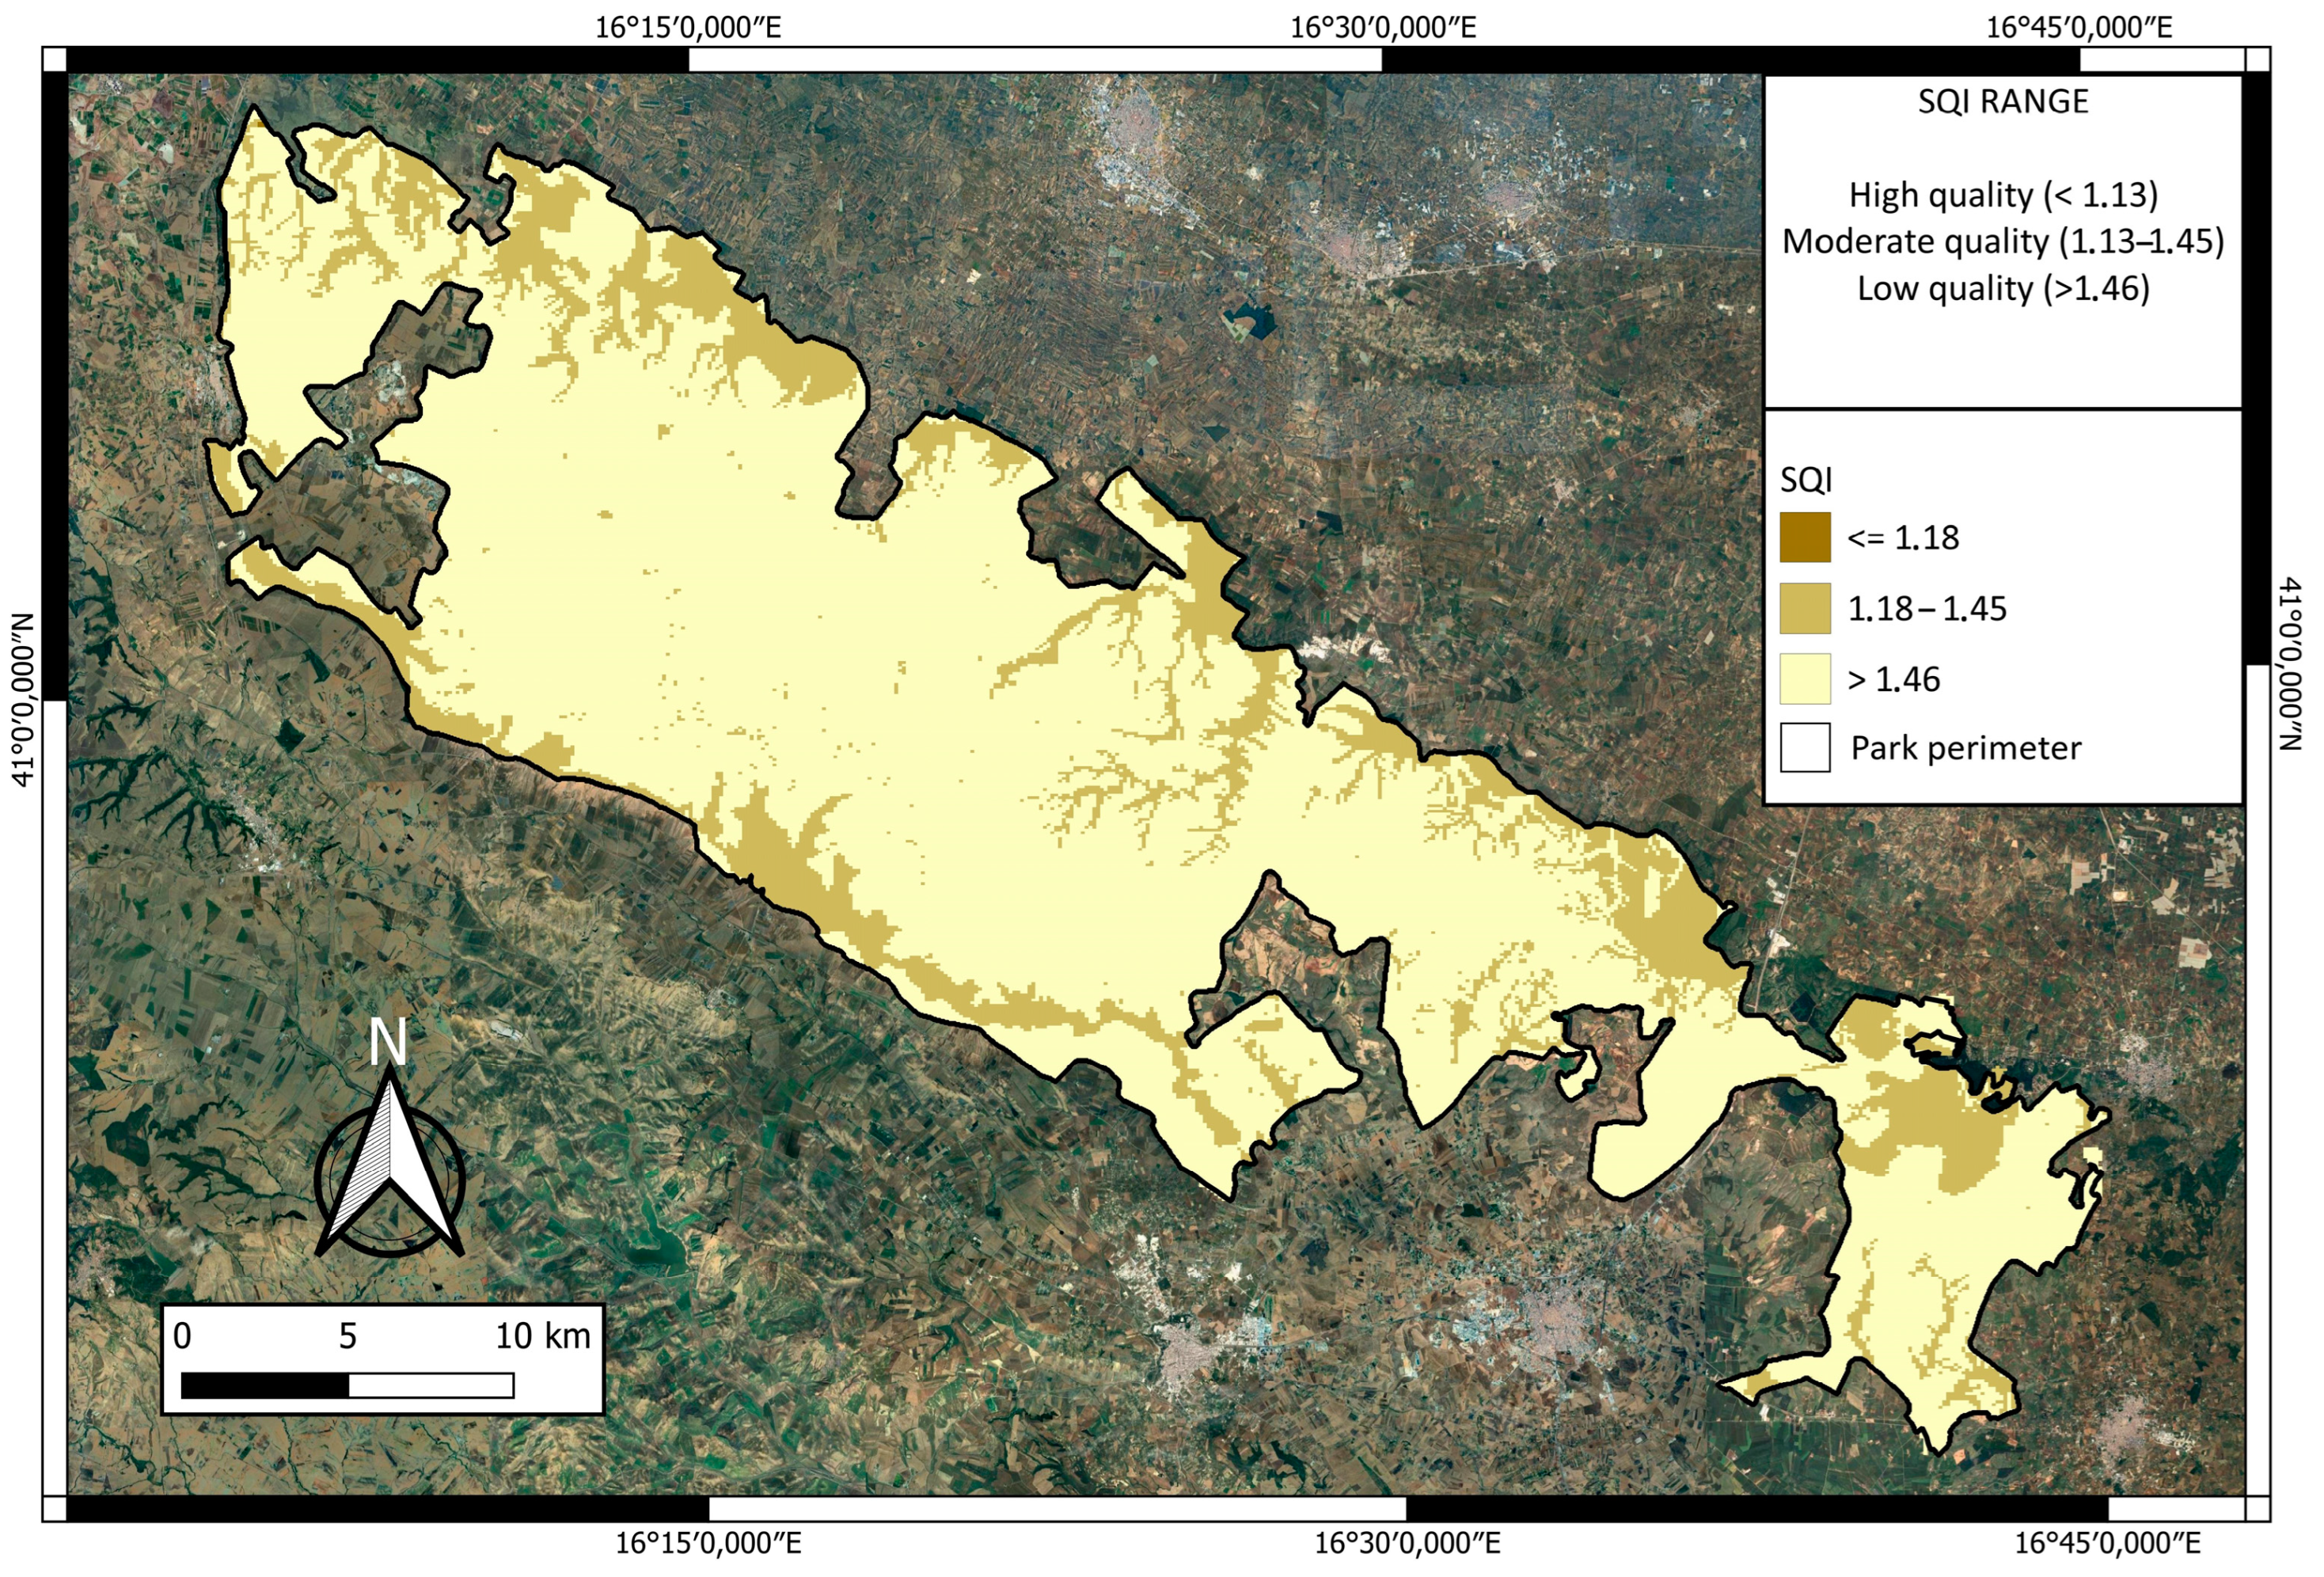
Based on the applied model, the study area exhibited an overall high potential for desertification. A general consideration is that the area is highly sensitive to desertification according to the results obtained from the ESAI. Depending directly on the SQI, CQI, VQI, and KMQI indices, the calculated ESAI shows critical values mostly because of the values related to the SQI, VQI, and KMQI indices. These show low-quality scores for more than 50% of the total area, demonstrating a direct relationship with the high percentage of land falling into the Critical sub-type in the ESAs.
Regarding the SQI, the results show that the soil in this area is mostly of a low-quality type, characterized by poor drainage and reduced soil thickness; thus, the Alta Murgia soil can be considered very vulnerable to erosion and unfavorable for vegetation growth. In other words, it is highly sensitive to desertification. Given the nature of the parent material, soil texture and depth could be considered the main factors in the reduction in soil quality, also considering the fact that the study area is a plateau, with slopes ranging from flat to gentle. However, this high percentage of degraded soil is mostly linked with anthropogenic activities. In particular, the stone-clearing and crushing practices do not favor good soil quality and enhance environment degradation, also worsening other indices, such as drainage and rock fragments. In the study area, low soil quality mainly characterizes the territories adapted to agricultural soils; those where the soil quality is moderate are mostly dolines/sinkholes and valleys (locally named “lame”), where soil depth becomes more substantial, reaching values greater than a few meters.
The CQI indicates a moderate quality class for the climate of the area, despite its semi-arid characters, with a moderate amount of rainfall, and thus this has less influence on the ESAI.
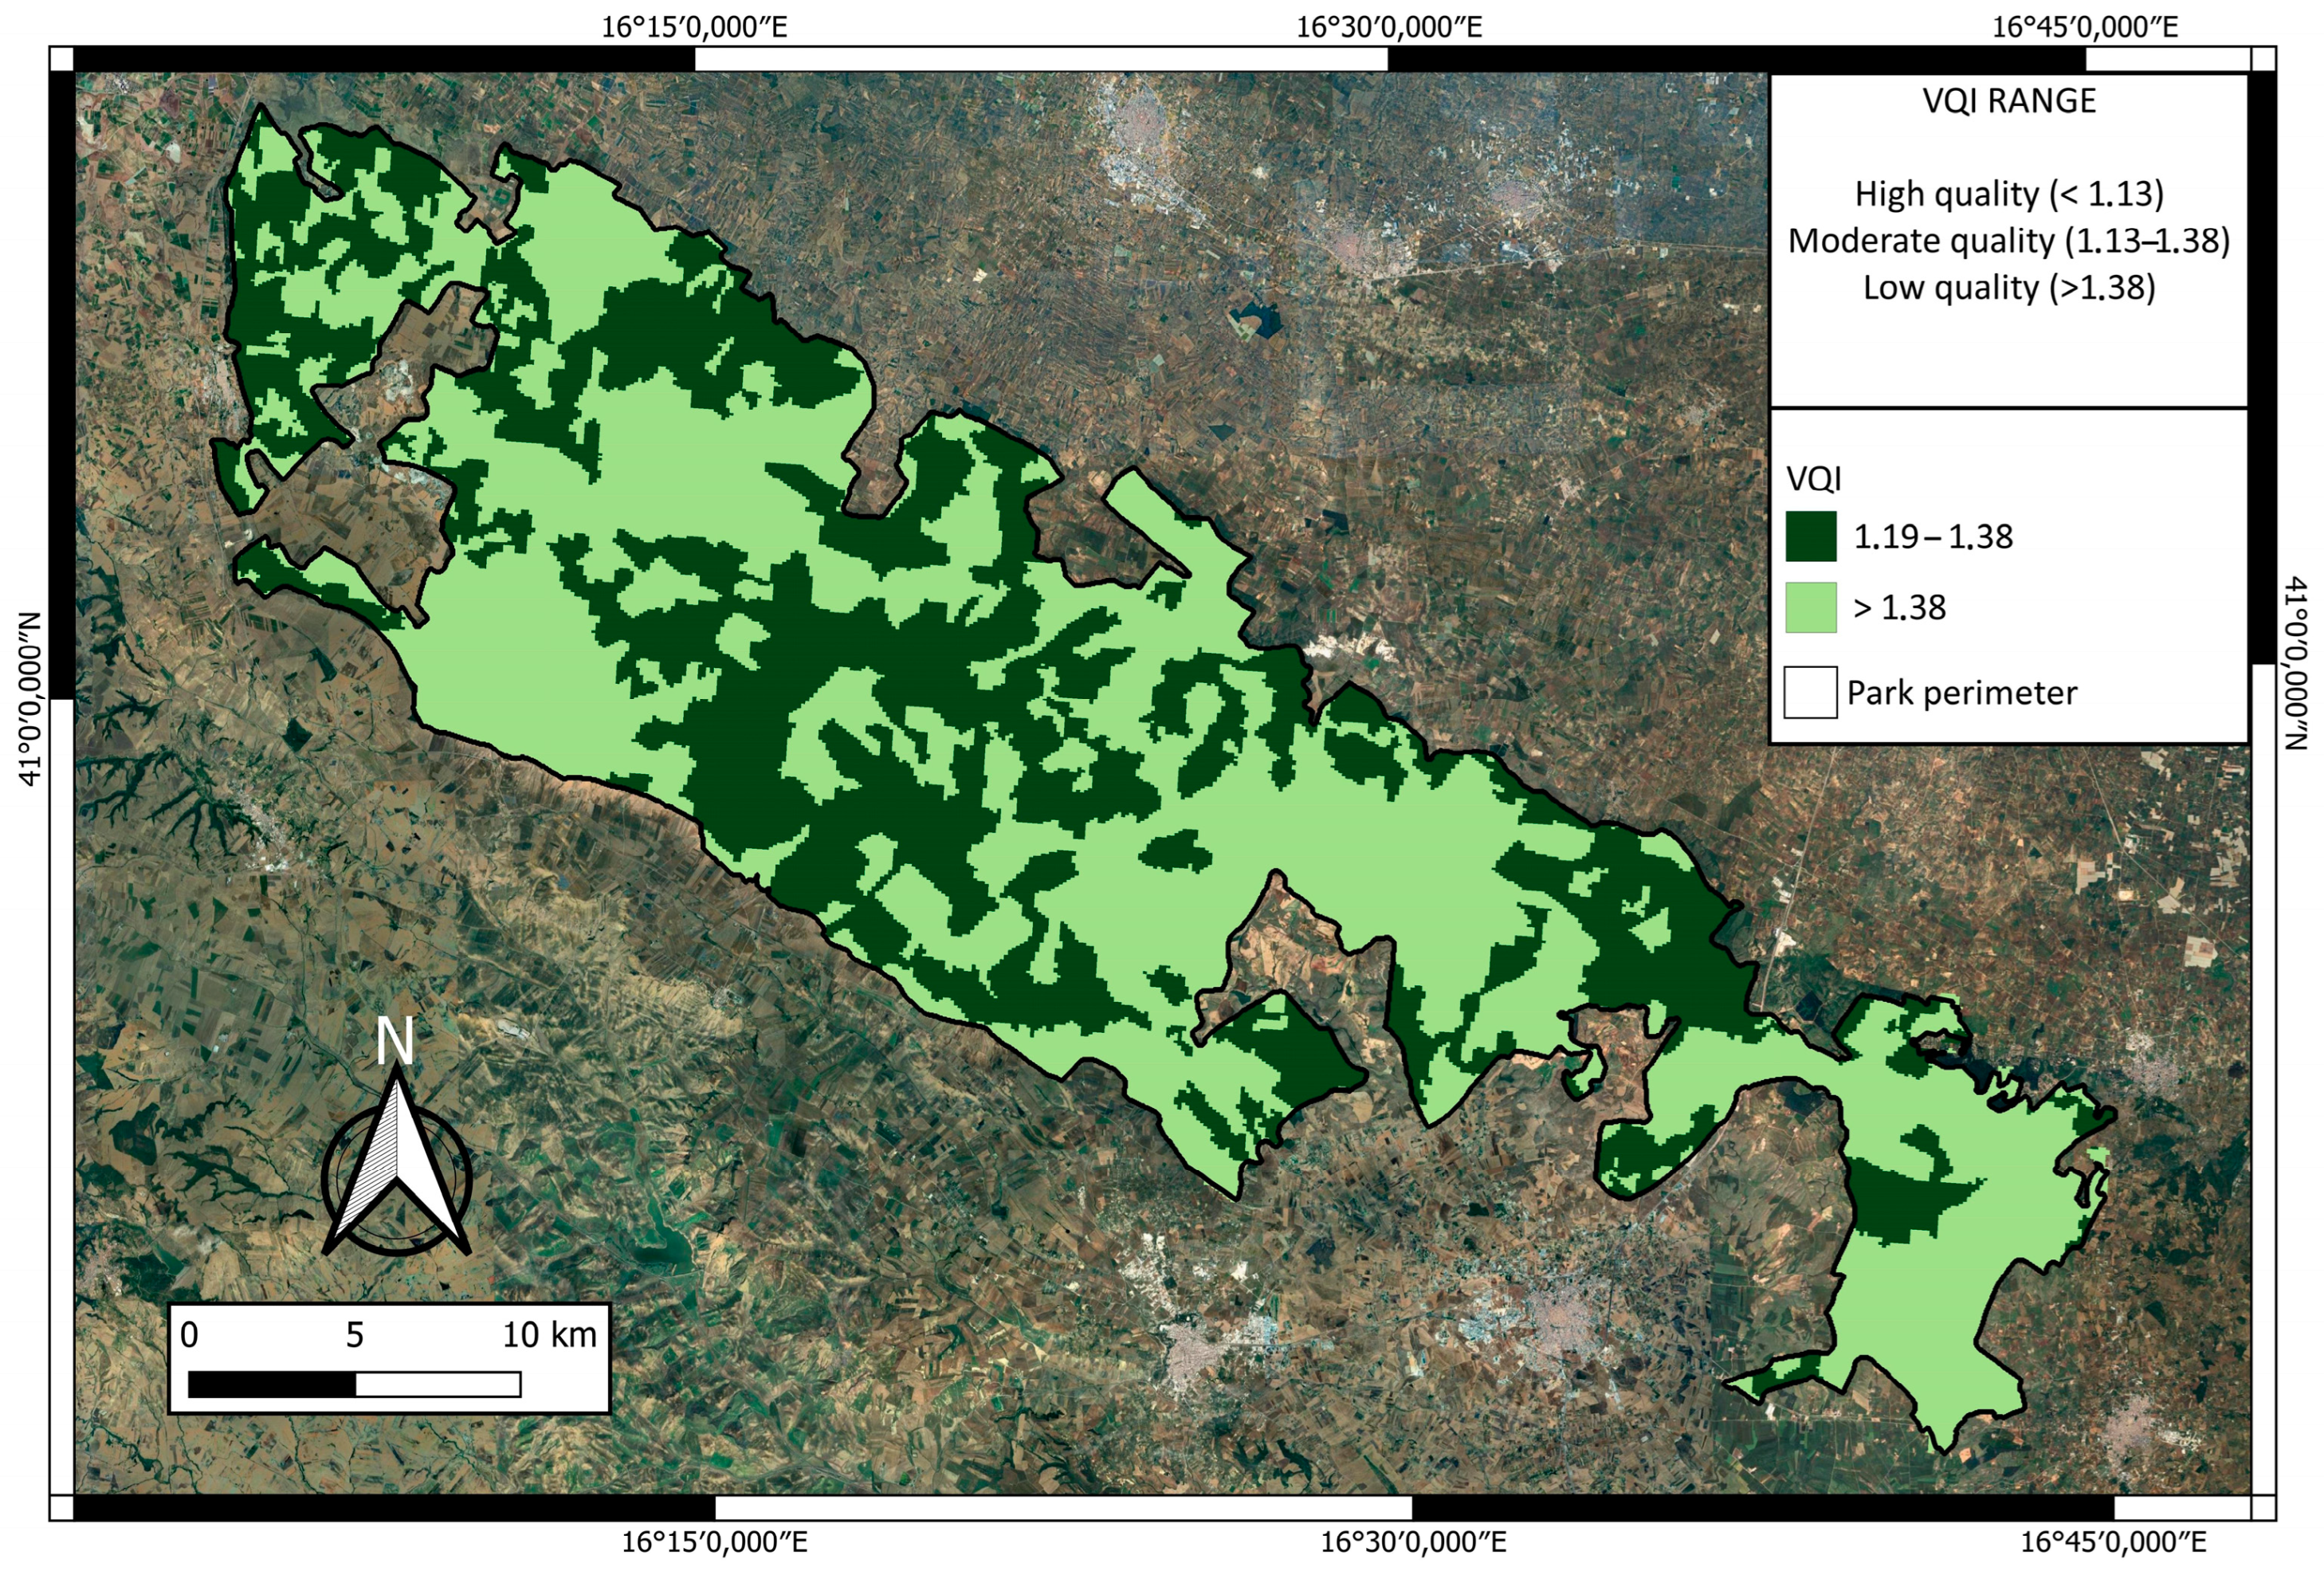
As the overall results show for the Soil Quality Index, the high percentage of low-quality vegetation in Alta Murgia can also be explained by its conversion to arable land. The VQI mostly categorizes the land into the low-quality type, with a lack of vegetation to reduce the desertification sensitivity resulting from fires, droughts, and erosion. Forests are basically absent, and most of the vegetation comes from agricultural activities related to cultivation and grazing.
Eventually, as regards the KDI, the implementation of this index to assess the Alta Murgia allowed for the identification of the most threatened components of the karst terrain. The high disturbance score characterizes indicators of quarrying, soil erosion, soil compaction, decoration removal/vandalism, mineral/sediment removal, sediment compaction, industrial spills/dumping, vegetation removal, and regulation enforcement, with most of them belonging to the category of Geomorphology. Quarrying activities are widespread in the Alta Murgia karst plateau, especially in the north-eastern territories (Minervino Murge municipality), which has a high quarry density. Quarries with a remarkable extension (up to 1.3 km2) can also be found in other municipalities, such as Andria or Altamura. Some abandoned quarries are often used as a dump for pollutants from industrial or commercial activities, as is unfortunately quite common in other karst areas of Apulia [81,82]. Generally, quarries change the appearance of the karst landscape, influencing other indices such as soil erosion, soil compaction, industrial spills/dumping, and vegetation removal, to which a high KDI value was assigned. The indicators soil erosion and soil compaction received the highest value, mainly due to the stone clearing and crushing activities, which involved a considerable portion of Alta Murgia. These activities also had a negative impact on the indicator vegetation removal; the conversion of extended grassland to arable land severely damaged the typical vegetation, which was originally characterized by significant biological diversity. In addition, deforestation activities have been practiced over millennia for felling and grazing, as evidenced by the presence of remnants of deciduous forests. For these reasons, the maximum disturbance score was assigned to the indicator vegetation removal. Regarding underground karst features, the whole study area contains a significant amount of cave systems [60,83] that also includes remarkable sites such as the Lamalunga Cave, where a Neanderthal skeleton was found in 1990 [84]. Many caves in the territory are easily accessible even by non-expert cavers, and this often results in low protection of these sites and their important deposits. This greatly influenced the score attributed to the indicators decoration removal/vandalism, mineral/sediment removal, and sediment compaction, which received the highest value. Many of the problems related to the previously discussed indicators are still unsolved, even following the Alta Murgia’s membership in the UNESCO geopark circuit. For these reasons, some negative scores were assigned to the indicators belonging to the category Cultural, such as regulation enforcement (score of 3) and regulatory protection (score of 2).
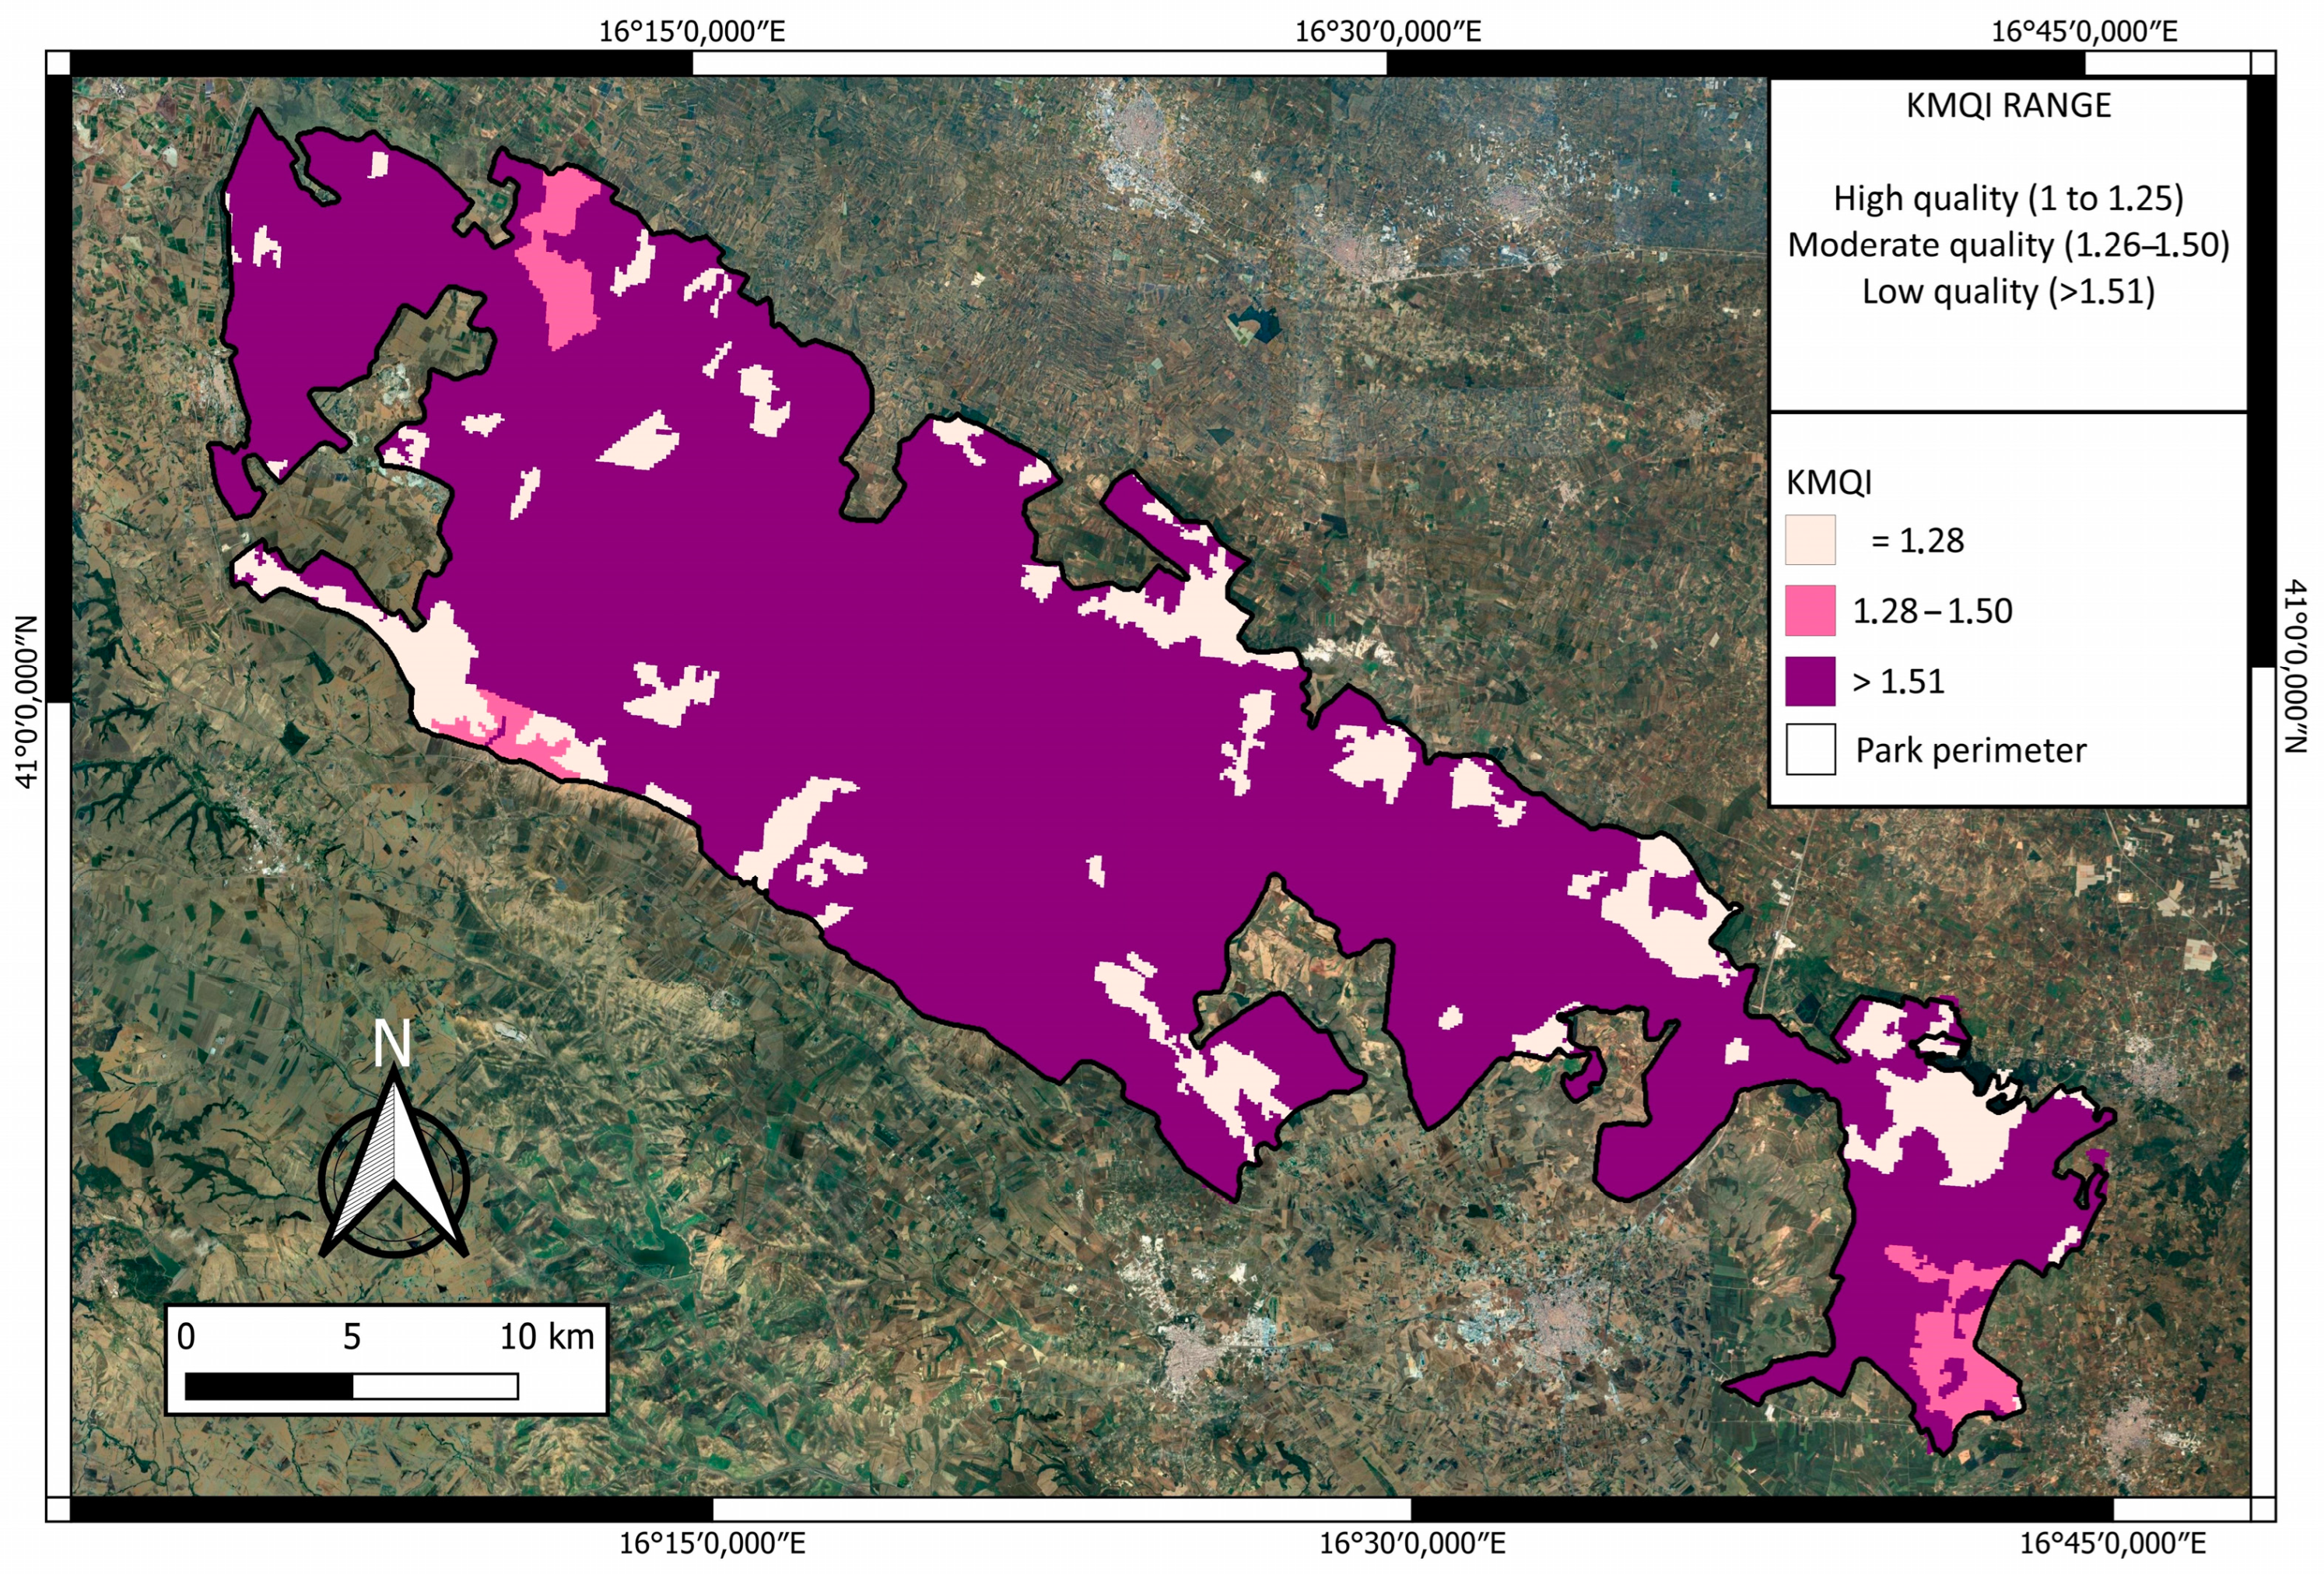
The KMQI considers the KDI sub-indexes (quarrying, stone clearing and crushing activities, spills and dumping, lack of regulation enforcement, etc.) and demonstrates that the studied karst environment is highly vulnerable to human disturbance. The low-quality score obtained using the KMQI is also justified by the widespread use of land for agricultural purposes and from the excessive livestock density, which often leads to overgrazing phenomena causing both a reduction in the availability of forage and an increase in soil erosion and ecological damage. In particular, the sub-indicator “intensity of land cultivation” has significant values (2.00); most of the study area (84.87% according to CLC data) belongs to the Utilized Agricultural Area [24] class, indicating low management quality values (>1.51) and a higher degradation risk due to the intensification of agricultural practices, and in increase in the use of mechanization, fertilizers, pesticides, etc. the KMQI also shows a low quality score for pasturelands because of the very high livestock density (>100 heads per square km), with an overall average of 282 sheep heads for 1 km2 [85]. The values for the sub-indicators “land use intensity in forest” and “urban/industrial infrastructure density” are low (1.00), mainly due to the absence or near-absence of forests or urban and industrial infrastructure, which positively affects the final KMQI value. The sub-indicator regarding mining areas has a high value (2.00) because of the high density of quarries in the study area and the poor measures for controlling erosion. Lastly, the sub-indicator concerning land use shows a moderate value (1.33) as a result of the possibility convertible areas for grazing or crops.

6. Conclusions

In this study, the desertification risk of the Alta Murgia karst plateau was assessed through a combination of the MEDALUS model and a GIS-based approach. The MEDALUS procedure was adjusted to develop a local model that takes into account the karst nature of the study area. The aim of this research was to assess the degree of disturbance caused by both the effects of climate changes and the negative anthropogenic activities carried out over the years in this type of fragile environment. Four composite quality indexes, each comprising several sub-indicators, were analyzed; these were soil, climate, vegetation, and karst management. Then, such indices were combined and processed in the GIS environment to develop a raster map of environmentally sensitive areas to desertification. According to the obtained results, the key findings of this study can be summarized as follows:
  • The Critical land category accounts for 97% of the study area, as indicated by the desertification risk map;
  • The predominance of the Critical class is primarily attributed to human activities, which introduce additional threats (related especially to the SQI, VQI, and KMQI) to areas already naturally prone to desertification;
  • The evaluation of KDI sub-index used for calculating KMQI (originally named MQI) provided deeper insights into the key human-induced disturbances affecting desertification risk in the Alta Murgia karst plateau;
  • The results obtained could be slightly overestimated for all the calculated indices, as indicated in the map, where no area with “high quality” is present;
  • Some of the parameters that were needed to calculate the different indices do not take into account the complex and case-specific environmental conditions.
Nevertheless, this study demonstrated that the MEDALUS approach is conceptually very simple and easy to implement as a GIS-based method even at a local scale, although there is still a need to collect more input information that might be available in the georeferenced format. The approach has a high level of flexibility and offers wide-ranging opportunities to update existing indices. Finally, this study could be a good starting point to obtain more in-depth knowledge on desertification in karst territories and highlight priorities for land protection and preservation. The maps resulting from the combined procedure, which are presented and explained throughout the manuscript, can also be used by local managing authorities for the definition and adoption of strategic actions to mitigate desertification in these vulnerable areas around the world.

Author Contributions

Conceptualization, U.S.D., I.S.L. and M.P. methodology, U.S.D., I.S.L. and M.P.; software, U.S.D. validation, U.S.D., I.S.L. and M.P.; formal analysis, U.S.D.; investigation, U.S.D.; resources, U.S.D.; data curation, U.S.D. and M.P.; writing—original draft preparation, U.S.D., I.S.L. and M.P.; writing—review and editing, I.S.L. and M.P.; visualization, U.S.D. and V.P.; supervision, I.S.L. and M.P.; project administration, M.P. All authors have read and agreed to the published version of the manuscript.

Funding

This research received no external funding.

Data Availability Statement

Data is unavailable due to privacy restrictions.

Conflicts of Interest

The authors declare no conflicts of interest.

References

  1. United Nations Convention to Combat Desertification (UNCCD). Preserving Our Common Ground: UNCCD 10 Years on; United Nations Convention to Combat Desertification (UNCCD): Bonn, Germany, 2004; 20p. [Google Scholar]
  2. Yassoglou, N.J.; Kosmas, C. Desertification in the Mediterranean Europe. A Case in Greece. Rala Rep. 2000, 27–33. [Google Scholar]
  3. Safriel, U.; Adeel, Z.; Niemeijer, D.; Puigdefabregas, J.; White, R.; Lal, R.; Winslow, M.; Ziedler, J.; Prince, S.; Archer, E.; et al. Dryland systems. In Ecosystems and Human Well-Being: Current State and Trends; Hassan, R., Scholes, R., Ash, N., Eds.; Island Press: Washington, DC, USA, 2005; pp. 623–662. [Google Scholar]
  4. Baartman, J.; Lynden, G.; Reed, M.; Ritsema, C.; Hessel, R. (Eds.) Desertification and Land Degradation: Origins, Processes and Solutions; Scientific Report 4; DESIRE Project: Wageningen, The Netherlands, 2007. [Google Scholar]
  5. Vogt, J.V.; Safriel, U.; Von Maltitz, G.; Sokona, Y.; Zougmore, R.; Bastin, G.; Hill, J. Monitoring and assessment of land degradation and desertification: Towards new conceptual and integrated approaches. Land Degrad. Dev. 2011, 22, 150–165. [Google Scholar] [CrossRef]
  6. Spinoni, J.; Vogt, J.; Naumann, G.; Carrao, H.; Barbosa, P. Towards identifying areas at climatological risk of desertification using the K¨oppen–Geiger classification and FAO aridity index. Int. J. Climatol. 2015, 35, 2210–2222. [Google Scholar] [CrossRef]
  7. Becerril-Piña, R.; Mastachi-Loza, C.A. Desertification: Causes and countermeasures. In Life on Land; Springer: Cham, Switzerland, 2021; pp. 219–231. [Google Scholar] [CrossRef]
  8. UNCCD. Report of the Conference of the Parties on Its Eighth Session, Held in Madrid from 3 to 14 September 2007. Decision 3/COP.8. ICCD/COP (8)/16/Add.1. Available online: https://www.unccd.int/official-documents/cop-8-madrid-2007/iccdcop816add1 (accessed on 2 November 2024).
  9. Kosmas, C.; Kirkby, M.; Geeson, N. The MEDALUS Project: Mediterranean Desertification and Land Use; European Commission: Brussels, Belgium, 1999. [Google Scholar]
  10. Contador, J.L.; Schnabel, S.; Gutiérrez, A.G.; Fernandez, M.P. Mapping sensitivity to land degradation in Extremadura. SW Spain. Land Degrad. Dev. 2009, 20, 129–144. [Google Scholar] [CrossRef]
  11. Lahlaoi, H.; Rhinane, H.; Hilali, A.; Lahssini, S.; Moukrim, S. Desertification assessment using MEDALUS model in watershed Oued El Maleh, Morocco. Geosciences 2017, 7, 50. [Google Scholar] [CrossRef]
  12. Karamesouti, M.; Panagos, P.; Kosmas, C. Model-based spatio-temporal analysis of land desertification risk in Greece. Catena 2018, 167, 266–275. [Google Scholar] [CrossRef]
  13. Elnashar, A.; Zeng, H.; Wu, B.; Gebremicael, T.G.; Marie, K. Assessment of environmentally sensitive areas to desertification in the Blue Nile Basin driven by the MEDALUS-GEE framework. Sci. Total Environ. 2022, 815, 152925. [Google Scholar] [CrossRef]
  14. Ferrara, A.; Kosmas, C.; Salvati, L.; Padula, A.; Mancino, G.; Nolè, A. Updating the MEDALUS-ESA framework for worldwide land degradation and desertification assessment. Land Degrad. Dev. 2020, 31, 1593–1607. [Google Scholar] [CrossRef]
  15. Afzali, S.F.; Khanamani, A.; Maskooni, E.K.; Berndtsson, R. Quantitative assessment of environmental sensitivity to desertification using the modified MEDALUS model in a semiarid area. Sustainability 2021, 13, 7817. [Google Scholar] [CrossRef]
  16. Bouhata, R.; Bensekhria, A. Adaptation of MEDALUS method for the analysis depicting desertification in Oued Labiod valley (Eastern Algeria). Arab. J. Geosci. 2021, 14, 365. [Google Scholar] [CrossRef]
  17. Macêdo, T.H.D.J.; Tagliaferre, C.; da Silva, B.L.; De Paula, A.; Lemos, O.L.; Adenilson Rocha, F.; Pinheiro, R.G.d.S.; Santos Lima, A.C. Assessment of land desertification in the Brazilian east Atlantic region using the medalus model and google earth engine. Land 2023, 13, 31. [Google Scholar] [CrossRef]
  18. Parise, M. Surface and subsurface karst geomorphology in the Murge (Apulia, southern Italy). Acta Carsologica 2011, 40, 79–93. [Google Scholar] [CrossRef]
  19. Ford, D.C.; Williams, P.W. Karst Hydrogeology and Geomorphology; John Wiley & Sons Ltd.: Chichester, UK, 2007; p. 562. [Google Scholar]
  20. Parise, M.; Gunn, J. Natural and anthropogenic hazards in karst areas: An introduction. Geol. Soc. Lond. Spec. Publ. 2007, 279, 1–3. [Google Scholar] [CrossRef]
  21. Montanarella, L.; Paracchini, R.; Rusco, E. Programme of Actions to Contrast Droughts and Desertification, Indication of Vulnerable areas in Apulia; Regione Puglia, Settore Programmazione Ufficio Informatico e Servizio Cartografico: Bari, Italy, 2000. (In Italian) [Google Scholar]
  22. Dipace, A.; Baldassarre, G. Areas sensitives to desertification in the Tavoliere of Apulia. G. Geol. Appl. 2005, 2, 203–209. (In Italian) [Google Scholar]
  23. Ladisa, G.; Todorovic, M.; Liuzzi, G.T. Assessment of desertification in semi-arid Mediterranean environments: The case study of Apulia Region (Southern Italy). In Land Degradation and Desertification: Assessment, Mitigation and Remediation; Springer: Dordrecht, The Netherlands, 2010; pp. 493–516. [Google Scholar] [CrossRef]
  24. Ladisa, G.; Todorovic, M.; Liuzzi, G.T. A GIS-based approach for desertification risk assessment in Apulia region, SE Italy. Phys. Chem. Earth Parts A/B/C 2012, 49, 103–113. [Google Scholar] [CrossRef]
  25. van Beynen, P.; Townsend, K. A disturbance index for karst environments. Environ. Manag. 2005, 36, 101–116. [Google Scholar] [CrossRef]
  26. North, L.A.; Van Beynen, P.E.; Parise, M. Interregional comparison of karst disturbance: West-central Florida and southeast Italy. J. Environ. Manag. 2009, 90, 1770–1781. [Google Scholar] [CrossRef]
  27. Pieri, P.; Festa, V.; Moretti, M.; Tropeano, M. Quaternary tectonic of the Murge area (Apulian foreland—Southern Italy). Ann. Geofis. 1997, 40, 1395–1404. [Google Scholar] [CrossRef]
  28. Festa, V. Cretaceous structural features of the Murge area (Apulian foreland, southern Italy). Eclogae Geol. Helv. 2003, 96, 11–22. [Google Scholar]
  29. Tropeano, M.; Caldara, M.A.; De Santis, V.; Festa, V.; Parise, M.; Sabato, L.; Spalluto, L.; Francescangeli, R.; Iurilli, V.; Mastronuzzi, G.A.; et al. Geological Uniqueness and Potential Geotouristic Appeal of Murge and Premurge, the First Territory in Apulia (Southern Italy) Aspiring to Become a UNESCO Global Geopark. Geosciences 2023, 13, 131. [Google Scholar] [CrossRef]
  30. Forte, L.; Perrino, E.V.; Terzi, M. The prairies with Stipa austroitalica Martinovsky ssp. austroitalica in Alta Murgia (Apulia) and Murgia Materana (Basilicata). Fitosociologia 2005, 42, 83–103. (In Italian) [Google Scholar]
  31. Perrino, E.V.; Wagensommer, R.P. Habitats of Directive 92/43/EEC in the National Park of Alta Murgia (Apulia-Southern Italy): Threat, action and relationships with plant communities. J. Environ. Sci. Eng. 2013, 2, 229. [Google Scholar]
  32. Sauro, U. A polygonal karst in Alte Murge (Puglia, Southern Italy). Z. Fur Geomorphol. 1991, 35, 207–223. [Google Scholar] [CrossRef]
  33. Parise, M.; Federico, A.; Delle Rose, M.; Sammarco, M. Karst Terminology in Apulia (Southern Italy). Acta Carsologica 2003, 32, 65–82. [Google Scholar] [CrossRef]
  34. File Vettoriali-Paesaggio-SIT Puglia. Available online: https://pugliacon.regione.puglia.it/web/sit-puglia-paesaggio/file-vettoriali (accessed on 10 November 2023).
  35. Autorità Distrettuale dell’Appennino Meridionale, Geo-Hydrological Hazards Plan. Available online: https://www.distrettoappenninomeridionale.it/piano-stralcio-assetto-idrogeologico-rischio-idraulico/ (accessed on 18 October 2023). (In Italian).
  36. Regional Register of Natural Caves and Artificial Cavities. Available online: http://catasto.fspuglia.it/df/dati.php (accessed on 20 October 2023). (In Italian).
  37. Williams, P.W. Subcutaneous hydrology and the development of doline and cockpit karst. Z. Für Geomorphol. 1985, 29, 463–482. [Google Scholar] [CrossRef]
  38. Williams, P.W. The epikarst: Evolution of understanding. Karst Waters Inst. Spec. Publ. 2004, 9, 8–15. [Google Scholar]
  39. Zumpano, V.; Pisano, L.; Parise, M. An integrated framework to identify and analyze karst sinkholes. Geomorphology 2019, 332, 213–225. [Google Scholar] [CrossRef]
  40. Parise, M.; Pascali, V. Surface and subsurface environmental degradation in the karst of Apulia (southern Italy). Environ. Geol. 2003, 44, 247–256. [Google Scholar] [CrossRef]
  41. Pisano, L.; Zumpano, V.; Pepe, M.; Liso, I.S.; Parise, M. Assessing Karst landscape degradation: A case study in Southern Italy. Land 2022, 11, 1842. [Google Scholar] [CrossRef]
  42. Puglia.Con-Cartografia CTR, DTM, Ortophotos, UDS and Hydro-Geomorphological Maps. Available online: https://pugliacon.regione.puglia.it/services/pubblica/paesaggio-urbanistica/cartografia-ctr-dtm-ortofoto-uds-e-carte-idrogeomorfologiche (accessed on 10 November 2022).
  43. CORINE Land Cover 2018 (Vector/Raster 100 m), Europe, 6-Yearlly. Available online: https://land.copernicus.eu/en/products/corine-land-cover/clc2018 (accessed on 18 May 2023).
  44. National Geoportal. Service of Consultation-WMS. Available online: https://gn.mase.gov.it/portale/servizio-di-consultazione-wms (accessed on 14 November 2022). (In Italian)
  45. Bashour, I.I.; Sayegh, A.H. Methods of Analysis for Soils of Arid and Semi-Arid Regions; Food and Agriculture Organization of the United Nations: Rome, Italy, 2007. [Google Scholar]
  46. Williams, P.W. Rocky desertification. In Encyclopedia of Geomorphology; Routledge: London, UK, 2004; pp. 883–884. [Google Scholar]
  47. Basso, F.; Bellotti, A.; Bove, E.; Faretta, S.; Ferrara, A.; Mancino, G.; Pisante, M.; Quaranta, G.; Taberner, M. Degradation processes in the Agri Basin: Evaluating environmental sensitivity to desertification at basin scale. In Proceedings of the International Seminar on Indicator for Assessing Desertification in the Mediterranean, Porto Torres, Italy, 18–20 September 1998. [Google Scholar]
  48. Luvisols (LV). Available online: https://www.isric.org/sites/default/files/major_soils_of_the_world/set9/lv/luvisol.pdf (accessed on 2 December 2022).
  49. Gunn, J. The geomorphological impacts of limestone quarrying. Catena 1993, 25, 187–198. [Google Scholar]
  50. Parise, M. Modern resource use and its impact in karst areas—mining and quarrying. Z. Fur Geomorphol. 2016, 60, 199–216. [Google Scholar] [CrossRef]
  51. Lee, E.J.; Piao, D.; Song, C.; Kim, J.; Lim, C.H.; Kim, E.; Moon, J.; Kafatos, M.; Lamchin, M.; Jeon, S.W. Assessing environmentally sensitive land to desertification using MEDALUS method in Mongolia. For. Sci. Technol. 2019, 15, 210–220. [Google Scholar] [CrossRef]
  52. Meza Mori, G.; Torres Guzmán, C.; Oliva-Cruz, M.; Salas López, R.; Marlo, G.; Barboza, E. Spatial analysis of environmentally sensitive areas to soil degradation using MEDALUS model and GIS in Amazonas (Peru): An alternative for ecological restoration. Sustainability 2022, 14, 14866. [Google Scholar] [CrossRef]
  53. Kosmas, C.; Tsara, M.; Moustakas, N.; Karavitis, C. Identification of indicators for desertification. Ann. Arid Zone 2003, 42, 393–416. [Google Scholar]
  54. Ait Lamqadem, A.; Pradhan, B.; Saber, H.; Rahimi, A. Desertification sensitivity analysis using MEDALUS model and GIS: A case study of the Oases of Middle Draa Valley, Morocco. Sensors 2018, 18, 2230. [Google Scholar] [CrossRef]
  55. Yang, J.; El-Kassaby, Y.A.; Guan, W. The effect of slope aspect on vegetation attributes in a mountainous dry valley, Southwest China. Sci. Rep. 2020, 10, 16465. [Google Scholar] [CrossRef]
  56. Beullens, J.; Van de Velde, D.; Nyssen, J. Impact of slope aspect on hydrological rainfall and on the magnitude of rill erosion in Belgium and northern France. Catena 2014, 114, 129–139. [Google Scholar] [CrossRef]
  57. D’Ettorre, U.S.; Liso, I.S.; Parise, M. Desertification in karst areas: A review. Earth Sci. Rev. 2024, 253, 104786. [Google Scholar] [CrossRef]
  58. Formicola, W.; Gueguen, E.; Martimucci, V.; Parise, M.; Ragone, G. Caves below quarries and quarries above caves: Problems, hazard and research. A case study from southern Italy. Geol. Soc. Am. Abstr. Program 2010, 42. [Google Scholar]
  59. Parise, M. The Impacts of Quarrying in the Apulian Karst. In Advances in Research in Karst Media; Carrasco, F., La Moreaux, J.W., Duran Valsero, J.J., An-dreo, B., Eds.; Springer: Berlin/Heidelberg, Germany, 2010; pp. 441–447. [Google Scholar] [CrossRef]
  60. Gueguen, E.; Formicola, W.; Martimucci, M.; Parise, M.; Ragone, G. Geological controls in the development of palaeo-karst systems of High Murge (Apulia). Rend. Online Società Geol. Ital. 2012, 21, 617–619. [Google Scholar]
  61. Gunn, J.; Bailey, D. Limestone quarrying and quarry reclamation in Britain. Environ. Geol. 1993, 21, 167–172. [Google Scholar] [CrossRef]
  62. Calò, F.; Parise, M. Evaluating the human disturbance to karst environments in Southern Italy. Acta Carsol. 2006, 35, 47–56. [Google Scholar] [CrossRef]
  63. Calò, F.; Parise, M. Waste management and problems of groundwater pollution in karst environments in the context of a post-conflict scenario: The case of Mostar (Bosnia Herzegovina). Habitat Int. 2009, 33, 63–72. [Google Scholar] [CrossRef]
  64. Gillieson, D. Caves: Processes, Development and Management; John Wiley & Sons: Hoboken, NJ, USA, 2009. [Google Scholar]
  65. Parise, M.; De Waele, J.; Gutierrez, F. Engineering and environmental problems in karst—An introduction. Eng. Geol. 2008, 99, 91–94. [Google Scholar] [CrossRef]
  66. Parise, M.; Gabrovsek, F.; Kaufmann, G.; Ravbar, N. Recent advances in karst research: From theory to fieldwork and applications. In Advances in Karst Research: Theory, Fieldwork and Applications; Parise, M., Gabrovsek, F., Kaufmann, G., Ravbar, N., Eds.; Geological Society of London: London, UK, 2018; pp. 1–24. [Google Scholar] [CrossRef]
  67. Gillieson, D.; Gunn, J.; Auler, A.; Bolger, T. (Eds.) Guidelines for Cave and Karst Protection, 2nd ed.; International Union of Speleology: Postojna, Slovenia; IUCN: Gland, Switzerland, 2022. [Google Scholar]
  68. van Beynen, P.; Feliciano, N.; North, L.; Townsend, K. Application of a karst disturbance index in Hillsborough County, Florida. Environ. Manag. 2007, 39, 261–277. [Google Scholar] [CrossRef]
  69. De Waele, J. Evaluating disturbance on mediterranean karst areas: The example of Sardinia (Italy). Environ. Geol. 2009, 58, 239–255. [Google Scholar] [CrossRef]
  70. Day, M.; Halfen, A.; Chenoweth, S. The cockpit country, Jamaica: Boundary issues in assessing disturbance and using a karst disturbance index in protected areas planning. In Karst Management; Van Beynen, P.E., Ed.; Springer: Dortrecht, The Netherlands, 2011; pp. 399–414. [Google Scholar] [CrossRef]
  71. van Beynen, P.E.; Bialkowska-Jelinska, E. Human disturbance of the Waitomo Catchment, New Zealand. J. Environ. Manag. 2012, 108, 130–140. [Google Scholar] [CrossRef]
  72. Kovarik, J.L.; van Beynen, P.E. Application of the Karst Disturbance Index as a raster-based model in a developing country. Appl. Geogr. 2015, 63, 396–407. [Google Scholar] [CrossRef]
  73. Kovarik, J.L.; van Beynen, P.E. Karst-specific composite model for informed resource management decisions on the Biosfera de la Reserva Selva el Ocote, Chiapas, Mexico. Geol. Soc. Lond. Spec. Publ. 2018, 466, 431–442. [Google Scholar] [CrossRef]
  74. Tlhapiso, M.; Stephens, M. Application of the Karst Disturbance Index (KDI) to Kobokwe Cave and Gorge, SE Botswana: Implications for the management of a nationally important geoheritage site. Geoheritage 2020, 12, 39. [Google Scholar] [CrossRef]
  75. Puglia.Con-Web GIS. Quarrying and Mining Activities. Available online: https://pugliacon.regione.puglia.it/web/sit-puglia-ambiente/web-gis-attivita-estrattive (accessed on 3 April 2023). (In Italian).
  76. Marcone, F.; Mastropasqua, F.; Liuzzi, C. Batraco Murgia Project—Final Report; WWF Oasi Società Unipersonale a r.l.: Gland, Switzerland, 2012. (In Italian) [Google Scholar]
  77. Pirola, A. Phytosociology Elements; CLUEB: Bologna, Italy, 1970. (In Italian) [Google Scholar]
  78. Campanile, G.; Cocca, C. Forests of Apulia: Characteristics and problems. Edizioni For. 2005, 2, 172–177. (In Italian) [Google Scholar]
  79. Gaudiano, L.; Silvestri, F.; Pucciarelli, L.; Frassanito, A.G.; Longo, C.; Sorino, R.; Scillitani, G.; Corriero, G. Mammals of the Alta Murgia National Park. In I Mammiferi del Parco Nazionale dell’Alta Murgia. Chiroptera, Lagomorpha, Rodentia, Carnivora, Cetartiodactyla; CeRB Edizioni: Bari, Italy, 2019; pp. 1–96. (In Italian) [Google Scholar]
  80. Galmarini, E.; Vaccarelli, I.; Fiasca, B.; Di Cicco, M.; Parise, M.; Liso, I.S.; Piccini, L.; Galassi, D.M.P.; Cerasoli, F. Regional climate contributes more than geographic distance to beta diversity of copepods (Crustacea Copepoda) between caves of Italy. Sci. Rep. 2023, 13, 21243. [Google Scholar] [CrossRef] [PubMed]
  81. Delle Rose, M.; Federico, A.; Parise, M. Sinkhole genesis and evolution in Apulia, and their interrelations with the anthropogenic environment. Nat. Hazards Earth Syst. Sci. 2004, 4, 747–755. [Google Scholar] [CrossRef]
  82. Delle Rose, M.; Parise, M.; Andriani, G.F. Evaluating the impact of quarrying on karst aquifers of Salento (southern Italy). In Natural and Anthropogenic Hazards in Karst Areas: Recognition, Analysis and Mitigation; Parise, M., Gunn, J., Eds.; Geological Society: London, UK; Special Publications: London, UK, 2007; Volume 279, pp. 153–171. [Google Scholar] [CrossRef]
  83. Pepe, M.; Parise, M. Structural control in sinkhole development and speleogenesis: A case study from the High Murge karst landscape (Apulia, Italy). Geophys. Res. Abstr. 2012, 14, 340. [Google Scholar]
  84. Columbu, A.; Calabrò, L.; Chiarini, V.; De Waele, J. Stalagmites: From science application to museumization. Geoheritage 2021, 13, 47. [Google Scholar] [CrossRef]
  85. Gattullo, M.; Morea, R. The landscape of Alta Murgia, from re-discovery of the sites to new social practices. Geotema 2021, 25, 145–155. (In Italian) [Google Scholar]
Figure 1. The Alta Murgia UNESCO Geopark study area: location and geomorphological features (after [34,35,36], mod.).
Geosciences 14 00320 g001
Figure 2. Parameters used for the definition and mapping of the ESAs to desertification (after [9], mod.).
Geosciences 14 00320 g002
Figure 3. Indicators evaluated for the application of KDI in Alta Murgia (after [25,26], mod.).
Geosciences 14 00320 g003
Figure 4. Soil Quality Index map in Alta Murgia.
Geosciences 14 00320 g004
Figure 5. Climate Quality Index map in Alta Murgia.
Geosciences 14 00320 g005
Figure 6. Vegetation Quality Index map in Alta Murgia.
Geosciences 14 00320 g006
Table 1. Data used in the study.
Data UsedSource
Digital Elevation Model (2006–2007)Apulia region geodatabase [42]
Land use map (2018)CORINE land cover map [43]
Soil typesEco-pedological map of Italy [44]
Geomorphological featuresApulia region geodatabase [34]
Rainfall, temperatureRegional Service of Civil Protection, hydrological annals
Table 2. Classes and corresponding weights of soil sub-indexes (after [9]).
TextureClassDescriptionGrain Size ClassWeight
1GoodL, SCL, SL, LS, CL1.0
2ModerateSC, SiL, SiCL1.2
3PoorSi, C, SiC1.6
4Very poorS2.0
SlopeClassDescriptionSlope (%)Weight
1Very gentle to flat<61.0
2Gentle6–181.2
3Steep18–351.5
4Very steep>352.0
DrainageClassDescriptionWeight
1Well drained1
2Imperfectly drained1.2
3Poorly drained2
Parent MaterialClassDescriptionParent MaterialWeight
1GoodShale, schist, basic, ultra-basic, conglomerates, unconsolidated1.0
2Moderatelimestone, marble, granite, rhyolite, ignibrite, gneiss, siltstone, sandstone1.7
3PoorMarl, pyroclastics2.0
Soil DepthClassDescriptionDepth (cm)Weight
1Deep>751.0
2Moderate75–302.0
3Shallow15–303.0
4Very shallow<154.0
Rock FragmentsClassDescriptionRF Cover (%)Weight
1Very stony>601.0
2Stony20–601.3
3Bare to slightly stony<202.0
L: loam; SCL: sandy clay loam; SL: sandy loam; LS: loamy sand; CL: clay loam; SC: sandy clay; SiL: silty loam; SiCL: silty clay loam; Si: silt; C: clay; SiC: silty clay; S: sand.
Table 3. Classes and corresponding weights of climate sub-indexes (after [9]).
RainfallClassRainfall (mm)Weight
1>6501.0
2280–6502.0
3<2804.0
AridityClassBGI rangeWeight
1<501.0
250–751.1
375–1001.2
4100–1251.4
5125–1501.8
6>1502.0
Slope AspectClassAspectWeight
1NW-NE1.0
2SW-SE2.0
Table 4. Classes and corresponding weights of vegetation sub-indexes based on the CLC land use class codes (after [9], mod.).
Type (Corine Land Cover)Fire RiskErosion ProtectionDrought ResistanceVegetation Cover
112: Discontinuous urban fabric1.32.02.01.0
121: Industrial or commercial units1.02.01.42.0
131: Mineral extraction sites1.01.81.42.0
211: Non-irrigated arable land1.01.31.22.0
221: Vineyards1.31.31.72.0
223: Olive groves1.01.01.01.0
231: Pastures1.01.01.02.0
241: Annual crops associated with permanent crops1.32.02.02.0
242: Complex cultivation patterns1.31.61.22.0
243: Land principally occupied by agriculture, with significance areas of natural vegetation2.01.31.22.0
311: Broad-leaved forest1.31.31.21.8
312: Coniferous forest1.31.31.72.0
313: Mixed forest1.31.31.02.0
321: Natural grasslands1.31.31.22.0
323: Sclerophyllous vegetation1.02.01.02.0
324: Transitional woodland-shrub1.31.31.21.8
333: Sparsely vegetated areas2.01.31.22.0
Table 5. Classes and corresponding weights of karst management sub-indexes (after [9,23], mod.).
Intensity of Land CultivationClassDescriptionCropland Cover (%)Weight
1Low20–401.00
2Moderate40–601.33
3High60–801.66
4Very high<20; >802.00
Livestock DensityClassDescriptionHeads Per Square kmWeight
1Low<201.00
2Moderate20–601.33
3High60–1001.66
4Very high>1002.00
Land Use Intensity in ForestClassDescriptionWeight
1Low1.0
2Moderate1.5
3High2.0
Land Use in Sparse Vegetation AreasClassDescriptionWeight
1Low1.00
2Moderate1.33
3High1.66
4Very high2.00
Urban/Industrial Infrastructure DensityClassDescriptionWeight
1Low1.00
2Moderate1.33
3High1.66
4Very high2.00
Mining AreasClassDescriptionErosion Control MeasurementsWeight
1LowAdequate1.0
2ModerateModerate1.5
3HighLow2.0
Table 6. Classification of disturbance degree (after [26]).
ScoreDegree of Disturbance
0–0.19Pristine disturbance
0.2–0.39Minor disturbance
0.4–0.5Moderate disturbance
0.51–0.6Significant disturbance
0.61–0.7Severe disturbance
0.71–0.8Critical disturbance
0.81–1Irreversible disturbance
Table 7. Data sources used to score disturbance indicators in the study area.
IndicatorData Source
Quarrying/miningRegional WebGIS “S.I.T Puglia” (Mining and quarrying service) [75], field surveys
FloodingLiterature sources [76], field surveys
Stormwater drainageLiterature sources [34], field surveys
Infilling of sinkholesInventory of caves and artificial cavities in Puglia
Dumping into sinksField surveys
Soil erosionLiterature sources [40,41], field surveys
Soil compactionLiterature sources [40,41], field surveys
Decoration removal/vandalismCommunications with expert local cavers
Mineral/sediment removalCommunications with expert local cavers
Sediment compactionLiterature sources [40,41], field surveys
DesiccationCommunications with expert local cavers
Pesticides/herbicidesNational Statistical Institute
Industrial spills/dumpingFiled surveys
Spring constituentsNo data found
Changes in water tableNo data found
Cave drip watersCommunications with expert local cavers
Vegetation removalLiterature sources [77,78], field surveys
Cave biota species richnessNo data found
Cave biota population densityLiterature sources [79]
Groundwater species richnessNo data found
Groundwater population densityLiterature sources [80]
Destruction of artifactsCommunications with expert local cavers
Regulatory protectionNational and regional legislation
Regulation enforcementRegional legislation
Public educationNational Park website
Building of roadsLiterature sources [42]
Building over karstPhotographic maps, aerial photos
Table 8. Classification of the environmentally sensitive areas to desertification (after [9]).
TypeSub-TypeESAI Range
CriticalC3>1.53
<< C21.42–1.53
<< C11.38–1.41
FragileF31.33–1.37
<< F21.27–1.32
<< F11.23–1.26
PotentialP1.17–1.22
Not affectedN<1.17
Table 9. Indicator and total disturbance scores for the study area (after [25,26], mod.).
CategoryIndicatorScore
GeomorphologyQuarrying/mining3
Flooding1
Stormwater drainage2
Infilling of sinkholes2
Dumping into sinks2
Soil erosion3
Soil compaction3
Decoration removal/vandalism3
Mineral/sediment removal3
Sediment compaction3
Desiccation2
HydrologyPesticides/herbicides2
Industrial spills/dumping3
Spring constituentsND
Changes in water tableND
Cave drip waters2
BiotaVegetation removal3
Cave biota species richnessND
Cave biota population density2
Groundwater species richnessND
Groundwater population density2
CulturalDestruction of artifacts1
Regulatory protection2
Regulation enforcement3
Public education1
Building of roads2
Building over karst1
Total number of used indicators27
KDI value0.63
Total number of NDs4
ND rating0.15
Disclaimer/Publisher’s Note: The statements, opinions and data contained in all publications are solely those of the individual author(s) and contributor(s) and not of MDPI and/or the editor(s). MDPI and/or the editor(s) disclaim responsibility for any injury to people or property resulting from any ideas, methods, instructions or products referred to in the content.

