Article

Holocene Deformations at the Po Plain–Southern Alps Transition (Lake Maggiore, Italy): Inferences on Glacially vs. Tectonic-Induced Origin

by
Niccolò Menegoni
1,*,
Matteo Maino
2,
Giovanni Toscani
2,3,
Lucia Isabella Mordeglia
4,
Gianfranco Valle
5 and
Cesare Perotti
2
1
Ali I. Al-Naimi Petroleum Engineering Research Center (ANPERC), King Abdullah University of Science and Technology (KAUST), Thuwal 23955-6900, Saudi Arabia
2
Dipartimento di Scienze della Terra e dell’Ambiente, Università degli Studi di Pavia, 27100 Pavia, Italy
3
CRUST—Centro InteRUniversitario per l’Analisi SismoTettonica Tridimensionale con Applicazioni Territoriali, 66100 Chieti, Italy
4
Soprintendenza Archeologia Belle Arti e Paesaggio per le Province di Biella Novara Verbano-Cusio-Ossola e Vercelli, Ministero della Cultura, 28100 Novara, Italy
5
Independent Researcher, 27100 Pavia, Italy
*
Author to whom correspondence should be addressed.
Geosciences 2023, 13(9), 286; https://doi.org/10.3390/geosciences13090286
Submission received: 22 July 2023 / Revised: 29 August 2023 / Accepted: 16 September 2023 / Published: 21 September 2023
(This article belongs to the Section Cryosphere)

Abstract

:
The investigation of deformations in Quaternary deposits holds primary importance in understanding recent geological history and natural hazards in highly populated areas, such as the Po Plain. While civil excavations and trenches possess the potential to be pivotal in identifying and characterizing these deformations, they often remain underused due to the stringent regulation framework and timetables governing civil construction works. In this study, we demonstrate how digital photogrammetry and digital outcrop modelling (DOM) are useful techniques for obtaining a permanent digital representation of a trench situated in Castelletto Ticino (Po Plain–Southern Alps transition). This trench exhibits Holocene deformational structures: (i) an overall tilting of sedimentary deposits towards the SW; (ii) folds with a NE–SW trend; (iii) slumping and other soft-sediment deformations structures; and (iv) reverse faults with NE–SW and NW–SE directions. Using radiocarbon and archeological dating, we are able to confidently constrain the age of these deformations to between 8760 and 400 years BC, suggesting recent tectonic activity related to buried thrust faults.

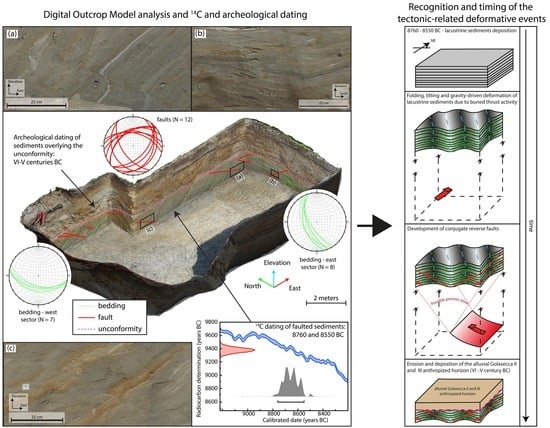
Graphical Abstract

1. Introduction

Quaternary deposits, predominantly represented by unconsolidated terrigenous sediments, commonly experience different kinds of deformations driven by a variety of processes. These deformations primarily manifest as soft sediment deformation structures (SSDSs), encompassing load casts, slumps, flame structures, pseudonodules, chaotic strata, sand intrusions, and diapir-like injection structures [1,2,3,4]. SSDSs usually form in water-saturated cohesionless sediments as a consequence of liquefaction, fluidization, reverse density gradation, slumping, slope failure, and shear stress (e.g., [3,5]). These mechanisms of deformation can be triggered by several and multiple agents including earthquakes, depositional overloading, gravity-induced sediment failure, storms, or flood events in fluvial, lacustrine, or marine settings or salt tectonics (e.g., [1,2,3,6,7,8,9,10,11,12,13,14]). Even glacial and periglacial processes lead to the formation of SSDSs similar to those attributed to earthquakes and, more generally, neotectonic activity (e.g., [2,11,15,16,17]). Commonly, a robust indicator of neotectonics activity is the near-surface deformation brittle deformations that can be divided into two main classes, namely, deformation bands and the more classic fractures and slip surfaces (i.e., fractures and faults). Deformation bands are millimeter- to centimeter-thick tabular zones of deformation developed within porous unconsolidated sediments, whereas low-porous sediments tend to form fractures and faults [18,19]. These brittle deformations result mainly from tectonic activity above the tip line of large buried faults, associated with either high-velocity seismic strain rates or slow creep [20,21,22,23]. However, deformation bands and faults might also result from extension and contraction of the sediments related to the freezing and thawing processes during cryoturbation [24]. Additionally, the propagation of ice sheets may produce glaciotectonic structures such as folds, faults, and deformation bands, often posing challenges in distinguishing them from tectonic structures (e.g., [25,26,27,28,29,30,31]). Overall, determining the triggering process responsible for the formation of near-surface SSDSs and deformation bands remains a major challenge.
In this study, we aim to identify and characterize near-surface deformations in Quaternary deposits in one of the most intensively industrialized, cultivated, and populated areas in Europe, the Po Plain (Northern Italy). The Po Plain has undergone a geological evolution encompassing nearly all the potential settings and factors responsible for deformations within unconsolidated sediments. It consists of a sedimentary basin, ~42,000 km2 in area, which serves as the foreland basin system of the Northern Apennines to the south and the retroforeland of the Alps to the north [32,33]. The Pleistocene–Holocene architecture of the Po Basin has been shaped by the interplay of various factors, including tectonic processes, rates and volumes of sedimentation, sea-level fluctuations, and glaciations [34,35,36,37,38,39,40]. Tectonic activity is linked to the buried thrust fronts of both the Alps and Apennines [41], recording both historical and instrumental seismicity. Up to ~8 km-thick sediments accumulated as deep marine deposits in the Pliocene to Early Pleistocene before the onset of fluvial sediments derived from the neighboring mountain chains in the Late Pleistocene–Holocene [38,42]. Sedimentation rates accelerated with the onset of major Late Pleistocene–Holocene glaciations [43]. Notably, the Po Plain facing the Alpine chain was widely shaped by the Last Glacial Maximum (LGM) fluvioglacial deposits that have been eroded and terraced by post-glacial rivers [44,45,46,47,48]. In these Holocene deposits, signs of near-surface deformation, such as faults, folds, and fluid escape structures, have been identified via subsurface and seismic profiles, remote sensing, drilling [49,50], seismic activity [51], and GPS and InSAR data [52,53]. However, little field evidence of deformation has been reported so far in the entire Po Plain [49,54,55,56,57,58]. This is probably due to the unconsolidated/cohesionless nature of Quaternary deposits resulting in poor and limited outcropping sections. Furthermore, linking the deformation with its triggering processes remains a formidable challenge.
Here, we present an analysis of a pattern of deformation structures, encompassing slumps, load casts, folds, and faults, which have affected the unconsolidated Holocene deposits within the Lake Maggiore area (Po Plain–Southern Alps transition). In the study area, the relatively shallow marine to continental Quaternary deposits of the Po Plain overlay the tectonic units of the Southern Alps, piled through buried thrusts [42,59,60,61,62,63]. Notably, thick ice sheets covered this area during the LGM pulses, ca. 25–19.7 ka [64].
The study outcrop consists of a trench 14 × 10 × 3 m (length, width, and depth) in size, excavated during construction work. Given the transient nature of the trench and the access restrictions, we performed the survey via digital photogrammetry and a digital outcrop model (DOM) that allowed us to accurately analyze the deformation features even after the completion of construction. The structural pattern is discussed in terms of the potential processes (tectonic vs. glaciotectonic) that caused such deformations. The age of the investigated deformations has been constrained from 8760 BC to 600–400 BC (VI–V centuries BC), based on the radiocarbon-derived age of the deformed sediments (lower age limit) and the stratigraphic relationship with the archaeologically derived age of the overlying sediments (upper age limit). With a temporal gap of about 10,000 years separating the deformations from the last glaciation experienced in the studied area, we propose that the observed features predominantly reflect the activity of the buried alpine thrust faults.

2. Geological Setting

2.1. Geomorphology

The study area is located in the northern margin of the Po Plain, at the boundary with the basement rocks of the Southern Alps. The investigated outcrop rests on the western side of the Ticino River, immediately southeast of Lake Maggiore, in close proximity to Castelletto Ticino (NO).
The area is characterized by the presence of Lake Maggiore, approximately 210 km2 in area, with a width of a few kilometers and a length of more than 60 km. The maximum depth of the lake reaches around 370 m, and its floor extends to a depth of 179 m below sea level.
Similar to other subalpine lakes, the genesis of Lake Maggiore can be attributed to the significant drop in sea level during the Messinian Salinity Crisis [65,66,67], which resulted in substantial fluvial incision and the creation of deep canyons along the southern margin of the South Alpine belt. These canyons were progressively infilled by Messinian, Pliocene, Pleistocene, and Holocene deposits. A recent study [68] showed that in the central sector of the Maggiore Lake, the pre-Messinian bedrock has a maximum depth of more than 800 m below sea level, while towards the south, the depth of the canyon tends to become shallower with an average depth of 500 m below sea level. The counter-slope of the Ticino paleo-valley can be explained by the different post-Messinian tectonic uplifts that affected the region and that have been evaluated in hundreds of meters [69].
To the south of Lake Maggiore, Pleistocene glacial deposits crop out and terminate in deposits with a wide lobe, referred to as the Verbano lobe, on the Po Plain. This lobe is characterized by a moraine amphitheater that is bordered by outwash plains and formed from different ridges due to multiple glaciations [70,71,72]. Holocene sediments and/or bedrock crop out only along the deeply incised valley system to the south and north, respectively.
Along the Ticino River, south of Lake Maggiore, three principal frontal moraines have been recently identified [64]. Each of these moraines is composed of multiple ridges and has been dated to the LGM phase (Figure 1).
This large moraine amphitheater exhibits varying degrees of preservation. Typically, in the western sector, the terminal moraine ridges are clearly visible over several kilometers. In contrast, within the eastern sector (situated east of the Ticino River), these ridges are notably eroded, strongly fragmented, and anthropized, resulting in discontinuous ridges.
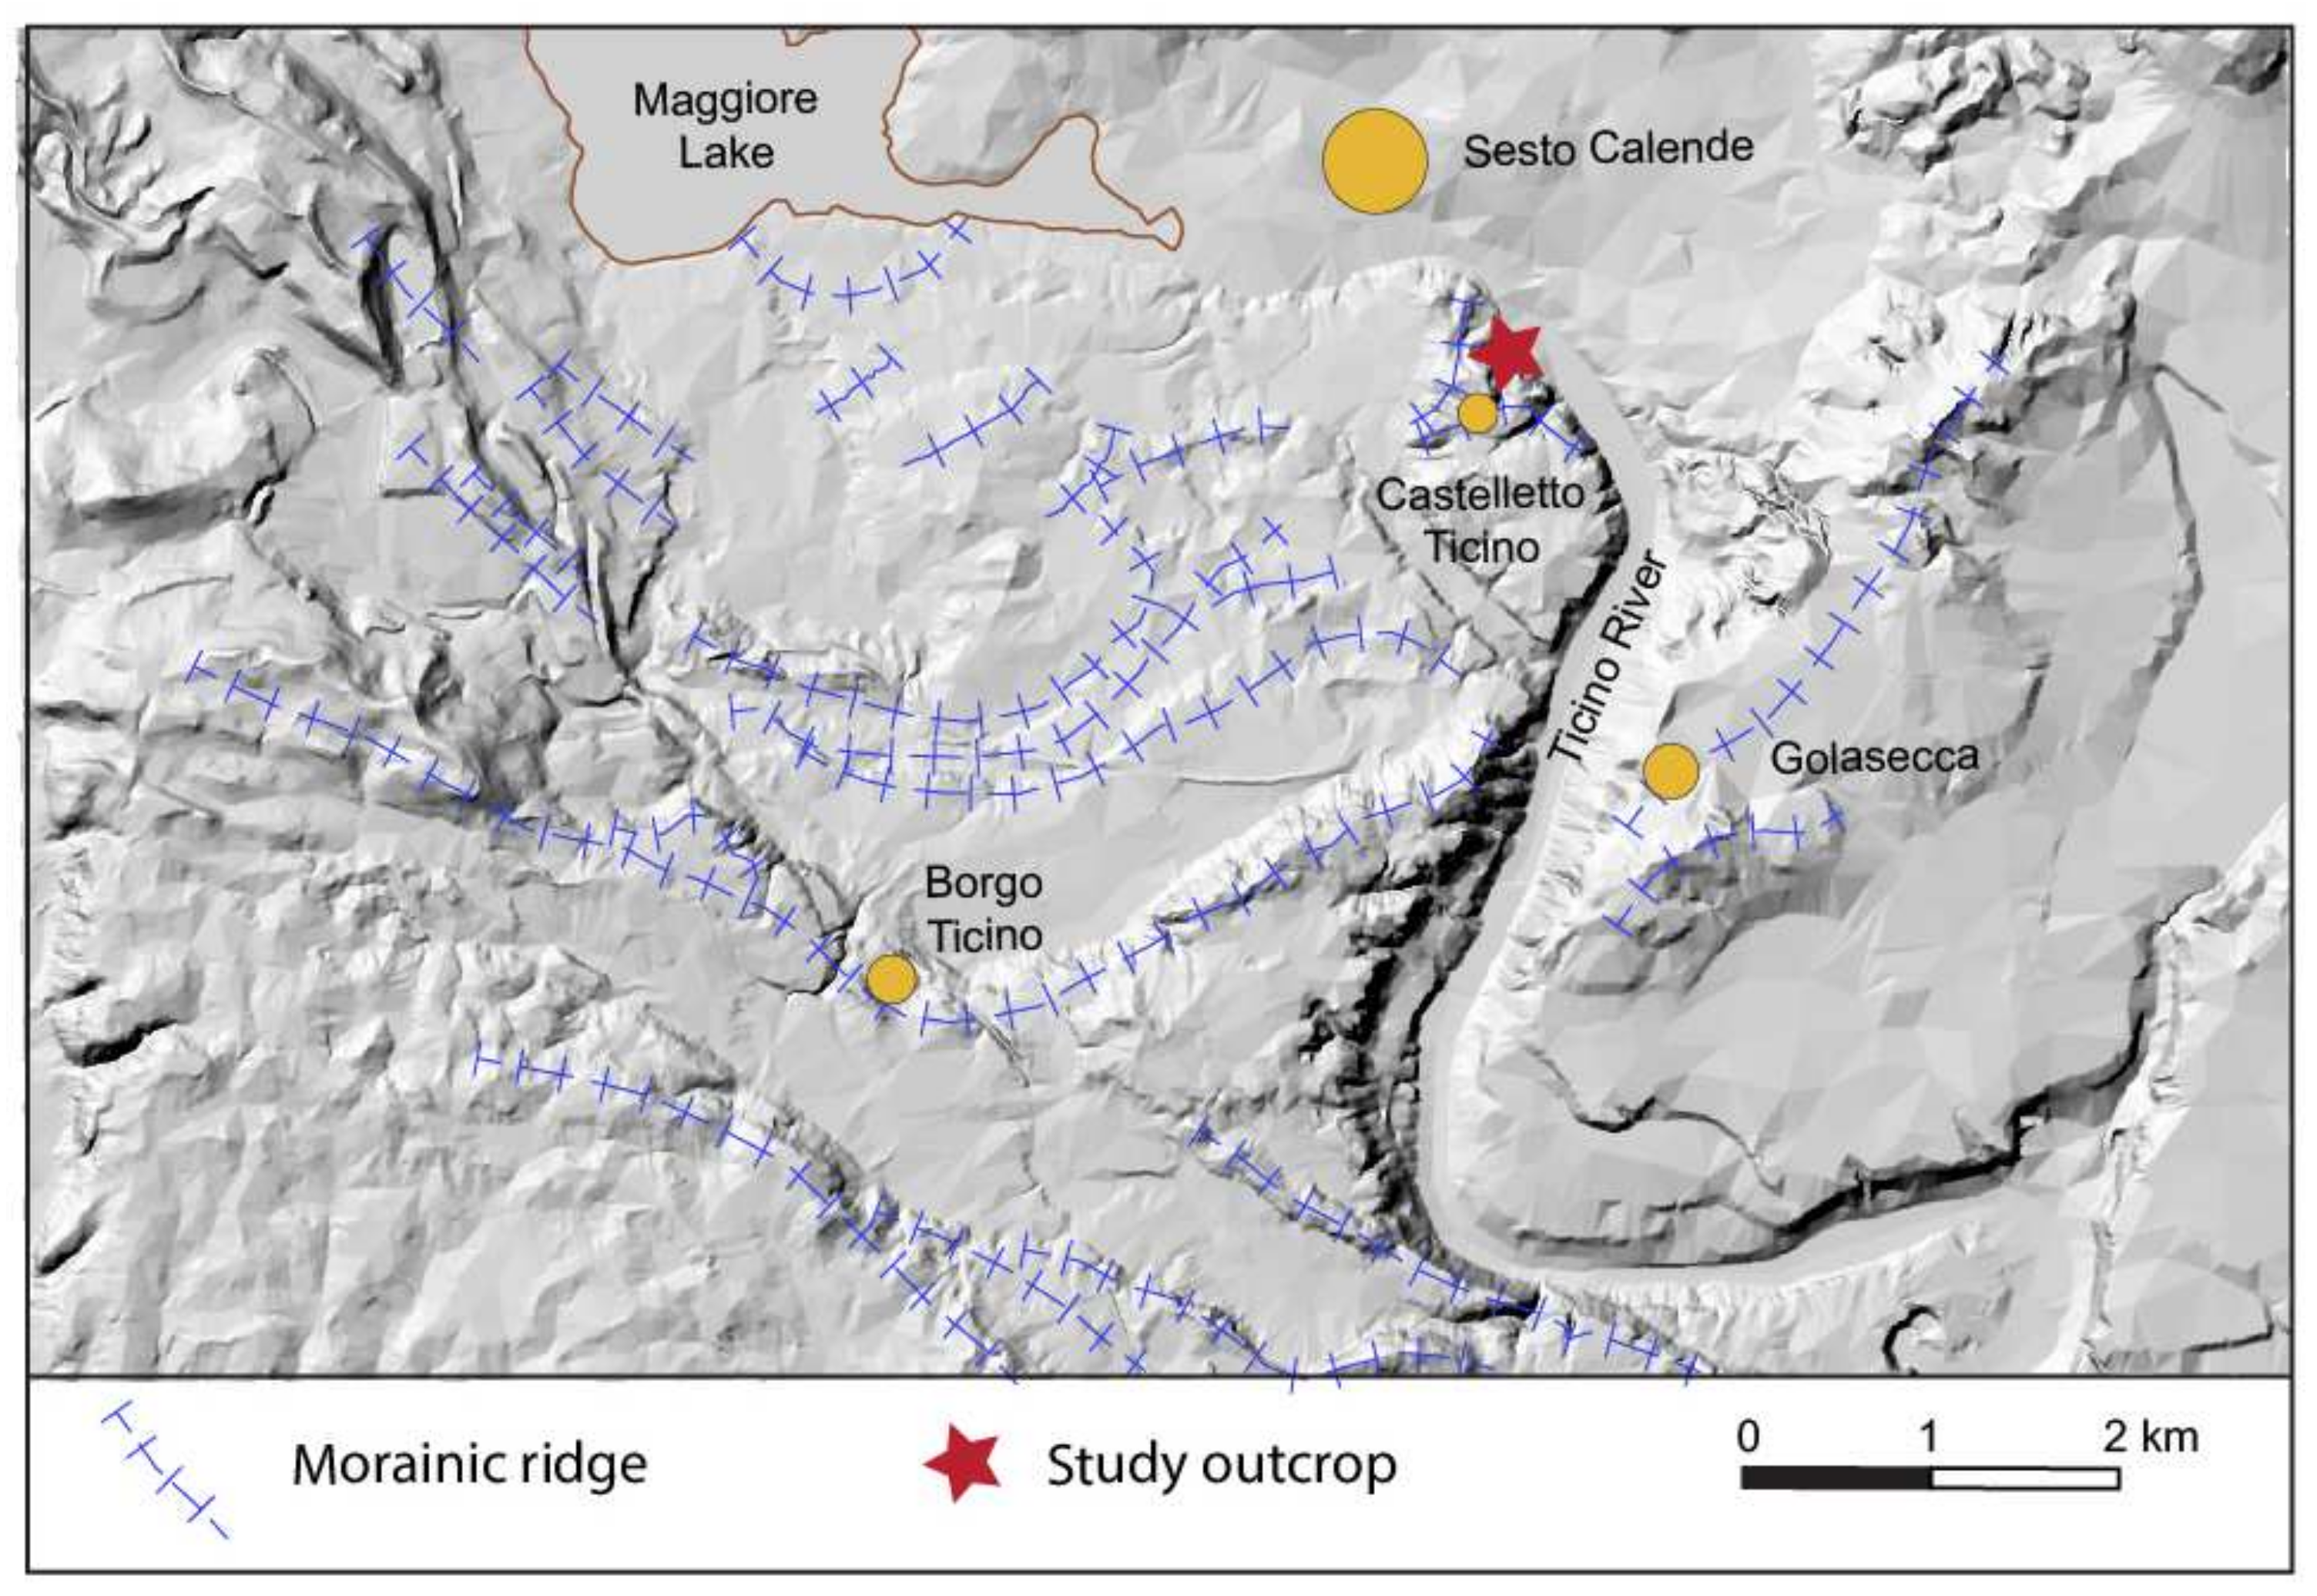
Within the study area, particularly in the vicinity of Castelletto Ticino, at least three distinct terrace levels have been identified. These levels can be tentatively associated with the three sets of frontal moraines. Additionally, the lower terrace level appears to be linked to a Holocene post-glacial phase (Figure 2).
Different reconstructions have been proposed regarding the LGM evolution of the Verbano lobe of the Ticino–Toce paleoglacier (e.g., [64,73,74]). The LGM maximum advance of the glacier can be dated to 25.0 ± 0.9 ka [64]. Minor glacier readvances identified in the area, based on sedimentological evidences of deposits located inside the LGM maximum moraines, occurred around 19.7 ± 1.1 ka [64]. According to the data available for the other morainic amphitheaters at the border of the southern Alps, these last glacial pulsations ended after this period when the complete deglaciation of the area began.

2.2. Tectonic Setting

Between the Eocene and Upper Miocene, the South Alpine chain developed as a south-verging retro-wedge of the Alpine chain [76,77]. During this period, it was affected by crustal flexuring and south-verging thrusting, which subsequently led to the deposition of molasse deposits in the adjacent Po Plain [78,79,80,81,82]. Consequently, the northern sector of the Po Basin represents the retrowedge foreland basin of the Alpine orogeny. In contrast, the southern sector represents the foreland basin of the Northern Apennines.
The south-verging tectonic structures of the South Alpine typically do not cut the top of the Messinian sediments, while the north-verging thrusts of the Apennine front intersect the Pliocene and even the Pleistocene levels. This indicates a more recent compressional activity in the Apenninic belt and different structural styles of the chains with prevailing blind thrusts in the Alpine front [42,50,61,62,63].
However, indications of active uplift and deformations have been uncovered within the Piedmont and Lombardy regions of the Po Plain [49,51,54,56,82]. The active tectonic uplift of the plain NW of Milan was also confirmed by topographic leveling surveys, with significant rates of 1.5 mm yr−1 near the Lake Maggiore region [83].
In the study area, the main tectonic structures are represented by a northwest verging backthrust, the Gonfolite backthrust, and related splays [50,59,60,84]. This structure remains buried under the Plio-Pleistocene deposits of the Po Plain related to the Miocene tectonic events that led to the emplacement of the outermost South Alpine forethrusts [48,50,85]. In correspondence to the southern termination of Lake Maggiore (Figure 1), a set of minor thrusts and backthrusts has been identified by Fantoni and Bello [86]. These faults are rooted in the Mesozoic carbonates and displace up to the top of the Mesozoic Carbonates. Then, these faults were covered by the Oligo-Miocene clastic wedge of the Gonfolite Formation (Figure 3a,b).
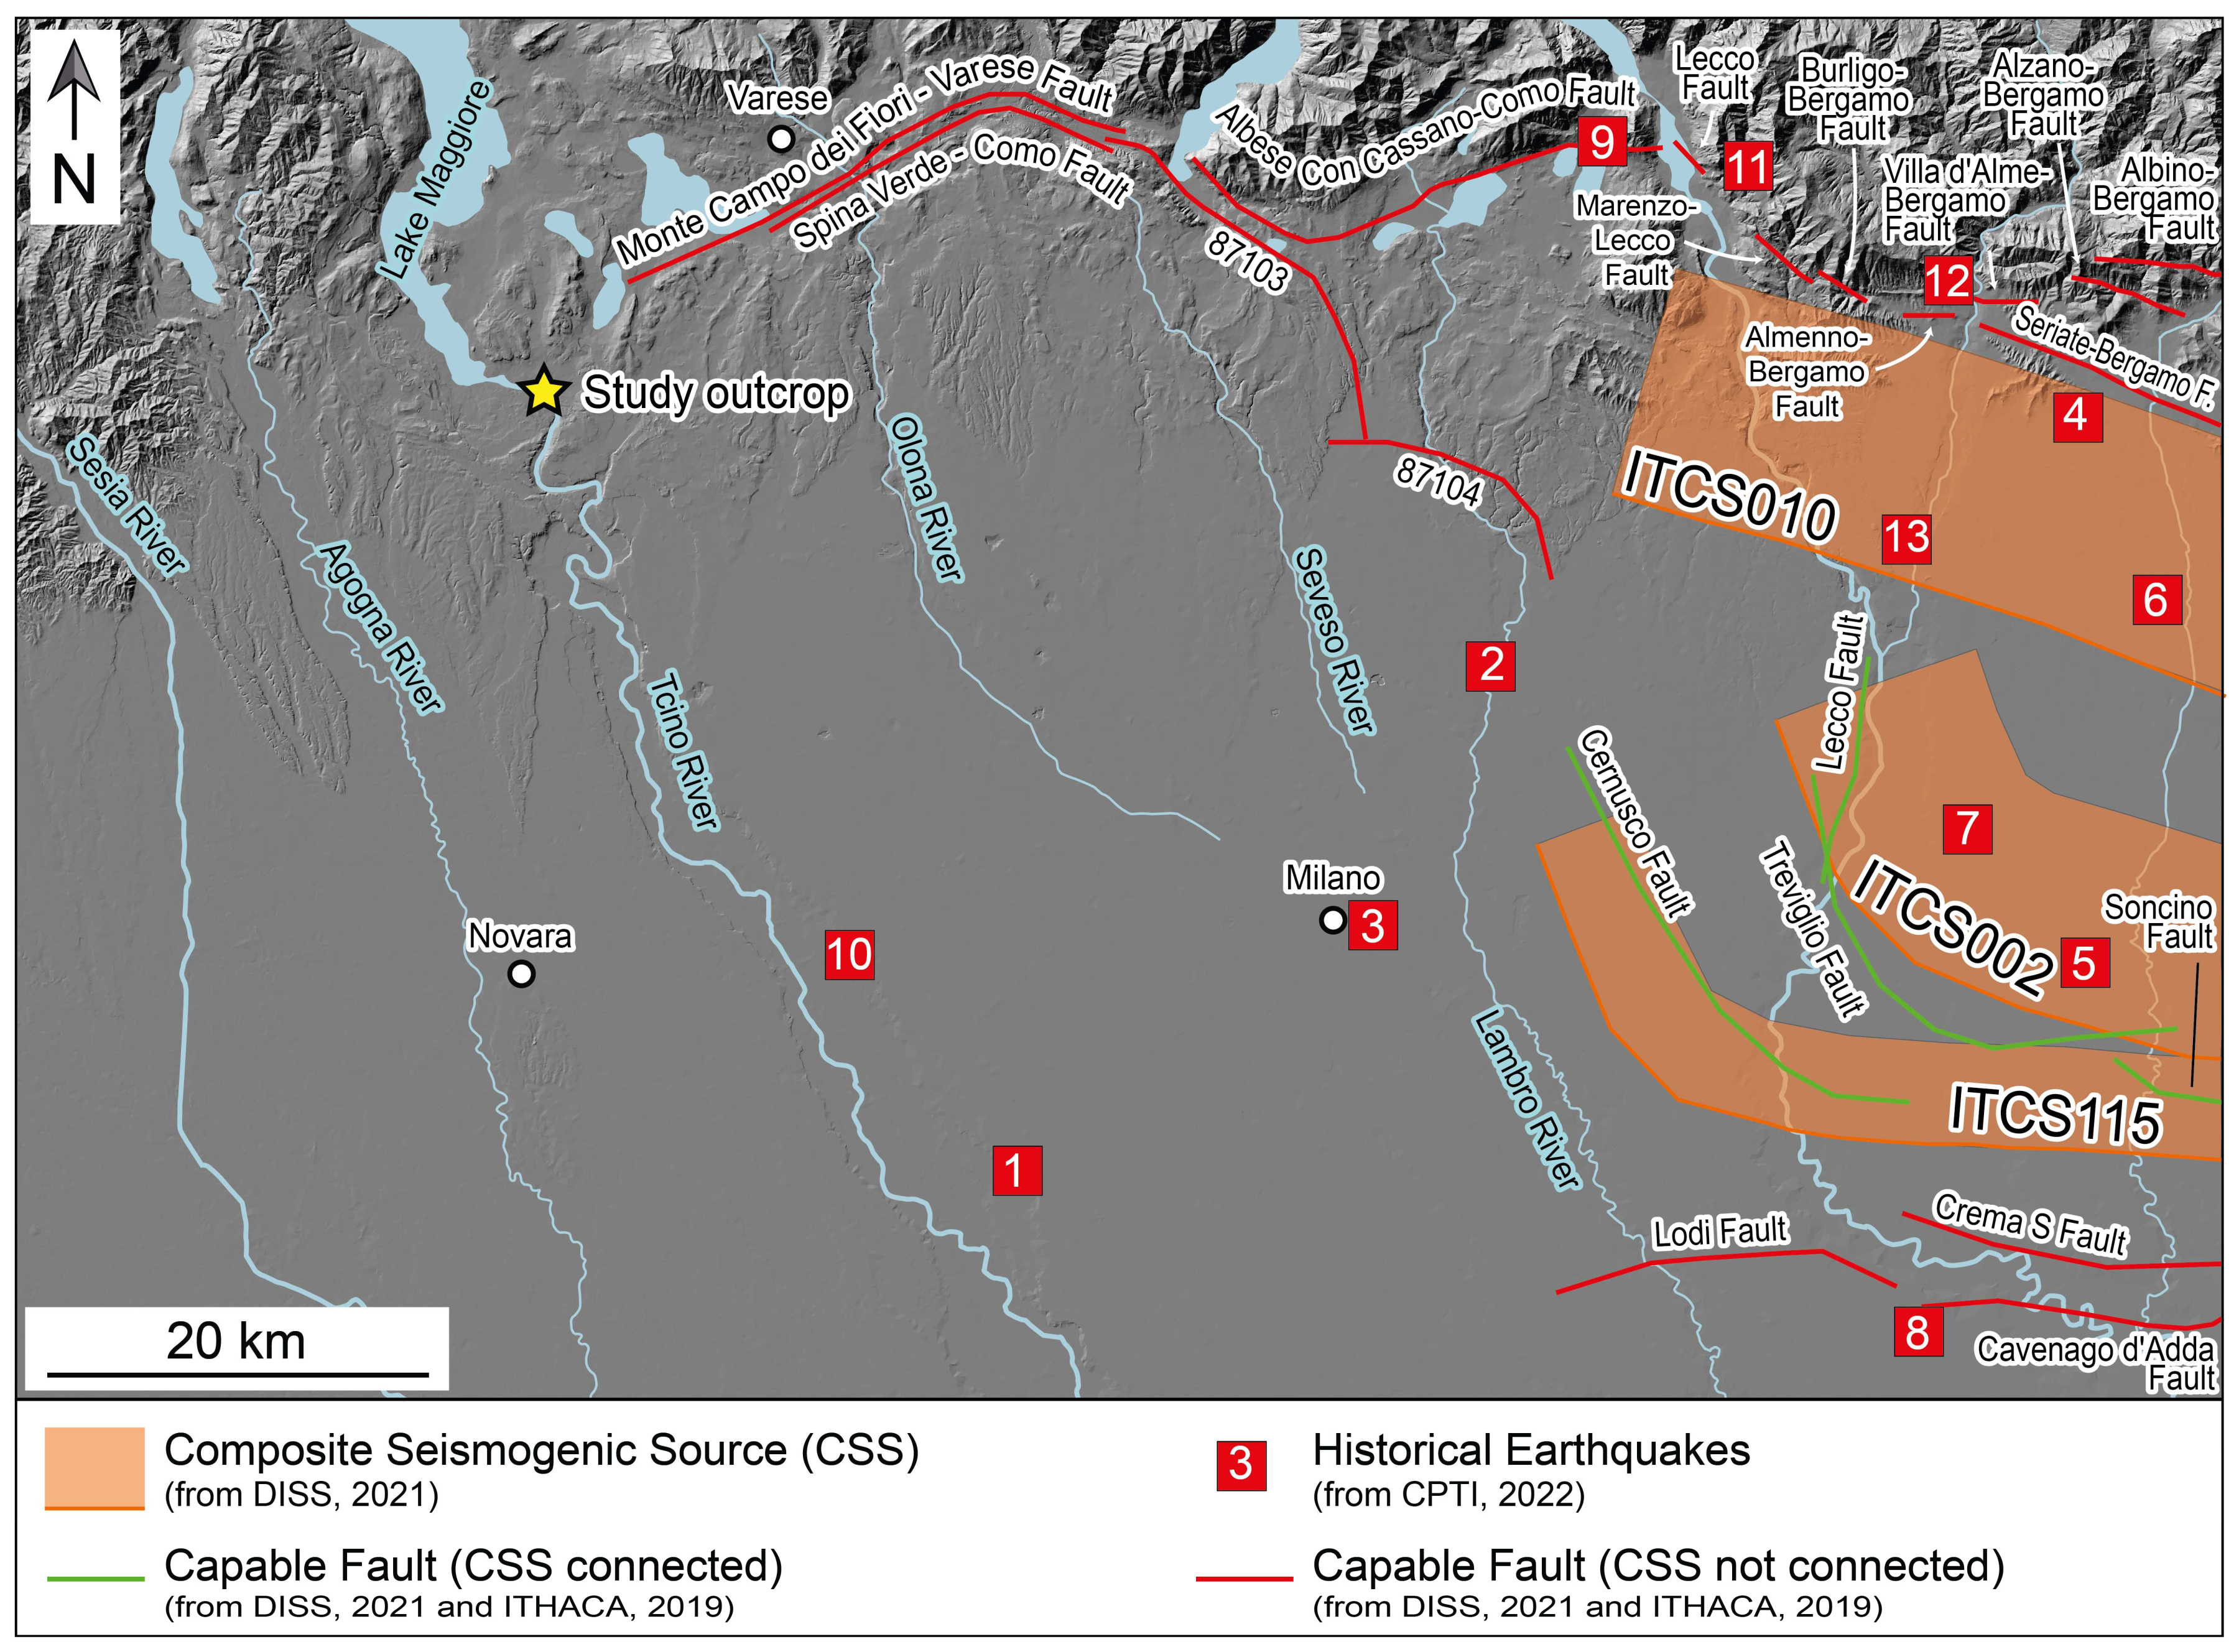
In the study area, there are no seismogenic faults reported in the Database of Individual Seismogenic Sources (DISS) (Figure 4 [88]). Furthermore, the Parametric Catalogue of Italian Earthquakes (CPTI [89]) does not contain any historical earthquake records coinciding with or in close proximity to the study area. The nearest reported earthquake event (13 December 1918, Pianura Lombarda, Mw = 4.62; see also Table 1) is represented by a report with I = 3 in Varano Borghi village, located a few kilometers NE of the study outcrop. Additionally, the ITHACA database of capable faults [90] does not show capable faults in the study area. The nearest one, the Monte Campo dei Fiori–Varese fault, has its westernmost lateral tip approximately 8 km far from the studied outcrop (Figure 3) and it is classified as “Composite Seismogenic Source not connected”, i.e., not related to a potential seismogenic fault.
The DISS and CPTI databases clearly shows that there is no evidence of tectonic activity in recent years.

3. Methodology

3.1. Digital Outcrop Model Development

The photogrammetric survey was undertaken by Pandora Archeologa s.r.l. (Veruno, NO, Italy) using a dataset of 1456 photographs captured with an Olympus OM-D E-M10 Mark III 16 Megapixel camera. Due to the constrained space within the trench, a wide-angle lens with a focal length ranging from 17 mm to 28 mm was employed. The mean distance between the camera and trench walls was about 2.6 m, leading to a mean photograph resolution of 0.5 mm/pixel. To establish the orientation and scale the DOM, 44 ground control points (GCPs) were strategically positioned and fixed to the trench walls and then measured by a total station in a local coordinated reference system. The GCPs consisted of white rectangular targets measuring 3 cm in length.
The DOM development was performed using a commercial structure from motion and multi-view stereo-based software called Metashape v.2.0 (Agisoft LCC, St. Petersburg, Russia). The model was developed by aligning the photographs with their full resolution and georeferencing them with the measured GCPs. A total of 28 GCPs were used as control points (constraints for the model georeferencing) and 16 as check points. The resulting mean error from the aligning procedure was 8.9 mm for the control points and 11.1 mm for the check points.
While the alignment process employed the full image resolution (0.5 mm), the development of the dense point cloud employed half resolution (1 mm). This choice was influenced by the very flat geometry of the trench walls, which makes the development of a point cloud with a high point density unnecessary for an accurate representation of the trench wall geometry. This allowed us to obtain a less dense point cloud that can be more easily managed and analyzed. Following dense point cloud development, the point cloud was processed to create a 3D mesh using the high face count setting. This process allowed us to obtain a mesh of about 4 million triangular faces that were textured with the original full-resolution photographs.

3.2. Digital Outcrop Model Mapping

The DOM was studied using CloudCompare v.2.10 software, an open-source software program that allows users to visualize and analyze 3D point clouds and meshes. In particular, the DOM was inspected via Pluraview3D stereoscopic hardware in order to define the geometry of the geological structures (conformable or unconformable stratigraphic surfaces, folds, fractures, and faults) [91,92,93,94,95]. After that, bedding and fault planes, together with bed thickness and stratigraphic offset, were measured using the “Trace a Polyline by point picking” tool and the Compass plugin [96].
The “Trace Polyline” tool allows users to select several points related to a geological trace and/or surface, both on the point cloud and on the mesh, and measure the best fitting 3D plane that represents the geological structure.
We also used two tools from the Compass plugin, the “Trace tool” and “Measure one-point thickness”. The first allows users to semiautomatically map geological traces onto the point cloud, while the second allows users to calculate the real thickness of a geological unit by measuring the distance between the selected 3D plane and a picked point along the normal vector of the plane. The “Measure one-point thickness” tool was used to calculate the stratigraphic separation of the faults.

4. Results

The study outcrop is located along the eastern bank of the Ticino River, in the city of Castelletto Sopra Ticino (Novara province, Italy, GMS coordinates 45°43′7.34″ N, 8°38′45.38″ E), about 4 km ESE from the SE border of Lake Maggiore (Figure 2).
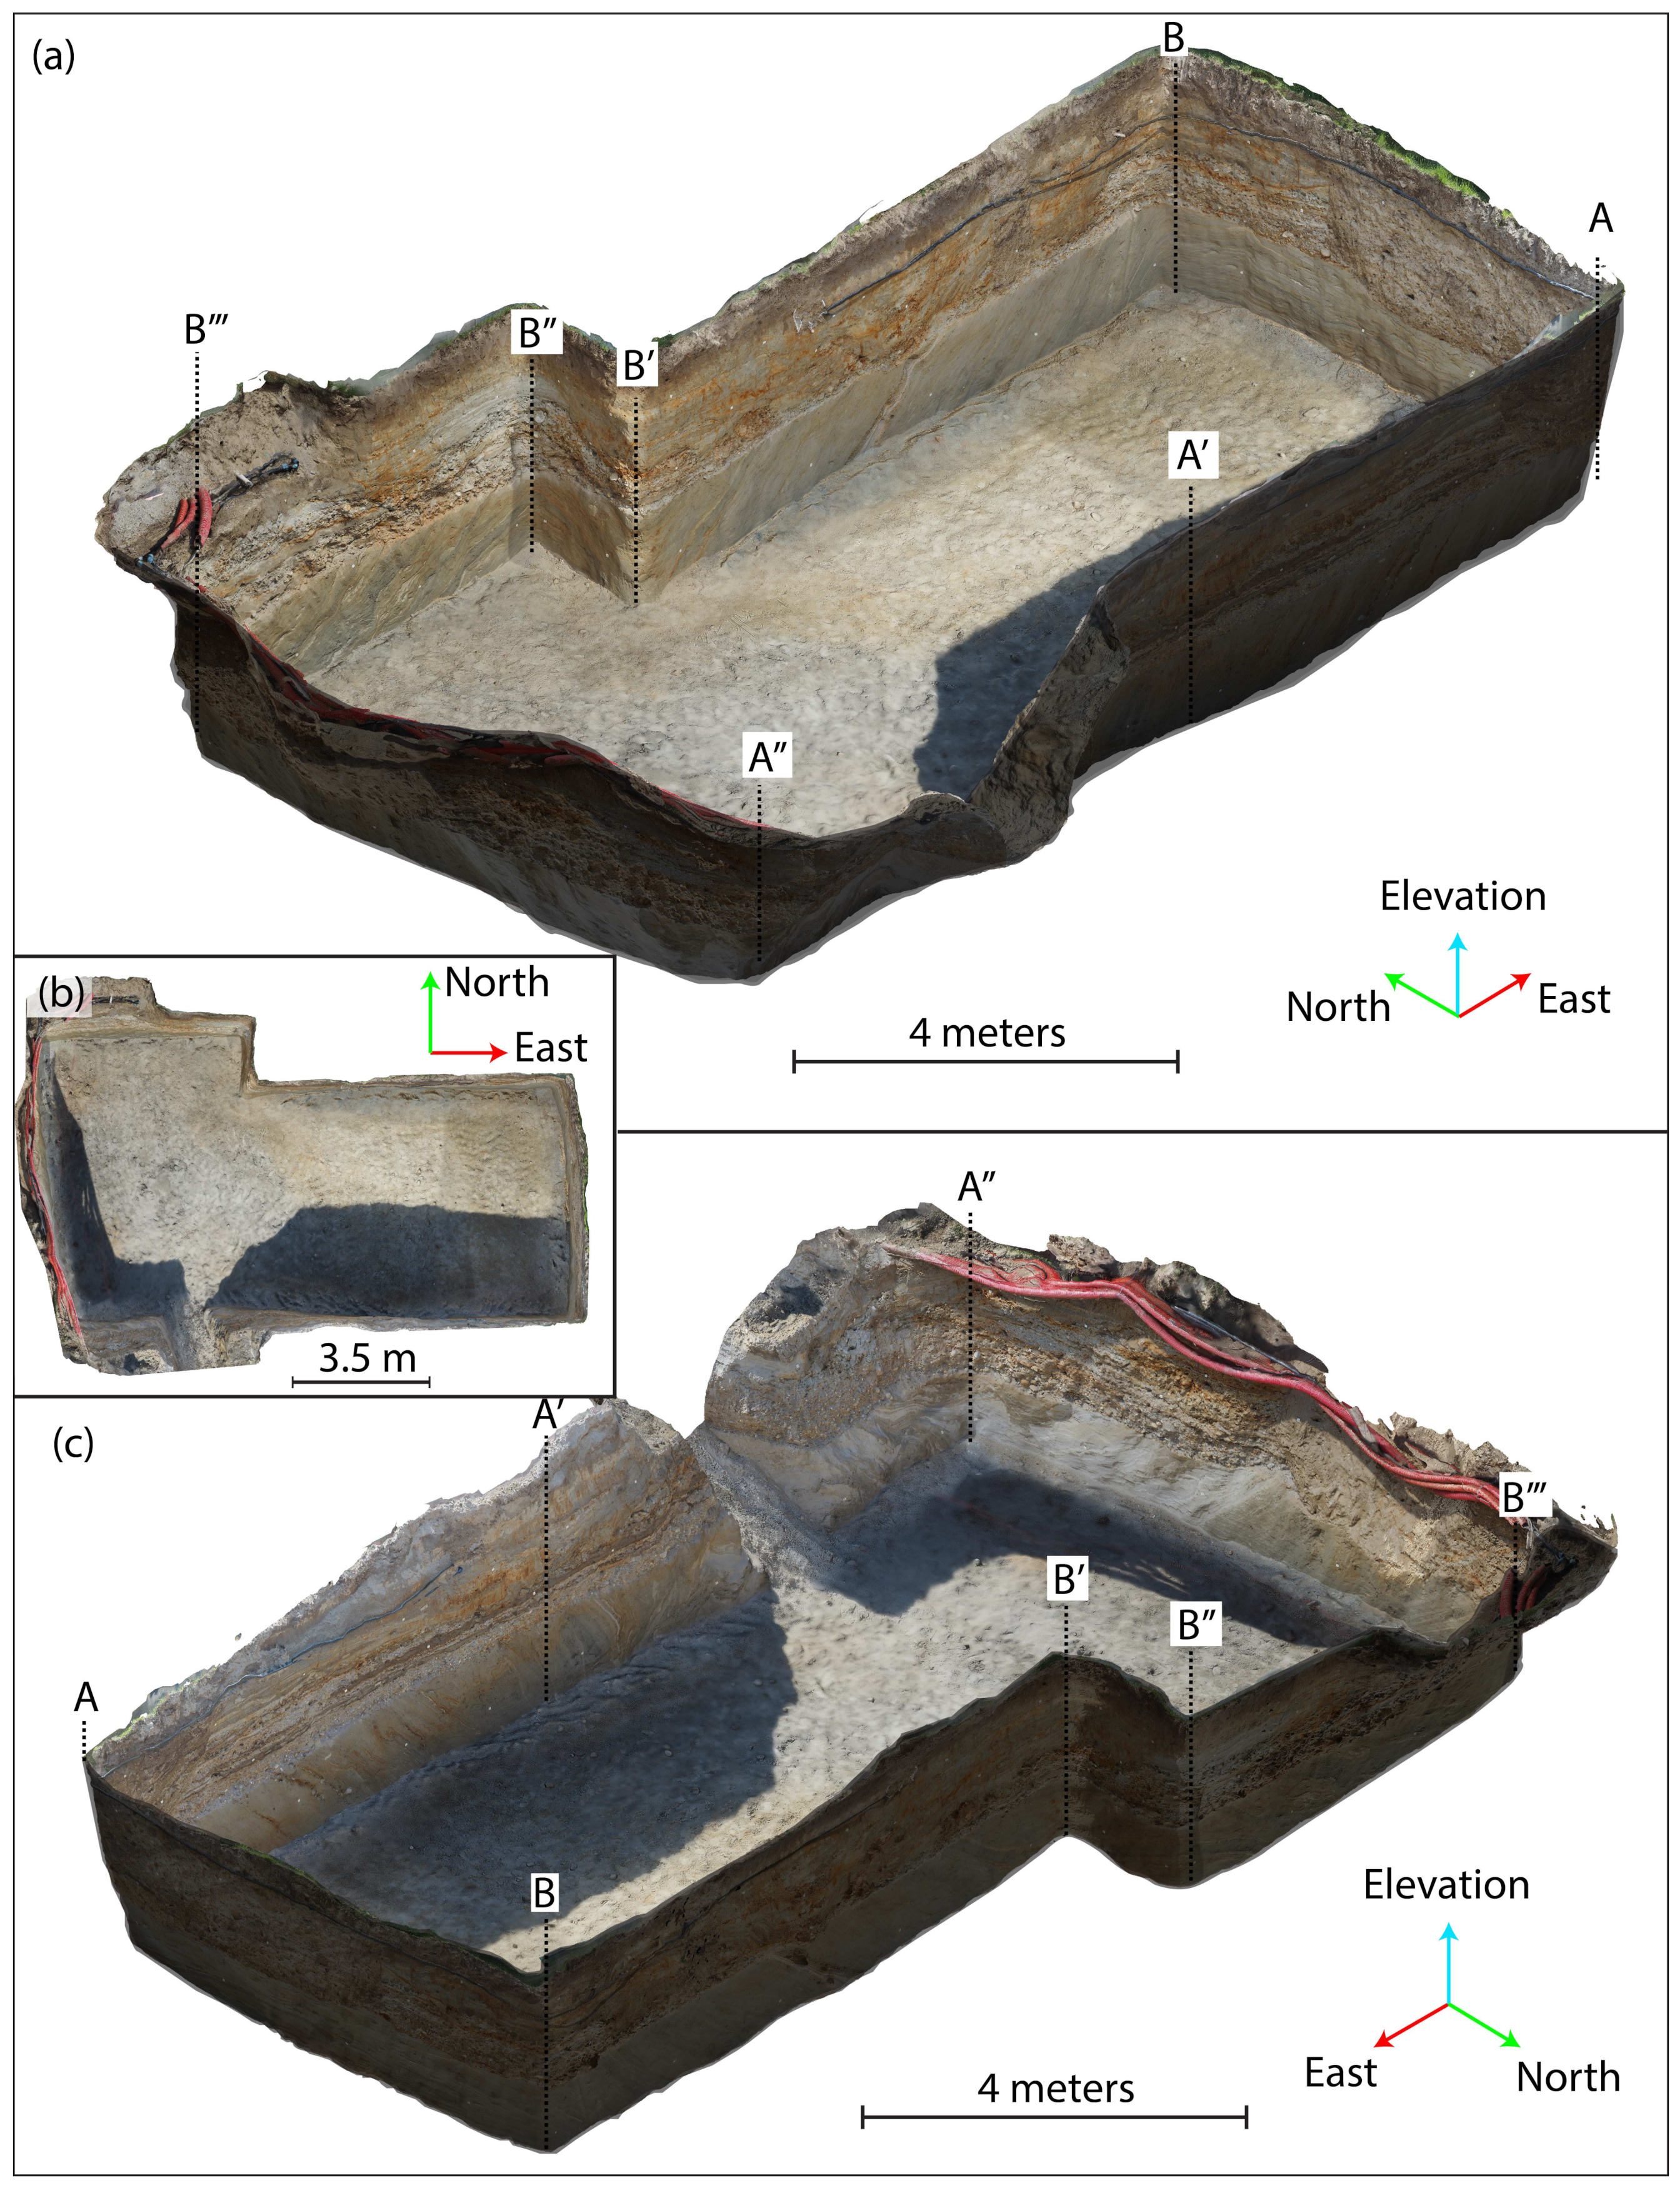
It consists of a trench with approximate dimensions of 14 m in length, 10 m in width, and 3 m in depth; it was excavated in June 2022 during the construction of a swimming pool (Figure 5).
As already described, due to the transient nature of the excavation and the fact that access to it was restricted and limited to a very short time, we decided to apply digital photogrammetry to develop a permanent DOM.
In the next sections, the stratigraphy and the deformation structures cropping out at the study site and detected via DOM will be described.

4.1. Stratigraphy

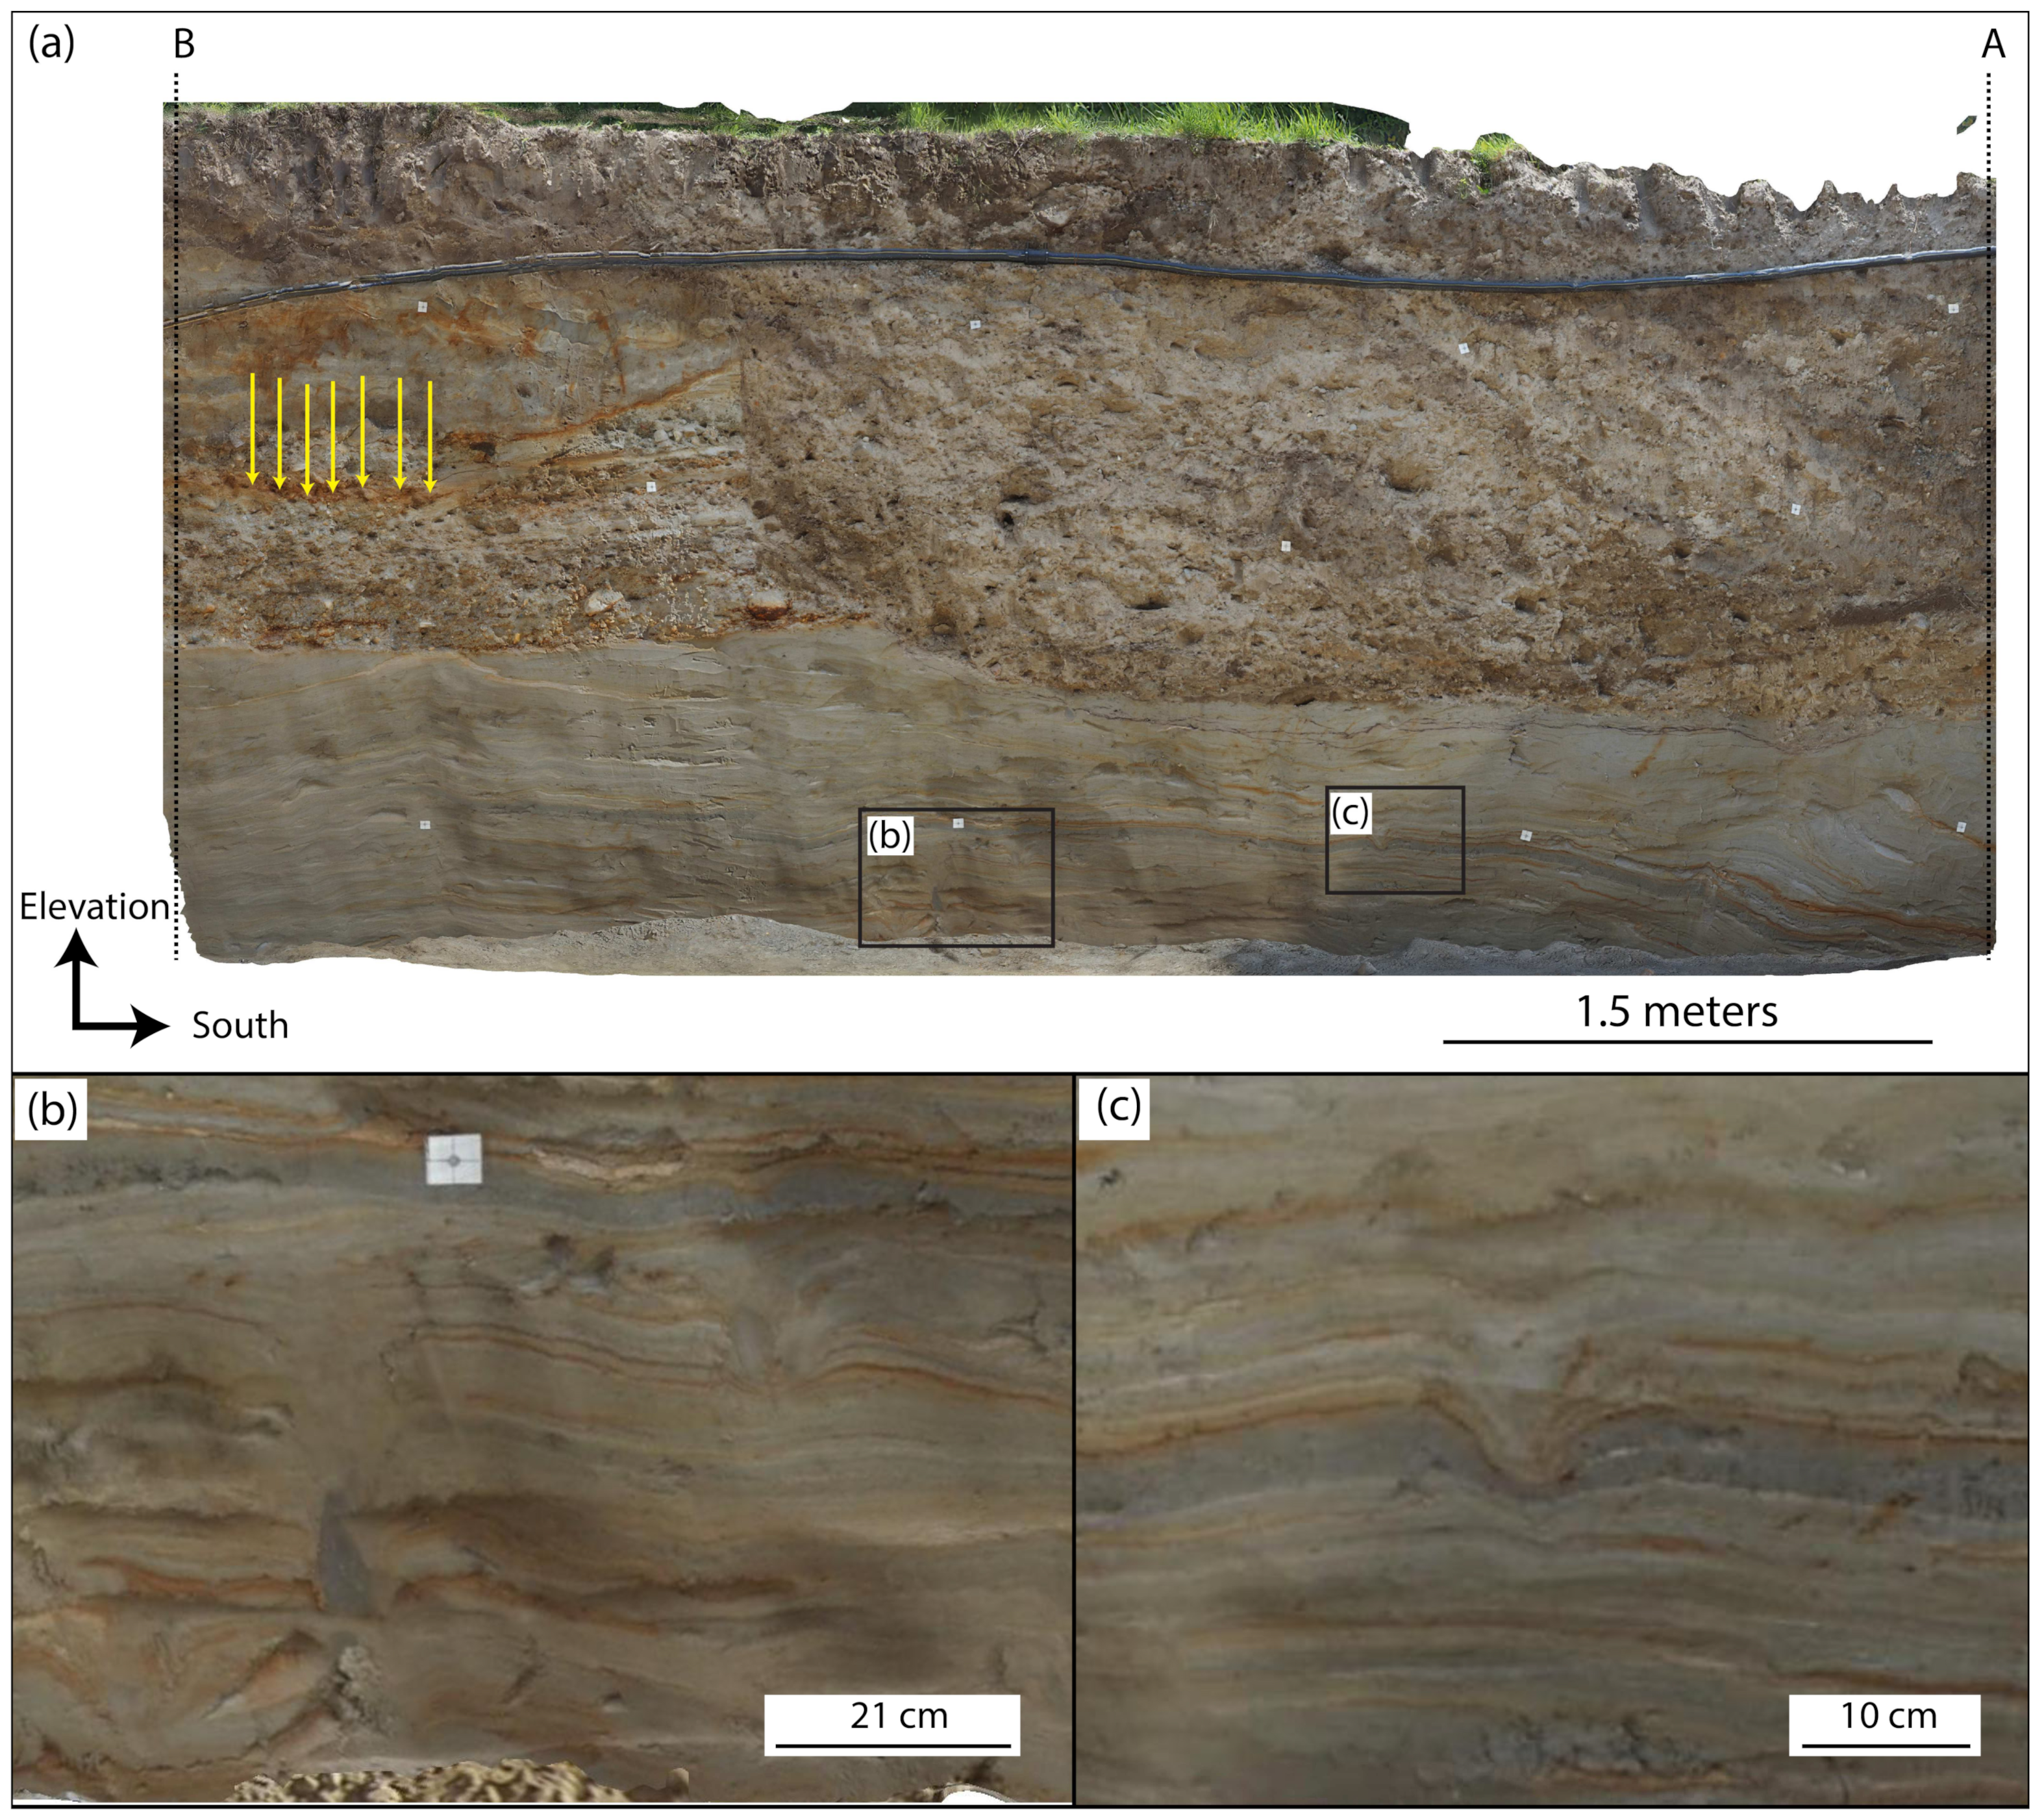
The stratigraphic succession exposed in the trench consists (from bottom to top) of an 80–100 cm layer (vertical thickness) of fine sediments overlaid by a 130–170 cm layer (vertical thickness) of coarser sediment, through an angular unconformity (Figure 6a).
The layers of fine sediments consist of a rhythmic alternation of well-stratified dark and organic-rich, brownish to yellowish and light whitish sandy silt and clay silt layers with a thickness of millimeters to centimeters, dipping toward the S and WSW. These sediments can be described as a lacustrine horizon and are affected by several SSDSs, which disappear in the above horizon of coarse sediments. Considering the general attitude of the lacustrine horizon and using the Compass plugin in CloudCompare, we calculated a minimum real thickness of approximately 9 m.
The overlying level of coarser sediment can be described as an anthropized alluvial horizon with a vertical thickness of 130–170 cm. This horizon is composed of sand, rounded gravel, and pebbles with intercalations of clay layers, rich in archeological remnants, which are ascribed to the Golasecca II and III civilization (VI–V century BC) [97,98,99]. The chronological indicators consist of fragments of ribbed lip cup (first half of VI century BC), carinated beakers, fragments of red painted ribbed vases (second half of VI century BC), coarse ware made on a potter’s wheel, fragments of red cups which imitate the Po Valley Etruscan types (beginning of V century BC), and small pieces of glazed pottery (V century BC) [100,101]. This alluvial horizon is overlaid by a 30 cm-thick layer (vertical thickness) of agricultural soil.

4.2. Deformation Structures

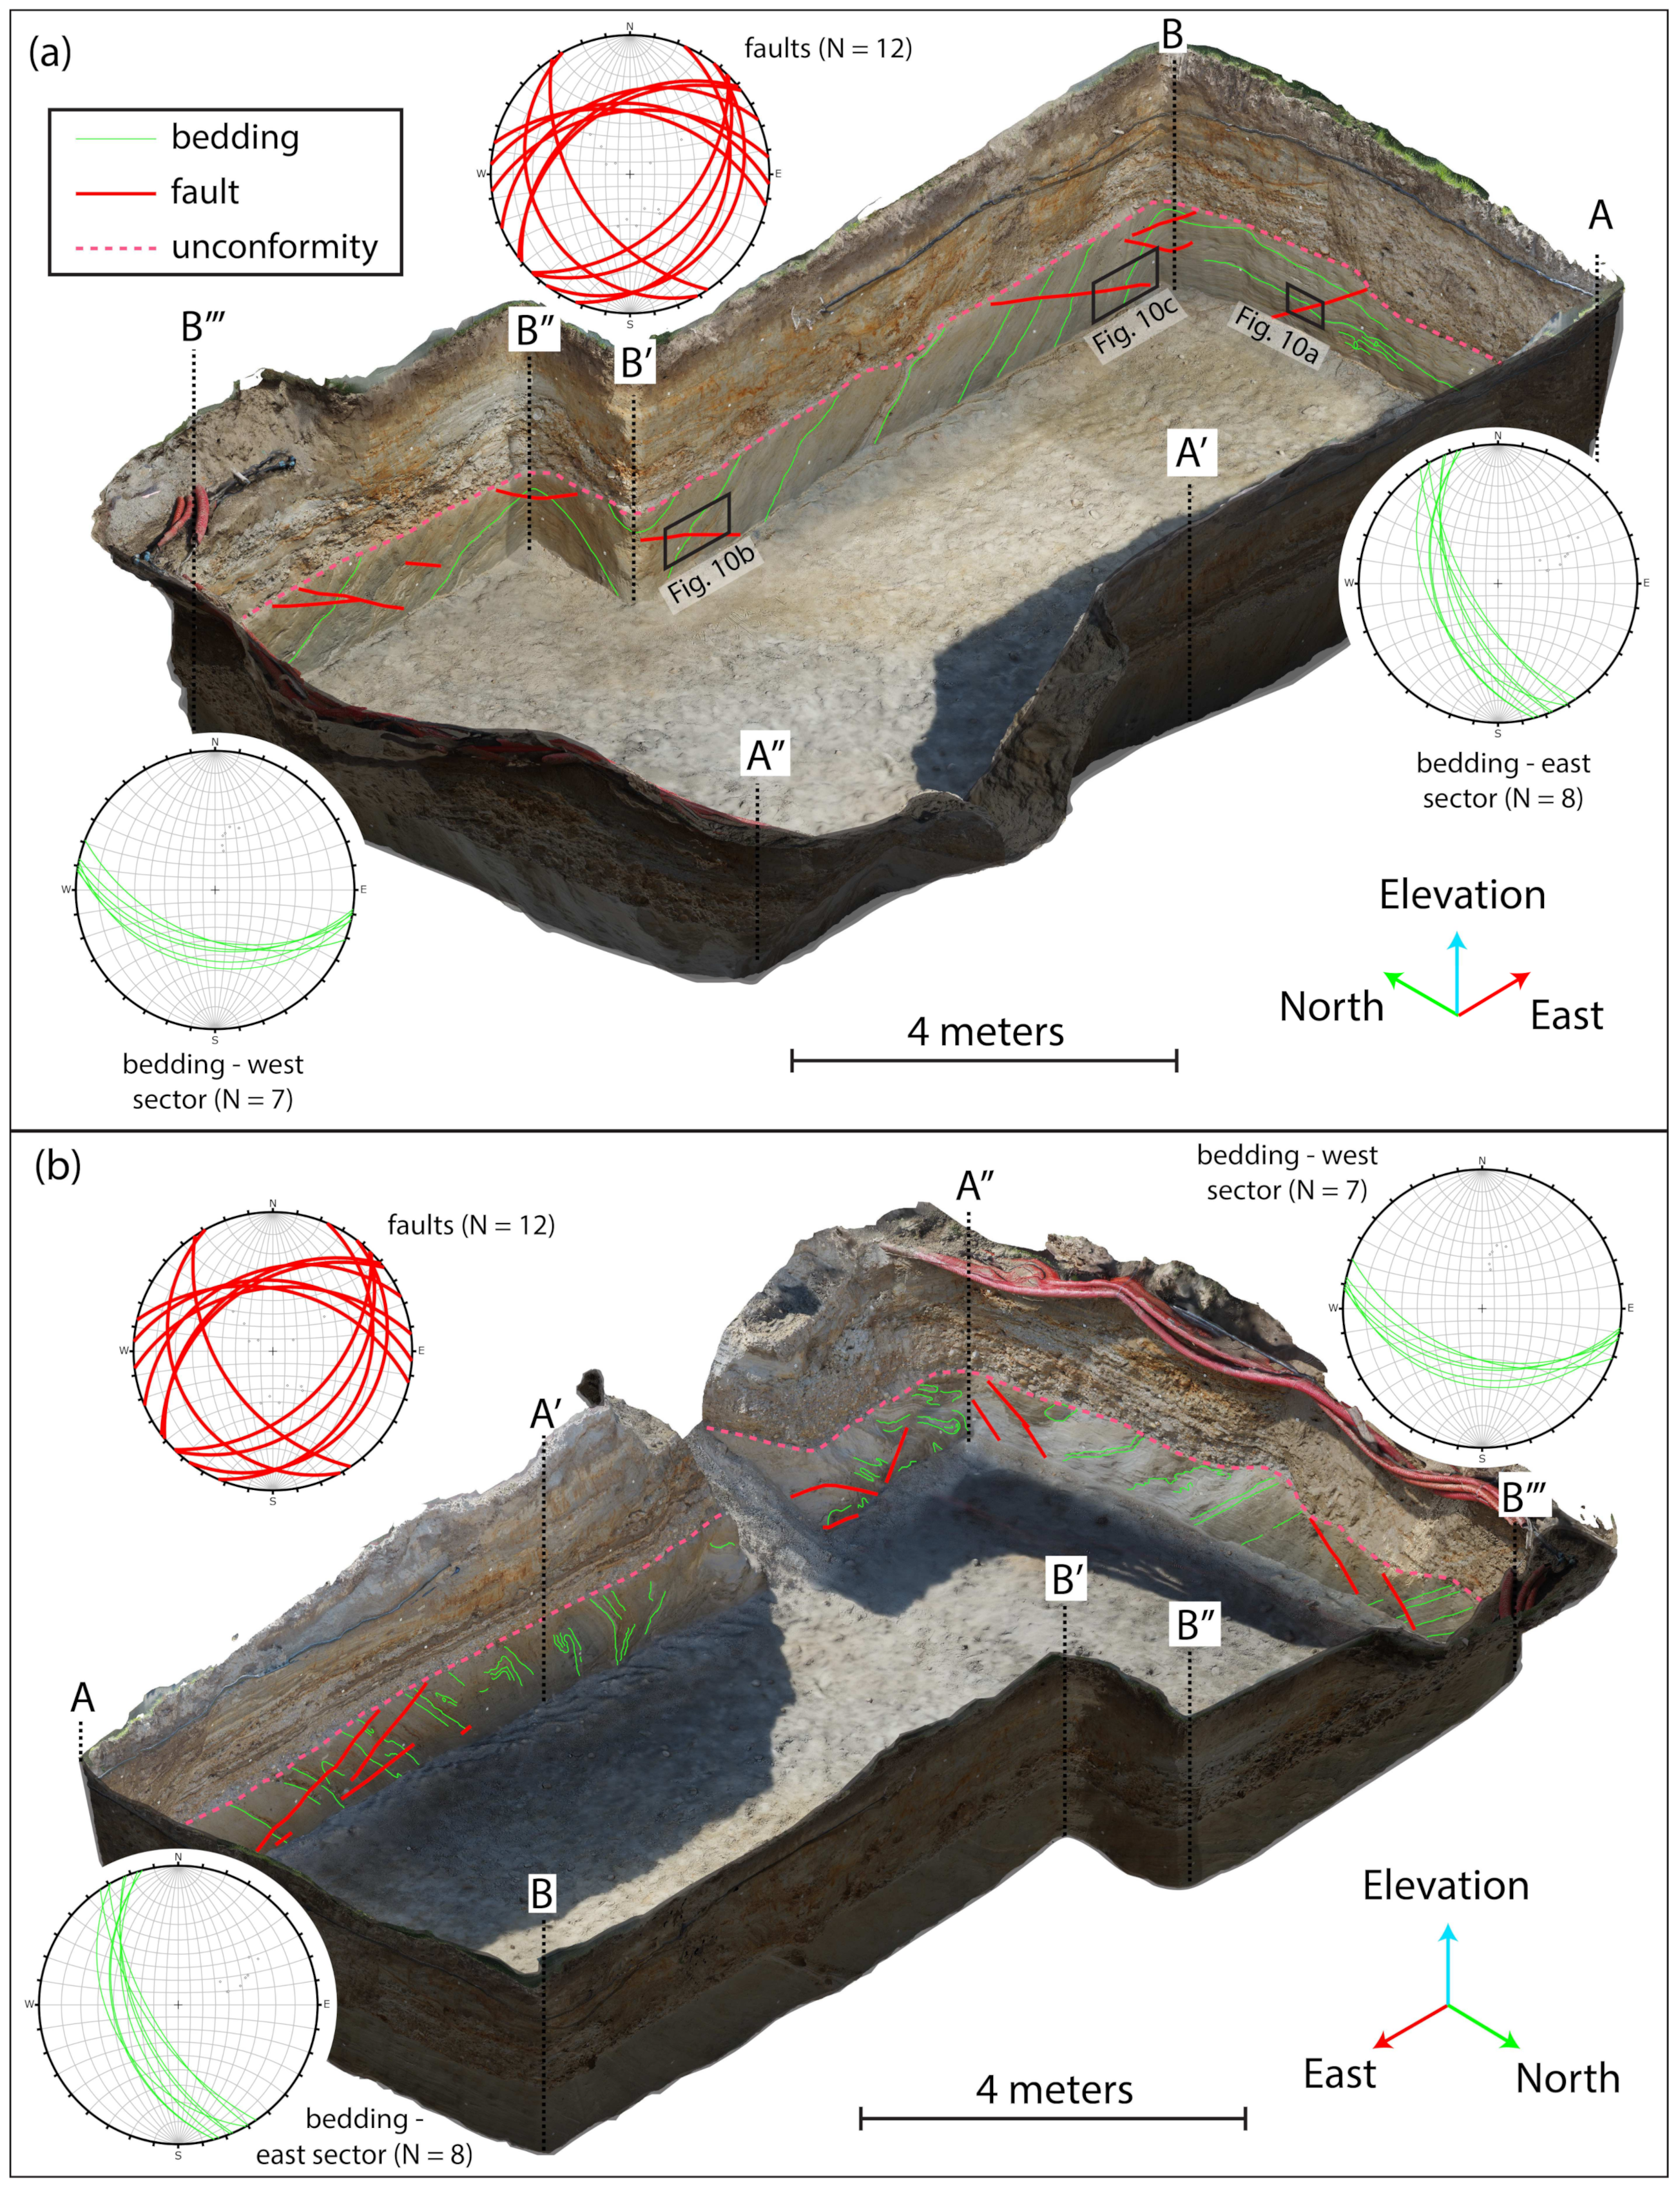
The lacustrine/fluvioglacial succession is affected by many different deformative events preceding the unconformity marked by the overlying Golasecca II and III horizon. The most evident deformation is the general tilting of the bedding that dips with an angle between 31° and 57° in the S to WSW direction (Figure 7).
Due to the flatness of the trench walls, the bedding orientation was measured only at the trench corners, where the bedding planes could be correctly derived from the intersection of the orthogonal sections. Moving from the southeast to the southwest corners, it is possible to detect a gradual variation in the bedding orientation:
  • At the eastern corners (section limit B), the bedding has a mean orientation of 255° N/46° (dip direction/dip);
  • At the corners in the middle of the north wall (section limits B′ and B″), the bedding shows a mean orientation of 216° N/32°;
  • At the corner between the north and west walls (section limit B‴), the bedding shows a mean orientation of 194° N/44°.
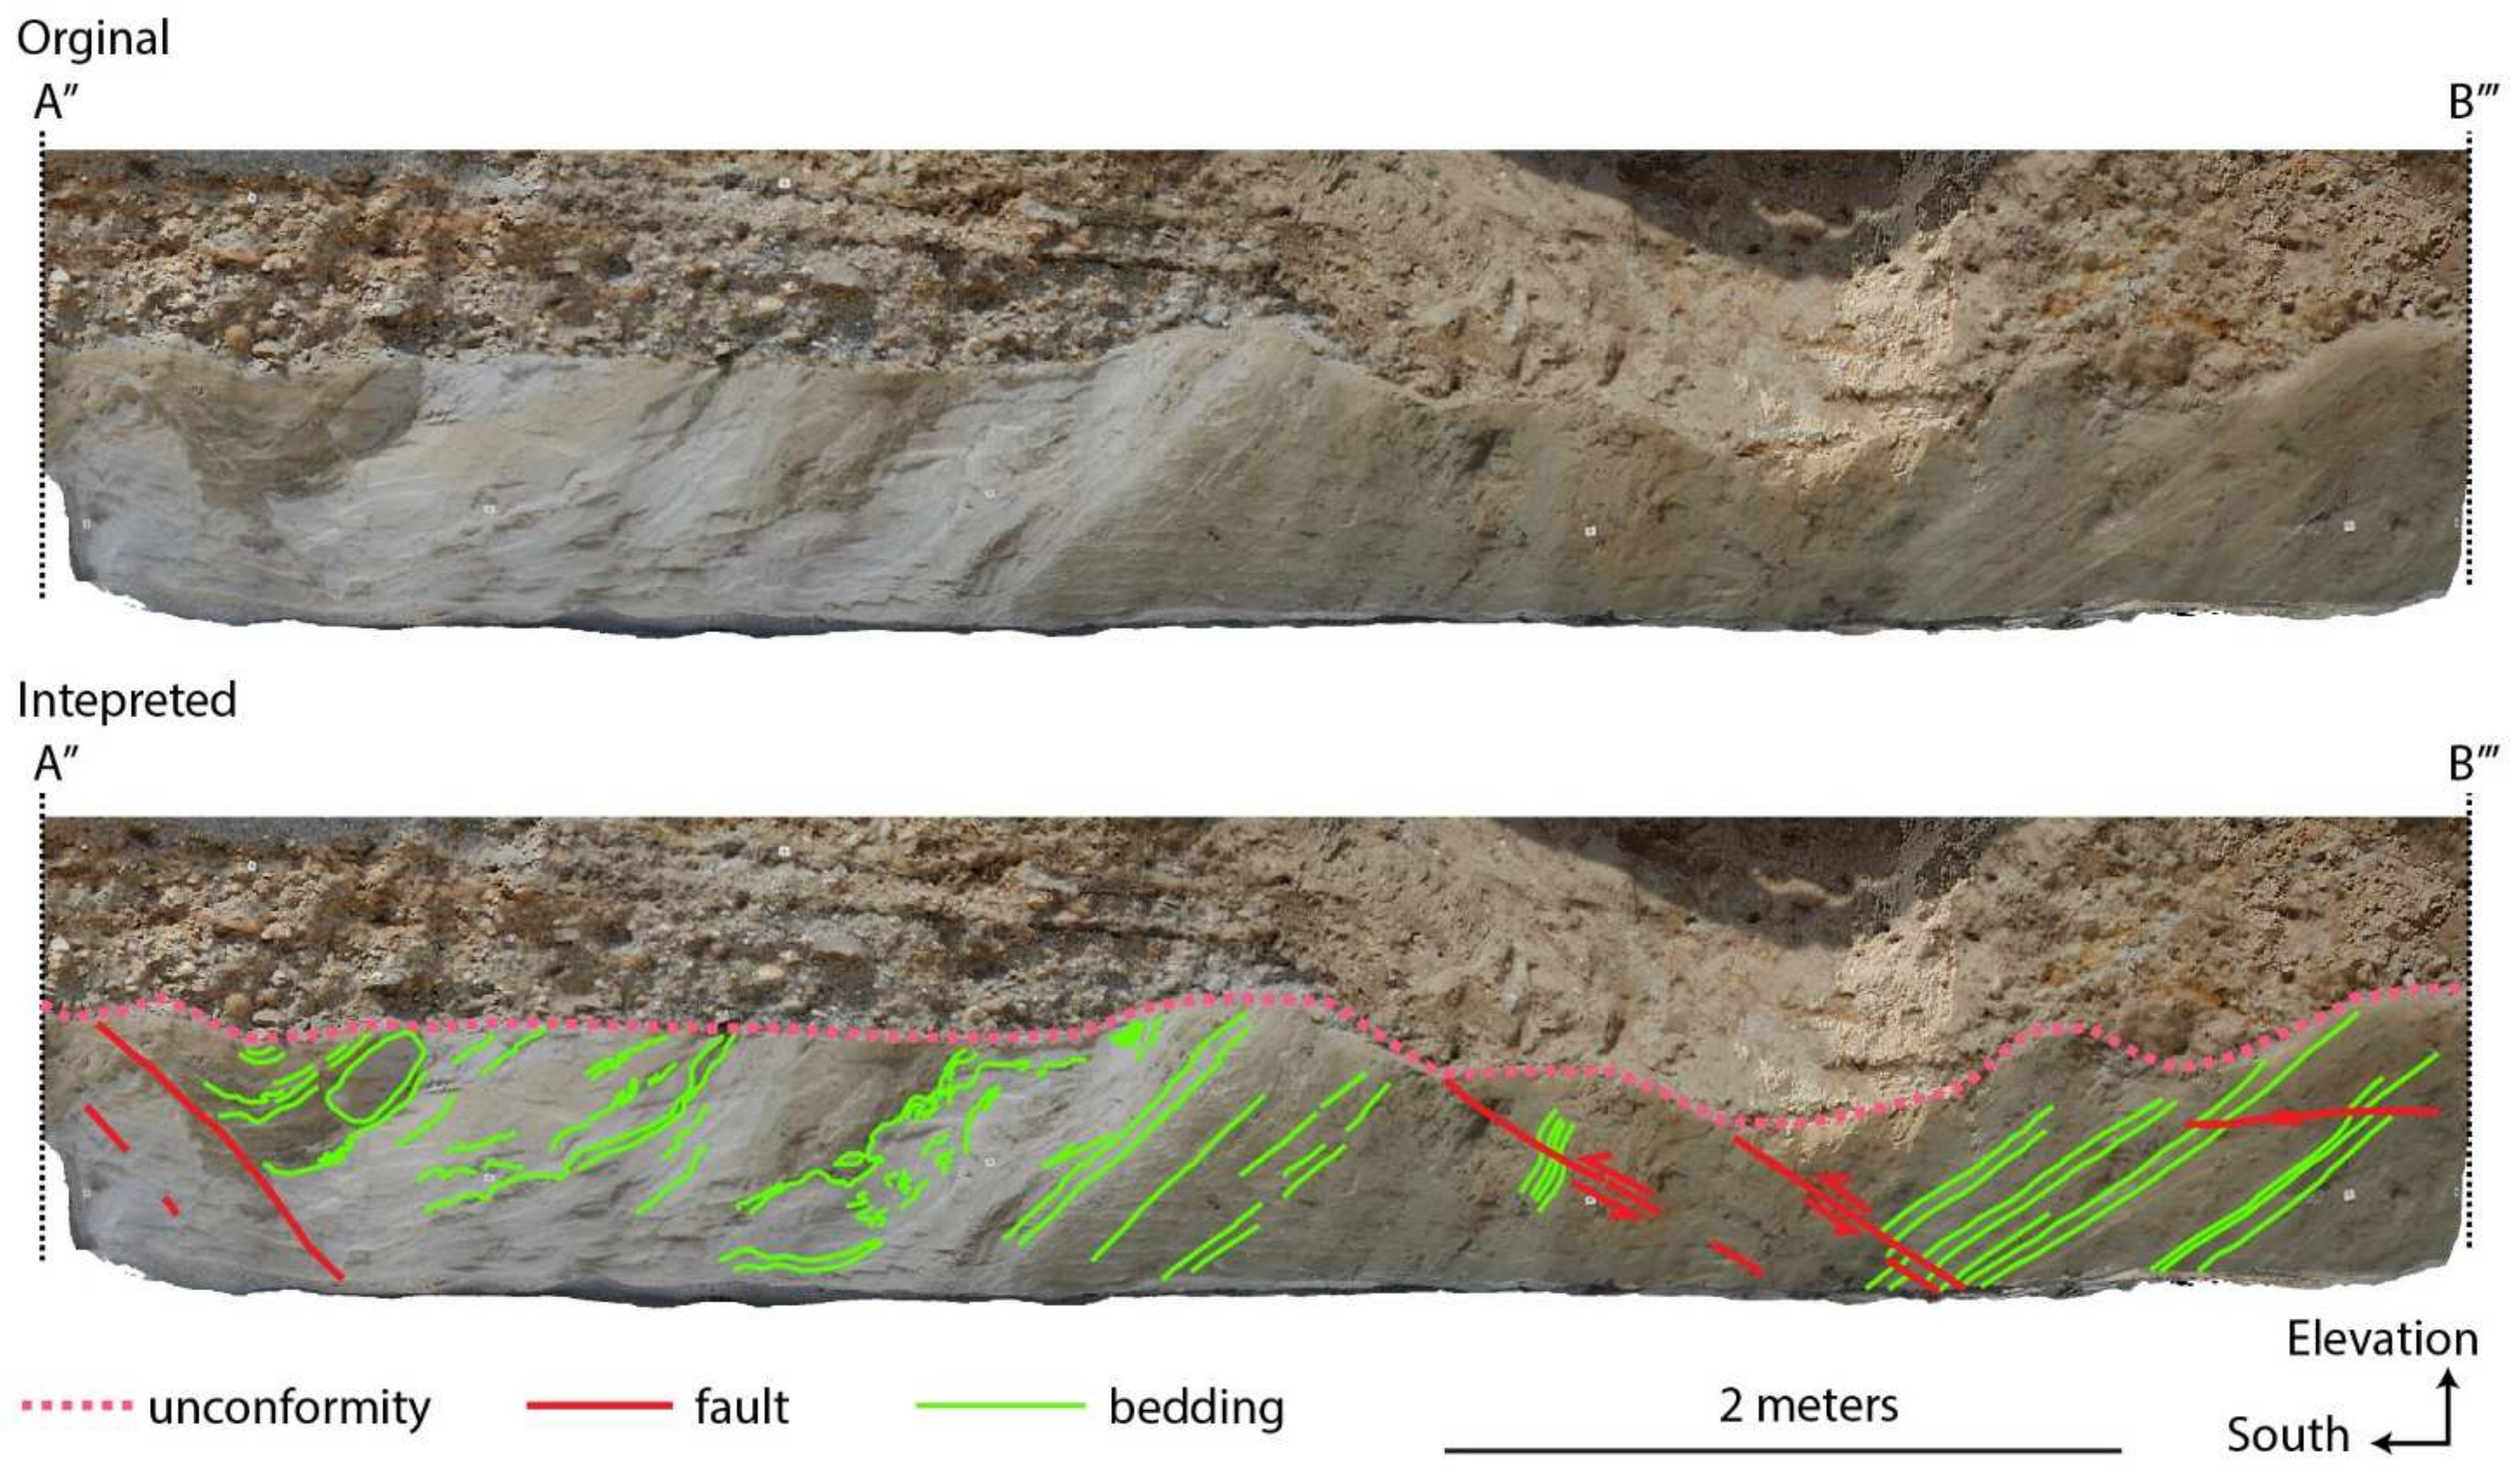
This spatial variation in the bedding orientation is likely attributable to the presence of a syncline. This syncline is characterized by an axis dipping about 40° towards 210° N. The relatively high inclination of this axis could be ascribed to a general tilting towards the SSW that the sedimentary succession has undergone and that also caused the slumping visible in the SW corner of the outcrop. The tilting is hypothetically due to a larger scale folding and, in particular, to the periclinal closure of a growing fold that was later cut by thrusting (breakthrough fault propagation fold). Moving to the southwestern corner (section limits A″), the bedding becomes less defined and irregular, showing fragmented folds and pieces of irregular layers with strong variations in thickness typical of slumping structures (Figure 8).
On the south wall (section A-A″), several unorganized and asymmetrical folds are visible, and moving towards the southwestern part of the trench, they show an increasing complexity (Figure 9).
Given their characteristics, these folds can likely be attributed to slumping structures. Unfortunately, due to the flatness of the trench wall, it was not possible to measure the orientation of the fold axes and limbs, which inhibits an accurate understanding of the slumping kinematics. The slumping structures are cut and offset by discrete surfaces of faults, displaying reverse offsets (Figure 9).
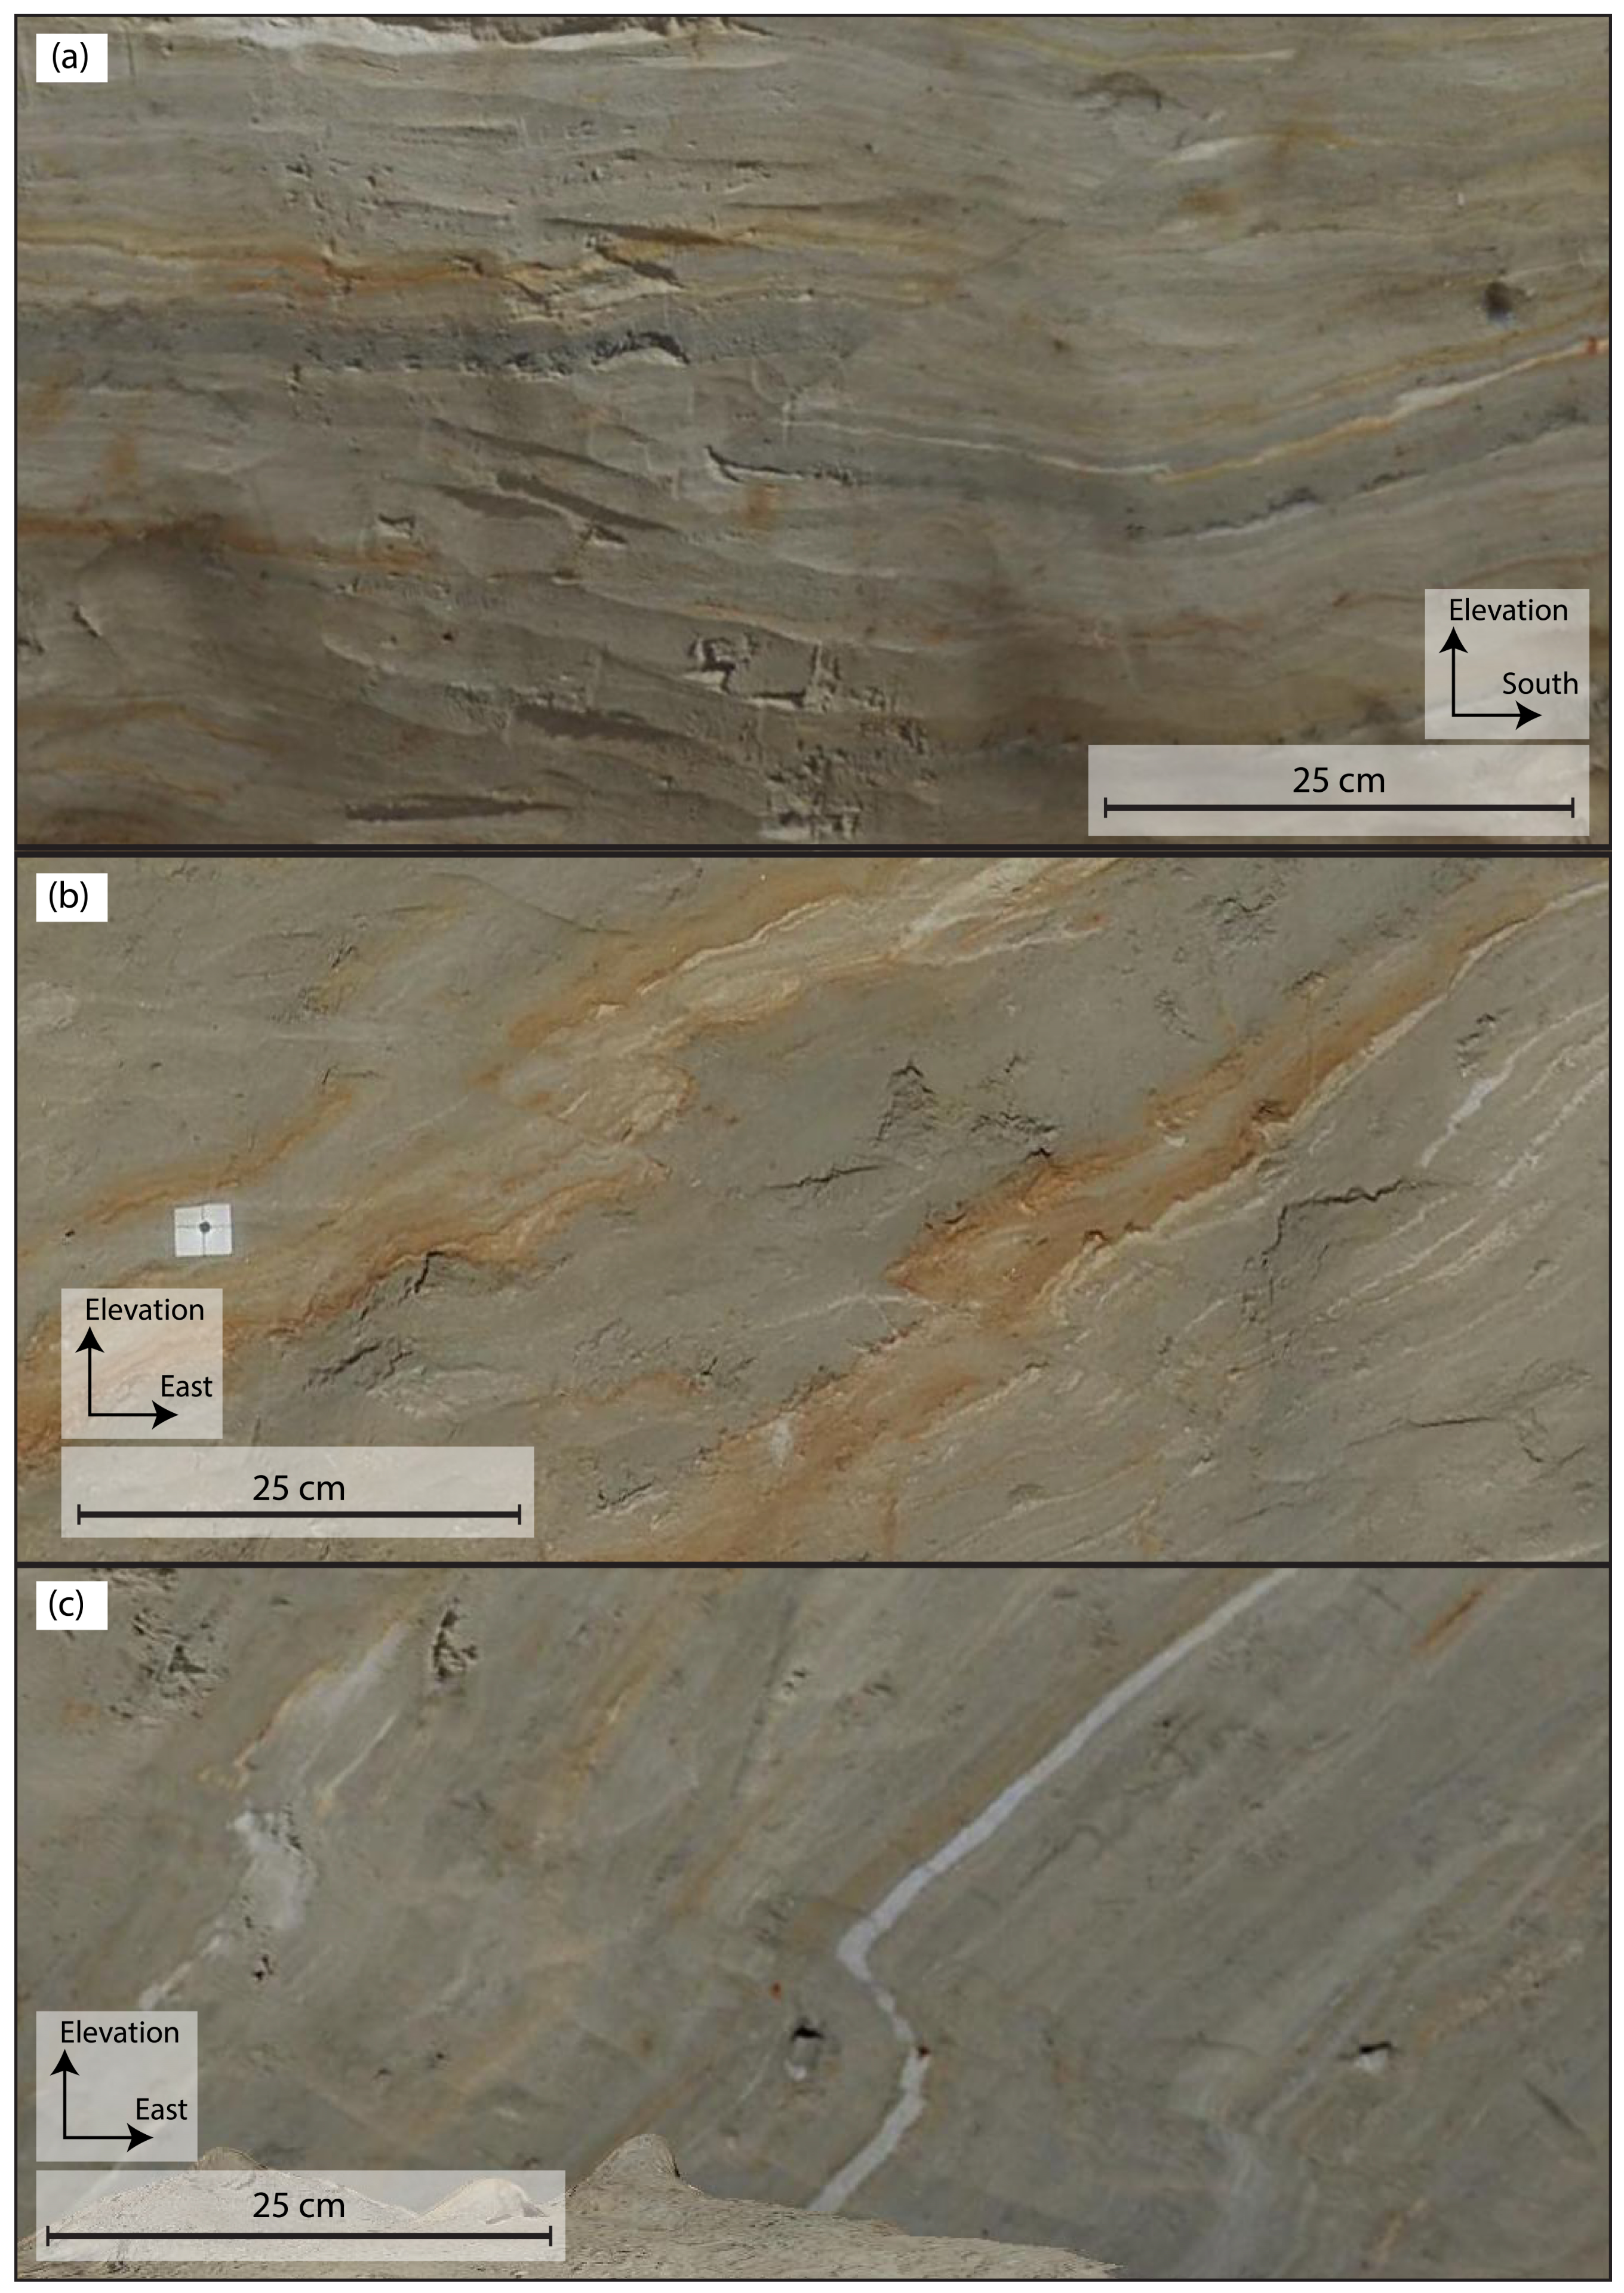
While 35 fault traces that cut the lacustrine/fluvioglacial succession were identified, only the orientations of 12 fault planes were measured from the trench corners. All the recognized shear surfaces have no appreciable width, and therefore, we can assume that they can be lower than or equal to the mapping resolution, circa 1.5 mm (around three times the nominal DOM resolution [102]). The identified faults show an apparent inverse displacement—from a few mm to ~10 cm (Figure 10)—and are sealed by the erosional unconformity (Figure 7).
The fault traces are usually regular and straight and, in some cases, accompanied by small-scale drag folds that indicate an inverse displacement (Figure 10). These faults cross-cut all the other structures (i.e., folds and slumped/deformed strata) and are more likely the latest deformations that affected the area before the erosion that created the unconformity at the base of the Golasecca alluvial deposits (VI–V century BC).
The mapped faults could be classified as three sets (Table 2): the two main sets F1 and F2 have a NE–SW direction and dip about 30° toward 346° N and 129° N, respectively, and the third set F3 (represented by only two faults) dips about 33° toward 238° N.
Using the “Measure on-point thickness” tool for the Compass plugin of CloudCompare [96], the stratigraphic separation of the F1 and F2 faults was estimated: the mean value was 4.2 cm (32 measurements with a standard deviation of 1.4 cm) and the minimum and maximum values were 1.7 cm and 8.1 cm, respectively. The total apparent offset, accumulated by the different fault strands visible in the outcrop, was evaluated as 80–100 cm.

4.3. Radiocarbon Dating

The 14C radiocarbon dating of the organic-rich sediments, which have been affected by SSDSs and faulting, was performed at the laboratory of the Archaeology Department of CIRAM SAS (Martillac, France). The procedure adhered to the ASTM D6866-22 standards/guidelines, employing the element analysis–isotope ration mass spectroscopy (EA-IRMS) and accelerator mass spectrometry (AMS) techniques.
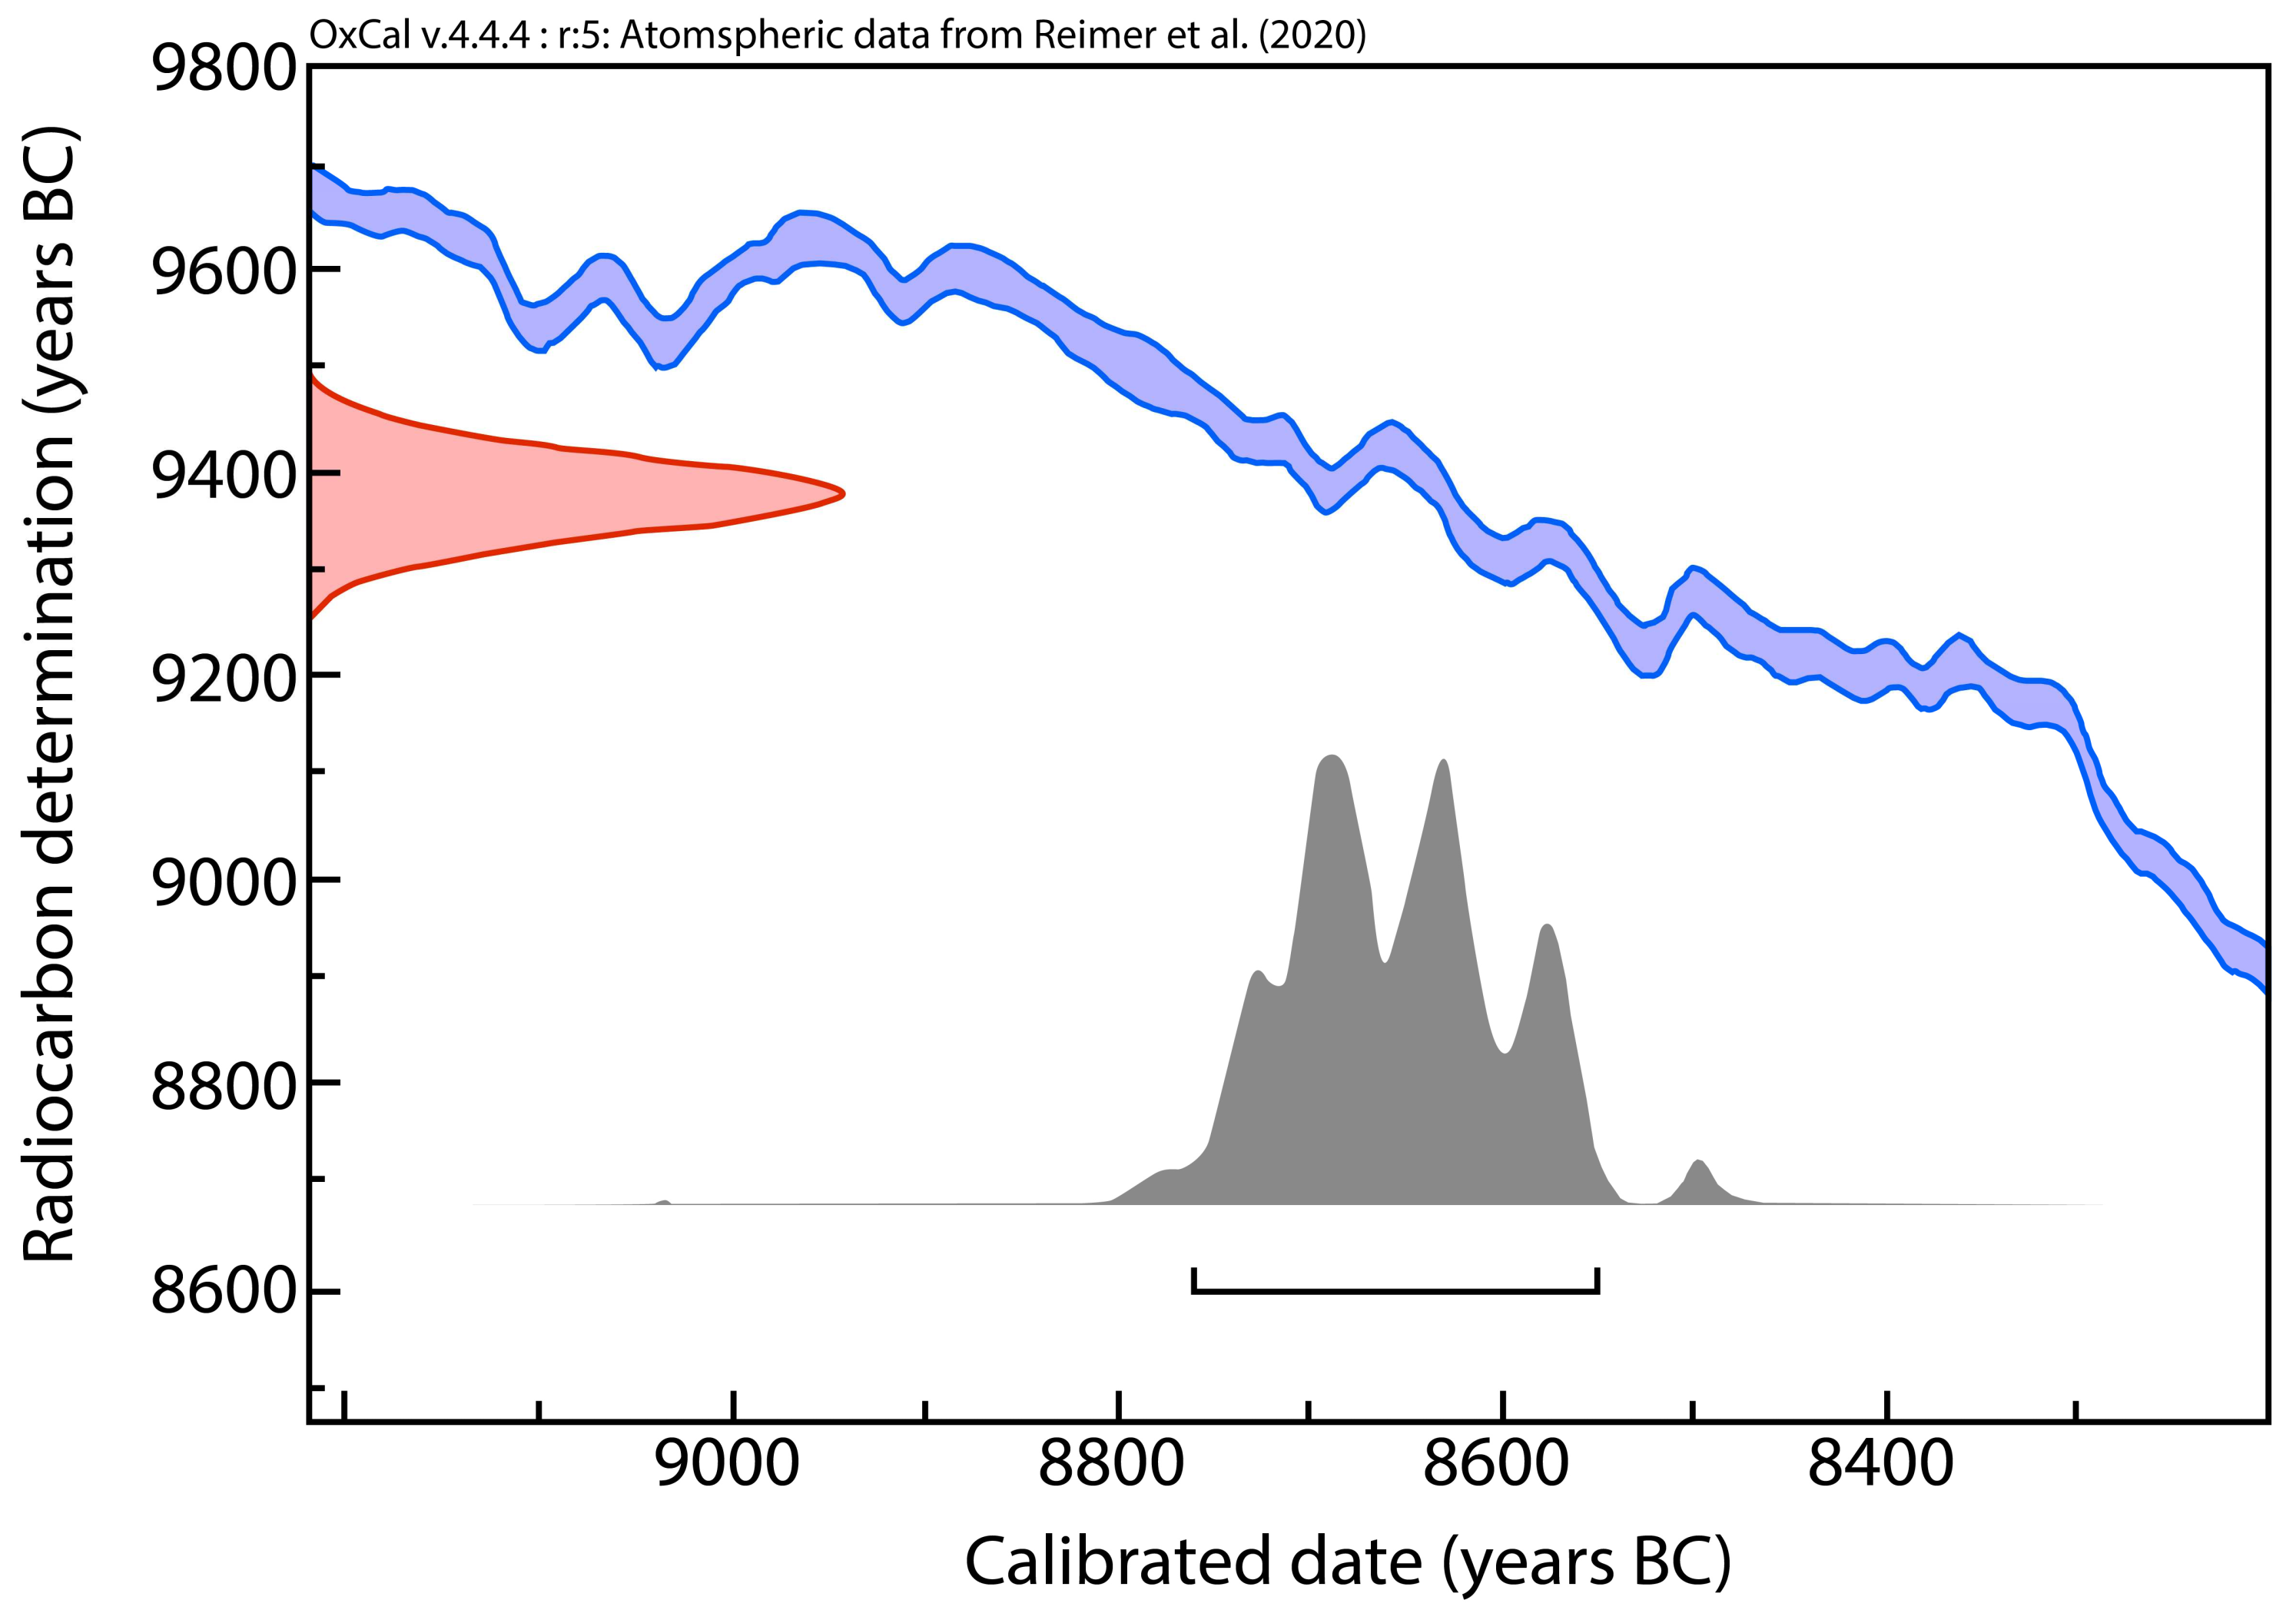
To calculate the calendar age, the calibration protocols OxCal v4.4 [103,104,105,106] and IntCal 20 [107], Northern Hemisphere Calibration ([103,104,106]), were employed. The location of the dated sample is indicated in Figure 9c.
The results of the 14C analysis date to the Mesolithic period and indicate, with 95.4% confidence, a well-defined chronological interval that covers a period between 8760 and 8550 BC (Figure 11). In addition, if the dated sample is near a slumping structure, this age must be considered the maximum/oldest age of the lower fluvial–lacustrine horizon of the outcrop.

5. Interpretation and Discussion

In the study trench, the detected deformation structures can be categorized into two groups: (i) SSDSs, primarily represented by disharmonic folds with sharp changes in thickness and a weak continuity of the layers; and (ii) brittle deformations, characterized by low-angle reverse faults. These faults clearly cut the SSDSs, indicating their later chronological occurrence. Furthermore, the sedimentary succession within the trench is strongly inclined towards S–WSW, exhibiting dip angles ranging from 31° to 57° on average.
The SSDSs are evident in the upper portion of the lower lacustrine sedimentary succession (3–5 m), which crops out for a total thickness of about 9 m, with features ascribable to slumping structures of water-saturated sediments. They likely derive from the movement of still-unconsolidated sediments along a relatively steep slope, possibly associated with the local tilting towards S–WSW. These gravity-driven deformations affecting the upper laminated lake sediments consist of disharmonic and chaotic folds with no discernable vergence. In certain areas, the layer continuity is completely disrupted, and the sediments are amalgamated.
Conversely, brittle deformations affect the whole lacustrine/fluvioglacial sedimentary succession. The main reverse faults are characterized by dips of approximately 30° and reverse stratigraphic displacement ranging from 2 to 10 cm. Ten faults have a NE–SW direction and show an apparent Andersonian geometry typical of conjugate reverse faults, possibly tilted 30°–40° towards WSW. While the true slip of these reverse faults could not be determined, their geometry suggests a NW–SE trending horizontal maximum compressional axis as the responsible of this compressional tectonics.
Overall, the structural pattern indicates that the fluvial–lacustrine sequence experienced tilting, resulting in gravity-driven instabilities such as slumping and other SSDSs (Figure 6, Figure 8 and Figure 9). These SSDSs were in part accompanied and then truncated by the development of reverse faulting affecting the entire sequence. Such deformations occurred between the age of the deposition of the lacustrine sediments, i.e., 8760–8550 BC, and the Golasecca deposition, i.e., 400 BC.
Despite the small size of the studied trench, it has provided compelling evidence of SSDSs and fault patterns, which pose significant questions on their origin in relation to the geological evolution of the area. In order to shed light on the trigger mechanism of the deformation structures analyzed, it is necessary integrate knowledge from the regional tectonic, paleogeographic, and paleoclimatic settings. In the following, three trigger agents are discussed as potentially responsible for the development of these deformation structures: glaciotectonic, gravity-induced, or tectonic (seismic or slow creep) processes.

5.1. Glaciotectonic Deformation Structures

Glaciotectonically induced deformation structures encompass thrust faults and folds that are often indistinguishable from tectonic structures (e.g., [25,26,27,28,29,30,31]).
During the Pleistocene glaciations, large glaciotectonic complexes formed across the Alpine and peri-Alpine area as a consequence of repeated advances and retreats of ice sheets. The multiphase evolution and multiple glaciations that affected the Ticino Valley are evidenced by the presence of multi-ridged morainic amphitheaters [64].
Glaciotectonic deformation is generally controlled by the thermo-mechanical properties of both ice and the underlying substrate. For example, factors such as permeability, porosity, the presence of water, and the mechanical features of the bedrock play a pivotal role (e.g., [108,109,110,111,112,113,114,115,116,117,118,119]). The geometry of glaciotectonic structures often resembles that of tectonic structures observed in thin-skinned fold-and-thrust belts [26,120,121,122,123]. Generally, glacial pushing, also referred to as bulldozing, is considered the major process in glaciotectonic complex formation [124]. In fact, the presence of interstitial ice, which increases the cohesion and shear strength of the frozen sediments, favors the transmission of the stress across significant distances, thereby facilitating the formation of large and broad glaciotectonic complexes (e.g., [107,112,113,114,117,125]).
In the study area, the principal reverse fault system has a NE–SW direction with an Andersonian geometry that suggests a NW–SW trending horizontal maximum compression. This trend aligns with the hypothetical direction of an ice-sheet advance. In addition, the observed load cast in the deformed strata are frequently linked to an ice rafting transport process. These structures typically arise from reverse density/porosity contrasts between adjacent layers, prompting the downwards penetration of masses of sand into an underlying mudstone bed. Ice-wedge casts form during a process of thermal contraction accompanied by seasonal melting and freezing in permafrost environments, although the exact mechanisms are not yet fully understood (e.g., [126]). The presence of chaotic strata and slumping also aligns with glacier-related dynamics. Even the presence of a gentle syncline with an axis that dips towards 210° N associated with slumping structures could be caused by the ice advancing.
However, the Holocene age of the deformed sediments (dated between 8760 and 8550 years BC), postdating the last glacial event in southern Lake Maggiore [64,127], seems to strongly preclude ice sheets as direct contributors to the observed deformations.

5.2. Gravity-Driven Deformation

SSDSs often originate from gravitational instability processes [3,5,128,129]. The lacustrine setting of the studied outcrop opens the possibility of high-flow discharge as a potential mechanism for overloading (e.g., [3,130,131]). Within a lacustrine environment, mass movements, including mass sliding and liquefaction, can arise not only from shaking seismic events, but also due to strong wave actions, large lake level variations, or overload of sediments along steep slopes near the shore or along the margins of tectonically uplifted zones. The rapid sediment deposition over water-saturated sands stands as an efficient mechanism that fosters a reverse density gradient and liquefaction within the underlying sandy layer [3]. The slope generated by open folds underlying the slumped strata might have acted as the trigger for the sliding.
However, the reverse faults do not appear to stem from gravity-driven instabilities. This is because the fault planes are well organized and cross-cut the slumping structures (Figure 9).

5.3. Tectonic Structures

A third and more plausible interpretation of the observed structures is connected to their possible tectonic origin, potentially in conjunction with gravity-driven processes.
The funnel-shaped structures consisting of downwarped and disrupted strata could likely be interpreted as thixotropic structures, triggered by the shaking of water-saturated sediments, most likely due to an earthquake. Thixotropy refers to the property of materials that exhibit a stable form at rest but become fluid, liquefied, and capable of flowing when agitated, shaken, or stressed. Such structures, including various types of seismites, can develop when water-saturated sediments with inherent thixotropic properties are shaken during an earthquake of sufficient magnitude. The fluidification and the lateral and upward mobilization of sediments can lead to the plastic deformation and collapse of other sediments into fissures, resulting in the formation of complex, downwarped structures that can be attributed to a thixotropic wedge.
However, despite thixotropic structures possibly suggesting a seismically induced deformation process, the lack of typical fluid-escape structures, such as flames and diapirs, does not reinforce this hypothesis. Most probably, like other SSDSs visible along the outcrop walls (e.g., slumps), these structures could be related to gravity-driven deformation processes. Specifically, SSDSs can be caused by the thrust-related uplift and the consequent tilting (about 30°–50° toward the SW) of the entire sediments’ succession.
As mentioned earlier, these deformations are cut by systematic sets of faults, suggesting that the faulting postdates them. The younger origin of these faults is indicated by the fact that they seem to represent structures resulting from an oriented stress applied to the succession. In fact, the detected reverse faults are conjugate, displaying a planar geometry, a common inclination of 30°, and a regular reverse faulting.
Taking these factors into account, it can be inferred that these faults are the most recent deformations observed in the outcrop, given that they cut across all the other structures and appear to be associated with a NW–SE trending horizontal maximum compressional axis. This direction is consistent with the recent stress field acting in the region (e.g., [132,133,134]). Additionally, the buried thrusts reported in the nearby areas (Figure 3) have a direction similar to those of the studied reverse faults (Figure 5). The absence of unambiguous markers of earthquake-induced deformations leaves open the question if these structures originated from seismic or aseismic activity. The authors of [23] demonstrated how deformation bands in porous unconsolidated sediments and slip surfaces in low-porosity sediments can be associated with the slow creep tectonic activity above the tip line of large buried faults. Despite the lack of recent earthquakes or active regional tectonic structures reported in the area, the presence of these structures suggests that compressive tectonics were active in recent times in regions of the Po Plain [49,54,58].
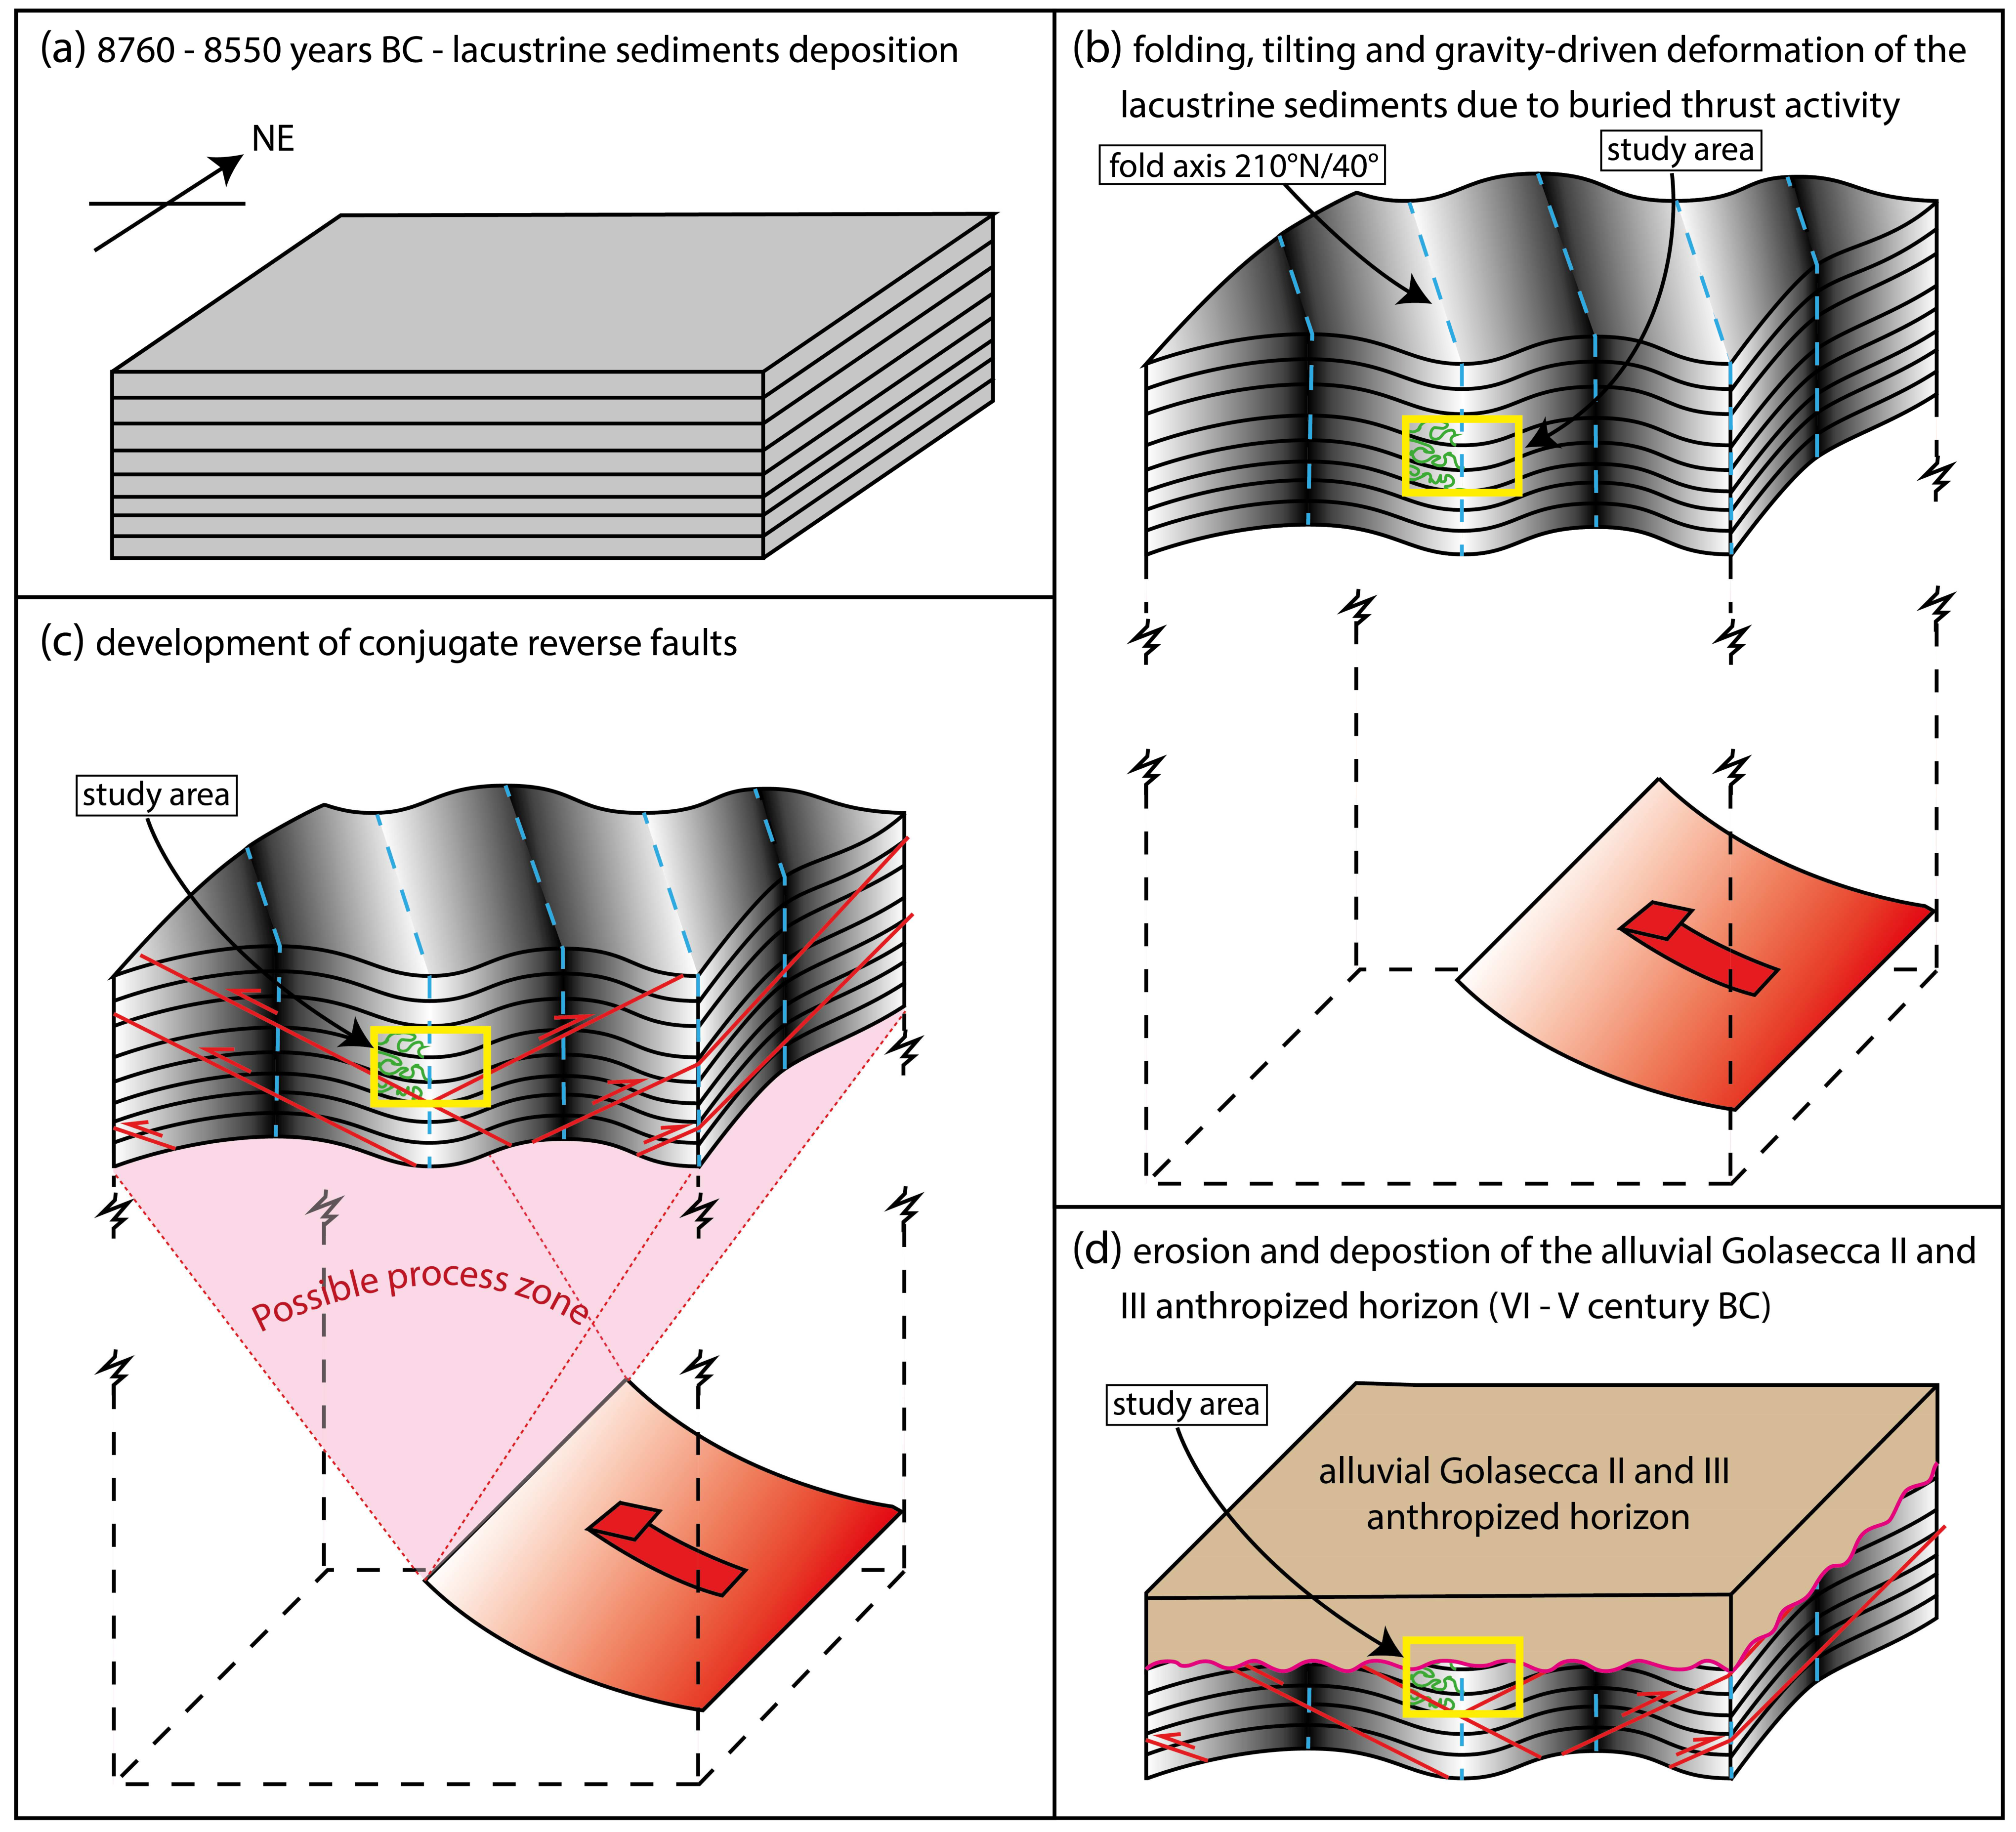
A conceptual scheme of the timing of the tectonic-related deformations is shown in Figure 12.

6. Conclusions

The analysis conducted using digital photogrammetry and a DOM has revealed and quantified a series of different kind of deformations affecting organic-rich lacustrine deposits including:
  • A general tilting of about of 30–60° towards S to WSW;
  • A series of SSDSs, such as slumping and funnel-shaped structures;
  • Three sets of faults (the two most frequent dip about 30° toward 346° N and 129° N) that cross-cut the previous deformation structures.
Via 14C radiocarbon dating, the age of these deposits has been estimated to be 8760–8550 BC with a confidence level of 95.4%. The possible glaciotectonic origin of the deformations has been ruled out, as the deposits clearly postdate the last peak of glacial advances in the study area by approximately 10 ka. Consequently, the most probable nature of these deformations is related to tectonics, which could have cause at first a series of gravity-driven deformations (e.g., slumps) and then the development of shear surfaces. While the gravity-driven deformations could be due to a tectonic uplift of the northern sector, which is clearly registered by the tilting of the deposits, the development of the reverse faults that cut across the slumping structures can be caused by the upwards propagation of a buried thrust fault. Further seismic investigations would be necessary to determine if there is an active fault in the subsurface probably connected to the Gonfolite backthrust and characterized by a long-term coseismic cycle.
We cannot discriminate between a seismic vs. aseismic origin of such deformations: while thixotropic structures may have been triggered by earthquakes, the absence of typical fluid-escape structure weakens this hypothesis.
In conclusion, it is evident that the study area likely underwent tectonic deformations spanning a chronological interval between approximately 9000 BC (the age of the deformed sediments) and 400 BC (the age of the alluvial deposits overlying the erosional surface that cross-cut all the observed deformations).
Moreover, this study clearly shows the advantages of employing digital photogrammetry and DOMs, which effectively overcome the limitations of the traditional measurements, such as scarce representability of orientation measures and inaccessibility to some portion of the outcrop. This is particularly relevant for outcrops with a transitory nature, such as trenches.

Author Contributions

Conceptualization, N.M., G.V. and C.P.; methodology, N.M., L.I.M., G.V. and C.P.; software, N.M.; validation, N.M., M.M., G.T. and C.P.; formal analysis, N.M., M.M., G.T. and C.P.; investigation, N.M., L.I.M., G.V. and C.P.; resources, N.M., L.I.M., G.V. and C.P.; data curation, N.M.; writing—original draft preparation, N.M., M.M., G.T. and C.P.; writing—review and editing, N.M., M.M., G.T., L.I.M., G.V. and C.P.; visualization, N.M., M.M., G.T. and C.P.; supervision, N.M., M.M., G.T. and C.P.; funding, C.P.; supervision of the digital photogrammetric survey, L.I.M. All authors have read and agreed to the published version of the manuscript.

Funding

This research received no external funding.

Data Availability Statement

The Digital Outcrop Model and the related products (e.g., orthoimages of trench walls) can be made available upon request to the Soprintendenza Archeologia Belle Arti e Paesaggio per le Province di Biella Novara Verbano-Cusio-Ossola e Vercelli (Ministero della Cultura). The 3D structural data can be made available upon request to the corresponding author.

Acknowledgments

We would like to thank Alessandro Vandelli for developing the Digital Outcrop Model (DOM) and the Soprintendenza Archeologia Belle Arti e Paesaggio per le Province di Biella Novara Verbano-Cusio-Ossola e Vercelli (Ministero della Cultura) for allowing its use.

Conflicts of Interest

The authors declare no conflict of interest.

References

  1. Zieliński, T.; Van Loon, A.J. Characteristics and genesis of moraine-derived flowtill varieties. Sediment. Geol. 1996, 101, 119–143. [Google Scholar] [CrossRef]
  2. Van Loon, A.J. Soft-sediment deformation structures in siliciclastic sediments: An overview. Geologos 2009, 1270, 3–55. [Google Scholar]
  3. Owen, G.; Moretti, M.; Alfaro, P. Recognising triggers for soft-sediment deformation: Current understanding and future directions. Sediment. Geol. 2011, 235, 133–140. [Google Scholar] [CrossRef]
  4. Mueller, P.; Tamburelli, S.; Menegoni, N.; Perozzo, M.; Amadori, C.; Crispini, L.; Federico, L.; Seno, S.; Maino, M. Soft-sediment deformation structures in the Finale Ligure Basin mixed carbonate-siliciclastic coastal wedge: Evidence for Miocene seismicity on the Liguro-Provençal Basin margin. Mar. Pet. Geol. 2023; in print. [Google Scholar]
  5. Mills, P.C. Genesis and diagnostic value of soft-sediment deformation structures—A review. Sediment. Geol. 1983, 35, 83–104. [Google Scholar] [CrossRef]
  6. Seilacher, A. Fault-graded beds interpreted as seismites. Sedimentology 1969, 13, 155–159. [Google Scholar] [CrossRef]
  7. Obermeier, S.F. Use of liquefaction induced features for paleoseismic analysis—An overview of how seismic liquefaction features can be distinguished from other features and how their regional distribution and properties of source sediment can be used to infer the location and strength of Holocene paleo-earthquakes. Eng. Geol. 1996, 44, 1–76. [Google Scholar] [CrossRef]
  8. Molina, J.M.; Alfaro, P.; Moretti, M.; Soria, J.M. Soft-sediment deformation structures induced by cyclic stress of storm waves in tempestites (Miocene, Guadalquivir Basin, Spain). Terra Nova 1998, 10, 145–150. [Google Scholar] [CrossRef]
  9. Fossen, H. Deformation bands formed during soft-sediment deformation: Observations from SE Utah. Mar. Pet. Geol. 2010, 27, 215–222. [Google Scholar] [CrossRef]
  10. Moretti, M.; Sabato, L. Recognition of trigger mechanisms for soft-sediment deformation in the Pleistocene lacustrine deposits of the Sant‘Arcangelo Basin (Southern Italy): Seismic shock vs. overloading. Sediment. Geol. 2007, 196, 31–45. [Google Scholar] [CrossRef]
  11. Brandes, C.; Winsemann, J. Soft-sediment deformation structures in NW Germany caused by Late Pleistocene seismicity. Int. J. Earth Sci. 2013, 102, 2255–2274. [Google Scholar] [CrossRef]
  12. Shanmugam, G. Global case studies of soft-sediment deformation structures (SSDS): Definitions, classifications, advances, origins, and problems. J. Palaeogeogr. 2017, 6, 251–320. [Google Scholar] [CrossRef]
  13. Van Loon, A.J.; Pisarska-Jamroży, M.; Woronko, B. Sedimentological distinction in glaciogenic sediments between load casts induced by periglacial processes from those induced by seismic shocks. Geol. Q. 2020, 64, 626–640. [Google Scholar] [CrossRef]
  14. Varejão, F.G.; Warren, L.V.; Simões, M.G.; Cerri, R.I.; Alessandretti, L.; Santos, M.G.M.D.; Assine, M.L. Evaluation of distinct soft-sediment deformation triggers in mixed carbonate-siliciclastic systems: Lessons from the Brazilian Pre-Salt analogue Crato Formation (Araripe Basin, NE Brazil). Mar. Pet. Geol. 2022, 140, 105673. [Google Scholar] [CrossRef]
  15. Van Vliet-Lanoë, B.; Magyari, A.; Meilliez, F. Distinguishing between tectonic and periglacial deformations of quaternary continental deposits in Europe. Glob. Planet. Chang. 2004, 43, 103–127. [Google Scholar] [CrossRef]
  16. Gehrmann, A.; Harding, C. Geomorphological mapping and spatial analyses of an Upper Weichselian glacitectonic complex based on LiDAR data, Jasmund Peninsula (NE Rügen), Germany. Geosciences 2018, 8, 208. [Google Scholar] [CrossRef]
  17. Müller, K.; Winsemann, J.; Pisarska-Jamroży, M.; Lege, T.; Spies, T.; Brandes, C. The Challenge to Distinguish Soft-Sediment Deformation Structures (SSDS) Formed by Glaciotectonic, Periglacial and Seismic Processes in a Formerly Glaciated Area: A Review and Synthesis. In Glacially-Triggered Faulting; Steffen, H., Olesen, O., Sutinen, R., Eds.; Cambridge University Press: Cambridge, UK, 2021; pp. 67–88. [Google Scholar] [CrossRef]
  18. Fossen, H.; Schultz, R.A.; Shipton, Z.K.; Mair, K. Deformation bands in sandstone: A review. J. Geol. Soc. 2007, 164, 755–769. [Google Scholar] [CrossRef]
  19. Ballas, G.; Fossen, H.; Soliva, R. Factors controlling permeability of cataclastic deformation bands and faults in porous sandstone reservoirs. J. Struct. Geol. 2015, 76, 1–21. [Google Scholar] [CrossRef]
  20. Cashman, S.M.; Baldwin, J.N.; Cashman, K.V.; Swanson, K.; Crawford, R. Microstructures developed by coseismic and aseismic faulting in near-surface sediments, San Andreas fault, California. Geology 2007, 35, 611–614. [Google Scholar] [CrossRef]
  21. Brandes, C.; Steffen, H.; Sandersen, P.B.E.; Wu, P.; Winsemann, J. Glacially induced faulting along the NW segment of the Sorgenfrei-Tornquist Zone, northern Denmark: Implications for neotectonics and Lateglacial fault-bound basin formation. Quat. Sci. Rev. 2018, 189, 149–168. [Google Scholar] [CrossRef]
  22. Brandes, C.; Igel, J.; Loewer, M.; Tanner, D.C.; Lang, J.; Müller, K.; Winsemann, J. Visualisation and analysis of shear-deformation bands in unconsolidated Pleistocene sand using ground-penetrating radar: Implications for paleoseismological studies. Sediment. Geol. 2018, 367, 135–145. [Google Scholar] [CrossRef]
  23. Brandes, C.; Tanner, D.C.; Fossen, H.; Halisch, M.; Müller, K. Disaggregation bands as an indicator for slow creep activity on blind faults. Commun. Earth Environ. 2022, 3, 99. [Google Scholar] [CrossRef]
  24. Bertran, P.; Font, M.; Giret, A.; Manchuel, K.; Sicilia, D. Experimental soft-sediment deformation caused by fluidization and intrusive ice melt in sand. Sedimentology 2019, 66, 1102–1117. [Google Scholar] [CrossRef]
  25. Moran, S.R. Glaciotectonic structures in drift. In Till: A symposium; Ohio State University Press: Columbus, OH, USA, 1971; pp. 127–148. ISBN 9780814201480. Available online: http://hdl.handle.net/1811/81923 (accessed on 1 June 2023).
  26. Croot, D.G. Glacio-tectonic structures: A mesoscale model of thin-skinned thrust sheets? J. Struct. Geol. 1987, 9, 797–808. [Google Scholar] [CrossRef]
  27. Pedersen, S.A.S. Superimposed deformation in glaciotectonics. Bull. Geol. Soc. Den. 2000, 46, 125–144. [Google Scholar] [CrossRef]
  28. Benediktsson, Í.Ö. End Moraines and Ice Marginal Processes of Surge-Type Glaciers. Brúarjökull and Eyjabakkajökull, Iceland. Ph.D. Thesis, University of Iceland, Reykjavík, Iceland, 2010. Available online: http://hdl.handle.net/1946/7731 (accessed on 1 June 2023).
  29. Pedersen, S.A.S. Architecture of glaciotectonic complexes. Geosciences 2014, 4, 269–296. [Google Scholar] [CrossRef]
  30. Włodarski, W. Geometry and kinematics of glaciotectonic deformation superimposed on the Cenozoic fault-tectonic framework in the central Polish Lowlands. Quat. Sci. Rev. 2014, 94, 44–61. [Google Scholar] [CrossRef]
  31. Widera, M. Tectonic and glaciotectonic deformations in the areas of Polish lignite deposits. Civ. Environ. Eng. Rep. 2018, 28, 182–193. [Google Scholar] [CrossRef]
  32. DeCelles, P.G.; Giles, K.A. Foreland basin systems. Basin Res. 1996, 8, 105–123. [Google Scholar] [CrossRef]
  33. Naylor, M.; Sinclair, H.D. Pro-vs. retro-foreland basins. Basin Res. 2008, 20, 285–303. [Google Scholar] [CrossRef]
  34. Vail, P.R.; Mitchum, R.M.; Thompson, S.I.I.I. Seismic stratigraphy and global changes of sea level, part 3: Relative changes of sea level from coastal onlap. In Seismic Stratigraphy—Applications to Hydrocarbon Exploration; Charles, E., Ed.; Payton AMERICAN ASSOCIATION OF PETROLEUM GEOLOGISTS: Tulsa, OK, USA, 1977. [Google Scholar] [CrossRef]
  35. Castellarin, A.; Vai, G.B. Southalpine versus Po plain Apenninic arcs. In Developments in Geotectonics; Wezel, F.C., Ed.; Elsevier: Amsterdam, The Netherlands, 1986; Volume 21, pp. 253–280. [Google Scholar] [CrossRef]
  36. Miall, A.D. Cycles with Million-Year Episodicities. In The Geology of Stratigraphic Sequences; Springer: Berlin, Germany, 1997; pp. 99–138. [Google Scholar]
  37. Hinderer, M. Late Quaternary denudation of the Alps, valley and lake fillings and modern river loads. Geodin. Acta 2001, 14, 231–263. [Google Scholar] [CrossRef]
  38. Garzanti, E.; Vezzoli, G.; Andò, S. Paleogeographic and paleodrainage changes during Pleistocene glaciations (Po Plain, northern Italy). Earth-Sci. Rev. 2011, 105, 25–48. [Google Scholar] [CrossRef]
  39. Amadori, C.; Garcia-Castellanos, D.; Toscani, G.; Sternai, P.; Fantoni, R.; Ghielmi, M.; Di Giulio, A. Restored topography of the Po Plain-Northern Adriatic region during the Messinian base-level drop—Implications for the physiography and compartmentalization of the palaeo-Mediterranean basin. Basin Res. 2018, 30, 1247–1263. [Google Scholar] [CrossRef]
  40. Amadori, C.; Toscani, G.; Di Giulio, A.; Maesano, F.E.; D’Ambrogi, C.; Ghielmi, M.; Fantoni, R. From cylindrical to non-cylindrical foreland basin: Pliocene–Pleistocene evolution of the Po Plain–Northern Adriatic basin (Italy). Basin Res. 2019, 31, 991–1015. [Google Scholar] [CrossRef]
  41. Toscani, G.; Bonini, L.; Ahmad, M.I.; Bucci, D.D.; Giulio, A.D.; Seno, S.; Galuppo, C. Opposite verging chains sharing the same foreland: Kinematics and interactions through analogue models (Central Po Plain, Italy). Tectonophysics 2014, 633, 268–282. [Google Scholar] [CrossRef]
  42. Pieri, M.; Groppi, G. Subsurface Geological Structure of the Po Plain, Italy, CNR Publicazione No. 414 del Progetto Finalizzato Geodinamico; Consiglio Nazionale delle Ricerche: Roma, Italy, 1981; pp. 1–11. [Google Scholar]
  43. Muttoni, G.; Carcano, C.; Garzanti, E.; Ghielmi, M.; Piccin, A.; Pini, R.; Rogledi, S.; Sciunnach, D. Onset of major Pleistocene glaciations in the Alps. Geology 2003, 31, 989–992. [Google Scholar] [CrossRef]
  44. Guzzetti, F.; Marchetti, M.; Reichenbach, P. Large alluvial fans in the north-central Po Plain (Northern Italy). Geomorphology 1997, 18, 119–136. [Google Scholar] [CrossRef]
  45. Marchetti, M. Environmental changes in the central Po Plain (northern Italy) due to fluvial modifications and anthropogenic activities. Geomorphology 2002, 44, 361–373. [Google Scholar] [CrossRef]
  46. Fontana, A.; Mozzi, P.; Marchetti, M. Alluvial fans and megafans along the southern side of the Alps. Sediment. Geol. 2014, 301, 150–171. [Google Scholar] [CrossRef]
  47. Forno, M.G.; Gianotti, F.; Storti, U. Geomorphology of the Po fluvial terraces in Turin deduced by new subsoil data (NW Italy). Water 2022, 14, 2872. [Google Scholar] [CrossRef]
  48. Scaramuzzo, E.; Livio, F.A.; Granado, P.; Di Capua, A.; Bitonte, R. Anatomy and kinematic evolution of an ancient passive margin involved into an orogenic wedge (Western Southern Alps, Varese area, Italy and Switzerland). Swiss J. Geosci. 2022, 115, 4. [Google Scholar] [CrossRef]
  49. Bresciani, I.; Perotti, C.R. An active deformation structure in the Po Plain (N Italy): The Romanengo anticline. Tectonics 2014, 33, 2059–2076. [Google Scholar] [CrossRef]
  50. Fantoni, R.; Bersezio, R.; Forcella, F. Alpine structure and deformation chronology at the Southern Alps-Po Plain border in Lombardy. Boll. Soc. Geol. Ital. 2004, 123, 463–476. [Google Scholar]
  51. Michetti, A.; Giardina, F.; Livio, F.; Mueller, K.; Serva, L.; Sileo, G.; Vittori, E.; Devoti, R.; Riguzzi, F.; Carcano, C.; et al. Active compressional tectonics, Quaternary capable faults, and the seismic landscape of the Po Plain (N Italy). Ann. Geophys. 2012, 55, 969–1001. [Google Scholar] [CrossRef]
  52. Devoti, R.; Esposito, A.; Pietrantonio, G.; Pisani, A.R.; Riguzzi, F. Evidence of large scale deformation patterns from GPS data in the Italian subduction boundary. Earth Planet. Sci. Lett. 2011, 311, 230–241. [Google Scholar] [CrossRef]
  53. Farolfi, G.; Bianchini, S.; Casagli, N. Integration of GNSS and Satellite InSAR Data: Derivation of Fine-Scale Vertical Surface Motion Maps of Po Plain, Northern Apennines, and Southern Alps, Italy. IEEE Trans. Geosci. Remote Sens. 2018, 57, 319–328. [Google Scholar] [CrossRef]
  54. Zanchi, A.; Ravazzi, C.; Cavallin, A.; Deaddis, M.; De Amicis, M.; Arosio, T.; Marchetti, M.; Vezzoli, G. Interplay of Holocene surface faulting and climate in the Central Po Plain, Italy. Quat. Res. 2022, 107, 71–86. [Google Scholar] [CrossRef]
  55. Desio, A. I Rilievi Isolati Della Pianura Lombarda ed i Movimenti Tettonici del Quaternario. Rend. Ist. Lom. Acc. Sci. Lett. 1965, 99, 881–894. [Google Scholar]
  56. Livio, F.; Berlusconi, A.; Michetti, A.M.; Sileo, G.; Zerboni, A.; Trombino, L.; Cremaschi, M.; Mueller, K.; Vittori, E.; Carcano, C.; et al. Active fault-related folding in the epicentral area of the December 25, 1222 (Io = IXMCS) Brescia earthquake (Northern Italy): Seismotectonic implications. Tectonophysics 2009, 476, 320–335. [Google Scholar] [CrossRef]
  57. Zuffetti, C.; Bersezio, R.; Contini, D.; Petrizzo, M.R. Geology of the San Colombano hill, a Quaternary isolated tectonic relief in the Po Plain of Lombardy (Northern Italy). J. Maps 2018, 14, 199–211. [Google Scholar] [CrossRef]
  58. Zuffetti, C.; Bersezio, R. Morphostructural evidence of late quaternary tectonics at the Po Plain-Northern Apennines border (Lombardy, Italy). Geomorphology 2020, 364, 107245. [Google Scholar] [CrossRef]
  59. Bernoulli, D.; Bertotti, G.; Zingg, A. Northward thrusting of the Gonfolite Lombarda (South-Alpine Molasse) onto the Mesozoic sequence of the Lombardian Alps: Implications for the deformation history of the Southern Alps. Eclogae Geol. Helv. 1989, 82, 841–856. [Google Scholar] [CrossRef]
  60. Di Giulio, A.; Carrapa, B.; Fantoni, R.; Gorla, L.; Valdisturlo, A. Middle Eocene to Early Miocene sedimentary evolution of the western Lombardian segment of the South Alpine foredeep (Italy). Int. J. Earth Sci. 2001, 90, 534–548. [Google Scholar] [CrossRef]
  61. Burrato, P.; Ciucci, F.; Valensise, G. An inventory of river anomalies in the Po Plain, Northern Italy: Evidence for active blind thrust faulting. Ann. Geophys. 2003, 46, 3459. Available online: http://hdl.handle.net/2122/993 (accessed on 1 July 2023). [CrossRef]
  62. Maesano, F.E.; D’Ambrogi, C.; Burrato, P.; Toscani, G. Slip-rates of blind thrusts in slow deforming areas: Examples from the Po Plain (Italy). Tectonophysics 2015, 643, 8–25. [Google Scholar] [CrossRef]
  63. Vannoli, P.; Burrato, P.; Valensise, G. The seismotectonics of the Po Plain (northern Italy): Tectonic diversity in a blind faulting domain. Pure Appl. Geophys. 2015, 172, 1105–1142. [Google Scholar] [CrossRef]
  64. Kamleitner, S.; Ivy-Ochs, S.; Monegato, G.; Gianotti, F.; Akçar, N.; Vockenhuber, C.; Christl, M.; Synal, H.A. The ticino-toce glacier system (Swiss-Italian Alps) in the framework of the alpine last glacial maximum. Quat. Sci. Rev. 2022, 279, 107400. [Google Scholar] [CrossRef]
  65. Bini, A.; Cita, M.B.; Gaetani, M. Southern Alpine lakes—Hypothesis of an erosional origin related to the Messinian entrenchment. Mar. Geol. 1978, 27, 271–288. [Google Scholar] [CrossRef]
  66. Finckh, P.; Kelts, K.; Lambert, A. Seismic stratigraphy and bedrock forms in perialpine lakes. Geol. Soc. Am. Bull. 1984, 95, 1118–1128. [Google Scholar] [CrossRef]
  67. Preusser, F.; Blei, A.; Graf, H.; Schlüchter, C. Luminescence dating of Würmian (Weichselian) proglacial sediments from Switzerland: Methodological aspects and stratigraphical conclusions. Boreas 2007, 36, 130–142. [Google Scholar] [CrossRef]
  68. Cazzini, F.F.; Amadori, C.; Bosino, A.; Fantoni, R. New seismic evidence of the Messinian paleomorphology beneath Lake Maggiore area (Italy). Ital. J. Geosci. 2020, 139, 195–211. [Google Scholar] [CrossRef]
  69. Bini, A. Geologia del Quaternario e geomorfologia della Piana di Como. In Carta Archeologica della Lombardia; Uboldi, A., Ed.; Museo Civico Archeologico P. Giovio: Como, Italy, 1993; Volume III. [Google Scholar]
  70. Montrasio, A.; Bigioggero, B.; Maino, A.; Cirese, E.; Tacchiao, D. Carta Geologica della Lombardia: Scala, Vol. 1, 250.000; Servizio Geologico Nazionale: Roma, Italy, 1990; Available online: https://www.cartografia.servizirl.it/cargviewer/ (accessed on 1 July 2023).
  71. Bini, A.; Bussolini, C.; Turri, S.; Zuccoli, L. Carta geologica alla scala 1:100.000 dell’anfiteatro morenico del Verbano. Sibrium 2014, 28, 24–81. [Google Scholar]
  72. Piana, F.; Fioraso, G.; Irace, A.; Mosca, P.; D’atri, A.; Barale, L.; Falletti, P.; Monegato, G.; Morelli, M.; Tallone, S.; et al. Geology of Piemonte region (NW Italy, Alps–Apennines interference zone). J. Maps 2017, 13, 395–405. [Google Scholar] [CrossRef]
  73. Castiglioni, B. L’Italia nell’eta quaternaria. Plate No. 3. In Atlante Fisico-Economico d’ Italia; Consociazione Turistica Italiana: Milano, Italy, 1940. [Google Scholar]
  74. Bini, A.; Schlüchter, C.; Burkhalter, R.M.; Urech, M. Die Schweiz Wahrend des Letzteiszeitlichen Maximums (LGM); Bundesamt für Landestopografie Swisstopo: Wabern, Germany, 2009; Available online: https://opendata.swiss/de/perma/f1455593-7571-48b0-8603-307ec59a6702@bundesamt-fur-landestopografie-swisstopo (accessed on 1 July 2023).
  75. Tarquini, S.; Isola, M.I.; Favalli, A.; Battistini, G.; Dotta, M. TINITALY, a Digital Elevation Model of Italy with a 10 Meters Cell Size (Version 1.1); Istituto Nazionale di Geofisica e Vulcanologia (INGV): Roma, Italy, 2023. [Google Scholar] [CrossRef]
  76. Doglioni, C.; Bosellini, A. Eoalpine and mesoalpine tectonics in the Southern Alps. Geol. Rundsch. 1987, 76, 735–754. [Google Scholar] [CrossRef]
  77. Mittempergher, S.; Zanchi, A.; Zanchetta, S.; Fumagalli, M.; Gukov, K.; Bistacchi, A. Fault reactivation and propagation in the northern Adamello pluton: The structure and kinematics of a kilometre-scale seismogenic source. Tectonophysics 2021, 806, 228790. [Google Scholar] [CrossRef]
  78. Massari, F.; Grandesso, P.; Stefani, C.; Jobstraibizer, P.G. A small polyhistory foreland basin evolving in a context of oblique convergence: The Venetian basin (Chattian to Recent, Southern Alps, Italy). In Foreland Basins; Allen, P.A., Homewood, P., Eds.; The International Association of Sedimentogists: London, UK, 1986; pp. 141–168. [Google Scholar] [CrossRef]
  79. Gelati, R.; Napolitano, A.; Valdisturlo, A. La” Gonfolite Lombarda”: Stratigrafia e significato nell’evoluzione del margine sudalpino. Riv. Ital. Paleontol. Stratigr. 1988, 94, 285–332. Available online: https://riviste.unimi.it/index.php/RIPS/article/view/13171 (accessed on 1 July 2023).
  80. Gelati, R.; Napolitano, A.; Valdisturlo, A. Results of studies on the Meso-Cenozoic succession in the Monte Olimpino 2 tunnel. the tectono-sedimentary significance of the “Gonfolite lombarda”. Riv. Ital. Paleontol. Stratigr. 1991, 97, 565–598. [Google Scholar] [CrossRef]
  81. Stefani, C.; Fellin, M.G.; Zattin, M.; Zuffa, G.G.; Dalmonte, C.; Mancin, N.; Zanferrari, A. Provenance and paleogeographic evolution in a multi-source foreland: The Cenozoic Venetian–Friulian Basin (NE Italy). J. Sediment. Res. 2007, 77, 867–887. [Google Scholar] [CrossRef]
  82. Zanchi, A.; Bini, A.F.; Felber, M.R.; Rigamonti, I.; Uggeri, A. Neotectonic evidences along the lombardian foothills of the Southern Alps. Geol. Insubrica 1997, 2, 99–112. [Google Scholar]
  83. Arca, S.; Beretta, G.P. Prima sintesi geodetico-geologica sui movimenti verticali del suolo nell’Italia settentrionale (1897–1957). Boll. Geod. Sci. Affini 1985, 44, 125–156. [Google Scholar]
  84. Sileo, G.; Giardina, F.; Livio, F.; Michetti, A.M.; Mueller, K.; Vittori, E. Remarks on the Quaternary tectonics of the Insubria Region (Lombardia, NW Italy, and Ticino, SE Switzerland). Boll. Soc. Geol. Ital. 2007, 126, 411. [Google Scholar]
  85. Fantoni, R.; Franciosi, R. Tectono-sedimentary setting of the Po Plain and Adriatic foreland. Rend. Lincei 2010, 21, 197–209. [Google Scholar] [CrossRef]
  86. Fantoni, R.; Bello, M. Evoluzione cenozoica del settore occidentale dell’avampaese padano tra Alpi ed Appennini. In 81 Riunione Estiva della Società Geologica Italiana; Cinmatiche collisionali: Tra esumazione e sedimentazione; Riassunti: Torino, Italy, 2002; pp. 146–147. [Google Scholar]
  87. Bello, M.; Fantoni, R. Deep oil plays in Po Valley: Deformation and hydrocarbon generation in a deformed foreland. In Deformation History, Fluid Flow Reconstruction and Reservoir Appraisal in Foreland Fold and Thrust Belts; American Association of Petroleum Geologists: Hedberg Germany, 2002; Available online: https://www.searchanddiscovery.com/pdfz/documents/2003/bello/images/bello.pdf.html (accessed on 1 July 2023).
  88. DISS Working Group. Database of Individual Seismogenic Sources (DISS). Version 3.3.0: A Compilation of Potential Sources for Earthquakes Larger than M 5.5 in Italy and Surrounding Areas; Istituto Nazionale di Geofisica e Vulcanologia (INGV): Rome, Italy, 2021. [Google Scholar] [CrossRef]
  89. Rovida, A.; Locati, M.; Camassi, R.; Lolli, B.; Gasperini, P.; Antonucci, A. Catalogo Parametrico dei Terremoti Italiani (CPTI15), Versione 4.0; Istituto Nazionale di Geofisica e Vulcanologia (INGV): Rome, Italy, 2022. [Google Scholar] [CrossRef]
  90. ITHACA Working Group. ITHACA (ITaly HAzard from CApable Faulting). A Database of Active Capable Faults of the Italian Territory. 2019. Available online: https://diss.ingv.it/ithdiss/ (accessed on 15 August 2023).
  91. Panara, Y.; Menegoni, N.; Carboni, F.; Inama, R. 3D digital outcrop model-based analysis of fracture network along the seismogenic Mt. Vettore Fault System (Central Italy): The importance of inherited fractures. J. Struct. Geol. 2022, 161, 104654. [Google Scholar] [CrossRef]
  92. Panara, Y.; Khanna, P.; Chandra, V.; Finkbeiner, T.; Vahrenkamp, V. 3D Digital Outcrop Model-Based Fracture Network Analysis of Reservoir Outcrop Analogue, Upper Jubaila Formation, Saudi Arabia. 83rd EAGE Annu. Conf. Exhib. 2022, 2022, 1–5. [Google Scholar] [CrossRef]
  93. Menegoni, N.; Inama, R.; Crozi, M.; Perotti, C. Early deformation structures connected to the progradation of a carbonate platform: The case of the Nuvolau Cassian platform (Dolomites-Italy). Mar. Pet. Geol. 2022, 138, 105574. [Google Scholar] [CrossRef]
  94. Menegoni, N.; Inama, R.; Panara, Y.; Crozi, M.; Perotti, C. Relations between Fault and Fracture Network Affecting the Lastoni di Formin Carbonate Platform (Italian Dolomites) and Its Deformation History. Geosciences 2022, 12, 451. [Google Scholar] [CrossRef]
  95. Fedorik, J.; Delaunay, A.; Losi, G.; Panara, Y.; Menegoni, N.; Afifi, A.M.; Arkadakskiy, S.; Al Malallah, M.; Oelkers, E.; Gislason, S.R.; et al. Structure and fracture characterization of the Jizan group: Implications for subsurface CO2 basalt mineralization. Front. Earth Sci. 2023, 10, 946532. [Google Scholar] [CrossRef]
  96. Thiele, S.T.; Grose, L.; Samsu, A.; Micklethwaite, S.; Vollgger, S.A.; Cruden, A.R. Rapid, semi-automatic fracture and contact mapping for point clouds, images and geophysical data. Solid Earth 2017, 8, 1241–1253. [Google Scholar] [CrossRef]
  97. Gambari, F.M.; Valle, G.; Vercesi, P.L. Elementi geoarcheologici e proposta intepretativa dell’evoluzione territoriale in età golassecchiana nella zona di Castelletto Ticino. Sibrium 1995, 22, 163–177. [Google Scholar]
  98. Gambari, F.M. Gli abitati della prima età del Ferro nell’area del Basso Verbano e dell’Ovest Ticino. In I Leponti tra Mito e Realtà (Catalogo Della Mostra); De Marinis, R.C., Biaggio Simona, S., Eds.; Dado editore: Locarno, Switzerland, 2000; pp. 195–202. [Google Scholar]
  99. Gambari, F.M. Le dinamiche territoriali nella Preistoria e Protostoria del Novarese. In Tra Terra e Acque. Carta Archeologica della Provincia di Novara; Spagnolo Garzoli, G., Gambari, F.M., Eds.; AGES Arti Grafiche: Torino, Italy, 2004; pp. 43–57. [Google Scholar]
  100. De Marinis, R.C. Il periodo Golasecca III A in Lombardia. Studi Archeol. 1981, 43, 75–96. [Google Scholar]
  101. Ruffa, M. L’abitato golasecchiano di Cascina Riviera a Castelletto Ticino. In Quaderni della Soprintendenza per i Beni Archeologici del Piemonte; Soprintendenza Archeologia del Piemonte: Torino, Italy, 2001; Volume 18, pp. 13–28. [Google Scholar]
  102. Tziavou, O.; Pytharouli, S.; Souter, J. Unmanned Aerial Vehicle (UAV) based mapping in engineering geological surveys: Considerations for optimum results. Eng. Geol. 2018, 232, 12–21. [Google Scholar] [CrossRef]
  103. Ramsey, C. Bayesian Analysis of Radiocarbon Dates. Radiocarbon 2009, 51, 337–360. [Google Scholar] [CrossRef]
  104. Ramsey, C.; Lee, S. Recent and Planned Developments of the Program OxCal. Radiocarbon 2013, 55, 720–730. [Google Scholar] [CrossRef]
  105. Ramsey, C. Methods for Summarizing Radiocarbon Datasets. Radiocarbon 2017, 59, 1809–1833. [Google Scholar] [CrossRef]
  106. Reimer, P.; Austin, W.; Bard, E.; Bayliss, A.; Blackwell, P.; Bronk Ramsey, C.; Butzin, M.; Cheng, H.; Edwards, R.L.; Friedrich, M.; et al. The IntCal20 Northern Hemisphere Radiocarbon Age Calibration Curve (0–55 cal kBP). Radiocarbon 2020, 62, 725–757. [Google Scholar] [CrossRef]
  107. Heaton, T.; Blaauw, M.; Blackwell, P.; Bronk Ramsey, C.; Reimer, P.; Scott, E. The IntCal20 Approach to Radiocarbon Calibration Curve Construction: A New Methodology Using Bayesian Splines and Errors-in-Variables. Radiocarbon 2020, 62, 821–863. [Google Scholar] [CrossRef]
  108. Rutten, M.G. Ice-pushed ridges, permafrost and drainage. Am. J. Sci. 1960, 258, 293–297. [Google Scholar] [CrossRef]
  109. Van der Wateren, F.M. A model of glacial tectonics, applied to the ice-pushed ridges in the Central Netherlands. Bull. Geol. Soc. 1985, 34, 55–74. [Google Scholar] [CrossRef]
  110. Astakhov, V.I.; Kaplyanskaya, F.A.; Tarnogradsky, V.D. Pleistocene permafrost of West Siberia as a deformable glacier bed. Permafr. Periglac. Process. 1996, 7, 165–191. [Google Scholar] [CrossRef]
  111. Boulton, G.S. The origin of till sequences by subglacial sediment deformation beneath mid-latitude ice sheets. Ann. Glaciol. 1996, 22, 75–84. [Google Scholar] [CrossRef]
  112. Etzelmüller, B.; Hagen, J.O.; Vatne, G.; Ødegård, R.S.; Sollid, J.L. Glacier debris accumulation and sediment deformation influenced by permafrost: Examples from Svalbard. Ann. Glaciol. 1996, 22, 53–62. [Google Scholar] [CrossRef]
  113. Boulton, G.S.; Van der Meer, J.J.M.; Beets, D.J.; Hart, J.K.; Ruegg, G.H.J. The sedimentary and structural evolution of a recent push moraine complex: Holmstrømbreen, Spitsbergen. Quat. Sci. Rev. 1999, 18, 339–371. [Google Scholar] [CrossRef]
  114. Hiemstra, J.F.; Evans, D.J.; Cofaigh, C.Ó. The role of glacitectonic rafting and comminution in the production of subglacial tills: Examples from southwest Ireland and Antarctica. Boreas 2007, 36, 386–399. [Google Scholar] [CrossRef]
  115. Huuse, M.; Lykke-Andersen, H. Large-scale glaciotectonic thrust structures in the eastern Danish North Sea. Geol. Soc. Lond. Spec. Publ. 2000, 176, 293–305. [Google Scholar] [CrossRef]
  116. Lee, J.R.; Phillips, E.R. Progressive soft sediment deformation within a subglacial shear zone—A hybrid mosaic–pervasive deformation model for Middle Pleistocene glaciotectonised sediments from eastern England. Quat. Sci. Rev. 2008, 27, 1350–1362. [Google Scholar] [CrossRef]
  117. Waller, R.; Murton, J.; Whiteman, C. Geological evidence for subglacial deformation of Pleistocene permafrost. Proc. Geol. Assoc. 2009, 120, 155–162. [Google Scholar] [CrossRef]
  118. Waller, R.; Phillips, E.; Murton, J.; Lee, J.; Whiteman, C. Sand intraclasts as evidence of subglacial deformation of Middle Pleistocene permafrost, North Norfolk, UK. Quat. Sci. Rev. 2011, 30, 3481–3500. [Google Scholar] [CrossRef]
  119. Szuman, I.; Ewertowski, M.; Kasprzak, L. Thermo-mechanical facies representative of fast and slow flowing ice sheets: The Weichselian ice sheet, a central west Poland case study. Proc. Geol. Assoc. 2013, 124, 818–833. [Google Scholar] [CrossRef]
  120. Aber, J.S. Model for glaciotectonism. Bull. Geol. Soc. Den. 1982, 30, 79–90. [Google Scholar] [CrossRef]
  121. Brandes, C.; Le Heron, D.P. The glaciotectonic deformation of Quaternary sediments by fault-propagation folding. Proc. Geol. Assoc. 2010, 121, 270–280. [Google Scholar] [CrossRef]
  122. Cotterill, C.; Phillips, E.; James, L.; Forsberg, C.F.; Tjelta, T.I. How understanding past landscapes might inform present-day site investigations: A case study from Dogger Bank, southern central North Sea. Near Surf. Geophys. 2017, 15, 403–414. [Google Scholar] [CrossRef]
  123. Vaughan-Hirsch, D.P.; Phillips, E.R. Mid-Pleistocene thin-skinned glaciotectonic thrusting of the Aberdeen Ground Formation, Central Graben region, central North Sea. J. Quat. Sci. 2017, 32, 196–212. [Google Scholar] [CrossRef]
  124. Bennett, M.R. The morphology, structural evolution and significance of push moraines. Earth-Sci. Rev. 2001, 53, 197–236. [Google Scholar] [CrossRef]
  125. Kalin, M. The Active Push Moraine of the Thompson Glacier, Axel Heiberg Island, Canadian Arctic Archipelago, Canada. Ph.D. Thesis, Swiss Federal Institute of Technology, Zurich, Switzerland, McGill University, Montreal, QC, Canada, 1971. [Google Scholar] [CrossRef]
  126. Murton, J.B.; Kolstrup, E. Ice-wedge casts as indicators of palaeotemperatures: Precise proxy or wishful thinking? Prog. Phys. Geogr. 2003, 27, 155–170. [Google Scholar] [CrossRef]
  127. Scapozza, C.; Giacomazzi, D.; Czerski, D.; Kamleitner, S.; Ivy-Ochs, S.; Mazzaglia, D.; Patocchi, N.; Antognini, M. Timing of deglaciation and Late Glacial and Holocene infilling of the Ticino valley between Biasca and Lago Maggiore (Southern Switzerland). In Proceedings of the 10th International Conference on Geomorphology, Coimbra, Portugal, 12–16 September 2022. ICG2022-118. [Google Scholar] [CrossRef]
  128. Allen, J.R.L. Sedimentary Structures: Their Character and Physical Basis; Elsevier: Amsterdam, The Netherland, 1982; Volume II, ISBN 9780080869445. [Google Scholar]
  129. Owen, G. Load structures: Gravity-driven sediment mobilization in the shallow subsurface. Geol. Soc. Lond. Spec. Publ. 2003, 216, 21–34. [Google Scholar] [CrossRef]
  130. Ekwenye, O.; Mode, A.; Oha, I.; Onah, F. Soft-Sediment Deformation in the Campanian-Maastrichtian Deltaic Deposits of the Afikpo Sub-basin, South-eastern Nigeria: Recognition of Endogenic Trigger. Jordan J. Earth Environ. Sci. 2020, 11, 1–11. Available online: http://jjees.hu.edu.jo/files/Vol11No1/JJEES_Vol_11_No_1_P1.pdf (accessed on 1 July 2023).
  131. Bann, K.L.; Fielding, C.R. An integrated ichnological and sedimentological comparison of non-deltaic shoreface and subaqueous delta deposits in Permian reservoir units of Australia. Geol. Soc. Lond. Spec. Publ. 2004, 228, 273–310. [Google Scholar] [CrossRef]
  132. Montone, P.; Mariucci, M.T.; Pierdominici, S. The Italian present-day stress map. Geophys. J. Int. 2012, 189, 705–716. [Google Scholar] [CrossRef]
  133. Montone, P.; Mariucci, M.T.; Pondrelli, S.; Amato, A. An improved stress map for Italy and surrounding regions (central Mediterranean). J. Geophys. Res. Solid Earth 2004, 109, B10. [Google Scholar] [CrossRef]
  134. Montone, P.; Mariucci, M.T. The new release of the Italian contemporary stress map. Geophys. J. Int. 2016, 205, 1525–1531. [Google Scholar] [CrossRef]
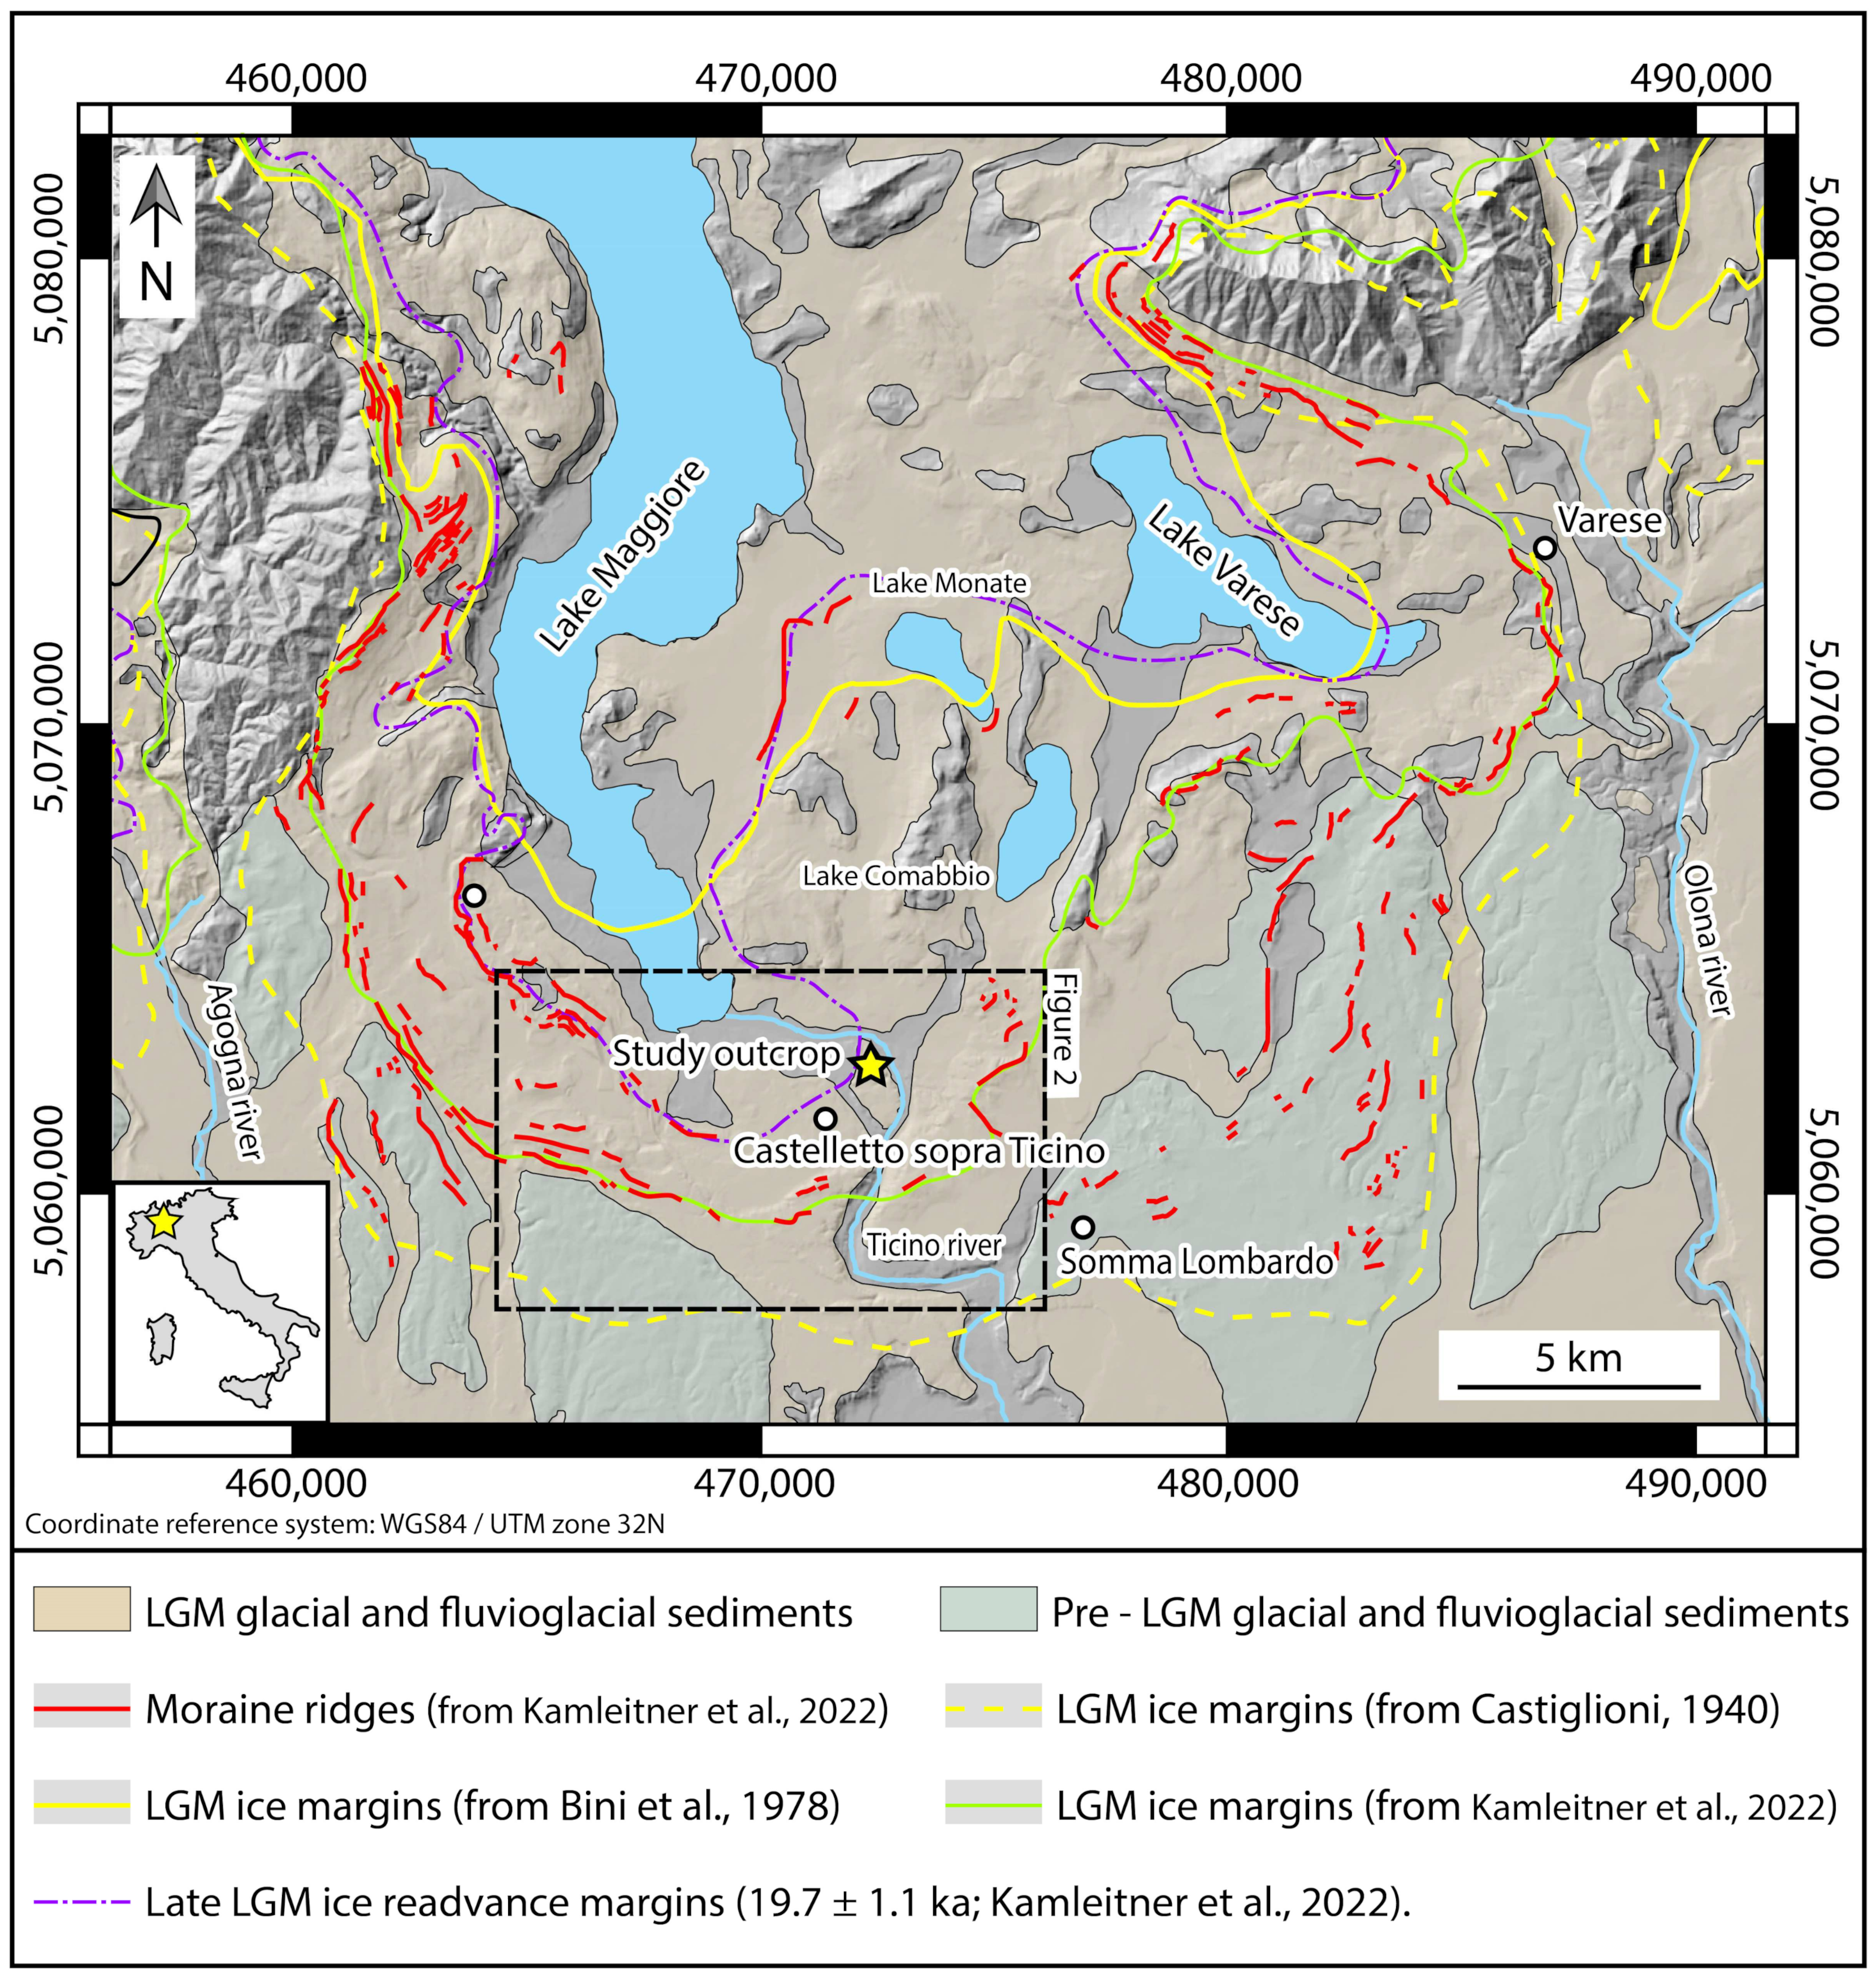
Figure 1. Map showing the distribution of pre-LGM and LGM glaciofluvial and glacial sediments where the moraine ridges mapped by Kamleitner et al. [64] are marked with red lines (modified from Kamleitner et al. [64]). The LGM ice margins proposed by Castiglioni et al. [73], Bini et al. [74], and Kamleitner et al. [64] are marked with the yellow dashed, yellow continuous, and green lines, respectively. The late LGM ice readvance limits proposed by Kamleitner et al. [64] are marked with the purple dashed line.
Geosciences 13 00286 g001
Figure 2. Hillshading of the study area derived using the TINITALY digital elevation model [75] where the principal morainic ridges are identified.
Geosciences 13 00286 g002
Figure 3. (a) Structural map of northern Lombardy Po Plain boundary of the Southern Alps (modified from [87]). (b) Simplified geological section showing the main structures of the Po Plain subsurface.
Geosciences 13 00286 g003
Figure 4. Hillshade of the TINITALY digital elevation model [75] showing composite seismogenic sources, capable faults (CSS connected and not) and historical earthquakes reported by the Database of Individual Seismogenic Sources (DISS [88]), Italy Hazard from Capable faults (ITHACA [90]), and Parametric Catalogue of Italian Earthquakes (CPTI [89]). The historical earthquakes are numbered according their occurrence, coherently with the numbers reported in Table 1.
Geosciences 13 00286 g004
Figure 5. (a) Northeast–oblique, (b) top, and (c) southwest–oblique views of the photogrammetric digital outcrop model representing the studied trench in June 2022. Since the terrain outside the trench was not surveyed, the oblique views show a box-like representation of the trench.
Geosciences 13 00286 g005
Figure 6. (a) Frontal and orthographic view of the east wall of the trench, where load cast structures are visible. Details of (b) pendulous and (c) simple load casts structures (sensu [5]). Yellow arrows indicate a horizon particularly rich in archeological remnants (ceramics and pottery).
Geosciences 13 00286 g006
Figure 7. Aerial orthographic views of the trench plunging (a) NE and (b) SW. The main bedding surfaces and faults are marked with the green and red lines, respectively, and their orientations are shown in the stereoplots. The pink dashed lines mark the unconformity surface, and the black dotted lines mark the wall section limits.
Geosciences 13 00286 g007
Figure 8. Orthographic and frontal view of the west wall of the trench (section A′′-B′′′) where the red and green lines and the pink dashed line represent the faults, bedding, and unconformity, respectively. This section shows that, as we move toward the SW corner of the trench (section limit A″), the bedding becomes less defined and irregular, showing some slumping structures. Moreover, it is possible to see that, in the northern part of the section, the morphology of the unconformity surface is influenced by the presence of two faults (that are cut by the unconformity). See Figure 5a for the section position.
Geosciences 13 00286 g008
Figure 9. Orthographic and frontal views of the south wall; the red and green lines and the pink dashed lines represent the faults, bedding, and unconformity, respectively. (a) The section A-A′ shows that the fault cuts and displaces the slumping structures with apparent inverse offset beds. (b) The section A′-A″ shows that, as you move toward the SW corner of the trench, the slumping structures become more complex. In both sections, the horizon above the unconformity was removed for a better representation. See Figure 5b and Figure 7b for the section positions. (c) Details of faults cutting the slumping structures and location of the sample dated via 14C radiocarbon.
Geosciences 13 00286 g009
Figure 10. Details of some of the faults outcropping at the (a) east and (b,c) north walls of the trench.
Geosciences 13 00286 g010
Figure 11. Conventional and calibrated 14C dating results of the organic-rich sediments, collected 25 June 2022. Data converted with OxCal v 4.4.4 (software available at https://c14.arch.ox.ac.uk/oxcalhelp/readme.html#local, accessed on 1 December 2022; atmospheric data from [106]).
Geosciences 13 00286 g011
Figure 12. Conceptual sketch of the timing of the (b,c) tectonic-related deformative events, from (a) the lacustrine sediments deposition (8760–8550 BC) to (d) their erosion and the deposition of the alluvial Golasecca II and III anthropized horizon (VI–V century BC).
Geosciences 13 00286 g012
Table 1. Historical earthquakes reported in the Parametric Catalogue of Italian Earthquakes (CPTI [89]) in the area shown in Figure 1 and Figure 2. The numbers correspond to the historical earthquakes marked in Figure 2.
#YearMonthDayEpicentral AreaMwDefMaximum Intensity
113041218Lombardy plain4.45–6
213961126Monza5.337–8
3147357Milanese3.75
41606822Bergamo4.866–7
51642613Lombardy plain4.926–7
61771815Lombardy plain4.165
71781910Lombardy plain4.936–7
8178647Lombardy plain5.227–8
91887520Lecchese3.975
101918113Lombardy plain4.624–5
111918424Lecchese4.956
1219611123Bergamasc Pre-Alps4.866
13197929Bergamasco4.786
Table 2. Fault set statistics.
Set NameFault NumberMean Orientation
(Dip Direction and Dip)
K-Fisher CoefficientApparent Offset
F16346° N/36°34.8Inverse
F24129° N/2835.9Inverse
F32238° N/33°15.6Inverse
Disclaimer/Publisher’s Note: The statements, opinions and data contained in all publications are solely those of the individual author(s) and contributor(s) and not of MDPI and/or the editor(s). MDPI and/or the editor(s) disclaim responsibility for any injury to people or property resulting from any ideas, methods, instructions or products referred to in the content.