1. Introduction: How Can We Possibly Measure National Happiness? What Is the Relevance for Geoscientists?
The focus of this paper is an examination of the holistic impact of minerals, mining, and hydrocarbons on countries and societies through the lens of the Gross National Happiness paradigm. The socio-economic and general wellbeing (or otherwise) impacts of extractive industries are an increasingly important global issue. If countries cannot see clear, tangible, real, and lasting benefits for themselves and their people from extractive industries, they are likely to become increasingly resistant to natural resource development and the exploration and geoscience that underpins the mining and oil/gas industries. The geoscientist plays a critical role in the development of extractive industries through exploration, data interpretation, and resource assessment, and then downstream as production geologists and related professionals. Geoscientists are not an island unto themselves. They are part of the holistic ecosystem of extractive industries and society and are a part of the translation of extractive industry-generated wealth into socio-economics and general wellbeing. Pan-disciplinary approaches to complex challenges are increasingly becoming more common, with the so-called ‘specialist’ or ‘single-discipline expert’ becoming increasingly drawn into a wide range of issues that surround extractive industries. These issues include exploration, pre-mining baseline surveys, complex negotiations with traditional landowners, education and awareness raising, discussions between geoscientists, industrialists, and community, and managing large, complex industrial units within a community. It is in this spirit that this paper is drafted: to raise awareness and encourage geoscientists, among other extractive industry stakeholders, to become increasingly aware of, and participative within, the wider socio-economic and wellbeing aspects of the extractive industry ecosystem.
The concept of happiness has numerous connotations. In general language, the use of the word happiness mostly resonates with dictionary definitions, such as ‘
the quality or condition of being happy, the state of pleasurable contentment of mind; deep pleasure in or contentment with one’s circumstances’ from the Oxford English Dictionary [
1], ‘
Happiness is a sense of wellbeing, joy, or contentment. When people are successful, or safe, or lucky, they feel happiness’ from Vocabulary.com [
2], or ‘
the quality or state of being happy, associated with good fortune, pleasure, contentment, joy’ from the Collins Dictionary [
3]. These definitions attempt to define emotional and metaphysical states of being that are beyond language. Language can only ever capture an approximation of the actual sensation/state of consciousness or being. The definitions above are also culturally loaded with roots in western Judeo-Christian–Roman–Greek philosophy. Definitions of happiness based on Indian philosophy (e.g., Vedantic, Hindu, Buddhist, Jain) are quite different to western definitions and discuss levels and continuity of happiness and contentment, with ultimate happiness detached from human conditionality, attained only through strenuous, continuous, and mindful effort, ultimately approaching elevated levels of human enlightenment. A typical definition from this worldview is represented by the following quotation: ‘
The highest level of happiness is a deep contentedness and peace beyond all changing circumstance. Through insight and wisdom, the obstacles to happiness can be uprooted from the mind rather than just temporarily suspended. This is the most reliable kind of happiness, wellbeing, and ease: unshakeable and deeply rooted beyond all conditions, an awakening that brings peace even among the vicissitudes of life’ [
4]. Grieves [
5] documented Sydney-based Indigenous Australian views of happiness as ‘
a state of being that includes knowledge, calmness, acceptance and tolerance, balance and focus, inner strength, cleansing and inner peace, feeling whole, an understanding of cultural roots and deep wellbeing’. It is clear from these three different worldview definitions of happiness that there is a range of definitions and understanding of the concept, although there is a universal sense of happiness being a positive state of mind and existence: something worth striving for and attaining. All worldviews would agree that humans prefer to be in a state of happiness rather than its opposite state of being (misery, sadness, depression, dissatisfaction, frustration).
Measuring the relative happiness of an individual is one thing, but doing the same for a group of people, a tribe, city, region, country, or continent is something quite different. Economists traditionally preferred to stay clear of areas such as ‘happiness’, which they considered less tangible or measurable, preferring instead to measure, discuss, and compare their defined economic state of economies from local to national to global levels, with concepts such as Gross Domestic Product (GDP), GDP/capita, levels of employment, salaries and salary distributions within a population, and so forth. These parameters can be measured with significant degrees of accuracy, and the veracity of data can be interrogated. Numbers and ratios can be produced that give indicators of economic development or state and are used as comparators between regions, states, countries, and continents. These types of indicators are useful for economic and social analyses, particularly when their limitations are well understood.
It was from a small Himalayan country in South Asia that a revolution in thinking was announced with respect to analyses of the human and socio-economic condition, from individual to national to global. Jigme Singye Wangchuk, the King of Bhutan, first suggested the concept of ‘Gross National Happiness’ (GNH) in 1972. Bhutan developed the concept into a series of verifiable and quantifiable measurable indicators that focused on psychological wellbeing, health, education, time use, cultural diversity and resilience, good governance, community vitality, ecology, and living standards (OPHI) [
6]. The concept of measuring a wider set of indicators to assess the state of development of a country/region/section of a specific demographic more accurately was adopted at the United Nations on 19 July 2011, UN Resolution 65/309: ‘happiness: towards a holistic approach to development’, sponsored by the Kingdom of Bhutan,
www.worldhappiness.report (accessed on 05 June 2022) [
7]. There are now 33 to >90 individual indicators used to measure GNH (OPHI) [
6]. A widely used derivative of GNH is the annual global World Happiness Report [
7]. A series of approaches, including the Human Development Index (HDI), the Gini Coefficient (GC), and the now annual World Happiness Report (WHR), are all responses to, and developments of, the 1972 GNH. HDI, GC, and WHR are attempts to go beyond the narrow confines of Gross Domestic Product and similar economic proxies. They examine the economic as well as the social, environmental, spiritual, and holistic health aspects of society, with the Gini Index focusing on economic and social inequality data, and the Human Development Index aiming to position countries/regions within a relative league table from the most to least developed (their definition of ‘developed’) according to the variations in their development parameters.
The broad conclusions of the plethora of metrics are that, given a basic standard of economic wellbeing as a foundation, ‘happiness’ links to conditionalities and concepts such as equity, good governance, minimal inequality, trust between the rulers/powerful and the ruled/less powerful, human rights, individual freedom, societal tolerance of diversity, social welfare support systems, transparent and fair taxation systems, a lack of corruption and ‘over-enrichment’ at the top end of society, power balance and delegation, and feelings of personal value within wider society (‘my voice matters and is heard’). The list can be extended to more sophisticated analytics, but the preceding list gives a strong idea of the types of analyses the World Happiness Report and other similar toolkits focus on.
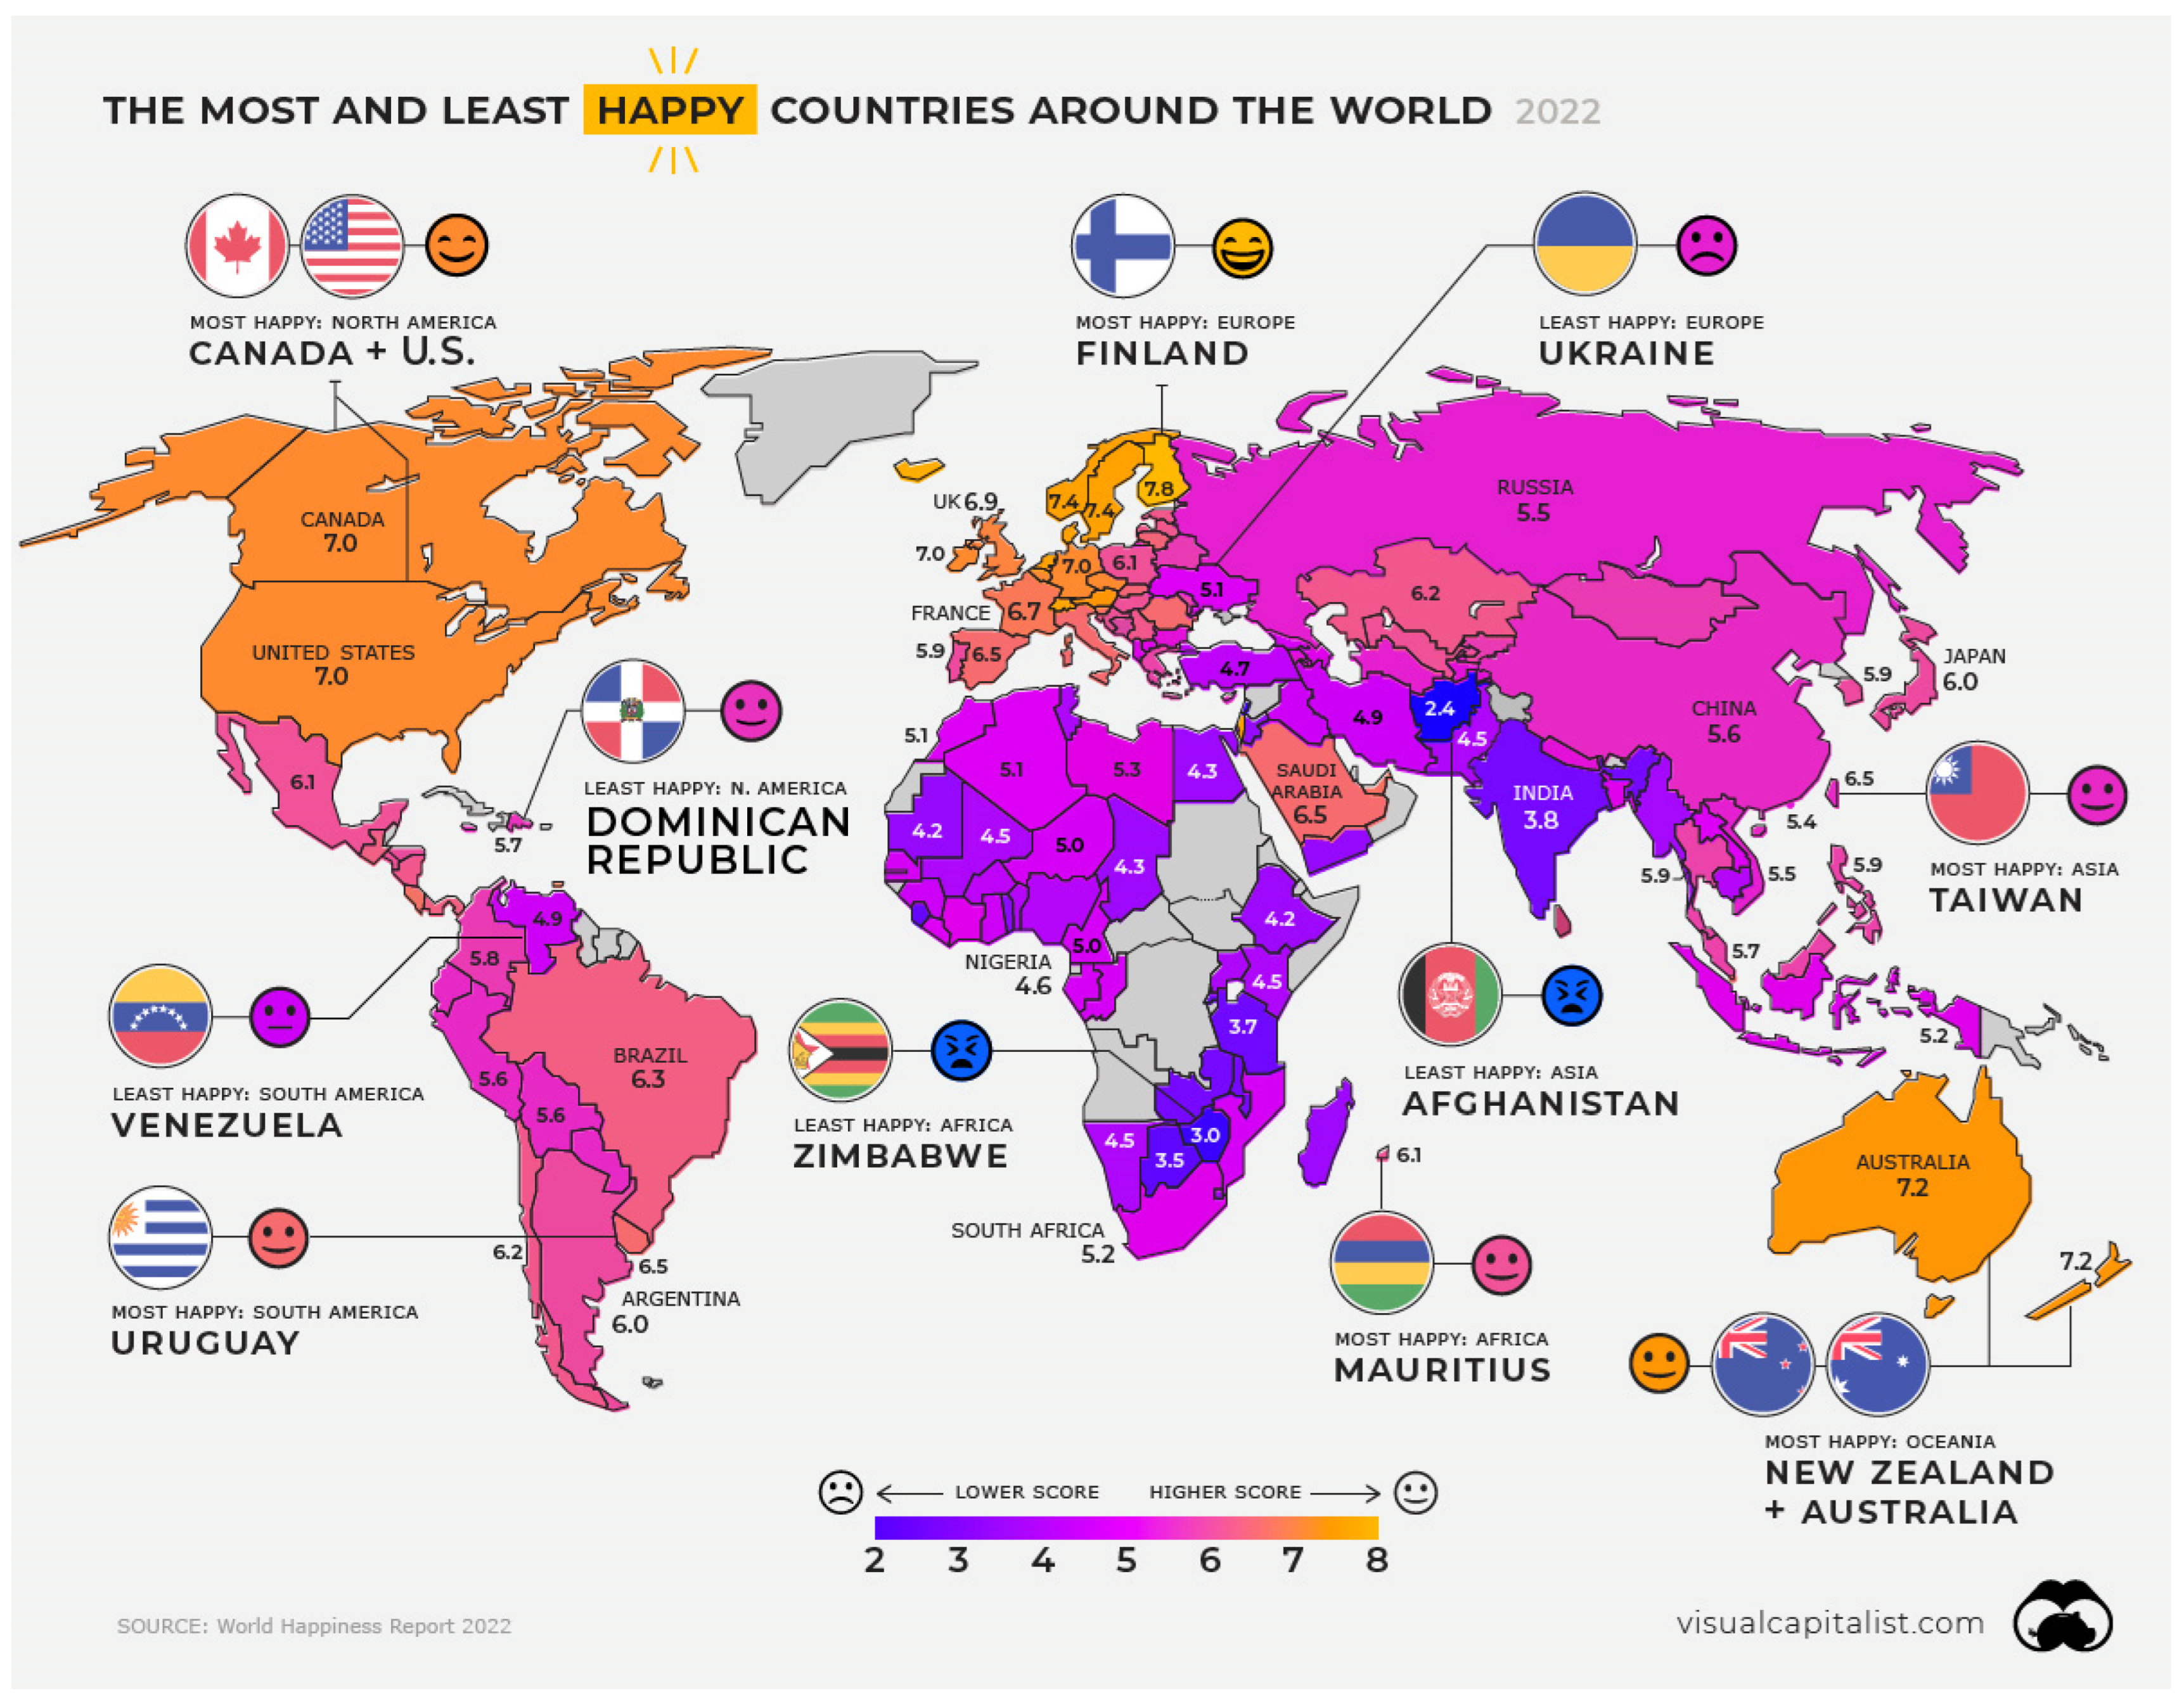
Figure 1 presents a summary of the relative happiness levels of c. 130 nations, presented as a world map. The presented happiness scale is between 2 and 8, with 8 representing the happiest and 2 the least happy countries. The actual scale is 0 to 10 but data are between 2 and 8. These numbers are calculated using the Cantril Ladder methodology: around 100,000 people in 130 countries are asked by the company Gallup to assess where their personal happiness is on the Cantril ladder (0 to 10) through questionnaires/surveys that focus on: economic wellbeing, life expectancy, generosity, social support, freedom, and corruption. Comparisons for each country are carried out with a theoretical unhappy country named ‘Dystopia’, which has the lowest values for all parameters in the global survey. See [
8] for further details.
Figure 1 shows that the happiest country is Finland, and the least happy country is Afghanistan. Countries with scores above 6.5 include most of Western Europe, North America, Saudi Arabia, Singapore and Taiwan, and Australasia. Countries/regions with scores of 4.5 to 6.5 include South and Central American countries, North African and Middle Eastern countries, Russia and Eastern Europe, China, Japan, Malaysia, and SE Asia, including Thailand and Indonesia. The least happy countries/regions with scores between 4.5 and 2.4 include most of sub-Saharan Africa, India, Pakistan, and Afghanistan.
2. Global Trends and Correlations between Mineral and Oil Commodity Relative Wealth and Dependency
The geoscientist should increasingly become aware of the relationship between
Figure 1 and
Figure 2 and note how mineral-dependent, low-income countries struggle to obtain high happiness scores.
Figure 2 presents a global map of the Mineral Contribution Index (MCI) by country [
9]. The methodology for calculating the MCI for each country is based on four factors: mineral and metal exports, a ratio related to a five-year variation in mineral and metal exports (increase or decrease), contribution to the total national Gross Domestic Product (GDP), as a percentage of the GDP, and the costs of mineral tenement rents as a percentage of the GDP.
Figure 2 is largely based on 2018 data. Countries/regions with the highest Mineral Contribution Index (above 80) include Suriname, Peru, Bolivia, Mongolia, and numerous countries in sub-Saharan Africa. Those with MCI > 80 but <60 include Canada, Brazil, Chile, Colombia, Canada, Australia, Papua New Guinea, Indonesia, Myanmar, Russia, Kazakhstan, South Africa, and Egypt. Countries with the lowest MCI include the UK, France, Germany, Libya, United Arab Emirates, and Japan.
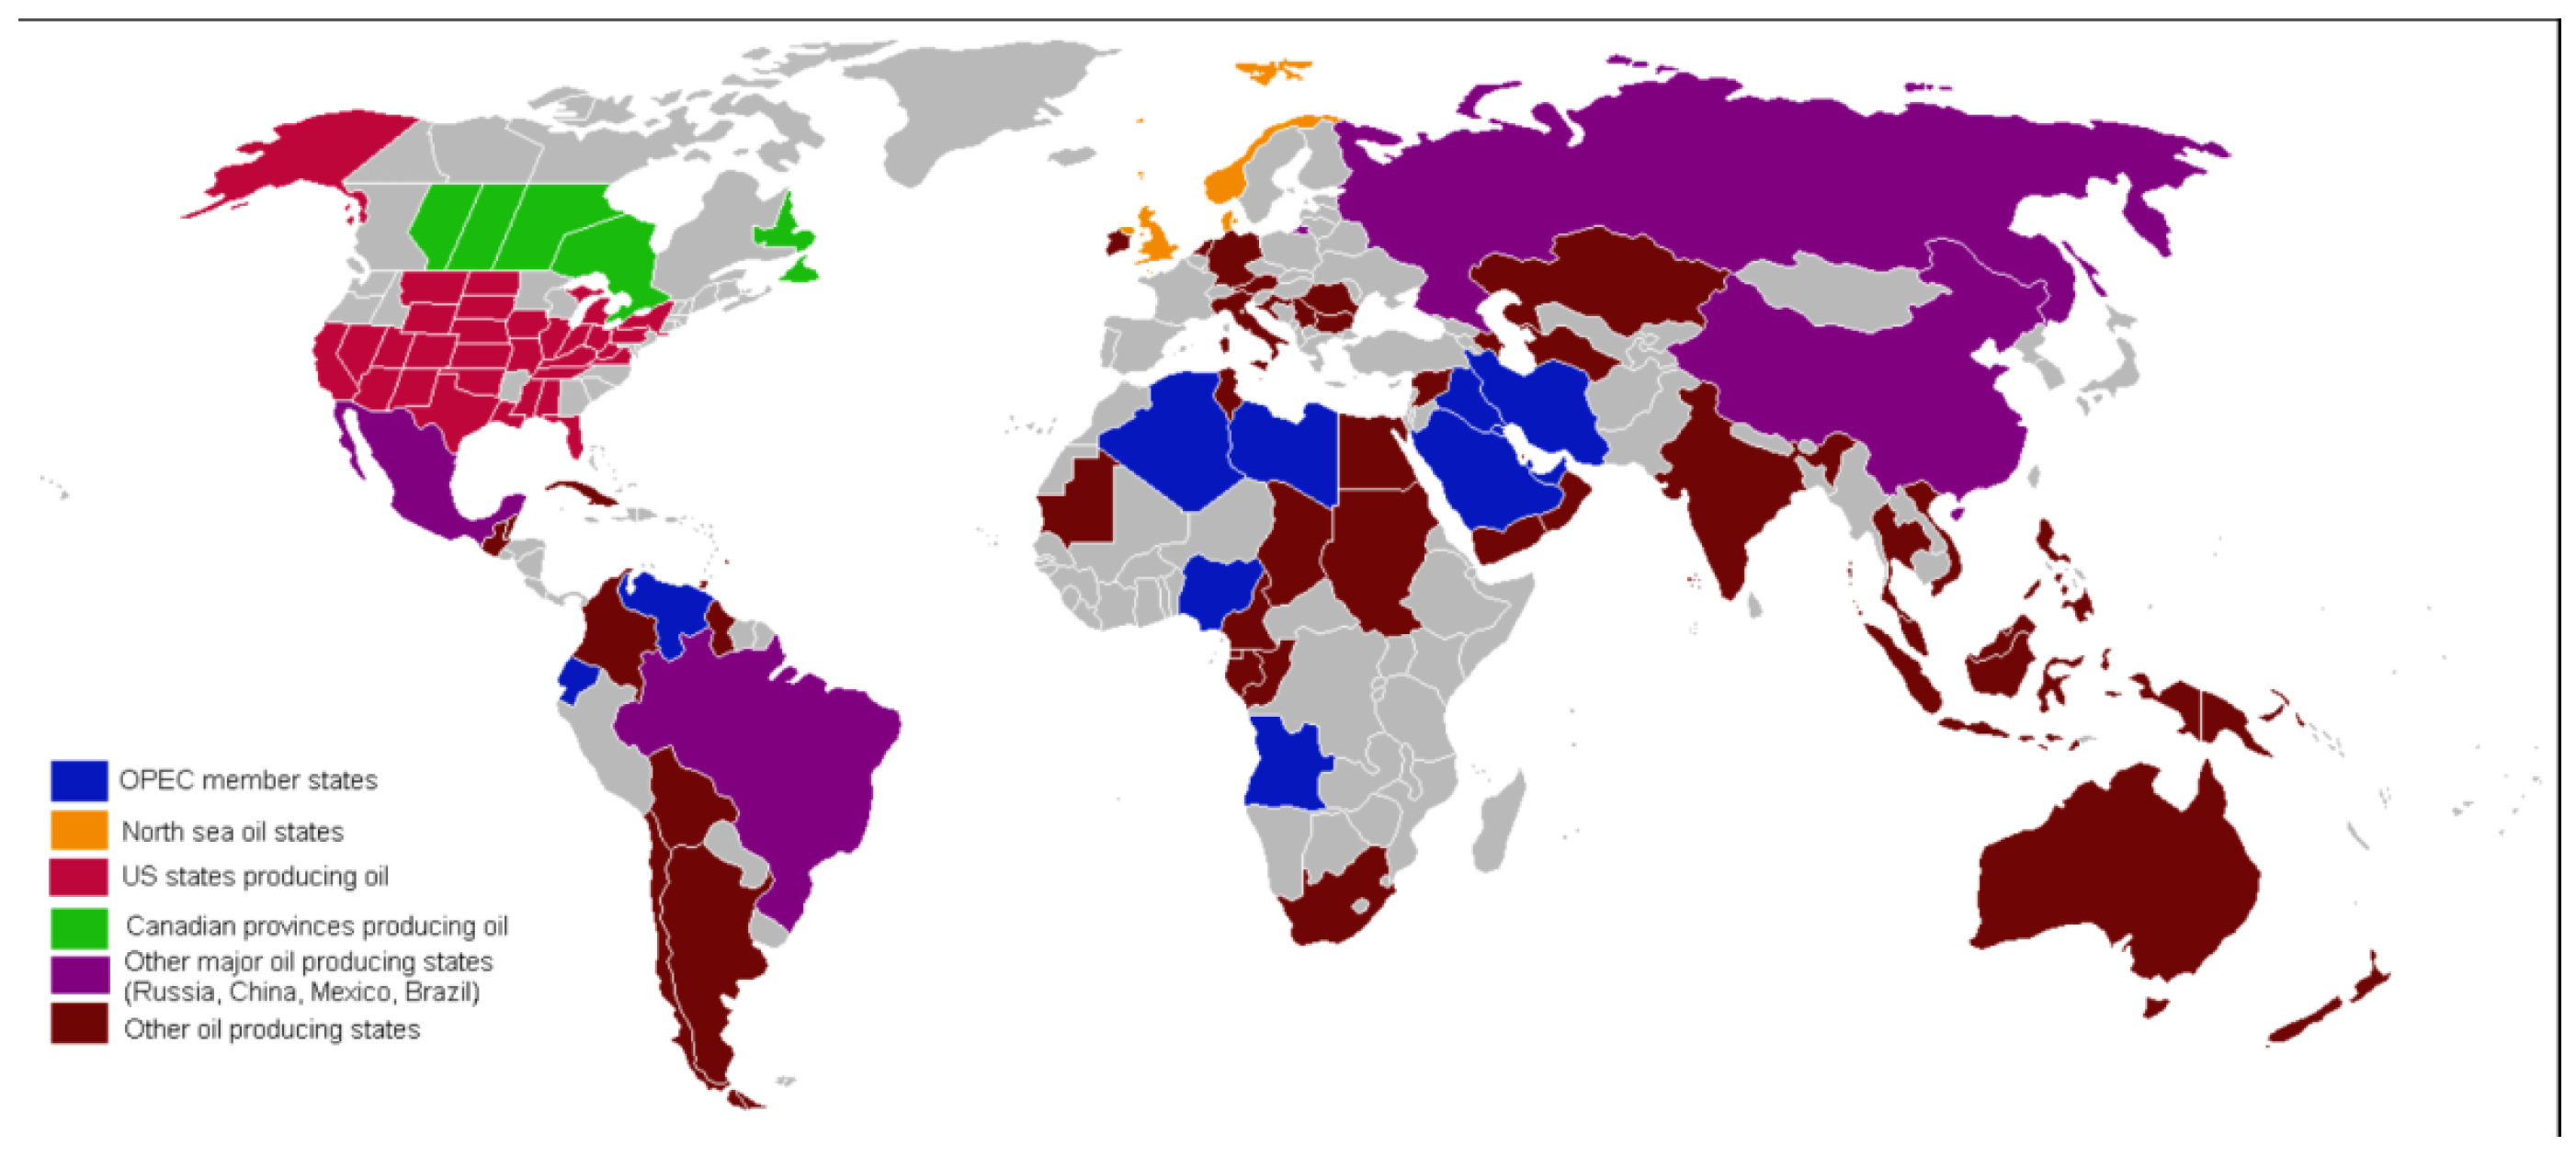
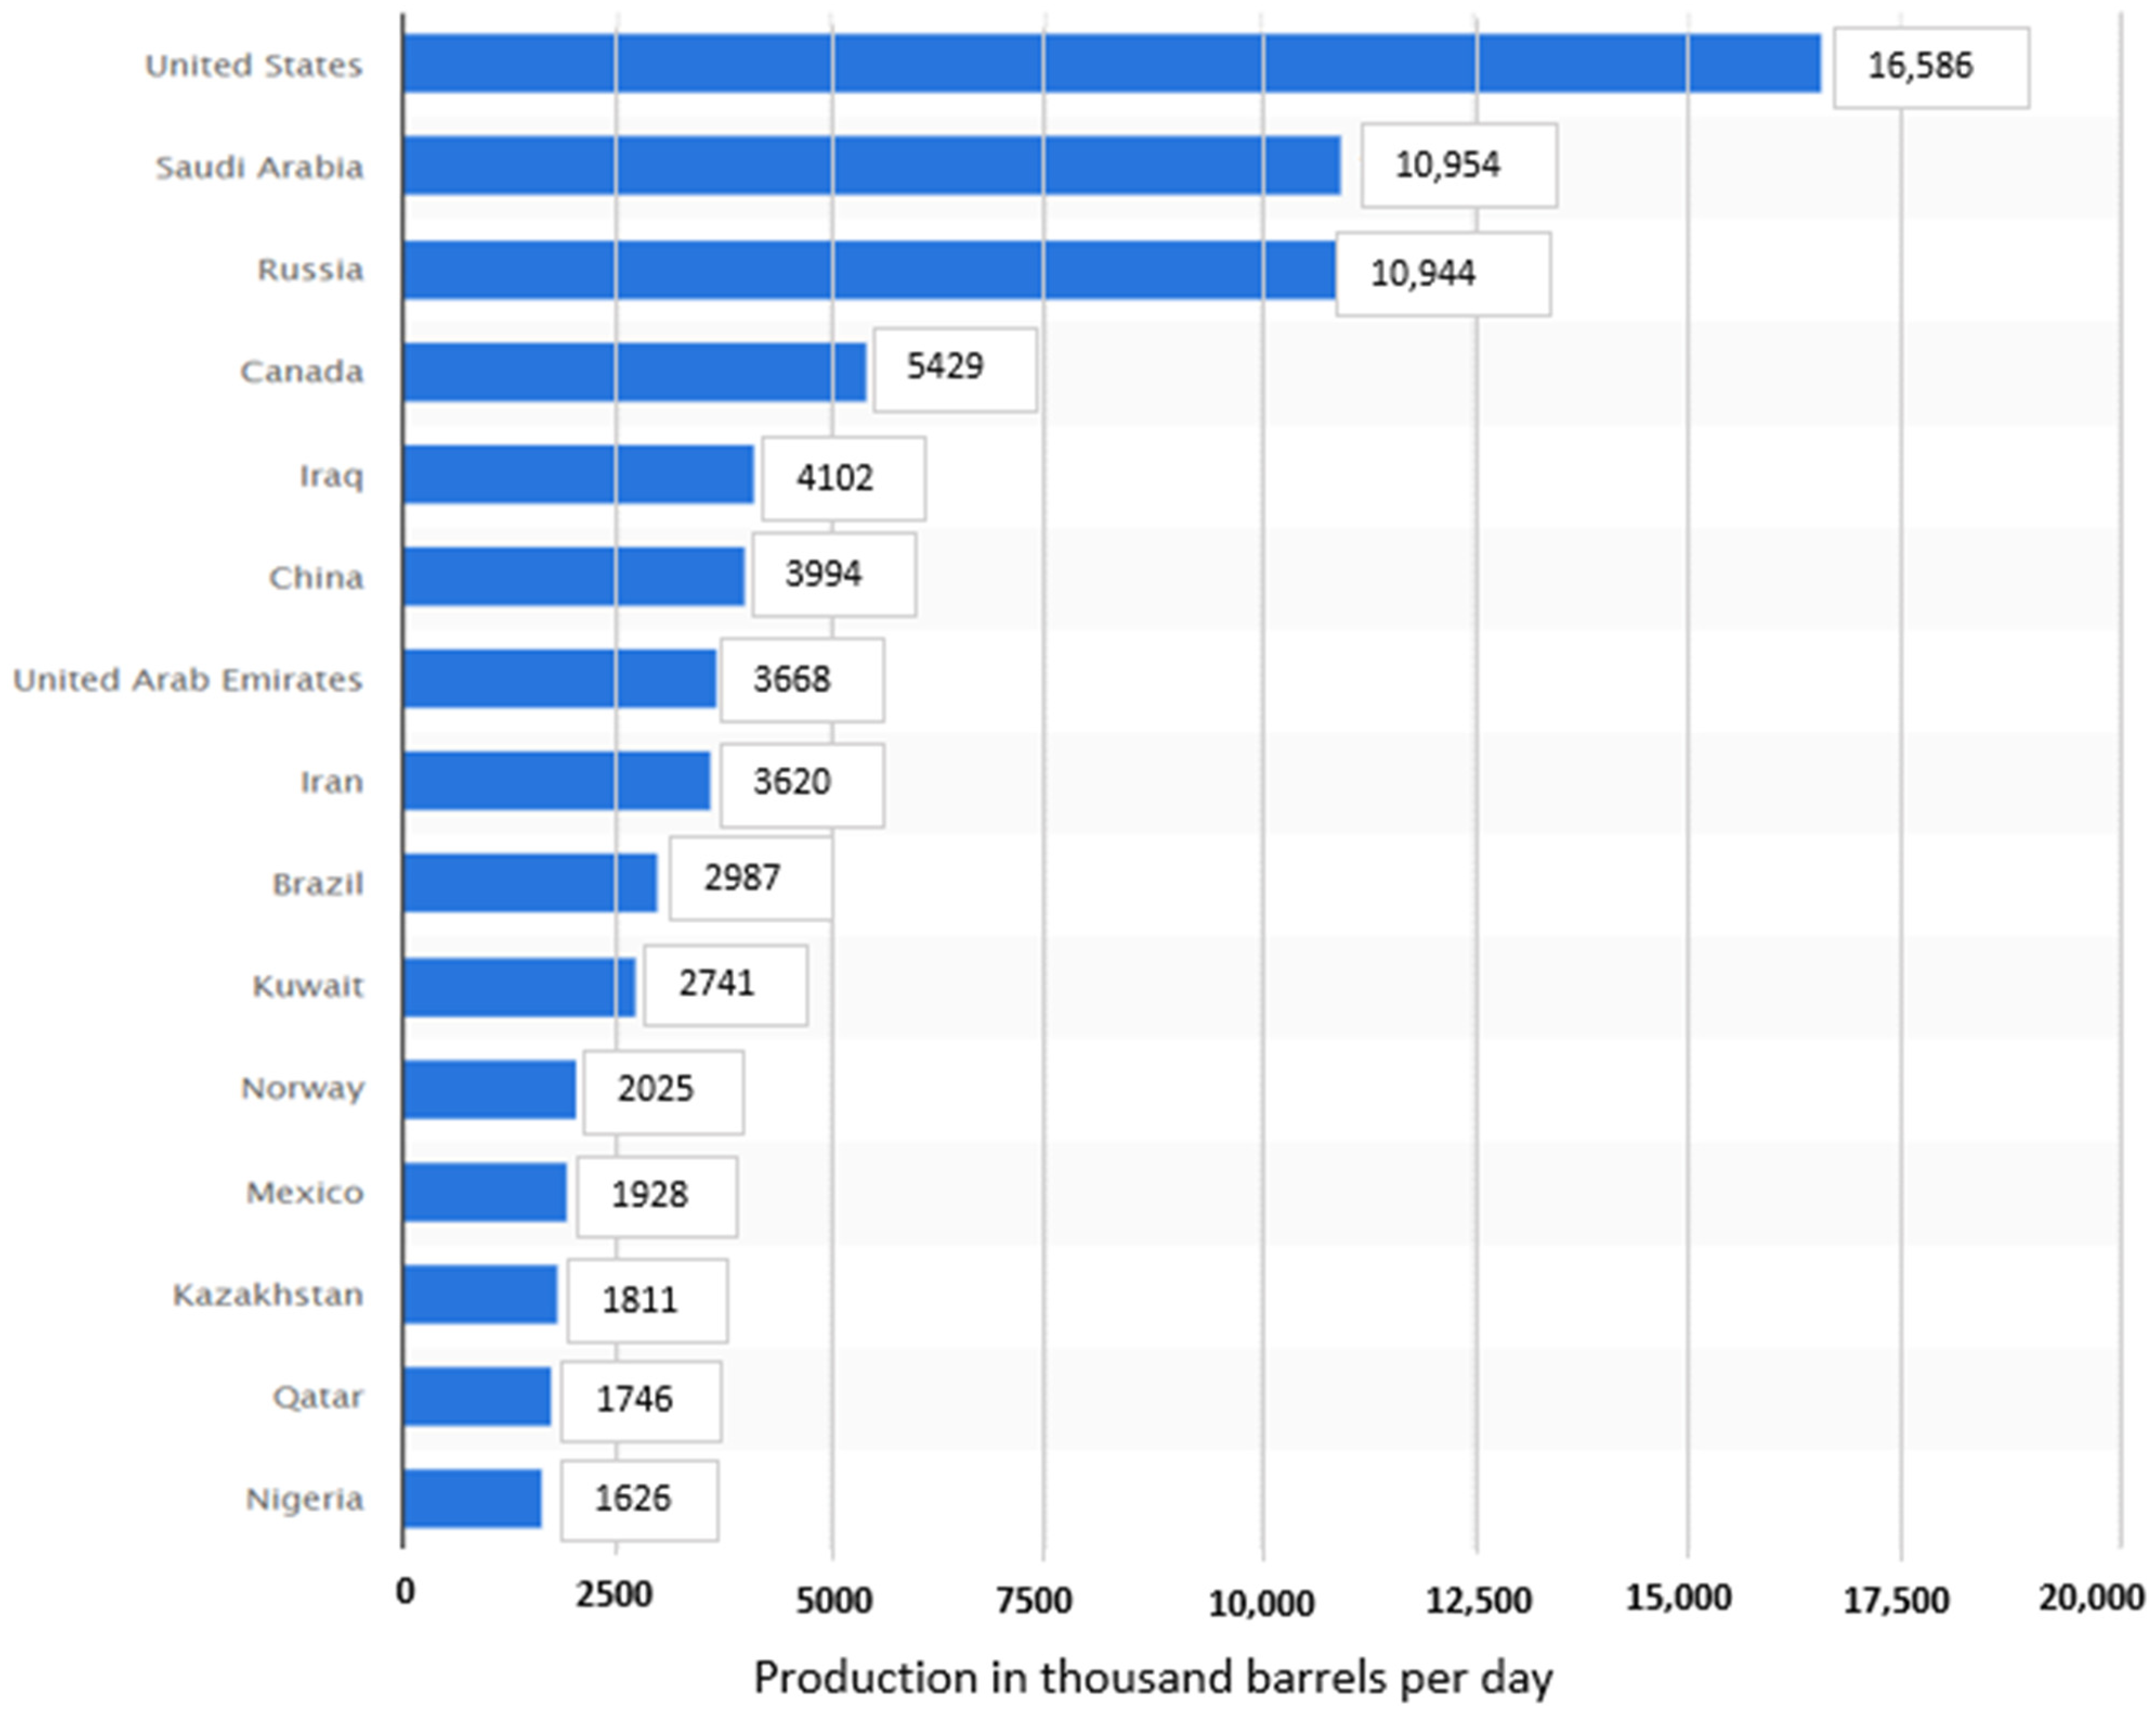
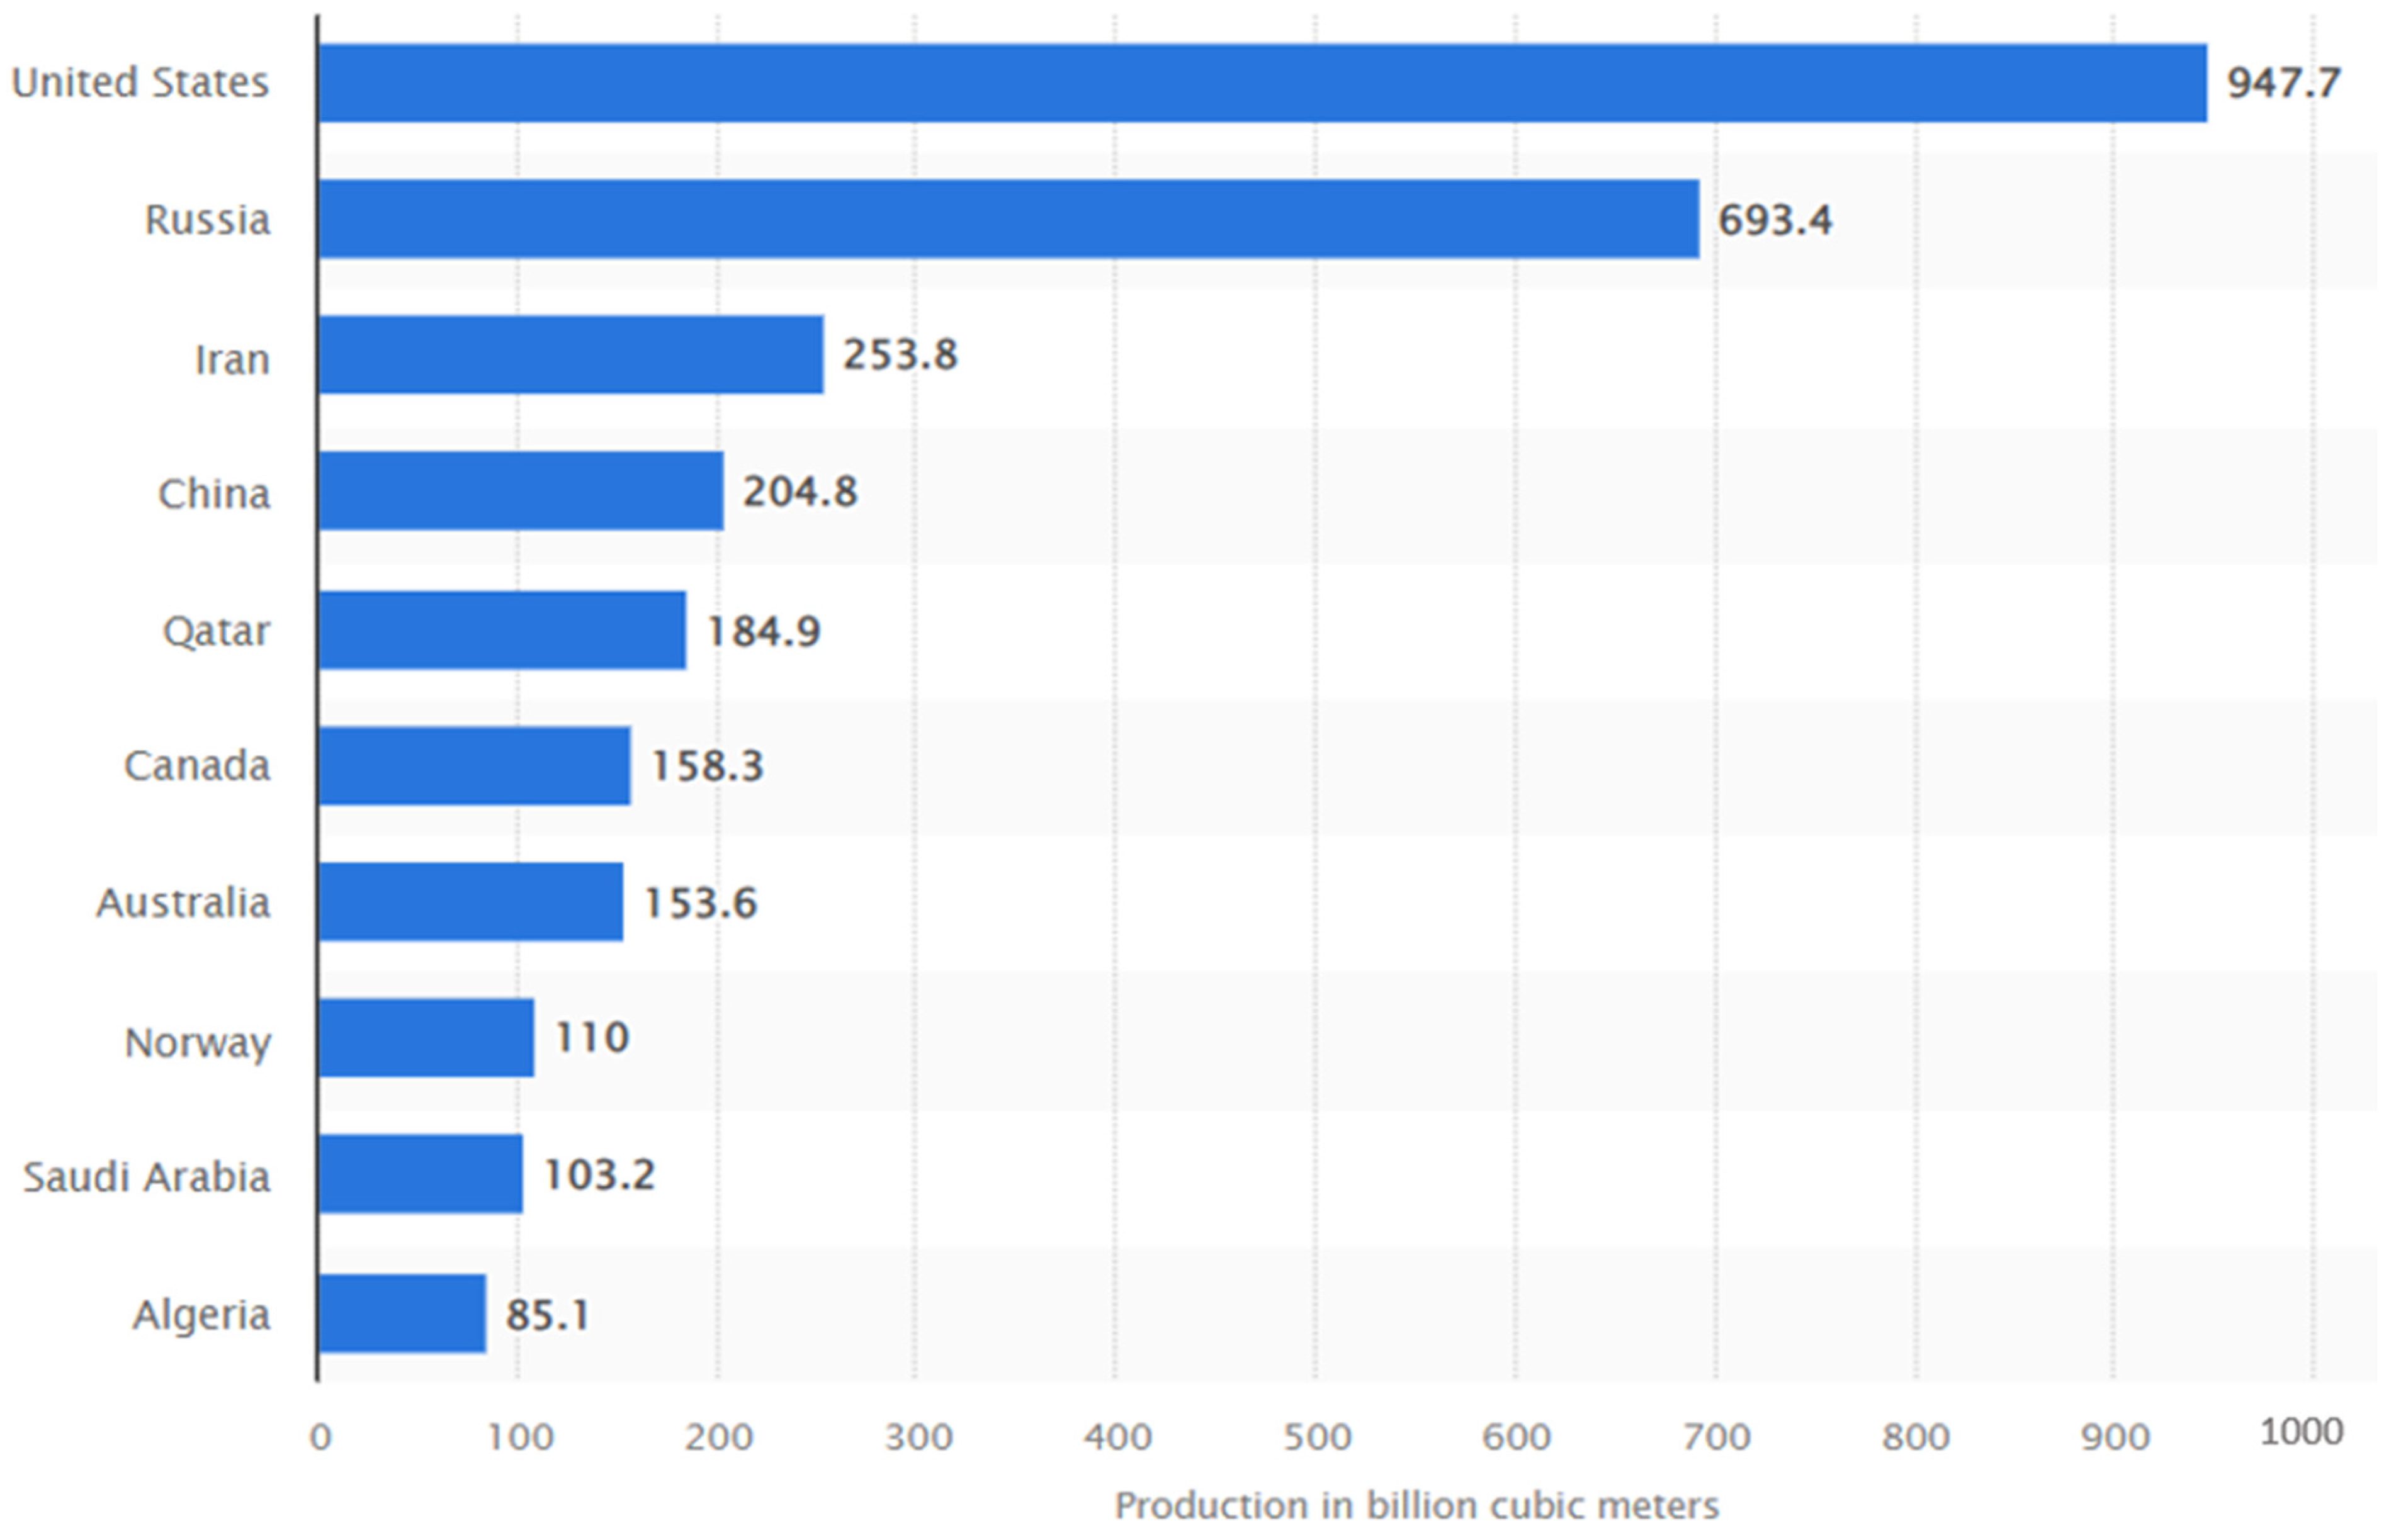
Figure 3 presents a global map of oil-producing states. The largest producers include the OPEC countries (Middle East, North Africa, Nigeria, Angola, Venezuela, and Ecuador), North America, China, Brazil, Norway, Mexico, Kazakhstan, and Russia (
Figure 3 and
Figure 4). Other smaller producers include New Zealand, Australia, India, Papua New Guinea, SE Asia, South Africa, Europe, and South America. The largest natural gas producers (
Figure 5) have similar overall patterns to the largest oil producers in this analysis. It is also noted that Papua New Guinea is 16th in the rankings of natural gas production [
10].
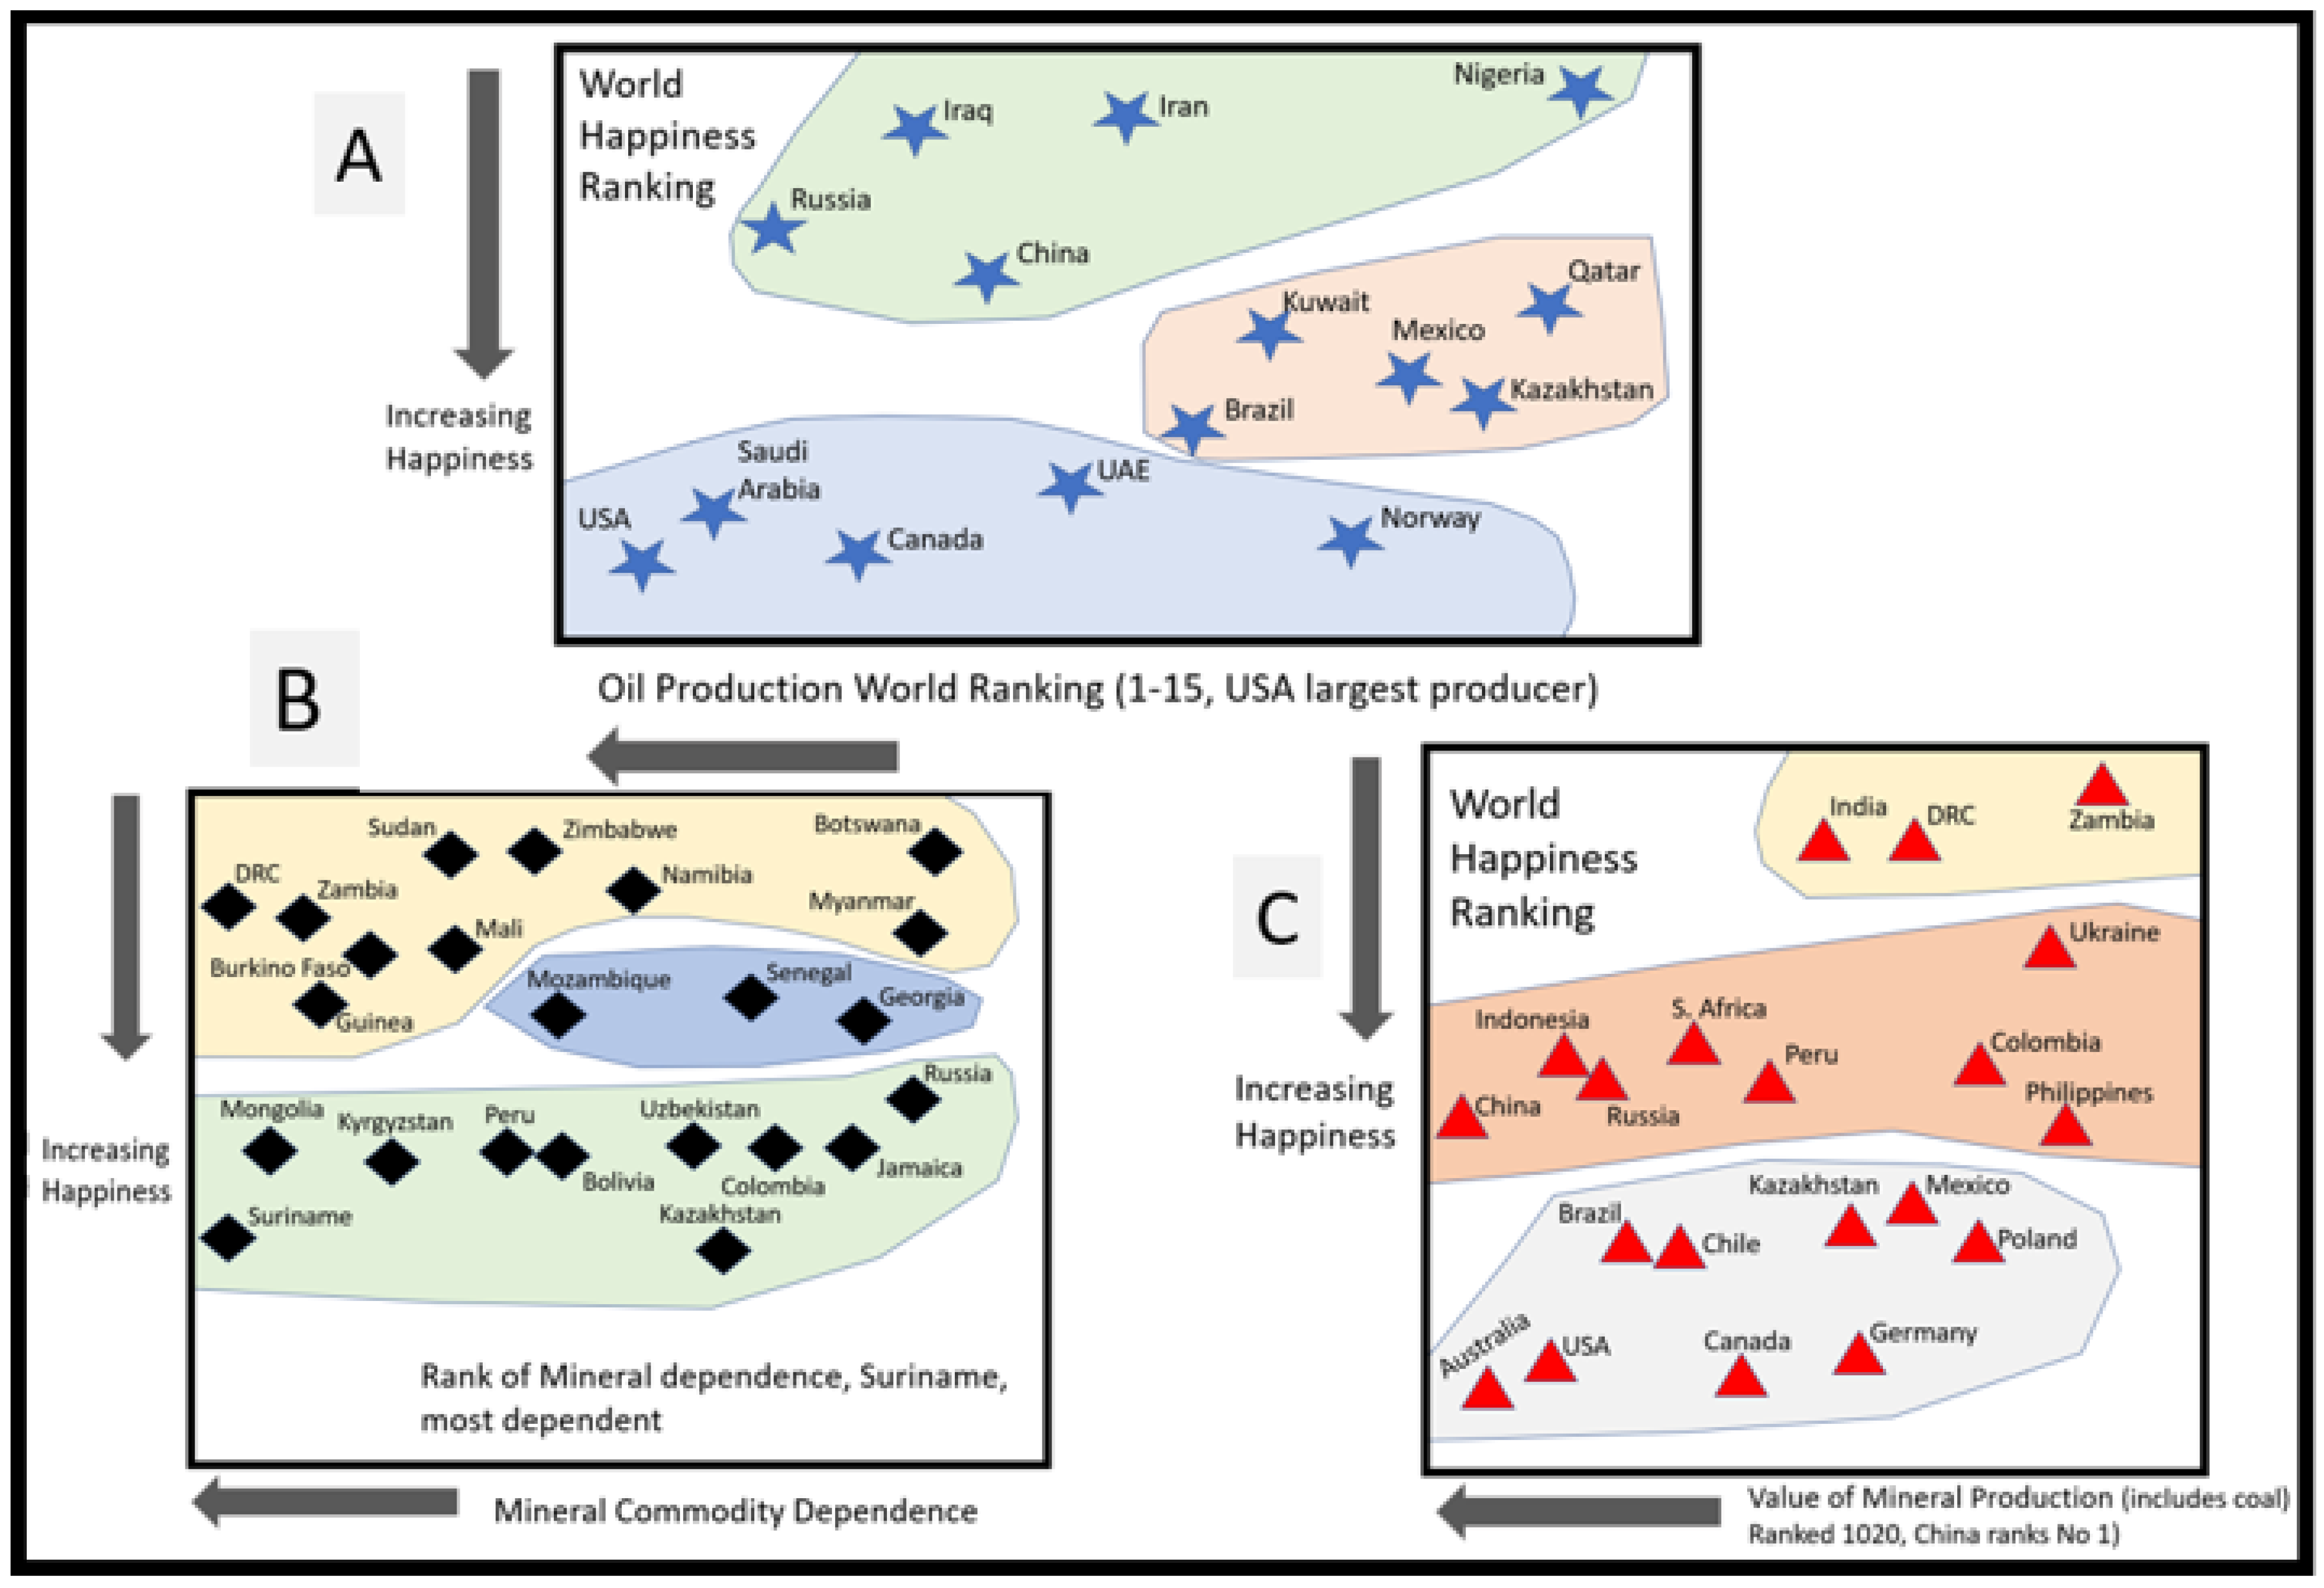
Figure 6 presents graphs of the world happiness rankings against global rankings for oil production, mineral dependence, and the value of mineral production (including coal). There are some clear trends apparent in the graphs. It should be noted that the methodology adopted here is not a quantitative statistical one but rather a qualitative and narrative-style analysis of happiness and EI data at a macro-scale. The graphs do not display obvious simple regression or correlation patterns but do display groups of countries with similar readings with respect to happiness and the EI parameters presented. Examining
Figure 6A with respect to oil production and happiness, there are three clear country groupings. Countries with the highest happiness scores and global oil production rankings between 1 and 13 are the USA, Saudi Arabia, Canada, UAE, and Norway. These include ‘western’ economic countries with representatives from the world’s largest economy (the USA) and smaller but still rich OECD countries (Norway and Canada), as well as Middle Eastern economies with a relatively high economic dependence on oil (Saudi Arabia and UAE, but particularly Saudi Arabia). Besides Saudi Arabia, these countries have a diverse economy, which includes oil as a significant contributor. Despite Saudi Arabia’s high oil dependency, it is 25th in the world’s happiness rankings, suggesting that oil has been of significant benefit to a wide range of socio-economic indicators. The middle group of countries with happiness rankings between c. 45 and 60 have global oil rankings between 9 and 14. These countries are Brazil, Kuwait, Mexico, Kazakhstan, and Qatar. Kuwait and Qatar have a high economic dependency on oil, while other economies are more diverse. Overall, this analysis suggests that oil wealth has contributed in a positive manner to many socio-economic indicators in this middle group of countries. The third group of countries has the lowest happiness rankings (between c. 75 and 115) with global oil production rankings between 3 and 15. Iraq, Iran, and Nigeria are the least ‘happy’, with happiness scores between 105 and 115. Here, a simple analysis is more questionable as the countries have a range of development and socio-economic challenges, including recent wars, the presence of an autocratic/theocratic government heavily sanctioned by western countries, and the country with Africa’s largest and highly diverse population. It could be argued that oil may or may not have assisted with respect to the wider measurements of national development, with other factors playing a larger role in the low happiness determination. It could also be argued that oil has perhaps not benefitted these countries as much as the potential benefits would have predicted; however, the Iran–Iraq war, and the Iraq invasion by the USA and Allied forces, had large negative impacts on these countries and may have destroyed many of the benefits oil wealth may once have brought. China and Russia are the other two countries in this category. Russia has had a strong policy of promoting its oil and natural gas resources and maximizing export revenues. It has undoubtedly gained enormous wealth from this strategy. In terms of happiness, this wealth has probably translated, at least to some degree, into wider national development. China is the world’s fastest ever developing country, with a rapid pace of urbanization. Oil and gas wealth will have contributed to this overall macro-development and have had at least a moderate impact on the wider socio-economic indicators. It could also be argued that oil and natural gas extraction activities can be the cause or partial cause of a country’s/region’s socio-economic distress and weak governance, thus preventing the country/region from benefitting from oil/gas-generated wealth, and suppressing the happiness potential [
14].
Figure 6B presents the mineral dependence (including coal) against the happiness rankings. This graph is the ‘least happy’ of the three diagrams, containing no ‘very happy’ countries. Within
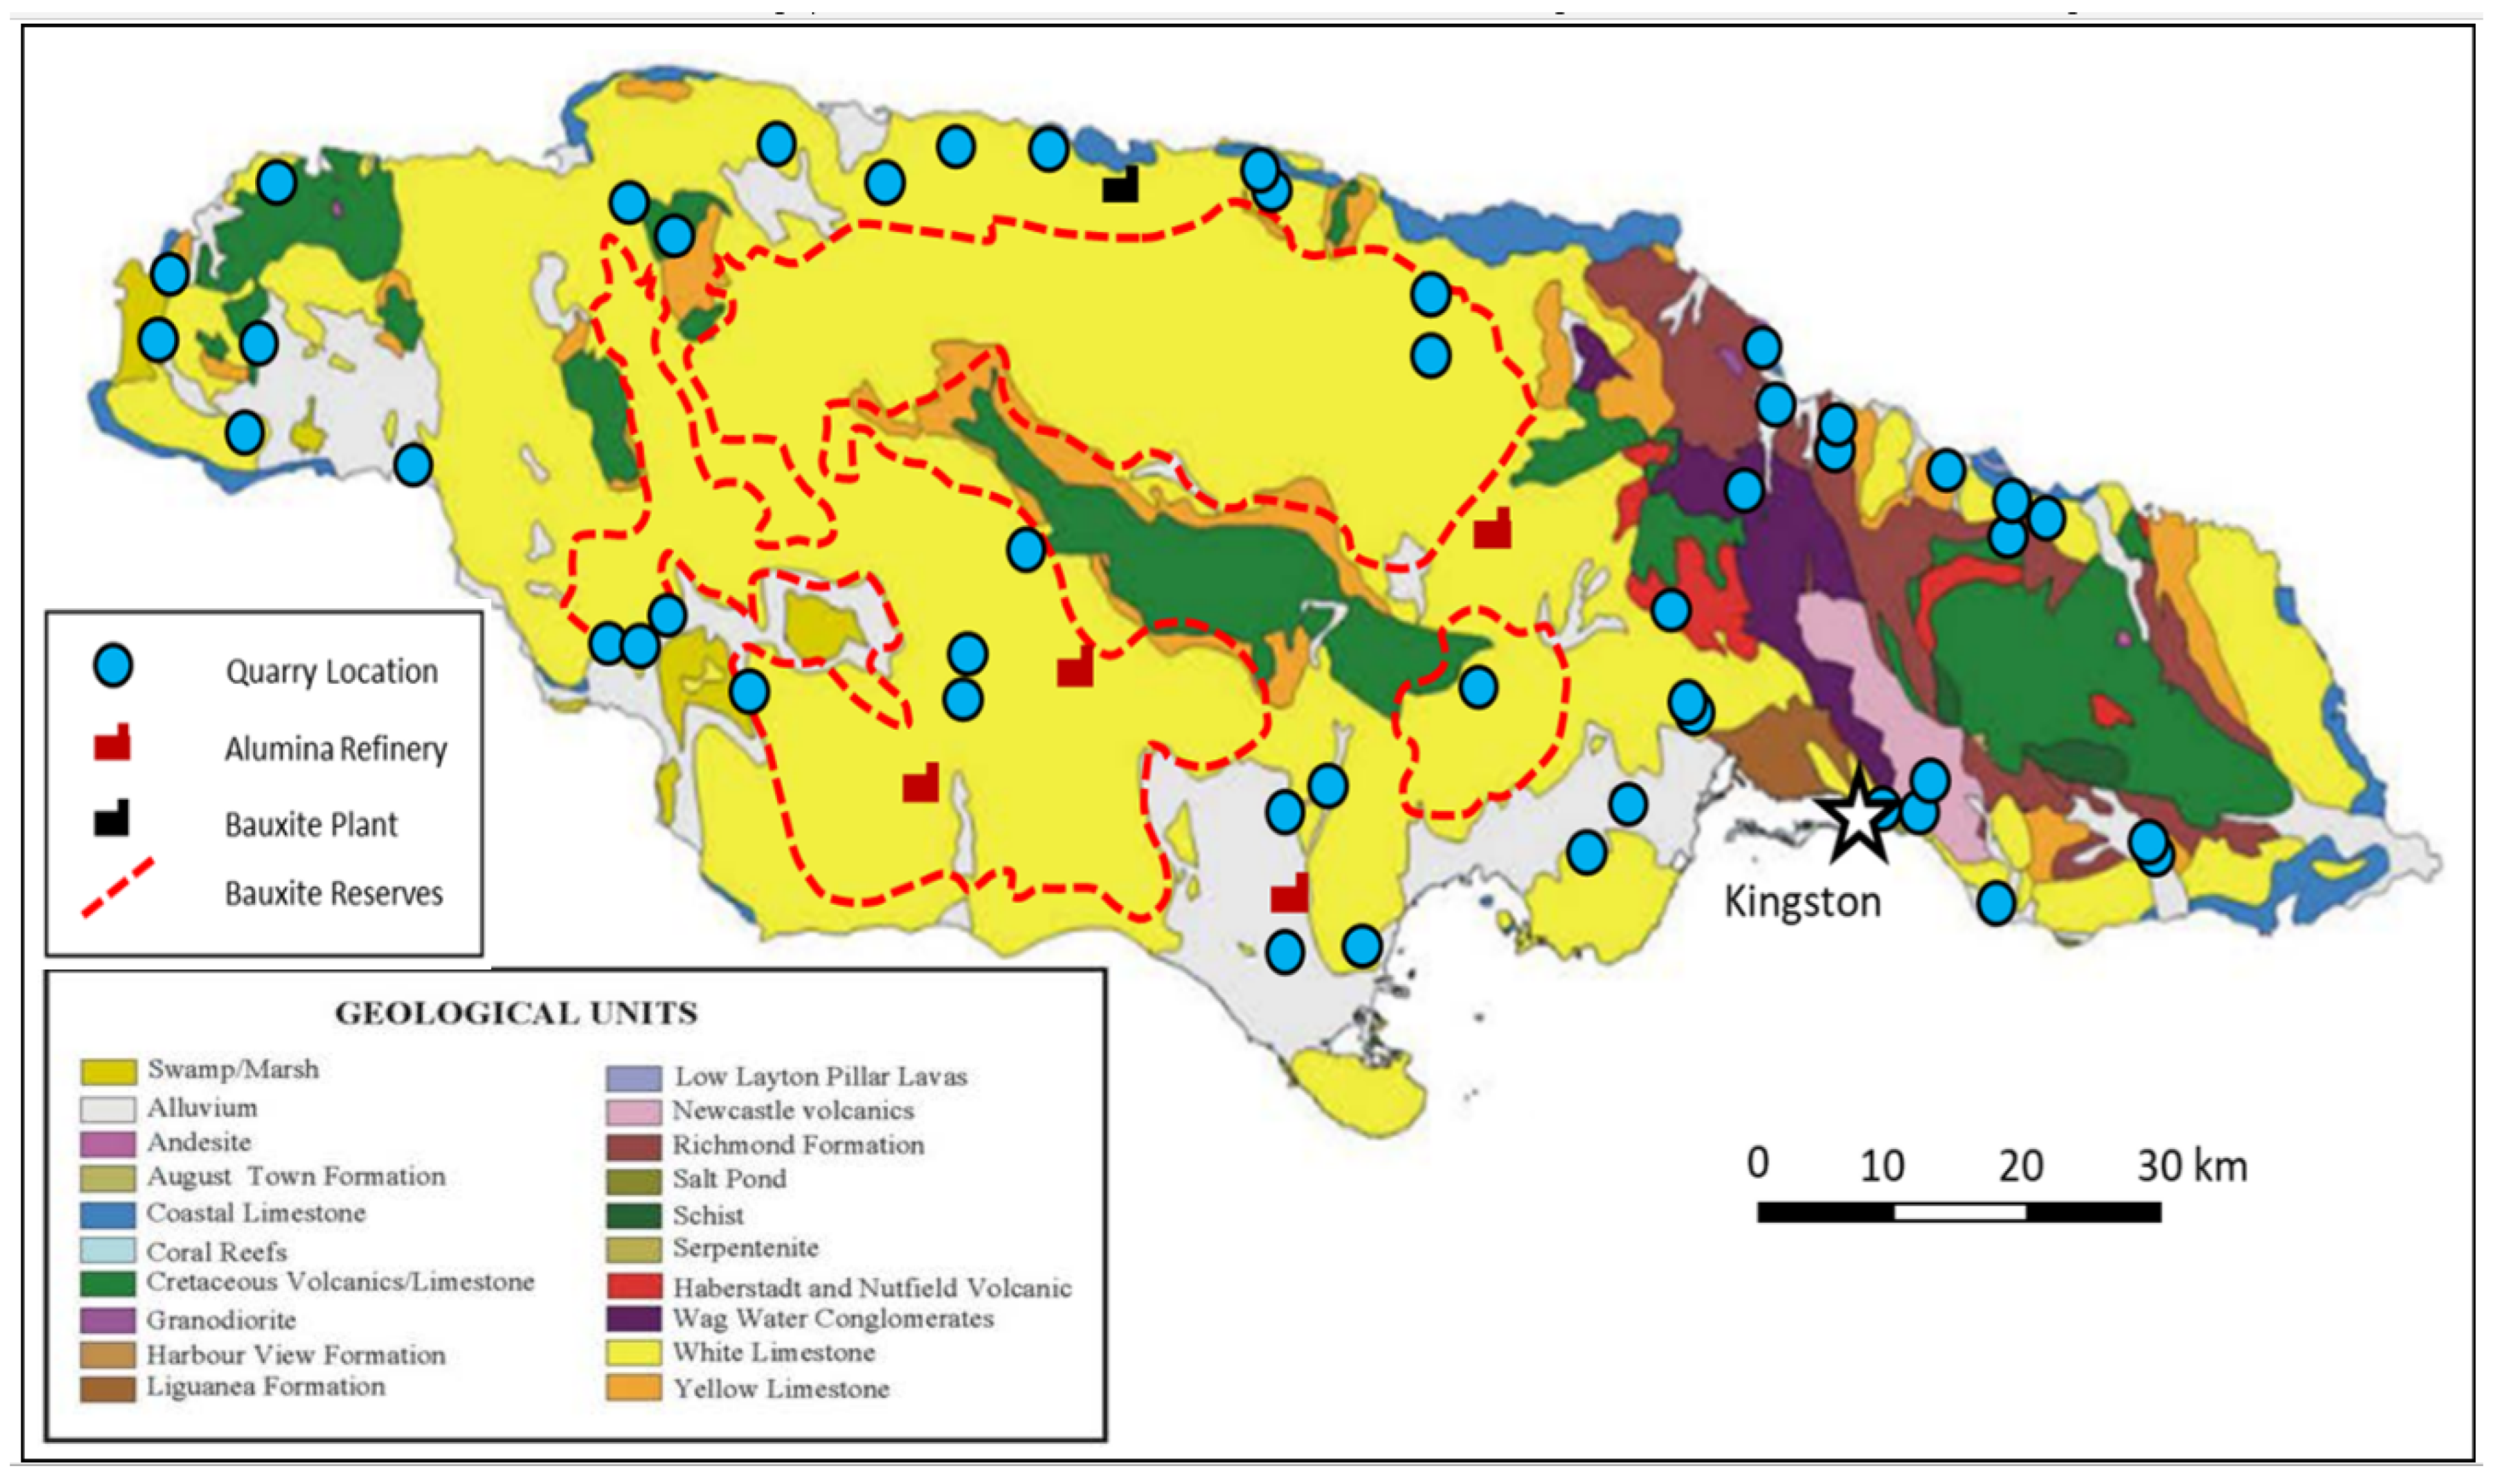
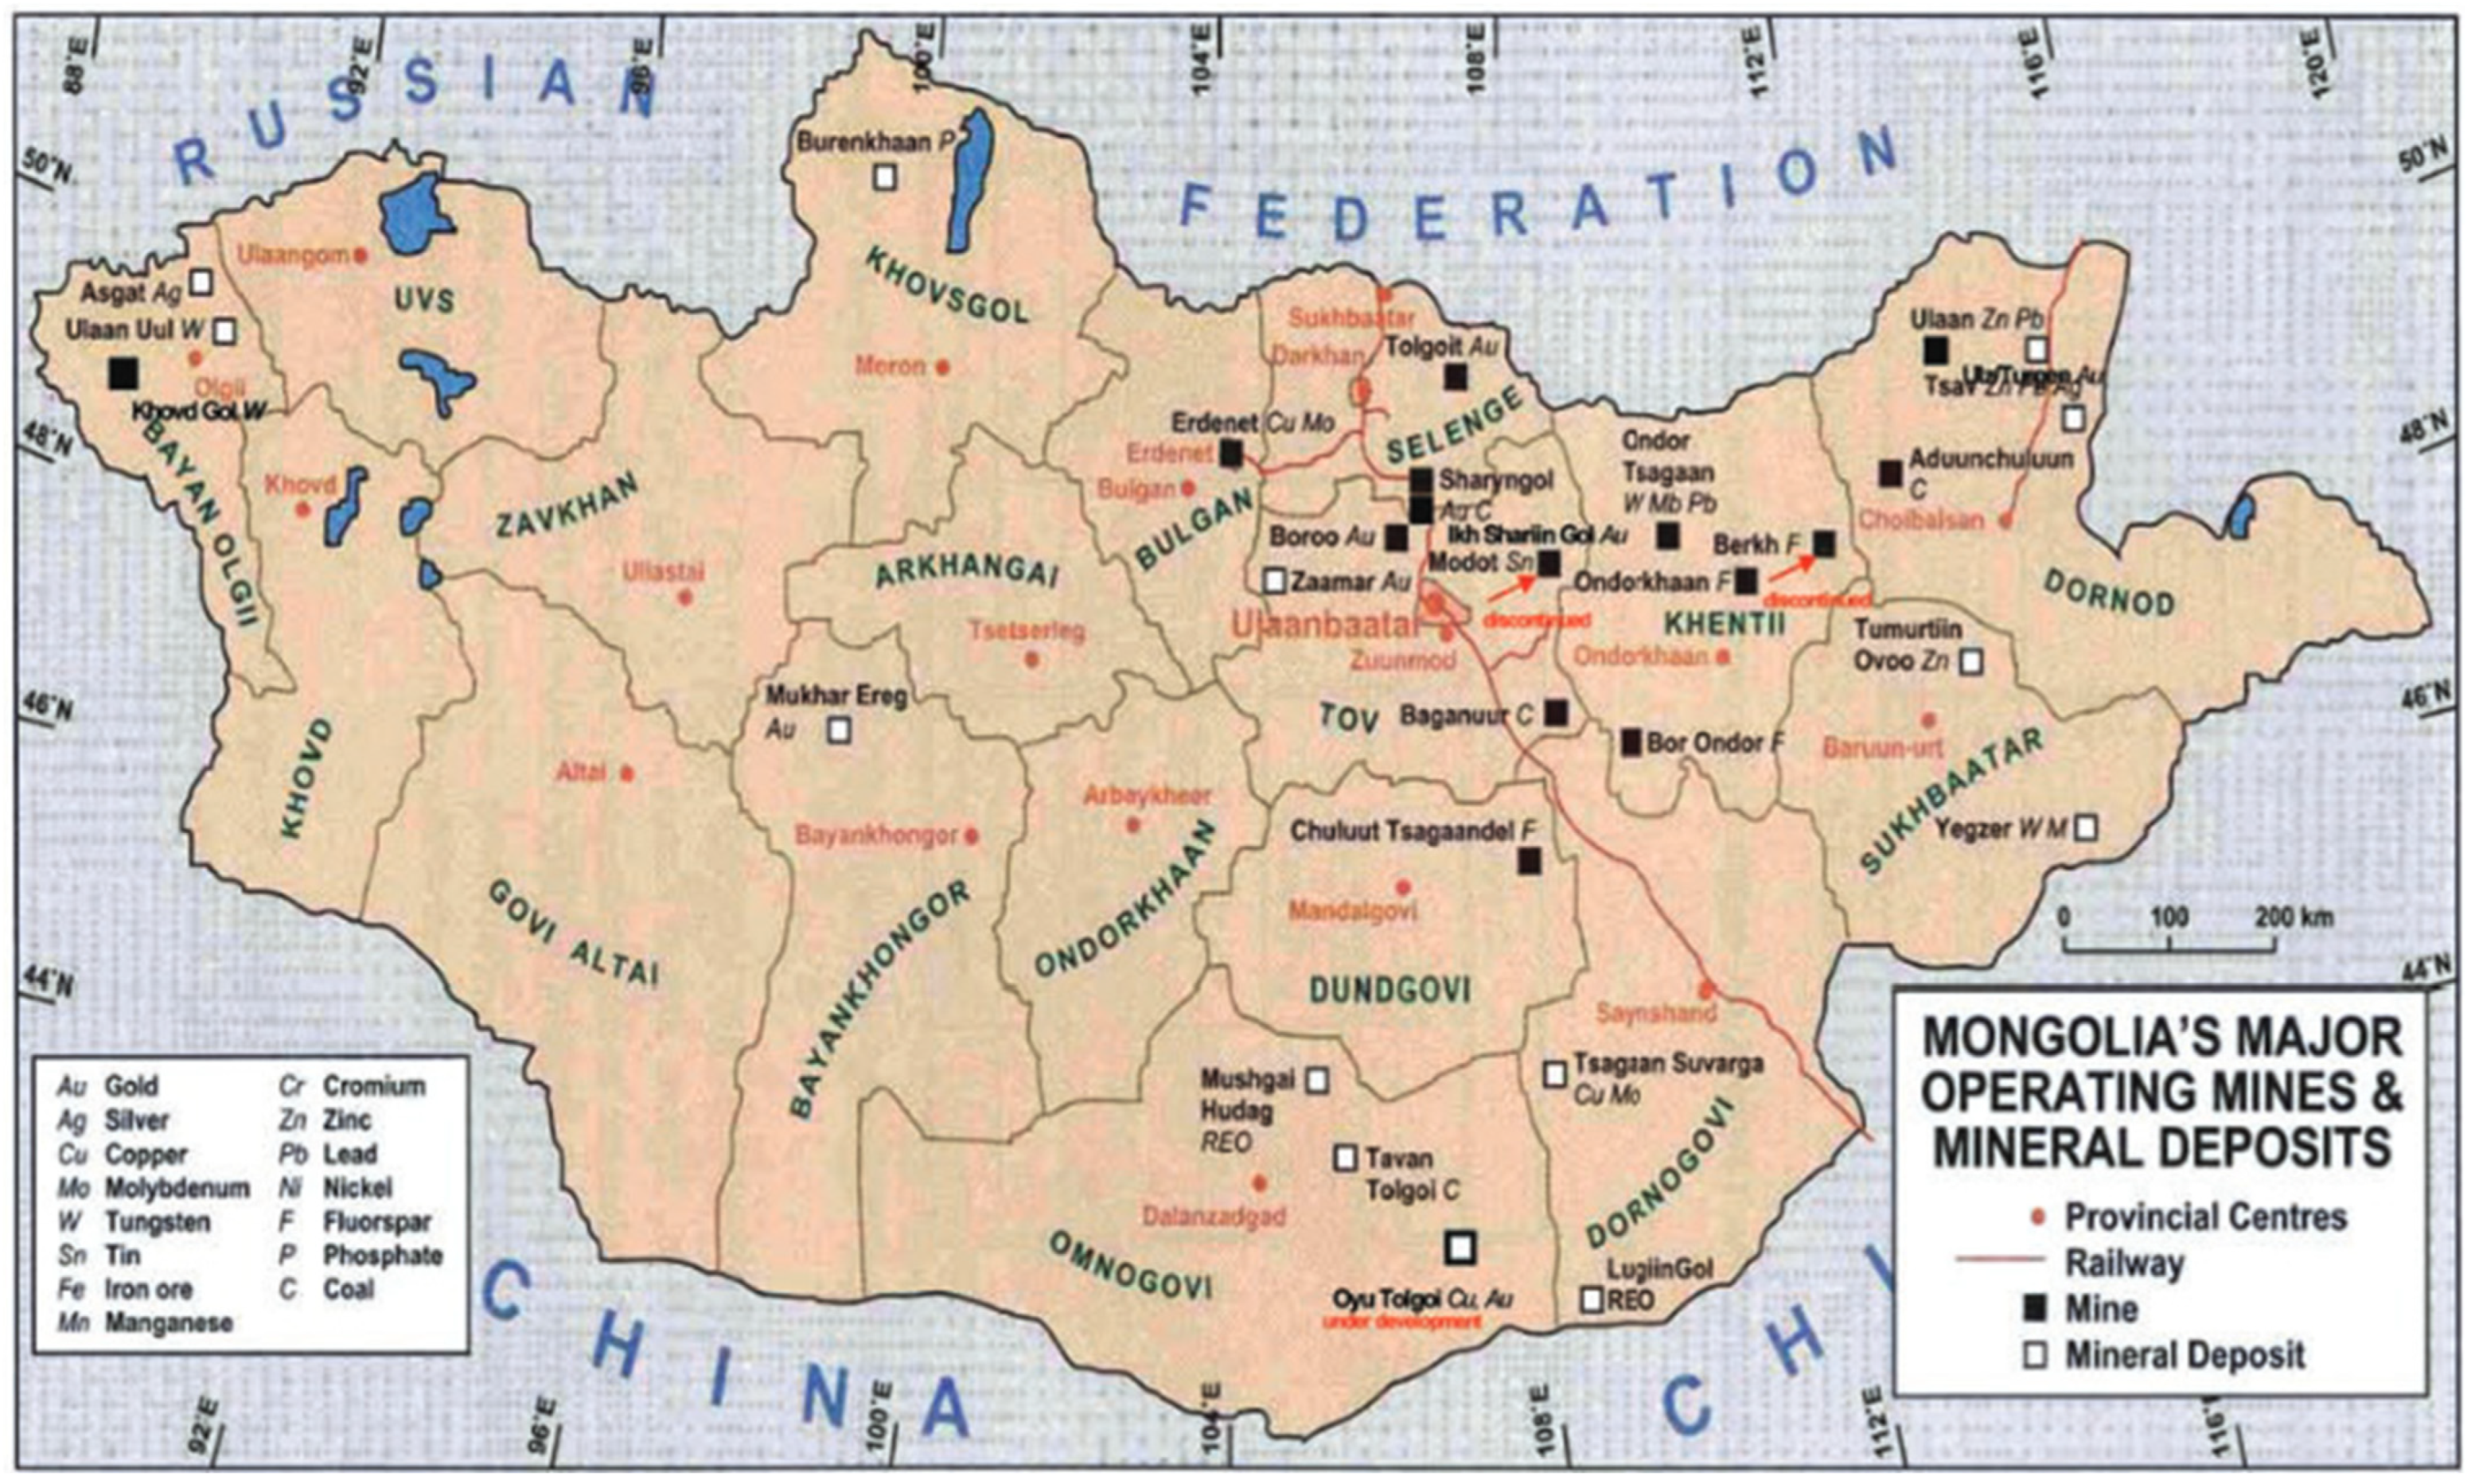
Figure 6B, the least happy group includes countries with happiness ratings between c. 100 and 140, and mineral dependency rankings between 2 and 25. The second least happy group has happiness ratings of c. 100 and mineral dependency rankings between 13 and 22. This group is dominated by sub-Saharan African countries, such as the Democratic Republic of Congo (DRC), Zambia, Sudan, Zimbabwe, Mozambique, Mali, Senegal, and Botswana, as well as two non-African countries (Georgia and Myanmar). The evidence presented here suggests that a high dependency on minerals is not a recipe for happiness, although mineral-dependent countries such as Mongolia and Suriname achieve good happiness scores. The happier group of mineral-dependent countries includes Suriname, Mongolia, Kazakhstan, Jamaica, Russia, Colombia, Uzbekistan, Peru, Bolivia, and Kirgizstan. This group of nations is dominated by South American/Caribbean countries and Central Asian countries. Some countries have relatively small populations (e.g., Jamaica, Suriname, Mongolia), and others have large landmass areas (e.g., Russia, Kazakhstan, Mongolia, Colombia). Governance systems vary from democratic to more autocratic. Despite the relatively high levels of economic dependency on minerals, and a wide range in type of country in terms of geography, location, politics, size, population, and so forth, it could be argued that mineral wealth has had at least some positive impact on the wider socio-economic indicators.
Figure 6C plots the happiness index against global rankings in terms of the value of mineral production (including coal). The happiest country group has a range in happiness indices between 11 and 47 and in mineral production value indices between 2 and 16. The group comprises Australia, the USA, Canada, Brazil, Chile, Germany, Poland, Mexico, and Kazakhstan, thus including some of the richest economies in the world, along with middle-income countries such as Brazil, Chile, and Mexico. The middle group has a range in happiness indices between c. 60 and 105, and in mineral production value rankings between 1 and 19. This group comprises China, Indonesia, Russia, South Africa, Peru, Colombia, the Philippines, and Ukraine, including population giants such as China, Indonesia, Russia, and the Philippines, and representative countries from South and Central America, Central Europe and Asia, Southern Africa, and East and Southeast Asia. The least happy countries have happiness indices > 130, and mineral production values between 12 and 20. The DRC and Zambia have complex socio-economic and development challenges as well as over-dependence on mineral commodities, while India’s huge population and diversity as well as its diverse economy dilute the impact of mineral wealth on development.
Russia and Kazakhstan appear on all three graphs, with Kazakhstan possibly using its natural resource wealth to better effect than Russia in terms of happiness indices. Highly dependent countries with respect to minerals struggle to translate this wealth into national happiness, while many hydrocarbon-dependent countries appear to be able to obtain relatively high happiness indices. Countries with a longer history in strong and reasonably ‘fair’ governance, coupled with diverse economies, utilize natural resources as a positive factor in achieving high happiness indices. Central Asian, South–Central American/Caribbean, and SE Asian countries have had some moderate success in translating natural wealth into medium indices of happiness. The Chinese strong central governance model has had moderate success in translating natural resource wealth into the attainment of medium happiness indices.
3. Do Extractive Industries Contribute to or Diminish National Happiness?
Before discussing case studies linked to Papua New Guinea and other areas, it is worth examining generic global evidence that may shed light on causation and/or correlation with respect to extractive industry wealth and national happiness. The section above provides mixed evidence. (1) There is limited correlation between happiness and the other parameters plotted in
Figure 6. At any value of mineral dependence/oil production/value of mineral production, happiness varies between low and high. (2) Many highly mineral-dependent, less-diverse economies have low levels of national happiness. (3) Extractive industry wealth may significantly contribute to national happiness in mature, larger, more diverse economies. (4) Centrally controlled governance systems have used extractive industries to increase national wealth, and their global happiness scores fall in the mid-range. (5) Many oil-rich states tend to have higher happiness scores. (6) Factors such as weak governance, immature and ineffective institutions, corruption, conflict, political instability, community tensions, inequality, and so on, have a strong control over happiness, or rather suppression of happiness. Many researchers argue that EIs are a cause or partial cause of weak governance, etc., because their activities can generate corruption, weaken governance and institutions, and cause communal conflict/tension [
14]. Other researchers argue for more complex relationships between EIs, governance, institutions, etc. (7) A diverse range of countries, such as Indonesia, Kazakhstan, Mexico, Brazil, Chile, and Mongolia, demonstrate a reasonable correlation between extractive industry wealth and mid-range happiness indices.
Table 1 lists the key criteria through which world happiness ratings are achieved and suggests a range of mechanisms through which extractive industrial wealth can impact on specific criterion. Publications such as those by Christmann [
15], Hanai [
16], and Kolstad and Søreide [
17] are examples of a plethora of literature in learned journals and the ‘grey literature’ that have examined links between governance, economic and social wellbeing, conflict diamonds/commodities and human rights, and corruption and mineral/oil resources. The overall conclusions of this research indicate that there are numerous examples of mineral and oil wealth increasing corruption, degenerating governance and institutions, negatively impacting human rights, and fueling conflicts. Examples of this negative correlation between natural resource extraction and management and happiness indicators are particularly prolific within countries with numerous developmental, societal, and governance challenges, such as the DRC, Nigeria, and Myanmar. Researchers also conclude that while international agreements, conventions, protocols, and frameworks are useful in benchmarking, measuring, and monitoring the relationship between natural resources, governance, and society (e.g., the Extractive Industry Transparency Initiative, [
18]) and have made significant contributions to improving the happiness indicators, in themselves they are not enough: these are examples of passive approaches. More active approaches, researchers argue, are a far more effective way forward, with individual companies at local and national levels being the key actors in progressing happiness indicators through the adoption of impactful and active programs and policies, and the active interaction and engagement within local and national governance and institutional strengthening programs. Dialga and Ouoba [
19] examined evidence from the literature using 2009–2015 data from 42 countries on the impacts on health and education and other human development indicators from extractive industry wealth and operations. Their findings indicate that natural resource wealth has an overall small but positive impact on the Human Development Index (HDI). Positive links are dependent on institutional quality, and they recommend that institutional strength is a prerequisite of permitting mineral and hydrocarbon operations. There was also evidence that extractive industry wealth could degrade institutional quality and, therefore, the HDI. To maximize the benefits from extractive industry wealth, institutions should be capable of orienting/directing funds specifically for a particular sector. Dialga and Ouoba [
19] focused on health and education, arguing that these areas were the best routes through which extractive industry wealth could improve the HDI. If extractive industry companies could focus their attention more on active engagement and partnerships with specific institutions, e.g., in health or education, and work with these institutions in optimizing the transfer of revenues from extractive operational profits into specific areas that directly impact on the HDI and happiness, this would result in increased levels of national/local happiness and the HDI. Dialga and Ouoba [
19] reviewed a range of literature examining the link between HDI and extractive industry wealth and presented numerous examples of mixed results, concluding that the ability of extractive industry wealth to improve the HDI is contextual, particularly dependent on good governance, strong institutions, and low levels of corruption, but it can benefit from more focused and active engagement of mining and hydrocarbon companies, with an explicit focus on the HDI (or happiness, as the HDI strongly correlates with national happiness).
The industry-sponsored ICMM (International Council on Mining and Metals) published a report in 2018 entitled ‘
Social Progress in Mining-Dependent Countries: Analysis Through the Lens of the SDGs’ (Sustainable Development Goals) [
20]. This work examined progress of mining- and hydrocarbon-dependent countries with respect to the SDGs between 1995 and 2015. The study concluded that >80% of MDCs (Mineral-Dependent Countries) closed socio-economic gaps with global SDG best performers, particularly those MDCs that had stronger governance and institutions. The national trends reflected progress at sub-national levels. The report argues that this research provides a counter to numerous ‘resource curse’ style publications that suggest a negative correlation between extractive industries and national happiness. A closer analysis shows mixed results from the data presented by ICMM 2023 and 2018 [
20,
21]. The greatest SDG progress is in the areas of infrastructure, energy access, poverty reduction, and health. Less obvious positive correlations are observed in SDGs linked to gender, governance, institutions, employment, and peace and justice. The more nuanced conclusions reinforce data from Dialga and Ouoba [
19] that to move to the next level and couple the extractive industry more closely with active progression with respect to happiness, HDI, and SDG improvements, industry must increasingly become proactive in improving governance, institutional strength, transparency, equality, economic wellbeing, and so on.
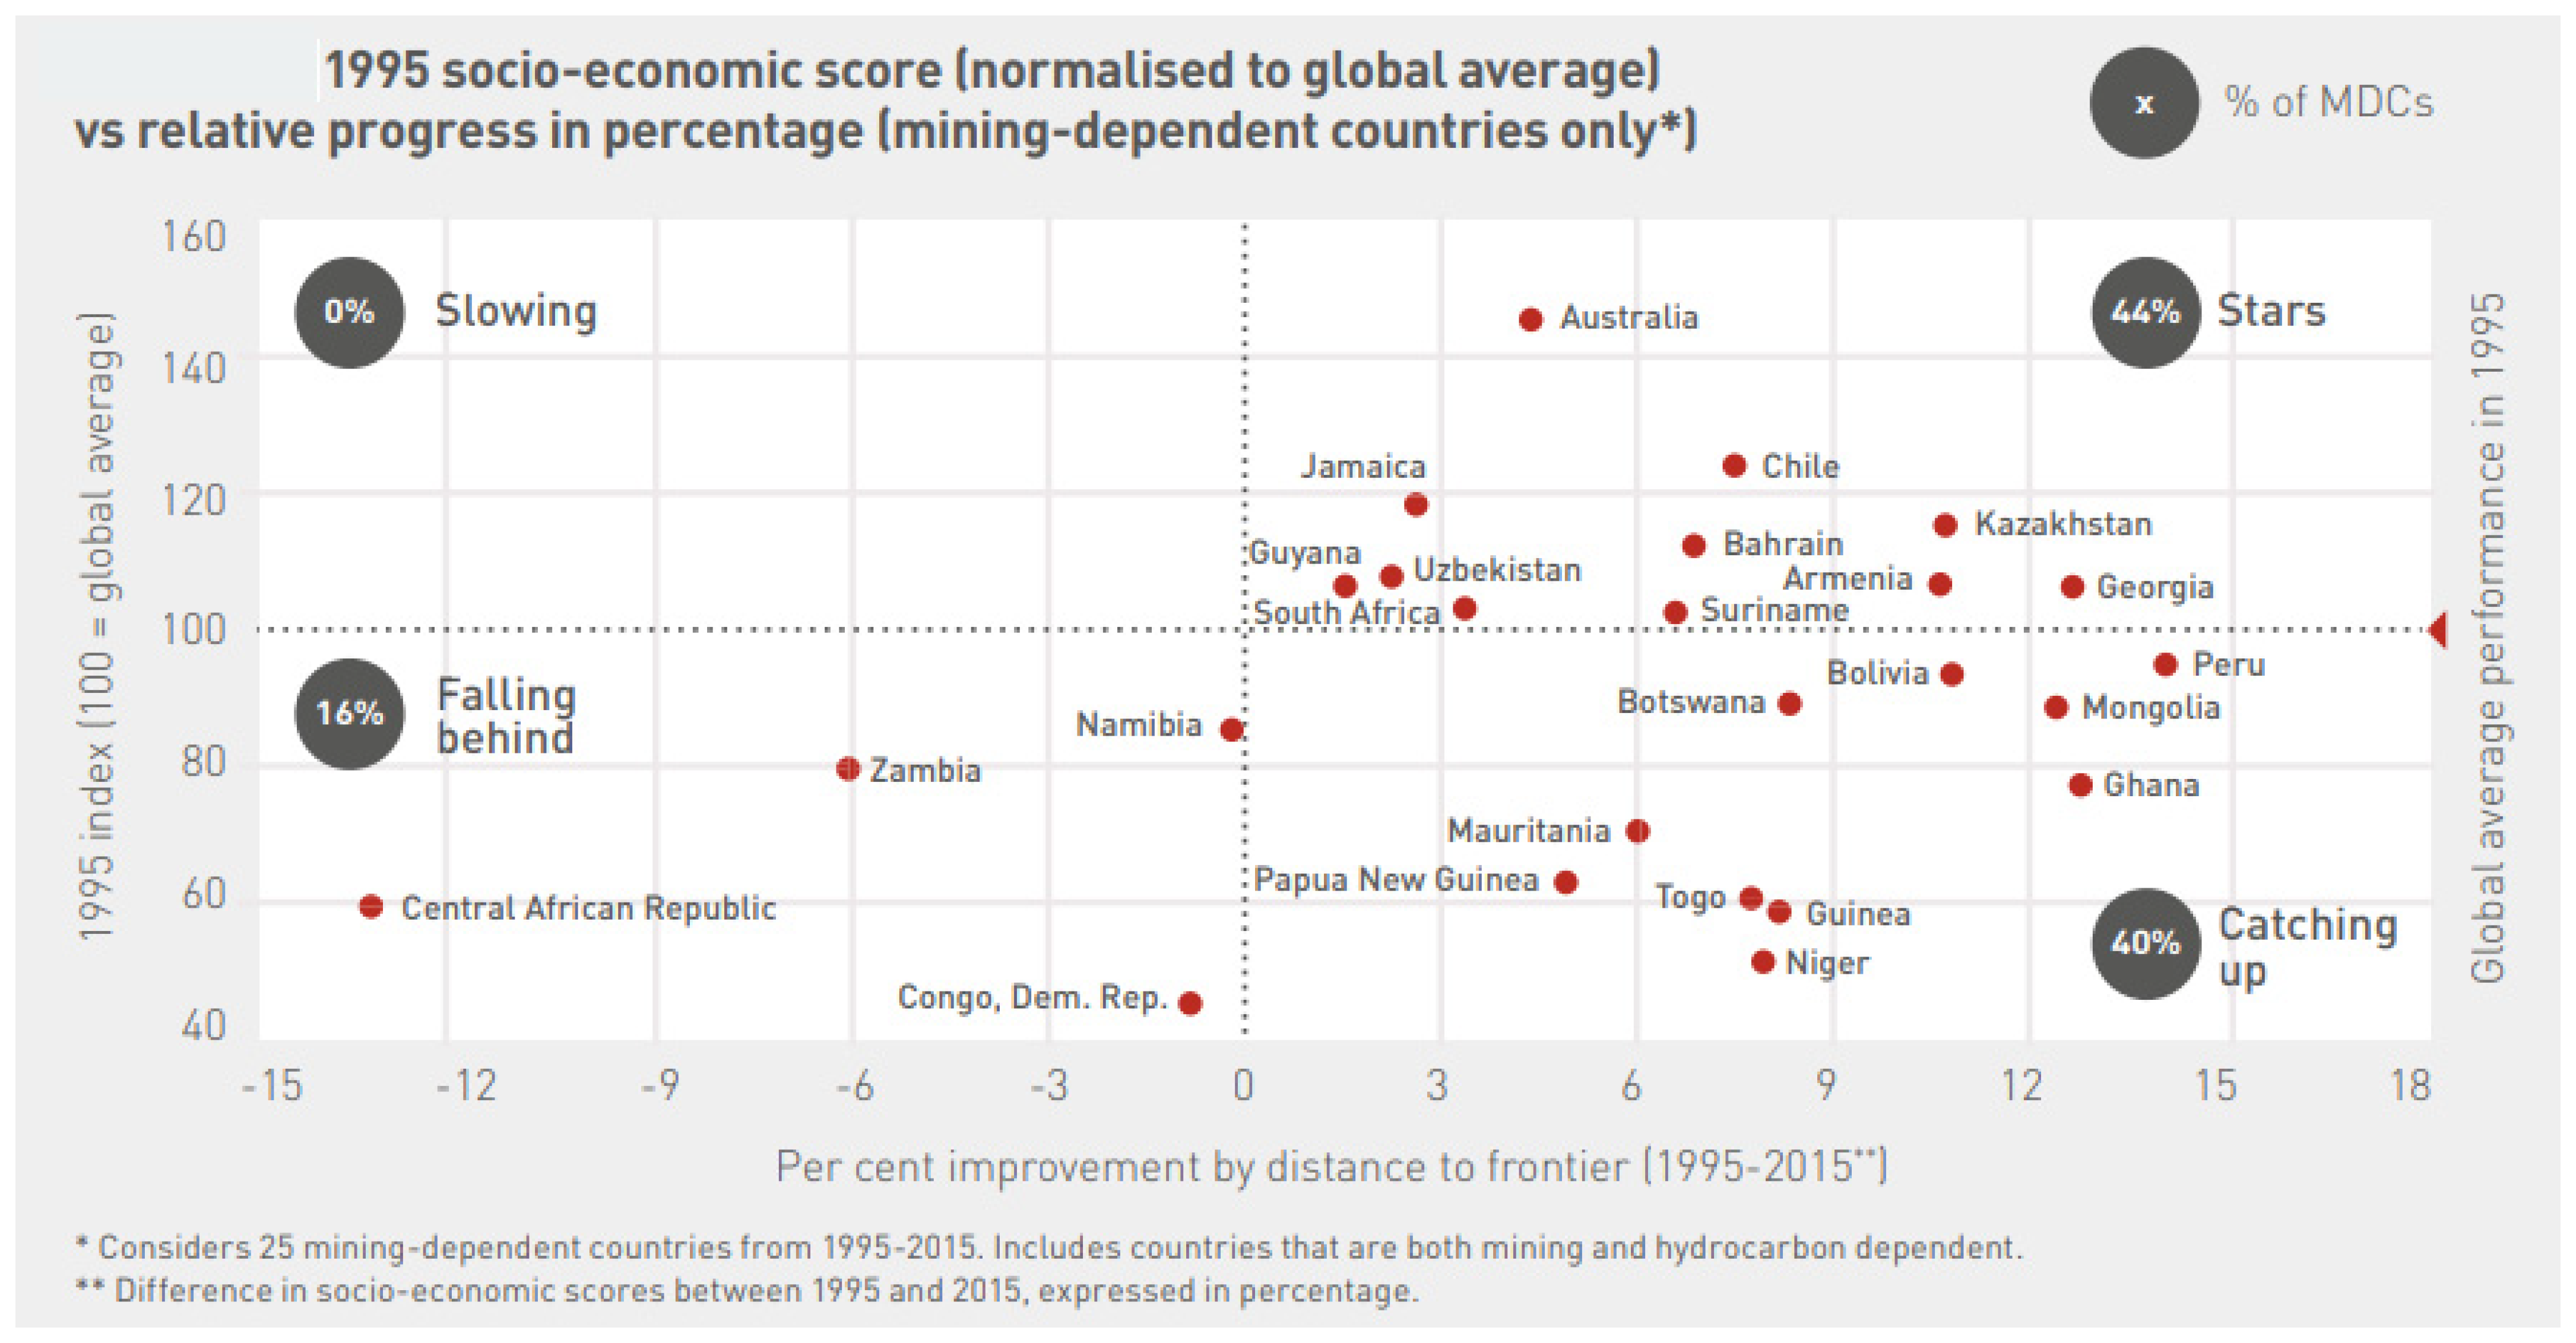
Figure 7 summarizes much of the key data of the ICMM 2018 report [
21]. The figure plots SDG progress in 1995–2015 against the percentage improvement in SDGs relative to ‘socially advanced countries’ against the percentage improvement relative to only the Mineral-Dependent Countries (MDCs). The global average of SDG development is represented by the 100-horizontal line, with vertical lines plotting % improvements relative to MDCs. Countries plotted on the left-hand side of the diagram (the DRC, Central African Republic, and Zambia) are the poorest performers with respect to SDG progress, even relative to other MDCs. Countries such as Namibia, Papua New Guinea, Mauritania, Togo, Guinea, Niger, and Ghana, plotted on the lower right-hand side of the diagram, indicate good progress relative to MDCs but not against ‘socially advanced countries’. Countries such as Mongolia, Botswana, Peru, Bolivia, South Africa, Guyana, Uzbekistan, Suriname, Georgia, Armenia, and Bahrain have maintained a 1995 global average regarding the SDGs but variably progressed with respect to MDCs. The strongest SDG performers are Kazakhstan, Chile, Jamaica, and Australia. The overall conclusion is that extractive industries are not a particularly strong factor in advancing SDGs and are operating below the potential impact they could achieve if companies were more focused on national happiness as a key company performance indicator.
In ending this section by bringing a global analysis to a country level, it is instructive to examine the key findings of the 2014 national human development report for Papua New Guinea (PNG), the UNDP Human Development Report 2014 [
22]. The report concludes that, while there has been some progress and measurable achievements in life expectancy, income, and education, other areas are less positive, including poverty levels and increasing inequality. The more positive contributions of extractive industries in PNG include increasing government revenue flows, technical innovations, improved transparencies, and some improvements in local community engagement. To improve and focus on extractive benefits and human development, the report recommends an increased focus in the areas of policy frameworks, company negotiations, institutional strength and governance, transparency, economic diversification, human capacity development, environmental management, and the corporate–community–government nexus.
4. Have Extractive Industries Demonstrably Improved the Happiness Levels of Papua New Guinea? Overview and Case Studies
The question regarding whether Papua New Guineans are ‘
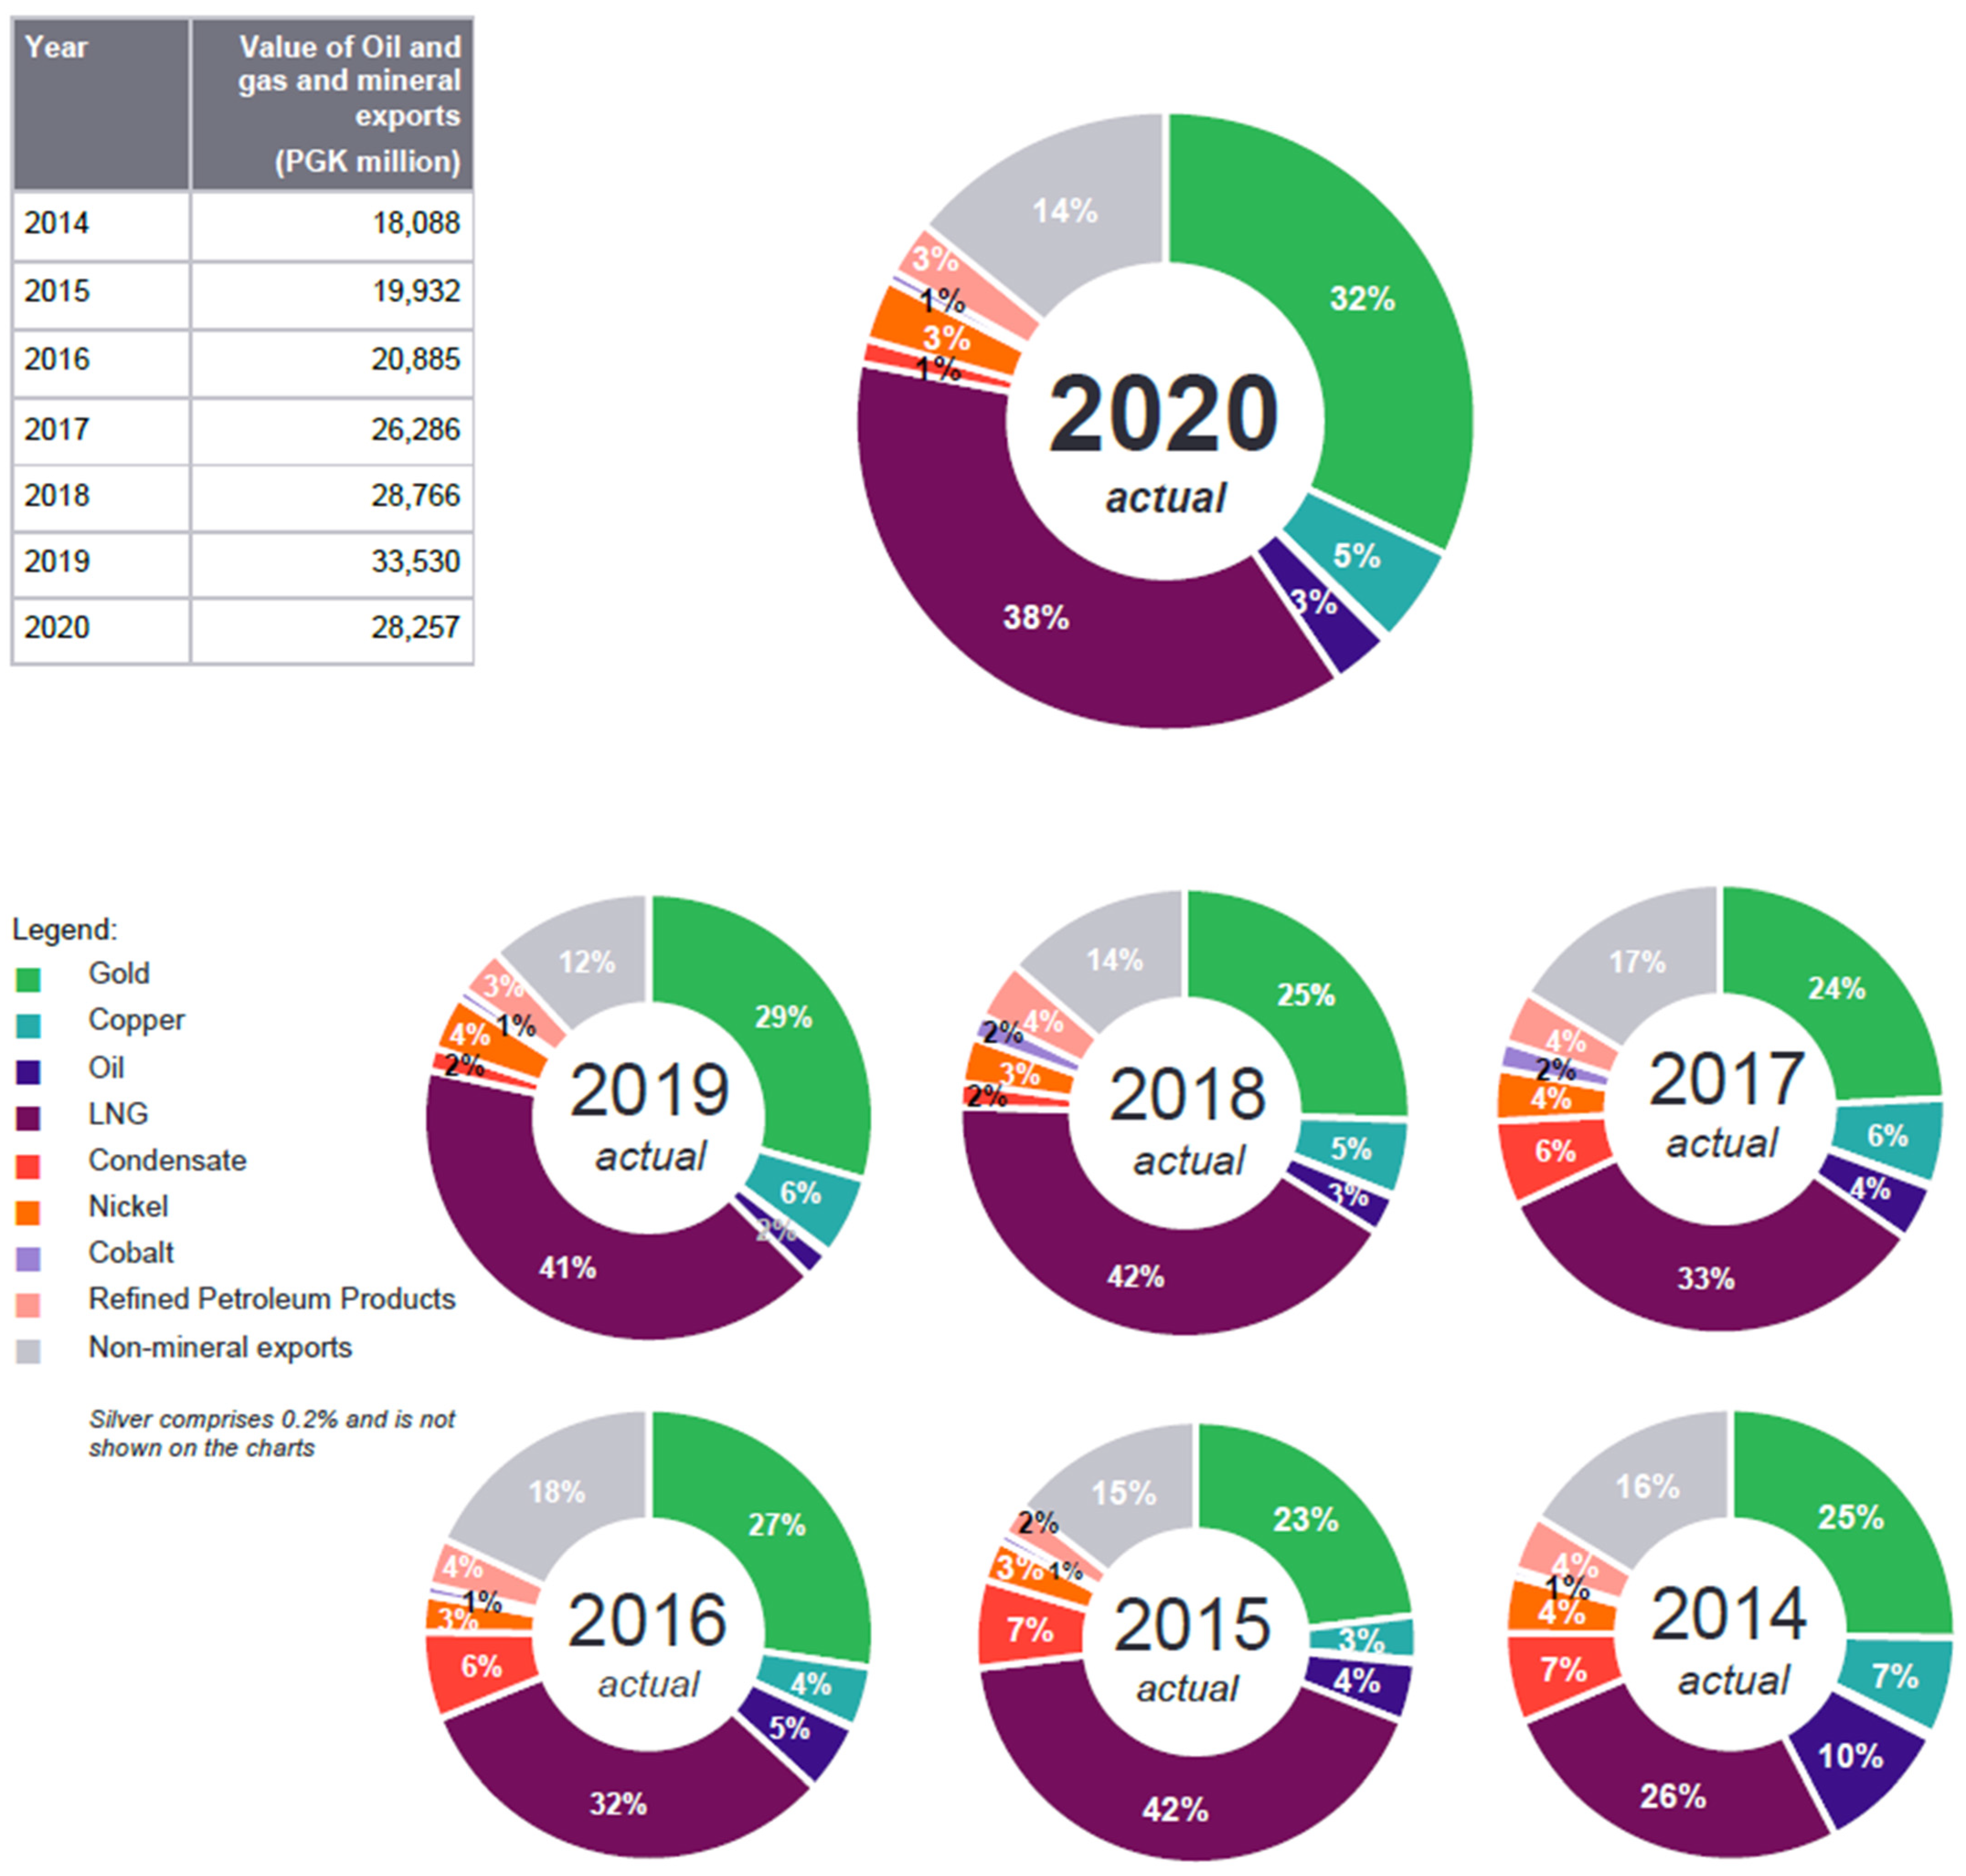
happier’ with extractive industries is a matter of perspective and can be subjective. Papua New Guinea has become increasingly economically dependent on the extractive industries (minerals, oil, and gas). The Bank of PNG’s Quarterly Bulletin, June Quarter 2022 report [
23], reported that 85% of the total export revenue came from these extractive industries, and this dependence may continue for the next 50–100 years.
PNG citizens’ lives have changed. Whether for the better or worse is subjective to a degree, although hard data and global comparisons help to form evidence-based conclusions. There is a general increase in the purchasing power experienced by many citizens receiving monetary benefits from various payments that can be ultimately attributed to extractive industries. Landowners have successful companies operating in PNG and overseas, which were started through extractive industry wealth. Companies such as the IPI Group of companies from the Porgera mine and the Anitua Group of companies from the Lihir mine are two example consortiums. Trans Wonderland Ltd. from the Hides Gas Project has successful business in PNG and overseas, and there are many smaller companies successfully operating businesses in Papua New Guinea. Whether the proceeds from these companies have benefited the local communities and in what form is a matter for further studies to verify.
Large mines have operated in Papua New Guinea (PNG) since the early 1970s, when the Panguna copper mine started producing copper concentrate on the island of Bougainville in 1972 (
Figure 8). A few other mines followed shortly after Panguna. Ok Tedi copper mine commenced operations in the Western Province in 1984, the Porgera gold mine in Enga Province in 1990, and the Lihir gold mine in New Ireland in 1997 (
Figure 8). Along with the larger mines, smaller mines were also commissioned, such as the Misima gold mine (1989) in the Milne Bay Province, Tolukuma gold mine (1995) in the Central Province, the Simberi gold mine (2008) in the New Ireland Province, and the Ramu nickel-cobalt mine (2012) in the Madang Province (
Figure 8). These mines have contributed between 80% to 90% of PNG’s total export earnings, and about 29% of the Gross Domestic Product (GDP) of the country [
24]. Since 1989, the country has seen the closure of Panguna (through civil unrest), Misima, Tolukuma, and more recently, Porgera (non-renewal of license). These closures have had significant impacts on the economic wellbeing of the country. This situation is most likely to change with the re-opening of Porgera in 2023, under new management, and the opening of new projects in the Wafi-Golpu copper-gold project area, the Woodlark gold mine, and the Freida River copper mine over the next couple of years (
Figure 8).
In the oil and gas sector, oil production in the Kutubu oil fields in the Southern Highlands Province began in 1992, peaking at 46 million barrels of oil in 1993 [
26]. The main oil fields are Gobe, Kutubu, and Moran, with the main developers being Exxon-Mobil, Oil Search, and the National Petroleum Company of PNG. Santos later joined to develop the liquified petroleum gas (LPG) at Hides, with a long-term contract to supply gas to the Porgera gold mine. By 2018, over 96,000 barrels of liquid gas had been produced from the gas field [
26], with most of it exported and some sold locally as petroleum products. In 2014, the PNG LNG plant delivered its first export of liquified natural gas (LNG).
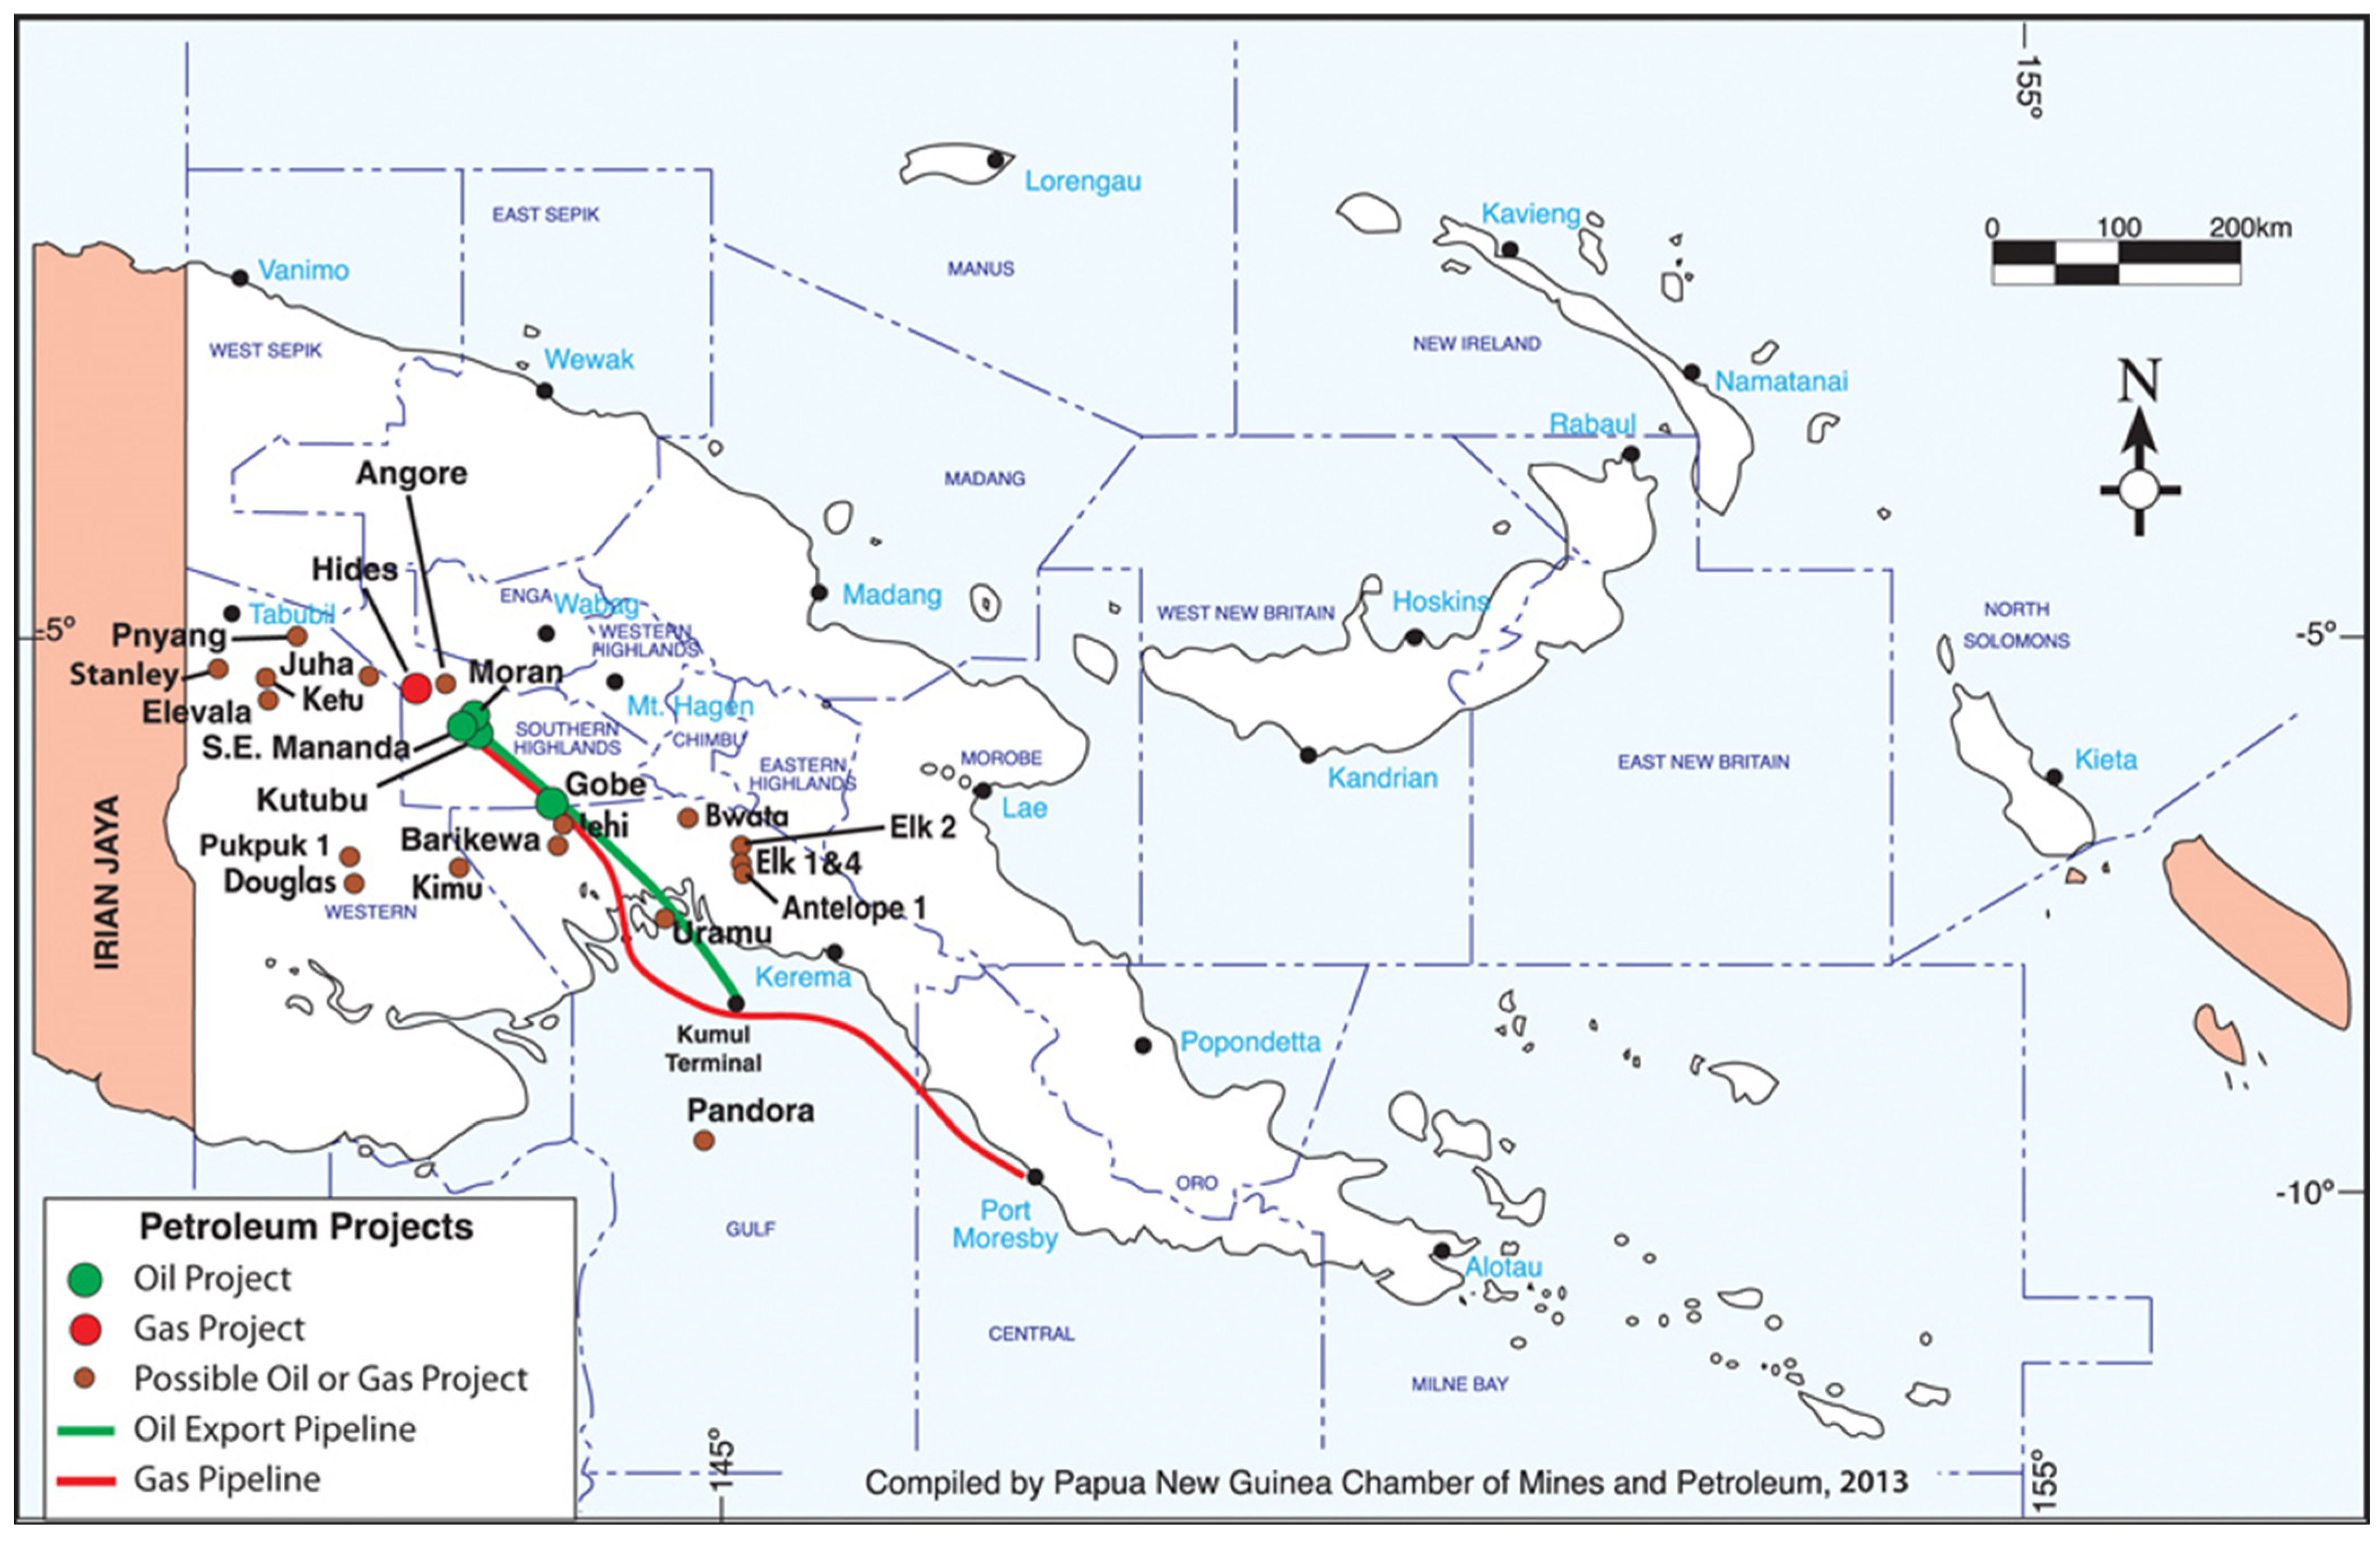
Figure 9 shows oil and gas project sites in PNG.
PNG started exporting liquified natural gas (LNG) in 2014 [
27], claiming to have contributed an average of AUD 4 billion [
28] annually over the next three decades. This is a huge contribution, considering that Papua New Guinea’s export earnings prior to 2010 were only AUD 6 billion. PNG is currently awaiting the production of its second LNG project, the Papua LNG, which has now gone into the front-end engineering design stage and is expected to go into production in 2025. More recent surveys of the benefits of PNG LNG, however, have been damning and strongly negative. The most comprehensive study of PNG’s LNG program has been by Jubilee Research Centre in Australia, who published the ‘Double or Nothing’ 2018 report [
29]. In this report, they conclude that: ‘
The only area of the PNG economy that has benefitted from the PNG LNG project is the resource sector itself. This is reflected in strong resource export growth, and an increase in the resource element of GDP. The latter means there has been a 10% increase in GDP relative to there being no project, but this is still much less than the prediction of a near doubling of GDP. On every other measure of economic welfare (household incomes, employment, government expenditure, imports, and every non-resource sector of the economy), the PNG economy currently would have been better off without the PNG LNG project, often drastically so’.
Figure 9.
Map of oil and gas projects and pipelines in Papua New Guinea. Acknowledgement: Papua New Guinea Chamber of Mines [
30].
Figure 9.
Map of oil and gas projects and pipelines in Papua New Guinea. Acknowledgement: Papua New Guinea Chamber of Mines [
30].
All these resource projects variably contribute, and have done so for decades, to the national economy through the payment of royalties, levies, dividends, and other forms of payments, such as scholarships, development grants, and infrastructure development programs. These contributions could, if properly translated, add to the wellbeing and happiness level of the country, significantly contributing to the national economy through the payment of royalties, special support grants, infrastructure development grants, levies, dividends, and other forms of payments, such as scholarships and other community assistance schemes [
24]. The level of impact that these resource projects have on the surrounding communities, and subsequently, the nation, varies for each resource project. Resource landowners mostly have a say in how benefits from resource projects are distributed, through the development forums, although transparent and equitable movement of EI-related benefits can be difficult to track. Development projects that contribute to the overall improvement of the national economy, such as roads, are negotiated in the project agreement stage. Projects that have a direct impact on the surrounding communities are often delivered by project companies as part of their community social responsibility (CSR). This approach, over the recent past, has become part of the company operational costs, as a means of not only delivering sustainable development at the community level but also because it has become a global practice [
31]. Some authors argue that because it has become a global practice, the benefits of CSR have become more for the benefit of the company, and not so much for the communities. An example of a specific common challenge resource projects face is the enforced relocation of people out of the extraction sites to new areas in order for the resource project to commence. These are contentious, emotional issues to manage. Porgera, in its early days, had to relocate up to 4000 people [
32]. For Panguna and Lihir, up to 300 families were permanently relocated and resettled in nearby villages [
32]. The introduction of a cash economy in mining areas is also a challenge to communities previously not used to the cash economy. Communities who previously were reasonably equal economically began to split into the “haves and have nots”, seriously defragmenting the usually tight-knit Melanesian families.
With the abundance of natural resource projects currently contributing to the national economy, one could assume that levels of poverty at a national level would be significantly reduced. However, there appears to be limited evidence that this is so [
31]. Filer [
32] examined in detail the upsides and downsides of EIs in PNG, concluding that while revenues, employment, local community schemes, limited infrastructure improvements, and related areas are examples of the upsides, corruption, lack of transparency, weak institutions and governance, and discontent in the community with respect to inequitable rewards are parts of the downsides. The 2014 UNDP National Human Development Report [
14] discussed above confirms and further develops the findings of Filer.
It is apparent from the discussions above that the overall issues related to the relative contributions of extractive industries within PNG, and from there to a putative ‘national happiness’, are complex and dynamic.
Figure 10,
Figure 11 and
Figure 12 are from two economic and social analyses, by Banks and Namorong [
33] and Callan [
31], respectively, illustrating aspects of the complexity and dynamism. Banks and Namorong [
33] reported that mineral resource exports spiked upwards and downwards from as low as Kina 1 billion to as high as Kina 25 billion, with government resource revenues varying between <Kina 1 billion and c. Kina 4 billion (
Figure 10). The highest relative contributions in their report [
34] were gained from group tax (34%), equity distributions (19%), dividends (12%), and royalties (11%) in 2016. Between 2009 and 2011, Banks and Namorong noted that the largest contributions to corporate social benefits by four of the largest extractive industry companies were gained from payments to national and provincial governments and development authorities (dividends, royalties). However, more recent trends are reported by the Extractive Industries Transparency Initiative PNG Report, 2020 [
26] (
Figure 11 and
Figure 12), with direct contribution to the GDP of 26%. In 2020, the extractive industries (mining and oil and gas) alone constituted up to 86% of the total exports [
26].
Banks and Namorong [
33], analyzing the variations in income from extractive industries and the relative successes in translating mineral wealth into national development, concluded that there had been significant gains in increasing the localization of labor and services, thus directly contributing to the economy. Some tax/dividends initiatives, however, such as the infrastructure tax credit, which allowed companies to offset other payments if they directly contributed to, and managed, the development of local infrastructure (roads, amenities, governance, and administration), were considered only partially successful, as transparency in this area was of variable quality. Banks and Namorong [
33] suggested that the legislation brought about by PNG’s Sovereign Wealth Fund, but which had thus far not been enacted, was a mechanism for managing the ‘spikiness’ of variable extractive industry income and setting up a ‘development’ bank for future generations. Callan [
31] analyzed three years of published data from four of the larger extractive industries in PNG, which showed that companies had engaged in several initiatives for direct interventions in corporate and social wellbeing at community and higher levels. Some projects were successful, while others were less so or required more data and analysis to be definitive. Callan [
31] suggested, for example, that the transfer of funds directly to communities, which left out key community stakeholders, such as women, was an unlikely mechanism for development success. Overall, Callan [
31] concluded:
‘This case study confirms the significant contributions to development in Papua New Guinea of mining companies’ tax and other government payments. Mining company procurement is also an important market for other PNG businesses. And although numbers directly employed in mining are modest, mining supports many jobs in other sectors, provides training and work force skills, and leads to remittances that are available for social and economic investments in communities across Papua New Guinea. However, the potential development benefits from mining company contributions are undermined by poor government capacity to convert revenue into basic infrastructure and services, and weak accountability and often poor performance by development authorities and landowner organizations’.
In the following paragraphs, we provide some observations on the socio-economic status of communities living around large resources projects in Papua New Guinea, with a view that their current status will give an indication of their level of happiness. These projects were selected as the case projects for this paper since they contribute the highest levels of economic returns for the country annually.
4.1. Panguna, Bougainville Island
The Panguna copper mine on Bougainville Island was at one stage the biggest copper mine in the world. Its development in the late 1960s was important to Papua New Guinea, which was preparing itself for political independence from Australia [
33]. The mine was owned and operated by Bougainville Copper Limited (BCL), a wholly owned subsidiary of Rio-Tinto [
35]. When it was operational, the Papua New Guinea Government took up a 20% share of equity in BCL. During its operations from 1972 to 1989, BCL earned approximately Kina 5.2 billion in mineral exports [
35]. From this earning, it paid in excess of Kina 1.5 billion to both the Papua New Guinea National Government and the local Bougainville Government, known then as the North Solomons Provincial Government [
35]. The mine was shut down by local landowners in 1989, initially because of environmental damages [
36], but more so due to the stresses caused by economic inequality between the multicultural communities living around the mine site [
34]. With no proper mechanism for grievances to be heard, no proper landowner identification process, and unequal distribution of what was left to distribute [
36], many landowners were frustrated, eventually leading to an armed forced closure of the mine. The fighting claimed up to at least 20,000 Bougainvillean lives and the displacement of up to 100,000 of the 250,000 population at that time [
37]. Regan [
38] reported that during the compensation and royalty payments, a new concept for locals, these locals did not understand the scale used and what the future would be. This in turn eventually contributed to the communities’ increased unhappiness, as it became more clear with time. Prior to the mine closure, Bougainville was ranked at the top of the then-19 established provinces, in terms of social development indicators [
39]. Bougainvilleans had a higher life expectancy than other Papua New Guineans, a lower infant mortality death rate than the national average, and a high rate of enrollment in schools compared with elsewhere in Papua New Guinea. Most of these favorable ratings were attributed to the province being richer than the other provinces of Papua New Guinea. However, it is interesting to note that this wealth was not only because of the Panguna mine, but also because of the cocoa and copra plantations that the island had during that time [
40]. In fact, the report indicates that the average copra producer then was earning a much higher income than people living within the Panguna mine who were earning mine royalties.
This example portrays a scenario where the community’s higher socio-economic rating was not so much attributed to the mine. On the contrary, the mine was the source of civil unrest that led to the destruction and the deterioration of the socio-economic base that was established through the non-mining sector. There were benefits in the establishment of institutions, such as the Bougainville Copper Foundation (BCF), which were instrumental in educating many local people from the surrounding villages. The Bougainville Copper Foundation (BCF) was also instrumental in building and maintaining the best hospital in the country (the Arawa General Hospital) and training a lot of mine apprentices (Arawa Technical College), who were eventually employed by other mines in the country and abroad.
4.2. Ok Tedi, Western Province
The Ok Tedi copper mine in the Western Province is the country’s main copper producer. Production commenced in 1984, just a few years before Panguna mine ceased operations in 1989. Its shareholding has changed several times since the mine began operations, with the latest change in 2013 when it became a 100% state-owned mining operation by the Papua New Guinean Government, when the state increased its interest up to 87.8% [
41,
42]. To date, the Ok Tedi copper mine has been in operation for almost four decades, and it has been estimated that it will cease operations in 2032, in which case it would have been in operation for almost five decades. Possibly the biggest environmental impacts the mine has caused relate to tailings’ disposal within the Fly River system [
43]. A precedent for riverine tailings’ disposal was set with Panguna Mine. Ok Tedi was also permitted by the National Government to dump its tailings directly into the Fly River. This action had an immediate effect, leading to significant decline in fish stocks [
43] in the river system, and fauna degradation along the banks [
44], thus significantly adversely impacting the food chain and livelihood of the local communities. This was a serious environmental issue, which BHP, the then-operator of the mine, was forced to report on. The increasing public outcry, and various litigation cases spanning 1992 to 1996 [
43], caused increasing public embarrassment to BHP. The Western Province is often the worst-affected PNG area during El Nino-induced droughts and other long periods of dry seasons. The province leads statistics in high incidences of malaria and tuberculosis. A commissioned Ok Tedi report in 1995 noted that medical services in the North Fly District, which hosts the Ok Tedi mine, were in a dilapidated state by 1990 [
45], with high incidences of malaria and tuberculosis. The lack of medical attention over many years led to the province having the highest incidence of drug-resistant tuberculosis in 2014 [
46]. To date, this situation has not improved, with the local population often crossing the international border to seek medical help either in Australia or Indonesia. Communities living close to the mine experienced increased population growth rates due in part to the higher exposure to cash [
47]. An increasing population around mining areas is a common social phenomenon, possibly related to inward migration into the local communities, in search of better opportunities. The Ok Tedi mine established an institution—the Ok Tedi Development Foundation—aimed at delivering socio-economic benefits to communities affected by mining operations. While the foundation has been successful in delivering socio-economic projects on the ground, its development interventions have shown little impact at the family level [
48]. Poverty levels continue to remain high [
49]. Eventually, because of the increasing pressure, BHP sold its rights to the PNG Government in 2002 and exited the project, leaving the PNG Government and the PNG Sustainable Development Program (PNGSDP) Limited, the majority shareholders of the project, with the opportunities and challenges associated with the mine and its environmental legacies. The PNGSDP is registered in Singapore and all funds are kept there.
4.3. Lihir, New Ireland Province
The Lihir gold mine in the New Ireland Province is the country’s largest gold producer, and in recent times, has been among the top five gold-producing mines in the world [
50]. It commenced operations in 1997 and was initially thought to have a putative mine life of c. 30 years; however, according to Newcrest Mining’s Annual Report for FY23, mining could extend beyond 2031 [
51]. The Lihir gold mine is one of four mines in Papua New Guinea that employs deep sea tailings placement as a means of disposing its mine waste.
According to Filer [
32], Papua New Guinea had developed a terminal case of the ‘resource dependency syndrome’. From a ‘happiness’ perspective, the impacts for Lihir people have been variable, including a shift in their value system with respect to what makes them personally ‘happy’. Bainton [
52] argues that the local community developed a false sense of wellbeing, connecting a new resource-rich environment with higher expectations of the socio-economic benefits. Traditional Lihirian cultures had different worldviews linked to traditional lifestyles. Modern Lihirian culture and values have been changed as a result of mining operations: people now correlate success and ‘happiness’ with modern materialism [
52].
In 2017, the Synergies Consulting Group was commissioned by the mining company Lihir Gold Mine under its Strategy and Government Reviews framework to undertake a socio-economic impact survey on the tangible benefits the mine had on the surrounding local community, province, region, and country [
53], GDP per capita, the Human Development Index (HDI), health, education, and income per capita. The report concluded that the mine significantly contributes to the national as well as the local economy, with the mine producing a gross output of PGK 6696M annually, contributes 7% to the national economy, boosts regional wages, rent, and profits by PGK 2895M, contributes approximately PGK 1 billion through taxes, and has created over 4000 jobs. The study also found that the mine has been primarily responsible for lifting the per capita GDP for local Lihir people to an estimated PGK 54,000.00, which is 7 times higher than that reported by the World Bank for the rest of PNG at PGK 7000.00. The social benefits they highlighted included improved life expectancy, adult literacy rate, and basic education by providing a range of community infrastructure, health, and education programs, although other authors argue that the mining operations have created more problems than benefits [
54].
4.4. Porgera, Enga Province
The Porgera gold mine, Enga Province, commenced gold production in 1990, and is the country’s second largest gold producer after the Lihir gold mine. When it started operations, Porgera gold mine was owned by Porgera Joint Venture (95%) (Placer Dome Asia (50%), Goldfields Ltd. (25%), and Orogen Minerals (PNG) (20%)) and Mineral Resources Enga (MRE) (5%) [
55]. By 1993, Porgera gold mine was the largest gold mine in the Australasian region [
55]. Before it went into care and maintenance in 2020, the major shareholders of the mine were Barrick Niugini Limited (47.5%), Zijin (47.5%), and Mineral Resources Enga (5%). It is anticipated that when the Porgera mine reopens, MRE will have a higher share in the mine.
As a mine, Porgera gold mine significantly contributes to the economy in terms of taxes to the state and royalty and compensation payments to landowners [
55]. Up until the time it went into care and maintenance, the Porgera mine would have paid in excess of Kina 3.3 billion in taxes and over Kina 500 million in royalty payments [
56]. The Porgera mine, similar to all other operational mines in PNG, pays a production levy to the Mineral Resources Authority, as required by the Mineral Resources Authority Act 2018. Resentment toward the mine was recorded as early as the construction phase, with the local Ipili tribes not being properly educated/made aware/consulted with respect to the process of resettlement and about permanently losing their land to mining [
56]. The level of crime began rising as ‘immigrants’ started to move into the mining township of Porgera. There was an insufficient provision of schools and aid posts to serve the local population. These services were later introduced by the mining company. However, the services were disruptive, due to ongoing landowner tribal fights and increasing crime levels, and with public servants venturing into mining activities in the neighboring Mt. Kare [
57]. The mine uses the riverine tailings waste disposal method, similar to Panguna and Ok Tedi. The tailings discharged into the upper Strickland River flow south and join the Fly River, which also carries riverine tailings from the giant Ok Tedi mine, before flowing into the Gulf Province [
55]. This has been the major contentious environmental issue of the mine, with its impact being felt by communities living along the two major river systems in the country. Although the operator, Porgera Joint Venture, reported environmental compliance in its Annual Report in 2019 [
58], it did, however, note a “moderate” mine-related environmental impact in 2019 within the Porgera and Lagaip Rivers.
To improve the socio-economic conditions of ordinary Porgerans, money paid in taxes is used by the national government to build schools, hospitals, roads, bridges, and other socio-economic interventions that will improve the communities’ wellbeing. While the national government may have been able to deliver many of these services over the years, tribal fights and other social ills have continued to plague the Porgera valley [
59]. The rising crime rate indicates unhappiness and discontent with respect to the current state of affairs in the area. In 2020, the Porgera mine was placed on care and maintenance after the national government refused to extend the mining license of the operator, as they were dissatisfied with the mine’s continued non-compliance with the conditions of the mining license. Upon its resumption, the Porgera mine may only have a life of 10 years, after which time the mine will cease to operate.
4.5. The Oil Fields, Southern Highlands
The oil fields of the Southern Highlands Province started flowing oil in 1992 [
60]. Despite decades of oil export, communities around the production area express a discontentment that they have not progressed from their pre-oil extraction subsistence way of living [
60]. Some argue that nothing has progressed in terms of enhancing the social and economic wellbeing of the local people. Other studies have suggested that health statistics appear to have improved soon after the development of the oil fields commenced, thanks mostly to budget appropriations by the developer [
61]. Before the development of the oil fields, the Southern Highlands Province ranked the lowest in all health statistics. Malaria continues to be a challenge in the oil field areas, with the most frequent sources of medicine being provided by the Marasin-Stoa-Kipa [
62] at a rudimentary level. The literacy level in the province continues to linger below the 50% rate, with the Nipa/Kutubu District trending around 30–35% [
60]. Bourke et al. [
63] noted social issues relating to resettlement of local landowners during construction of the PNG LNG’s gas conditioning plant, new airfield, and pipeline corridor in Hela Province. The project developer rolled out socio-economic educational training programs for the resettled locals, enabling positive financial gains and access to entrepreneurial life skills that resulted in social status changes in society for women especially, who would normally depend on men for financial support.
Despite the many benefits that Papua New Guineans enjoy from the resources that have been developed since pre-independence, Papua New Guinea as a country remains relatively poor. These resources have not led to the hoped-for nation-wide improved standards of living, measured economically and socially, although they have provided PNG with large volumes of monetary resources, and had variable local successes with respect to corporate and social development.
6. Summary Statements and Implications for Geoscientists
This paper has reviewed a range of commonly assessed metrics that analyze and score countries on the basis of economic, societal, psychological, governance, and human rights/personal freedom parameters. The general conclusions with respect to Gross National Happiness (GNH) are linked to reasonable personal living standards coupled with fair and just governance, equitable wealth distribution, and wide degrees of freedom with respect to human rights. We then asked the question: where do extractive industries and the wealth they generate fit into the Gross National Happiness paradigm? We examined a wide range of evidence from global statistics, Papua New Guinea case studies, and experiences in Jamaica, the DRC, and Mongolia. We conclude with the following statements:
It is possible for a country to achieve high scores with respect to GNH and conduct significant extractive industry operations as a part of the national economy. Finland, the USA, Canada, Australia, Mongolia, Kazakhstan, and numerous South American and Middle eastern countries provide evidence for this.
The ‘common assumption or perception’ that high levels of extractive industry and the generated wealth must translate to higher levels of GNH is a delusion. There are many examples of a lack of correlation between GNH and extractive industries from local to national to continental scales.
Hydrocarbon-rich countries have made more progress, generally speaking, with respect to GNH than mineral-rich countries.
The extractive industry must work in genuine democratic, mutually respectful partnership with governments, institutions of governance and regulation, and communities to firstly strengthen holistic governance, which in turn will increase the probability of EI-generated wealth translating to increased scores of GNH. If in-country governance is not addressed as a corporate priority, some studies indicate that the benefits of EI are minimal to negative, with the possibility of the social license to operate being denied.
Passive approaches to improving the translation of extractive industry-generated wealth, such as the Extractive Industry Transparency Initiative (EITI), are useful for developing data, baselines, and monitoring purposes. They are not particularly effective, however, in directly translating extractive industry wealth into GNH. If they were, they would demonstrate a measurable positive impact on GNH scores in all countries that have signed up to passive approaches such as EITI. This paper clearly showed that this is not the case.
Countries that have developed more sophisticated mechanisms of ‘democratizing’ issues around extractive industries, enabling/influencing decisions to occur from the grass roots level through to local and national governance levels, have a higher probability of translating extractive industry wealth into GNH than those countries whose ‘democratizing’ approaches are limited. As noted above, the companies working respectfully with governments, institutions, and communities can optimize the GNH and increase the possibilities with respect to EIs. Additionally, countries with strong centralized state controls can strongly influence the translation of EI-generated wealth into increased GNH, if this forms a part of their governing philosophy.
There are examples at a local scale of extractive industries significantly improving the GNH of the local communities; usually, this is the case when industry has taken a proactive role.
Industry must play a far more active role in translating its activities into local, regional, national, and global GNH. An overly concentrated focus on company profit and shareholder return can never accommodate the holistic, sophisticated approaches that GNH proposes, or the positive outcomes it promotes. In most ways, the profit and shareholder return approach is the antithesis of GNH as it is narrowly focuses on the successful outcomes of the elite few. The key conclusion of this paper is that industry must partner far more effectively and actively with all other partners involved in extractive industries and widen the scope of ‘success’ to fully integrate, in meaningful and measurable ways, the paradigm of GNH.
What are the potential implications for geoscientists from this study?
Figure 16 explores aspects of this based on the ‘interconnected paradigm’, as espoused by Petterson [
84]. Interconnected geoscience (
Figure 17) asks the geoscientist to go beyond a narrow definition of the role of the geoscientist and to view themselves within an interconnected world: a world influenced by the thinking and actions of the geoscientist [
84]. Developing the conclusions above, for example, it is apparent that many geoscientists, whether at the exploration or production/on-site extraction stage, have numerous interactions with local communities. A healthy mutual respect is essential for successful and sustainable extractive industry progress in any region. If, for example, a geoscientist finds themselves within a culture different to the one they were conditioned within, the development of an increased understanding and respect for local worldviews, cultures, and values is a vital approach. Healthy co-communication and co-sharing of knowledge helps build a mutually trusting relationship. A detached and realistic analysis of how the extractive operation in which the geoscientist operates can optimally benefit the local, regional, and national communities is optimal. As geoscientists become increasingly influential within the management structure of an extractive industry, their interconnected approach can open conversations and direct decision-making. A reduction of any ‘us and them’ culture between company and community can only be of mutual benefit. Consideration of issues such as localization of skills, increasing employment opportunities, profit sharing, and investing in local socio-economic wellbeing are practical approaches to a more harmonious co-existence. Geoscientists can take up the challenge of becoming more involved in these wider issues. Increasingly in ‘western’ countries, even for those with a tradition in extractive industries, a culture of anti-extractive industry and a lack of social acceptance of mining is increasing [
26]. This, in turn, influences the choice of young people in future careers, many of whom are disincentivized to study geoscience, linking it with a ‘dirty’, ‘polluting’, and ‘socially divisive’ industry [
42]. If geoscientists adopted a more open pan-disciplinary and interconnected approach, along with their essential core skills and knowledge, there would be a range of downstream benefits, including an enhanced societal image of extractive industries, a louder and more influential voice in company decision-making, and a likely improvement in happiness scores at local, regional, and national/international scales.


 ,
, 


