Abstract
Verification of the C-band geophysical model functions (GMF) for the open ocean and the Gorky reservoir was carried out using Sentinel-1 IW-mode Synthetic aperture radar (SAR) images. CMOD5.N, CMOD7, GMF for the Caspian Sea, and CSARMOD2 were considered. The motivation for this study is concerned with the clarification of applying C-band GMFs for SAR images including for the conditions of inland water bodies, as well as with the study of the influence of various wind speed direction sources on the results of wind speed magnitude retrieval for ocean conditions. Comparison of wind speed from the CMOD5.N algorithm using wind direction data from NOAA NDBC oceanographic buoys together with the data provided by NCEP reanalysis data showed that regardless of the geographic location, the result does not depend significantly on the choice of the wind direction source. Novel results of CMOD5.N, CMOD7, GMF for the Caspian Sea, and CSARMOD2 applications to the conditions of the Gorky reservoir are presented. The comparison of these results with the meteorological station measurements showed the best agreement for CMOD5.N. The preliminary results on the construction of new C-band GMF adjusted to the Gorky Reservoir have shown statistical parameters better than for Caspian Sea GMF and CSARMOD2.
1. Introduction
SAR images of the Earth’s surface from spacecraft are one of the most important sources of information about the state of the subsurface layer of hydrosphere objects and the atmospheric boundary layer above them [1]. Unlike images in the optical range, microwave remote sensing can be performed regardless of the daytime and weather conditions. It should be noted that earlier SAR images were not publicly available (see, for example, data from Radarsat-1/2 or Terrasar-X), but at the present time, the new Sentinel-1 A/B mission makes it possible to obtain images free of charge with relatively small time delays.
One of the most important characteristics of the meteorological state is the surface wind speed (usually at a height of 10 m). Numerous attempts to retrieve the wind speed over the sea surface in a wide range of geophysical and geographical conditions have been carried out for the last 30 years and are still an urgent problem [2,3,4,5]. One of the main tools involved in solving this problem is active remote sensing using satellite-based microwave scatterometers and SAR. Since these instruments measure the backscatter on the sea surface covered with wind waves, and not the wind speed directly, so-called geophysical model functions have been proposed relating the characteristics of the microwave backscatter to the wind speed. The construction of these functions becomes possible since the amount of backscatter depends on the roughness of the water surface and as a result the wind surface stress (or the wind friction velocity) [6,7], which is related to the wind speed at a height of 10 m in the framework of the Monin–Obukhov theory [8]. Currently, for low and moderate wind speeds, geophysical model functions developed for the C-band are widely used: CMOD4 [9,10], CMOD5 [11], CMOD5.N [12], CMOD_IFR2 [13], CMOD7 [14]. CMOD4 was developed on the basis of ERS-1 data [9] and relates the NRCS of the sea surface to the wind speed, incidence angle and the angle between azimuth angle and wind direction. However, CMOD4 demonstrated the existence of biases in the range of low to moderate winds [15] and a significant underestimation of wind speed values due to saturation of backscatter for extreme wind speeds [10]. The above problems served as an impetus for the improvement of this model, resulting in CMOD5 developed on the basis of adding up more than 22,000,000 collocations from ERS-2 scatterometer backscatter and ECMWF wind speeds for the period from 1 August 1998 till 31 December 1998 which nevertheless also had noticeable biases. The next step was the development of CMOD5.N model on the base of CMOD5 and the refit of 28 coefficients which, unlike its predecessors, made it possible to obtain neutral wind speeds [12]. As a result of verification on the basis of ERS-2 and ASCAT data the CMOD5.N function was constructed from the condition that the model function for neutral winds should give the wind speeds 0.7 m/s stronger than those obtained from CMOD5 for all wind speeds and incident angles. The proposed bias accounts for the stability correction (0.2 m/s) and the bias 0.5 m/s from CMOD5 itself [12]. At present CMOD5.N is successfully used for the wind speed retrieval from the backscatter measured by the scatterometers using corrections provided by the Numerical Weather Prediction model (NWP) [16,17,18]. The CMOD7 was developed on the basis of ERS and ASCAT scatterometer data to avoid the mismatch for CMOD5.N in the range of low winds which helped to improve its performance for the ASCAT data [14].
All of the above models were developed mainly using data from scatterometers, nevertheless, there were numerous attempts to use these models to retrieve the wind speed from SAR data [19,20,21,22,23,24,25,26,27,28,29,30,31], some of which were made for the Radarsat-1,2 satellites [28,29,30,31]. At the same time, geophysical model functions C-SARMOD and C-SARMOD2, directly based on the accumulation of SAR data from Radarsat-2 and Sentinel-1 satellites, collocated with data from buoys were developed [32,33]. The biases given by the C-SARMOD geophysical model function were compared with the results of calculations in the framework of CMOD5.N and showed that in the range of low winds the errors according to the C-SARMOD were smaller, while for the entire range of incidence angles for the moderate winds they had values higher than the errors for CMOD5.N. In this regard, the question of which of the existing models is the most suitable for wind speed retrieval from SAR imagery remains open. In addition, in order to correctly retrieve the value of the wind speed based on the family of CMOD models, it is necessary to obtain information about the wind speed direction, which is usually obtained from external sources (for example, buoys or reanalysis data). At the same time, it is necessary to have an understanding of which of the sources is more adequate in terms of correct wind speed retrieval. In this regard, in the first part of our study, we made an attempt to analyze the wind speed values obtained using the CMOD5.N model applied to the SAR data from the Sentinel-1 satellite for various geographic locations. In this case, the wind direction was taken from the data from the NDBC buoys and from NCEP data to assess the influence of one or another measurement source on the result of wind speed retrieval.
It should also be noted that all existing models of wind speed retrieval based on remote sensing data were created for open ocean conditions, while some of the buoys used for the model calibration were located in shallow water conditions. Thus, this may suggest that these models might be relevant for inland water bodies. However, the issue of their applicability to inland water bodies remains unexplored. At the same time, this algorithm, as applied to wind speed retrieval from SAR data, in the case of inland seas, lakes or reservoirs could be very useful due to a significantly higher resolution than that of scatterometers. These wind speed data for inland water bodies are very important for monitoring and predicting high-resolution weather conditions, which have recently become an increasingly urgent task [34]. It should also be noted that remote sensing from the Sentinel 1 A/B satellite is carried out more often for the land surface than for the open ocean conditions, which causes a sufficient amount of data for inland waters. However, there is still a very small number of studies containing attempts to retrieve the magnitude of the wind speed over lakes, inland seas and reservoirs from SAR data. In particular, attempts to retrieve the wind speed based on the use of SAR images for a number of lakes from Hungary and Austria (Salzkammergut, Neusiedl and Balaton lakes), obtained from the Sentinel-1 satellite mission, were madein [35]. The authors proposed the empirical relationships between NRCS and the wind speed for VV and VH polarizations represented by exponential functions. SAR data were calibrated using the measurements from the meteorological station. However, it has been shown that there are some differences between the results for the ascending and descending orbits.
The study presented in [36] included an application of geophysical model functions CMOD7 and C_SARMOD2 for the southern Caspian Sea to the Sentinel-1A VV SAR images based on comparison with 25 km standard resolution reanalysis data. It was demonstrated that CMOD7 showed the smallest RMSEs compared to C_SARMOD2 which gave errors in the area of low wind speeds. However, it should be noted that on the one hand the vast majority of inland water bodies, including large ones, have scales much smaller than the resolution of reanalysis data used in [36] for the verification, on the other hand, the advantage of SAR images over high-resolution scatterometer measurements was not used. So in general inhomogeneities in the surface conditions typical for inland water bodies might adversely influence the result of wind speed retrieval which is a noticeable problem for the lake cases.
Despite rare attempts to apply geophysical model functions developed primarily for oceanic conditions to inland water conditions, the question of which model is more adequate in this case remains open. So the cross-verification of CMOD algorithms for Sentinel 1 A/B SAR images based on comparison with the results of numerical modeling of the meteorological situation at these objects is still an actual problem.
In the present study, we have validated and verified the C-band GMFs (CMOD5.N, CMOD7, CSARMOD2 and the GMF from [36]) model both for the conditions of coastal ocean zones (and open ocean), including a wide range of geographic locations, and for the conditions of an inland water body using the example of the Gorky Reservoir. The paper is organized as follows. In Section 2 the main instruments and datasets for the analysis were described. Section 3 contains the verification results of C-band GMFs (CMOD5.N, CMOD7, CSARMOD2 and the GMF from [36]) using buoy measurements for ocean conditions. When applying the CMOD5.N model to ocean conditions, estimates of the sensitivity of the results to the choice of a wind speed direction data source based on measurements from oceanographic buoys or reanalysis data were made. The results of verification of the CMOD5.N algorithm for inland water conditions using the example of the Gorky Reservoir and its comparison with the calculations using other C-band models (CMOD7, CSARMOD2 and the GMF from [36]) are reported in Section 4. A procedure of new C-band GMF construction applicable to inland waters (in particular to Gorky Reservoir) is reported in Section 5. The model is based on calculations using a two-scale model of the scattering of electromagnetic radiation on a rough sea surface with the Elfouhaily spectrum.
2. Instruments and Datasets
2.1. Satellite Data
In the present study, we analyze images from C-band SAR based on the board of the Sentinel-1 satellites (S1) downloaded from https://scihub.copernicus.eu/dhus/#/home accessed on 15 August 2023. The Interferometric Wide swath mode (IW) was selected as it provides a good resolution together with a large area (250 km in the range and 200 km in the azimuth direction) and regular ocean surface survey.
For the ocean wind speed retrieval, we used S1 IW GRDH (Ground Range Detected High-resolution) level-1 products for HH or VV polarization that has been calibrated and thermal noise removed. The geographic location of the SAR images was chosen in such a way that, first, they could be collocated in time and space with oceanographic buoys, and, second, only those areas were considered where images could be obtained regularly during the year—on average, once every two weeks.
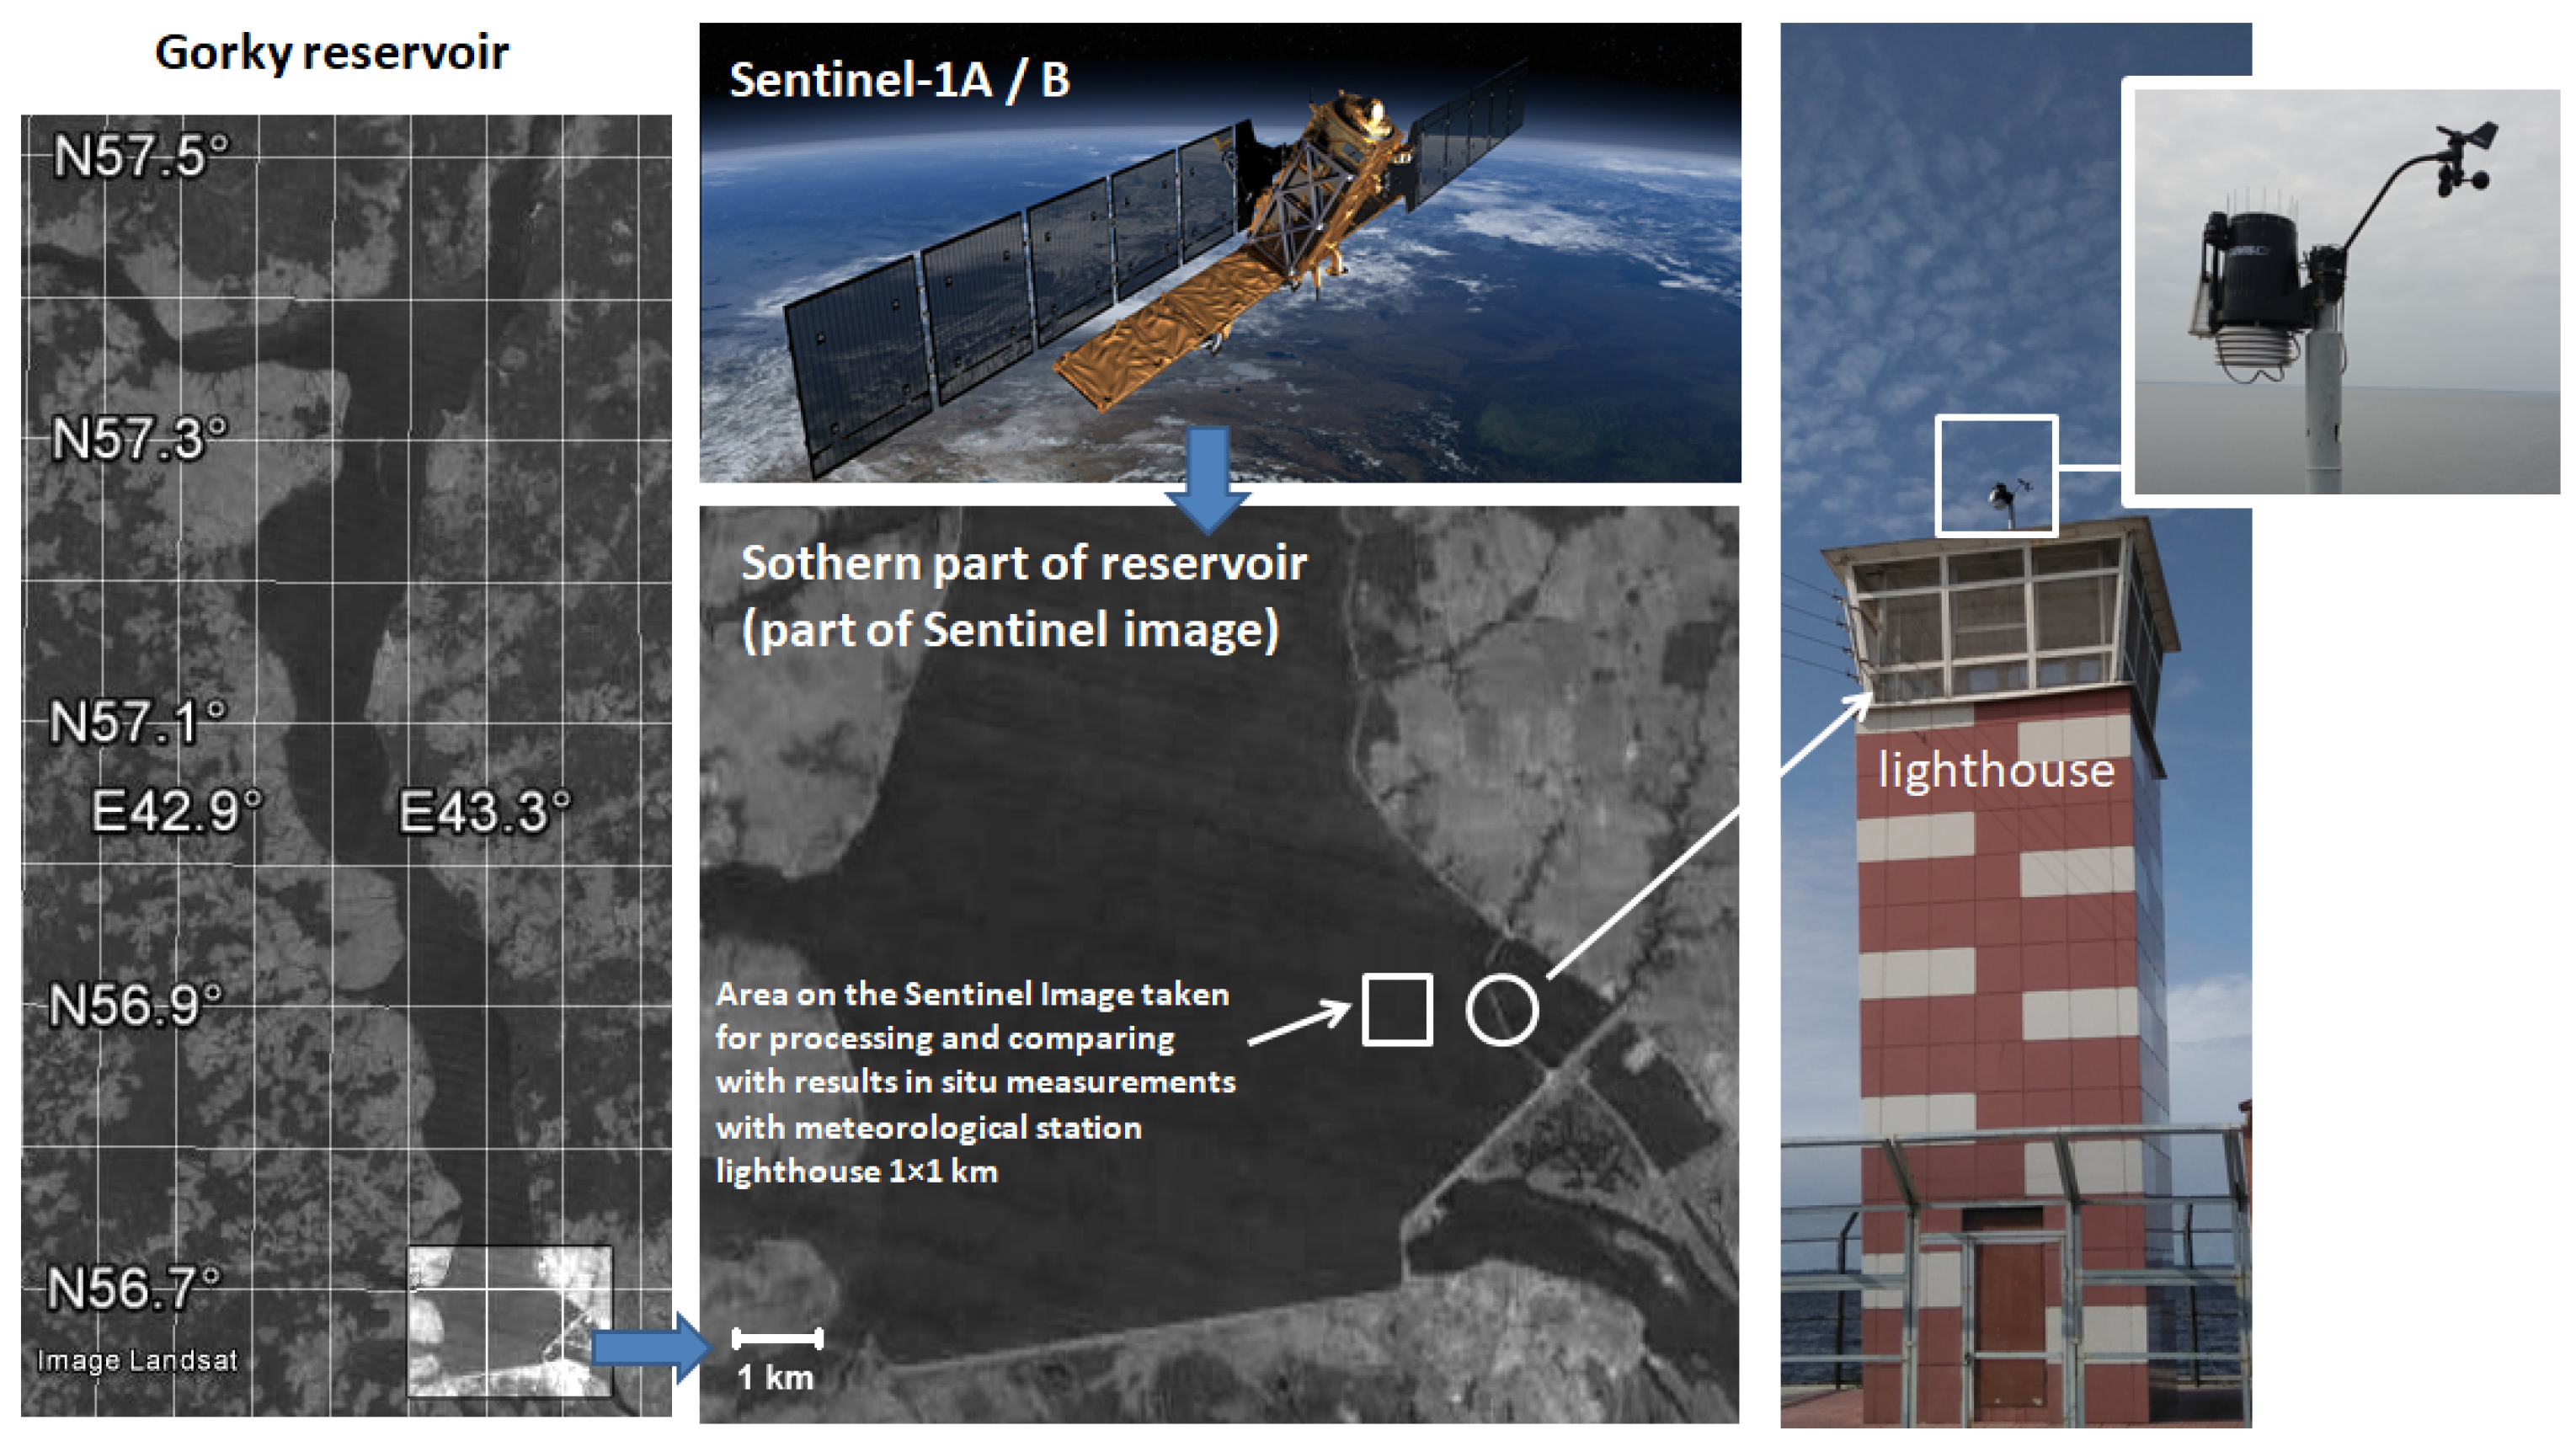
For the case of inland waters wind speed retrieval, we considered an S1 IW GRDH level-1 product for VV and VH polarization for a fragment of the Gorky reservoir taken for a period from September 2017 to June 2020. 52 SAR images were selected for this period (excluding the freeze-up period), which contained the southern part of the reservoir, where the lighthouse was located. The average value of the NRCS for the VV polarized SAR images was calculated for a square area 1 × 1 km in size, the center of which was located 1.5 km from the coast (see Figure 1) and in close proximity (at the distance of about 1 km) from the lighthouse. The azimuth angle was constant at 256 degrees, and the incident angle for one group of images was 34.27 and for the other 41.75 degrees. The direction of the wind was taken according to the data of the meteorological station.
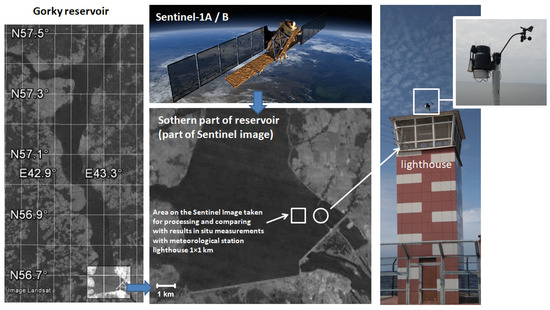
Figure 1.
A map of the Gorky reservoir (see the left panel of the illustration); central panel—the southern (enlarged) part indicating the location of the lighthouse where the station is installed and the area where the NRCS is calculated, the lighthouse with the station installed on the roof is illustrated on the right panel.
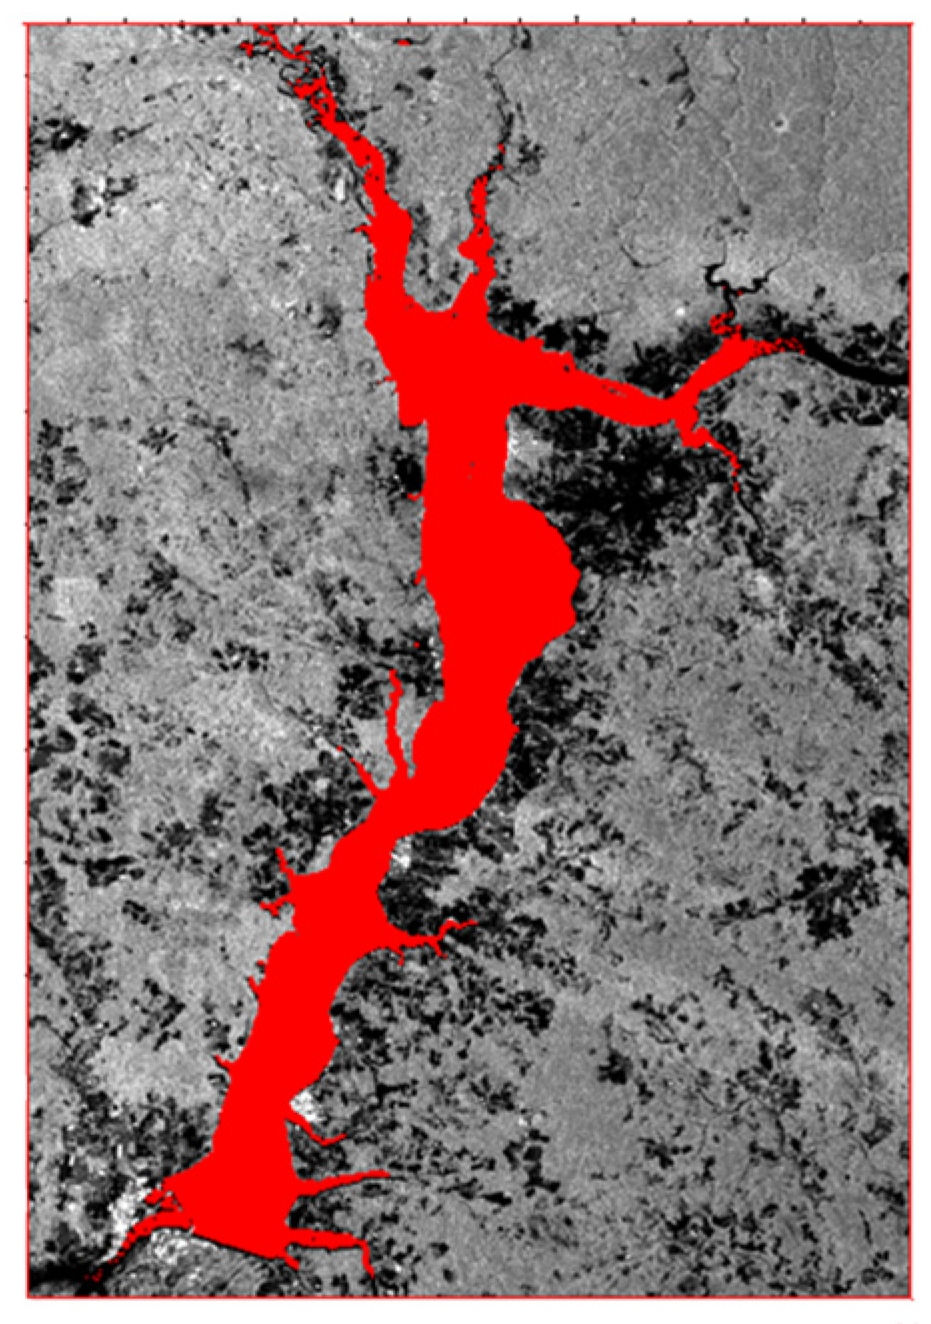
For the main analysis, a VV polarization SAR image was used, while a cross-polarization VH image was utilized to define the boundaries of the reservoir (see Figure 2), as in contrast with VV, the NRCS for cross-polarized VH mode does not demonstrate dependence on the wind (wave) conditions.
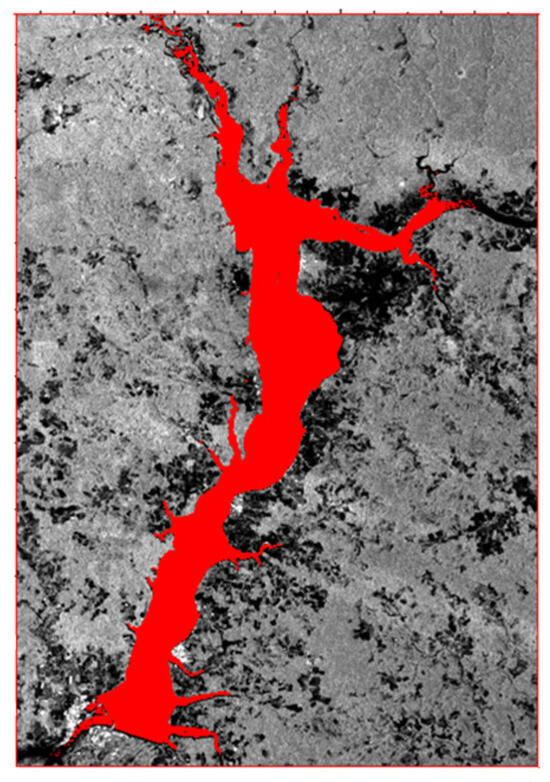
Figure 2.
SAR image in VH mode used for retrieval of the Gorky reservoir boundary.
2.2. CMOD5.N Algorithm
In the present study, we used the CMOD5.N algorithm to retrieve the wind speed from SAR images. According to this algorithm, the value of the Normalized Radar Cross Section (NRCS) of the sea surface σ0 is represented as a function of neutral wind speed v, wind direction χ and incidence angle θ [12]:
where φ = χ − α is the relative direction between the wind direction χ and the radar azimuth look angle α [12]. The other parameters, Bi (i = 0, 1, 2) depend on the radar incidence angle, wind speed and coefficients ci. The value of the B0 parameter determines the order of the wind speed, while the value of the B2 parameter reflects the asymmetry along the wind and crosswind, and B1 allows refining the value of the wind speed for the wind direction in the range of 180 degrees. In [12] for the CMOD5.N model, 28 coefficients ci were recalculated from the condition that this model should provide winds by 0.7 m/s more than for the calculations within CMOD5 for all wind speeds and incidence angles, as a result, the following values for ci were used (see Table 1) [12]. In order to obtain the value of NRCS from SAR images using CMOD5.N the wind direction should be acquired from some external sources, for example, in situ measurements or reanalysis calculations may be used as input to the CMOD5.N algorithm.

Table 1.
Coefficients ci for CMOD5.N used for the calculation of wind speed value.
2.3. Buoy Data
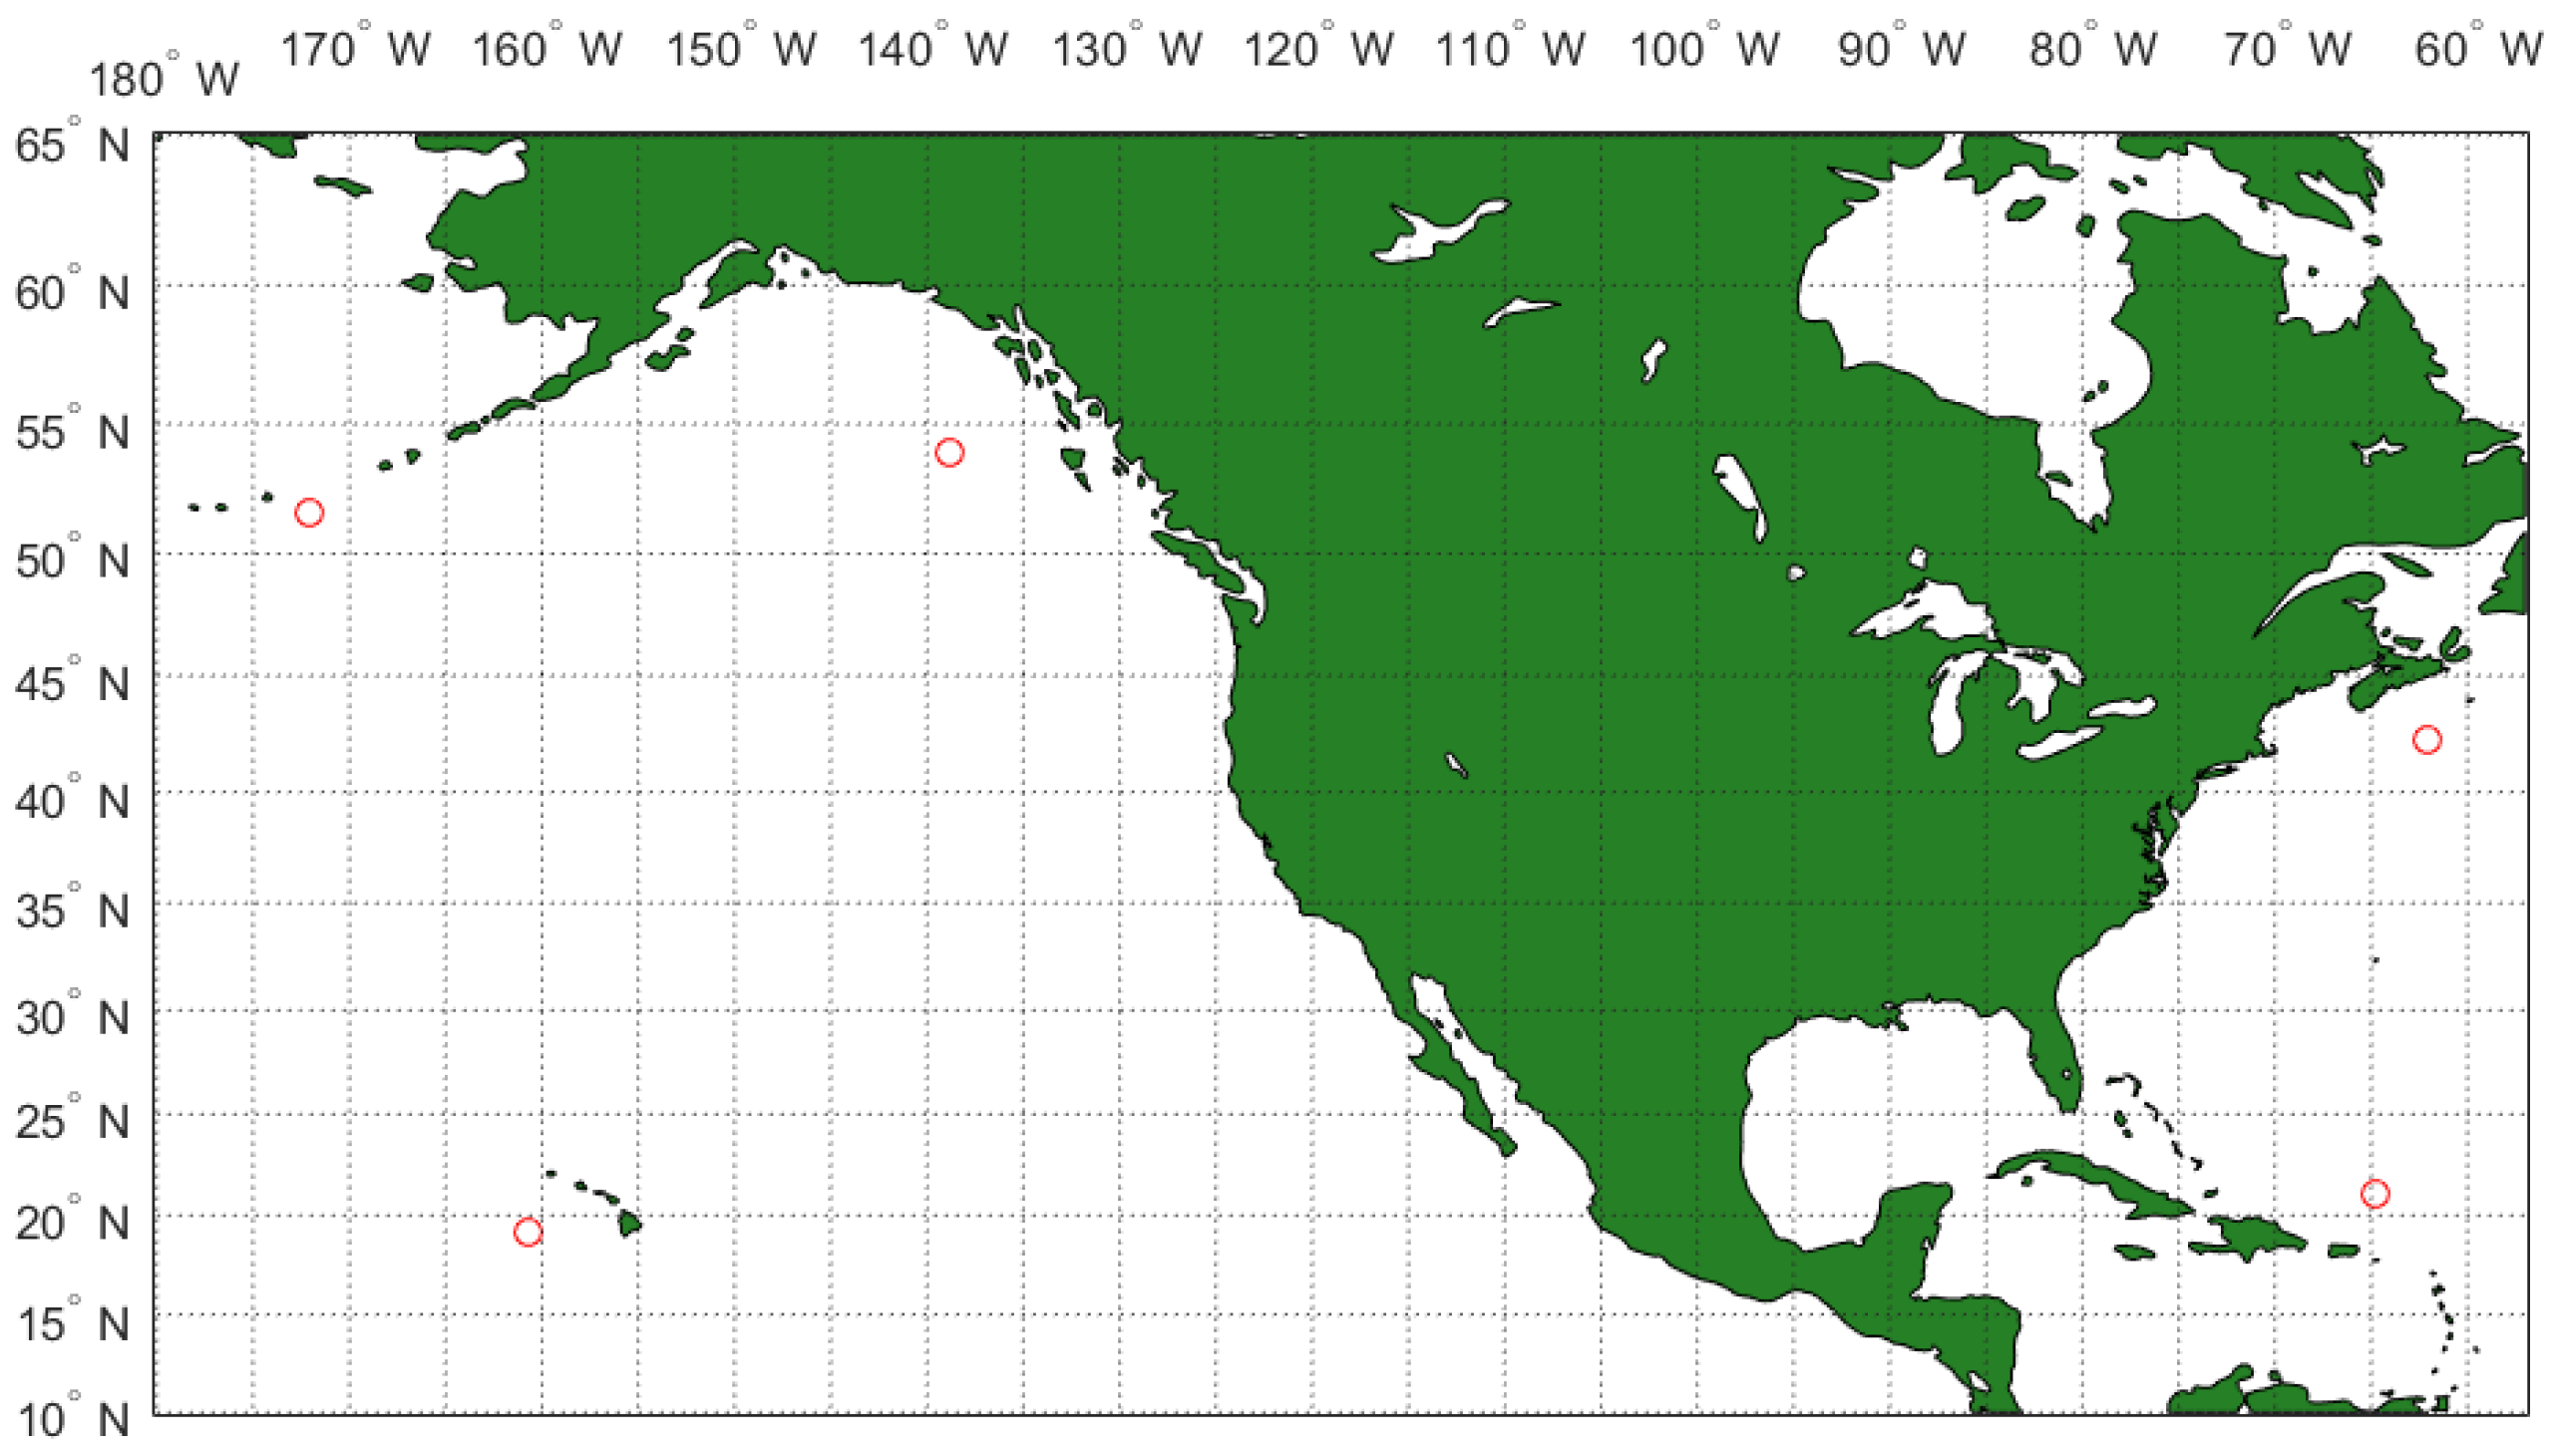
To verify the magnitudes of wind speed from SAR images using the CMOD5.N algorithm, the data on the wind speed direction were collected using NOAA NDBC oceanographic buoys. The choice of buoy location was associated with the possibility of collocation them with SAR data in order to subsequently synchronize the acquisition data on wind velocity and its direction with NRCS of SAR images. Due to the fact that regular (monthly) remote sensing data can only be obtained in certain geographic regions, the following oceanographic buoys were selected according to the location of these regions: Station 41,043—NE Puerto Rico 21.030 N 64.790 W; Station 44,137—East Scotia Slope 42.260 N 62.030 W; Station 51,003—Western Hawaii, 19.196 N 160.639 W; Station 46,184—North Nomad, 53.920 N 138.850 W; and Station 46,072—Central Aleutians, 51.672 N 172.088 W.
3. Verification of CMOD5.N Using Buoy Measurements for Ocean Conditions
For complex verification of the CMOD5.N algorithm, we formed a representative data array containing both SAR images of sea surface areas and collocated data on wind speed and wind direction with the maximum sampling rate in time, in the maximally wide range of geographic locations. Also, the array was supplemented with NCEP reanalysis data (from the website https://earth.nullschool.net, accessed on 4 July 2023) for wind speed as close as possible to the time the image was taken. A feature of the Sentinel 1 A/B for IW mode is that on a regular basis, the Earth’s surface areas occupied by land are surveyed at least once every two weeks, and the images for the open ocean are made from time to time in different modes depending on the conditions. For example, data collection becomes more frequent during adverse weather events such as tropical hurricanes, typhoons, storms, etc. However, together with regular surveys of coastal areas, significant zones of the sea surface are also recorded. At the same time, we often chose observation points near small islands in order to minimize the influence of the coastal zone. On the other hand, an oceanographic buoy should be present in the selected area of regular surveys in order to perform the collocation of data. Based on these requirements, we selected 5 observation areas, see Table 2. It should be noted that these areas corresponded to different climatic regions, including subpolar, temperate, and tropical regions, which were located in the Atlantic as well as in the Pacific Ocean. The location of the selected areas is shown on the map (see Figure 3).

Table 2.
Analyzed geographic areas and corresponding oceanographic buoys.
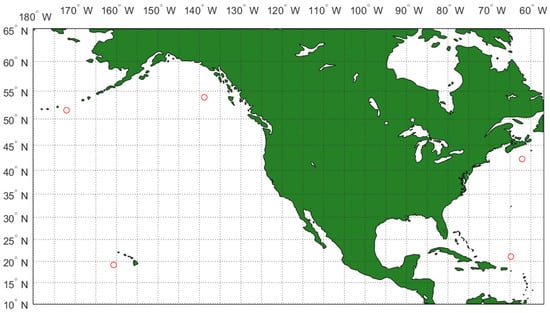
Figure 3.
The location of 5 selected observation areas (red circles).
For each area, Sentinel 1A/B imagery was taken with a duty cycle of 2 weeks, during the time period throughout 2020, with the exception of area No. 4, where, due to insufficient data, the dataset was supplemented with images from 2019. The procedure for determining the NRCS in the area of the buoy was as follows: an area of size 2 × 2 km was taken, which necessarily captured the location of the buoy, and on the other hand was completely inside the image, and then the NRCS was averaged inside this area. The CMOD5.N algorithm was used to retrieve the velocity magnitude. It should be noted that due to the selection of different areas, the data were obtained at different values of the incidence angle and azimuth angle (see Table 2).
Direct comparison of wind speed measurements by anemometers from buoys with the results of calculations using CMOD5.N is not correct, because it should be taken into account that the anemometers from different buoys are installed at different heights from the surface za, which, generally speaking, is different from 10 m. Therefore, was recalculated from the height za (see Table 2) to a height of 10 m, according to the logarithmic law:
where z0 is the roughness length. Here we used a constant value of z0 equal to 1.52 × 10⁻⁴ m, as it was proposed in [27]). Despite the fact that the dependency of roughness length on the wind speed for the selected wind range is strong (it has values from 10−5 up to 10−3 m (see [27] and the references in it)), the calculated wind speed magnitude vary slightly with the roughness length (less than 1%).
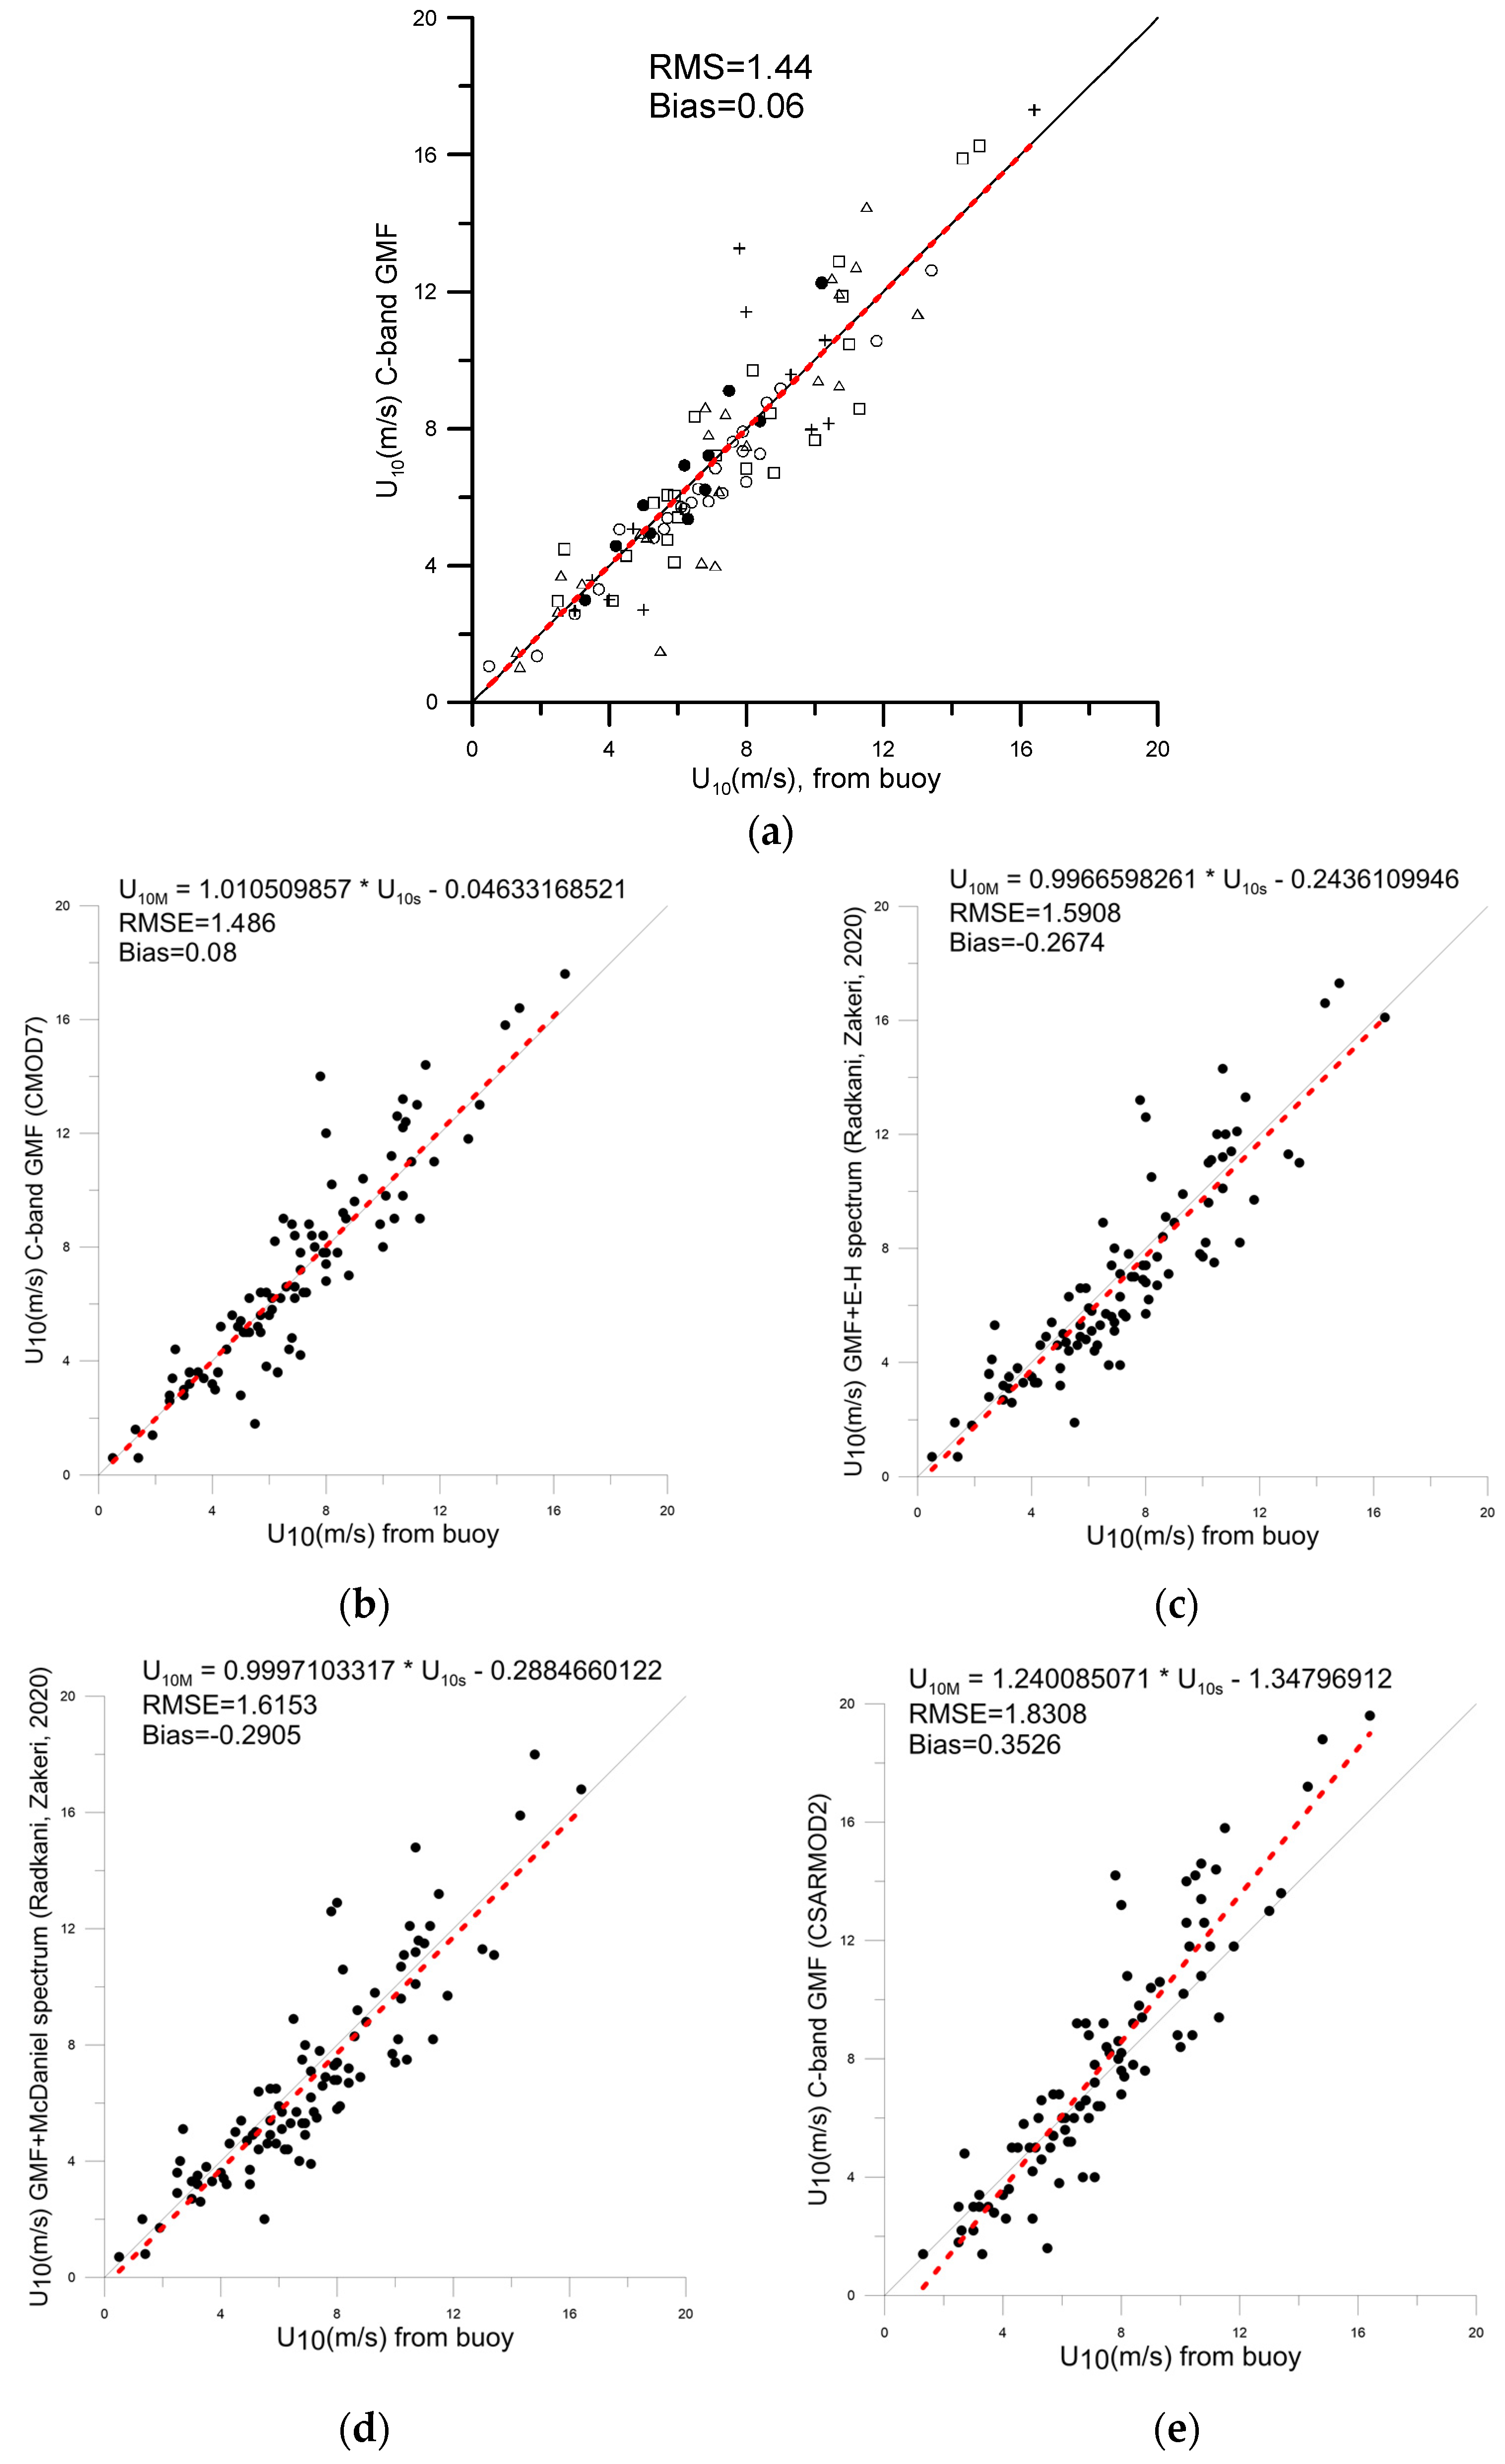
Figure 5a shows the results of comparing the wind speed obtained from the measurements from the buoy anemometers with the results of calculations using the CMOD5.N algorithm. A linear fit gives a straight-line slope of 0.99.
It can be seen from Figure 5a that the results are in good agreement with each other, regardless of the survey area and the buoy where they were obtained. Thus, the universality of using the algorithm is demonstrated regardless of the conditions (incidence angle, azimuth angle, wind speed).
A comparison of the buoy data were made also with the calculations within a number of widely used geophysical model functions–CMOD7, GMF from [36] and CSARMOD2. It can be seen that for the selected values the discrepancies between the results calculated with CMOD5.N and with CMOD7 are negligible (see Figure 4a,b). As for the GMF from [36], it describes ocean conditions quite well (see Figure 4c,d), and slightly better results are obtained in the case of calculations for the Elfouhaily spectrum (see the details in [36]). At the same time, the CSARMOD2 showed itself to be somewhat worse (see Figure 4e); for its values of bias and RMSE are the largest. Since the CMOD5.N model for our dataset performed better than the others, we will analyze below the sensitivity of the calculations to the choice of the wind direction source.
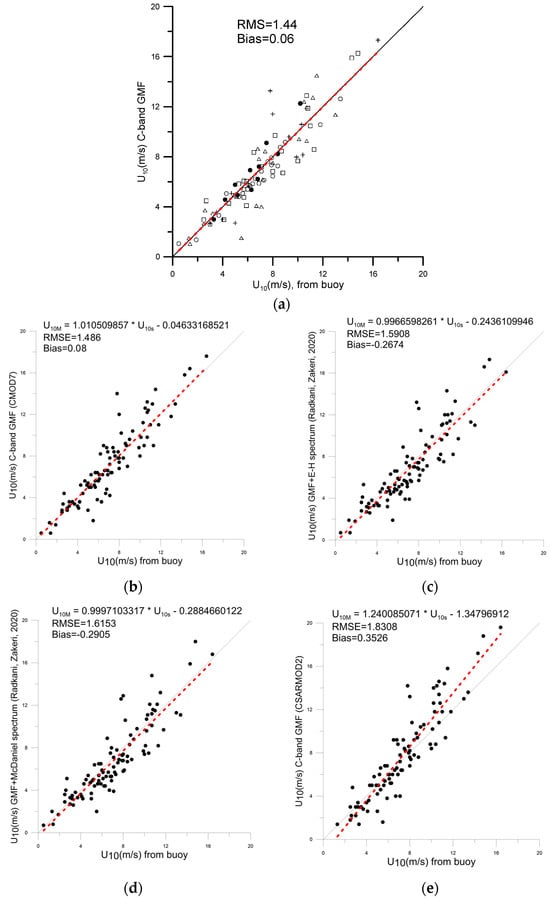
Figure 4.
(a) Comparison of the results of measurements by anemometers from buoys and results of calculation by CMOD5.N. Symbols correspond to areas: black circles—No. 1, triangles—No. 2, open circles—No. 3, squares—No. 4, pluses—No. 5. Black line y = x, red dashed red line corresponds to linear best-fit y = 1.0099x (applied for the full dataset). The results of comparison of the buoy data with wind speeds from CMOD7 (b); GMF from [36] for Elfouhaily directional spectrum (c) McDaniel spectrum (d); CSARMOD2 (e).
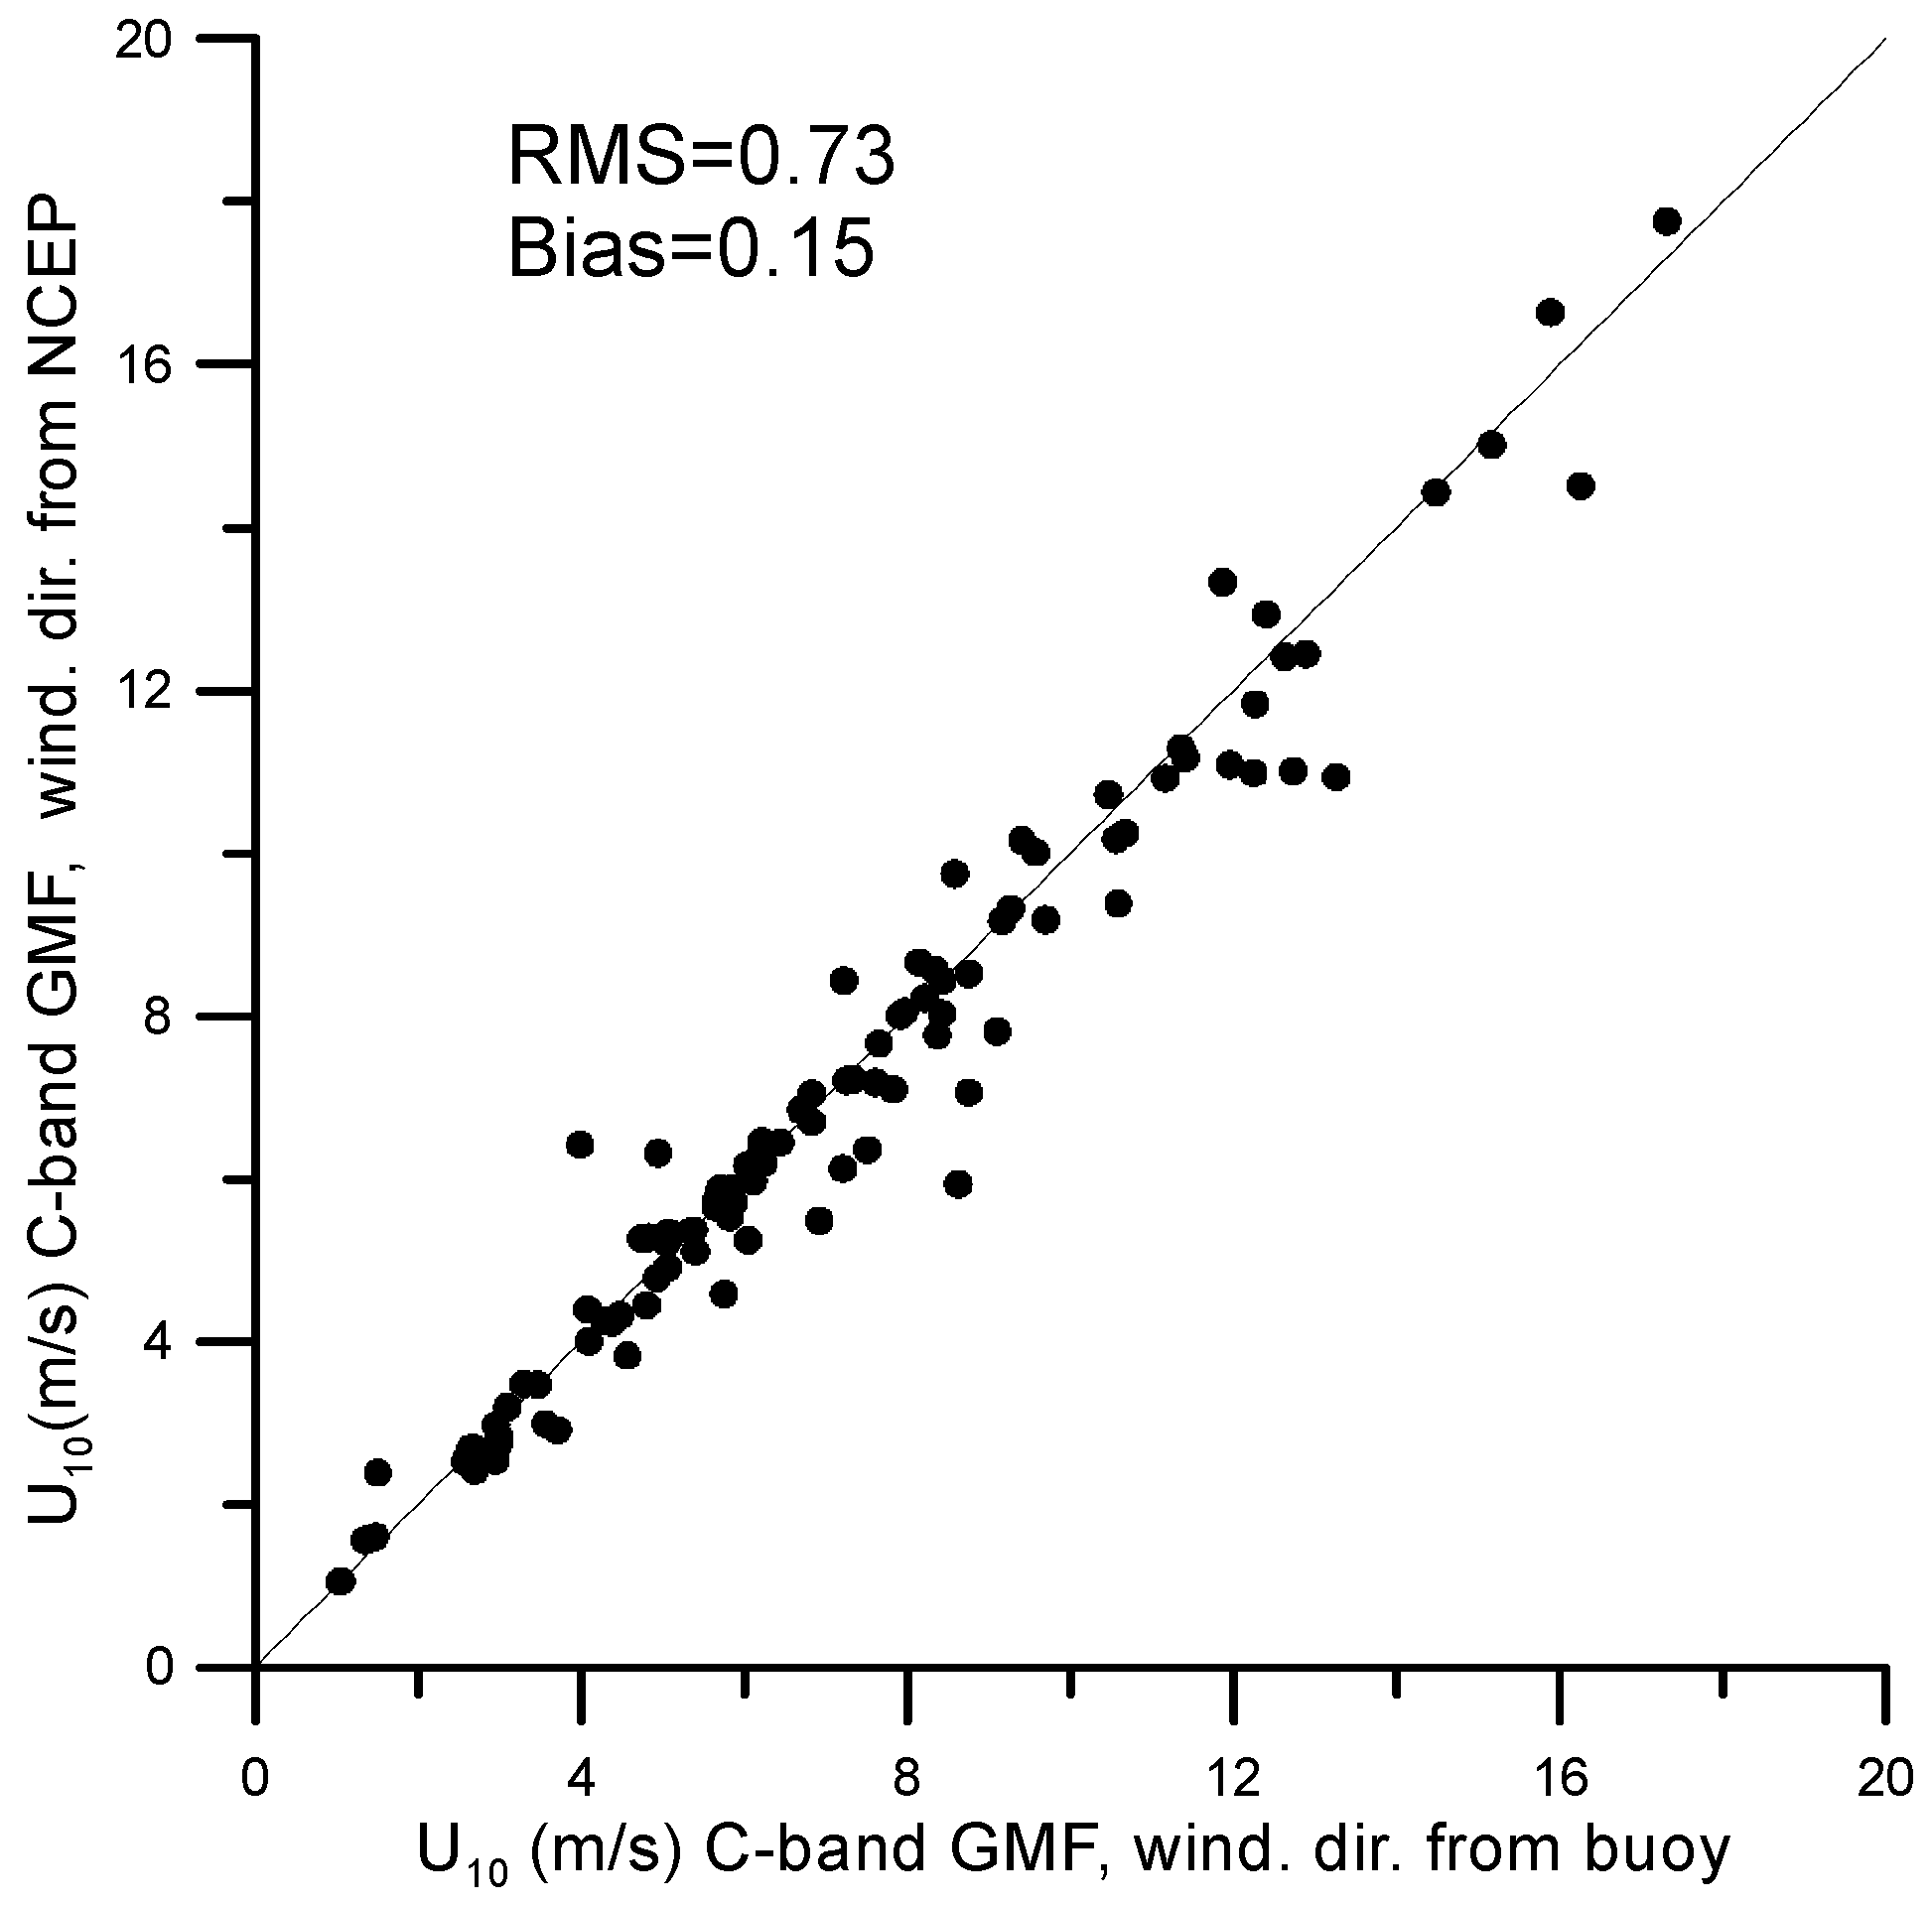
In order to retrieve wind speed from the CMOD5.N algorithm the direction of wind speed should be obtained. Instead of data from buoys, which are few and extremely unevenly distributed over the ocean, it is more reliable to use data on the global meteorological situation. In this regard, a comparison was made for the results obtained by CMOD5.N, both using wind direction data from the buoy anemometer measurements and according to the data of NCEP CFSv2 data reanalysis (0.50). The comparison demonstrated in Figure 5 shows that the results of calculations by CMOD5.N are weakly dependent on the source of data on the wind speed direction. The good agreement is likely due to the selected range of wind speeds, containing predominantly low wind speeds, which are characterized by a weak level of variability in the magnitude of the wind speed and its direction. This causes a slight difference between the results of modeling and measurements. Therefore, it is possible to use the reanalysis data available in the public domain without using formulas for recalculating wind speed.
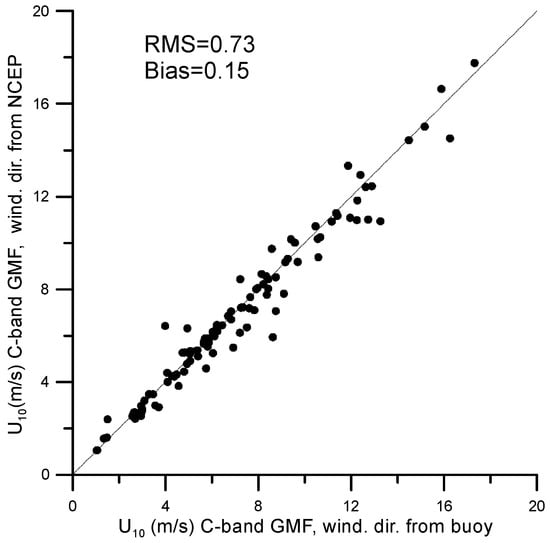
Figure 5.
Comparison of U10 calculation from the CMOD5.N algorithm using wind direction data from buoy measurements and data provided by NCEP.
4. Verification of the CMOD5.N for Inland Water Conditions Using the Example of the Gorky Reservoir and the Comparison with the Calculations Using Other C-Band Models
To verify the CMOD5.N algorithm under the conditions of an inland water body, we used data from observations of the meteorological state from the station installed on the roof of a lighthouse (height 9.5 m from the water surface) in the southern part of the Gorky reservoir. The lighthouse itself is located at the end of a long narrow jetty (see Figure 1), which limits the outport in front of the locks, reducing the effects of airflow sheltering due to the topography of the coastline.
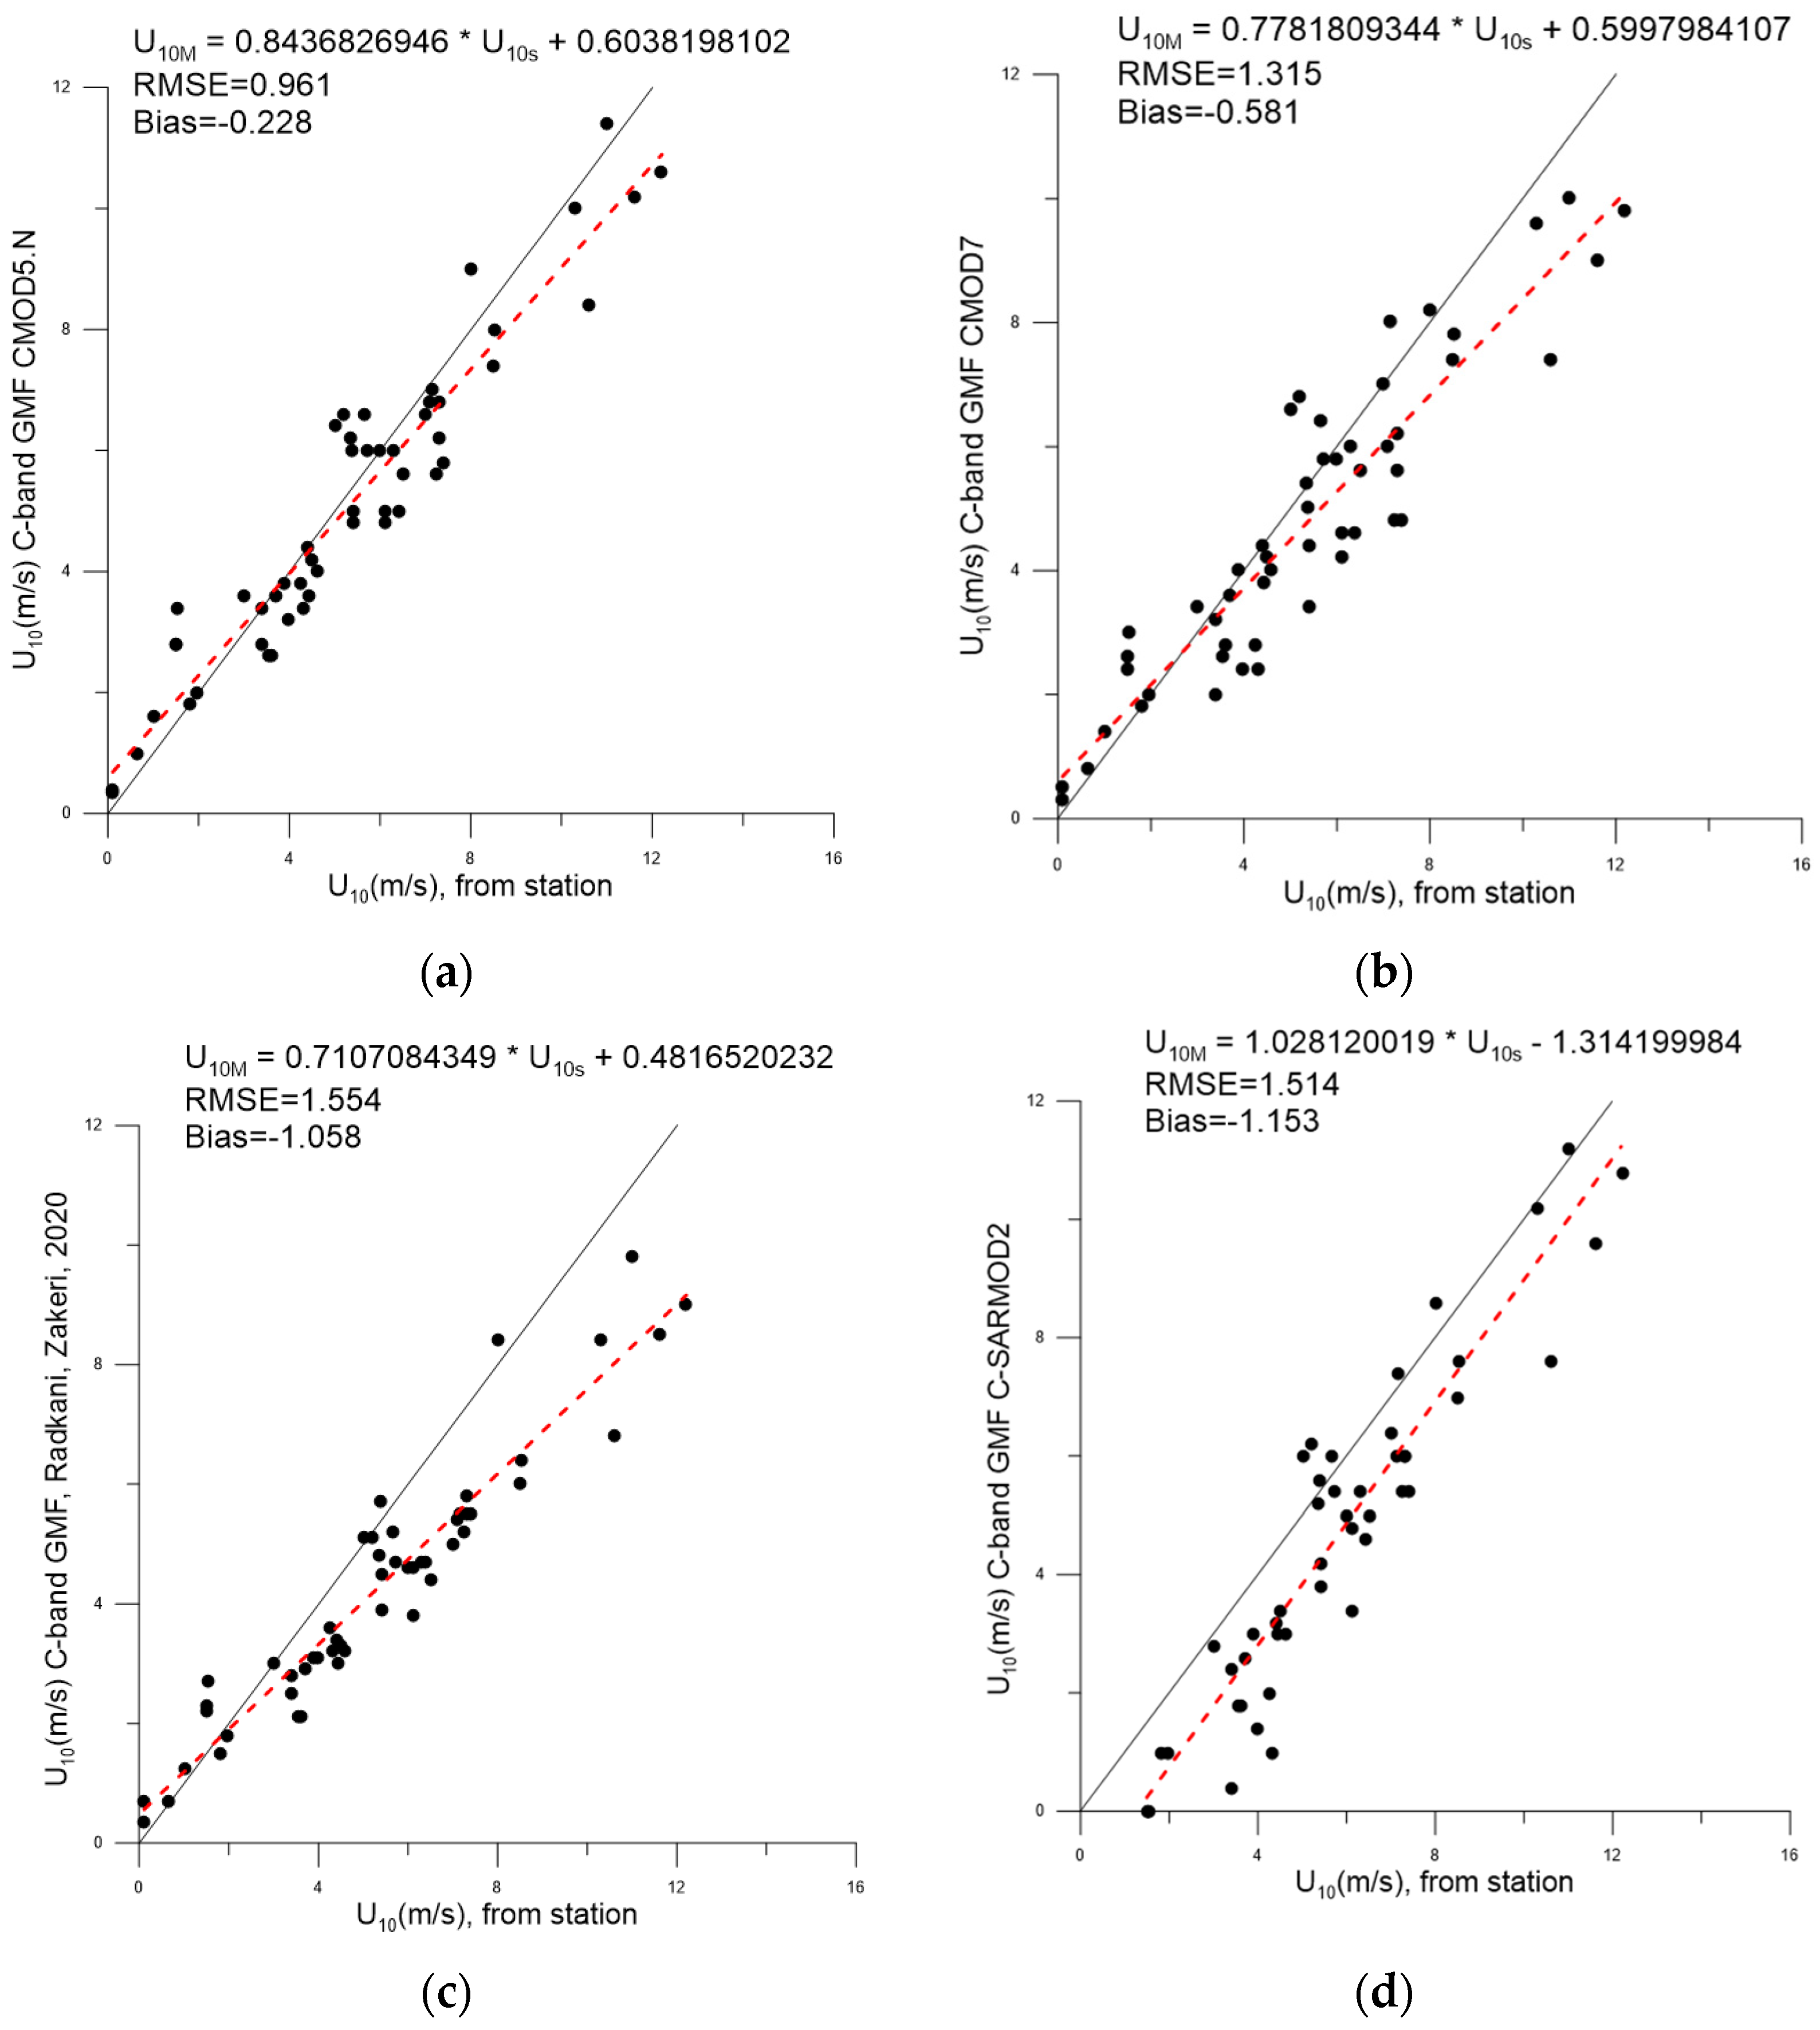
A comparison of the results (see Figure 6) demonstrates a satisfactory agreement.
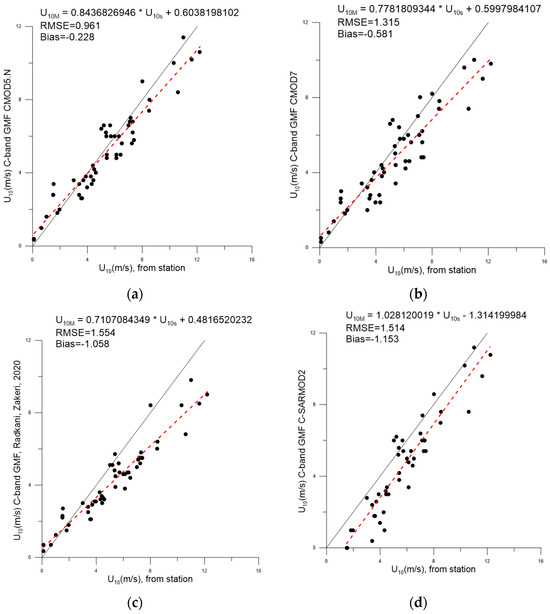
Figure 6.
The results of comparison of U10 anemometer measurements from the meteorological station at the Gorky reservoir and the results of calculations using CMOD5.N (a); CMOD7 (b); GMF with the Elfouhaily directional spectrum (see [36]) (c); CSARMOD2 (d). Black line corresponds to y = x, red dashed line represents linear best fit.
It can be seen from Figure 6a that the bias and RMSE turned out to be smaller compared to the results obtained for the open ocean despite the data array being 3 times smaller. The slight inclination of the best linear fit reveals that moderate wind speeds in situ measurements slightly exceed SAR processing data. Obviously, it may be due to the effect of short-wave fetches.
At the same time, calculations using the CMOD7 (see Figure 6b) model give a somewhat less accurate result, since the value of RMSE, in this case, exceeds the similar value for CMOD5.N and the absolute value of bias turns out to be greater. Both models show a negative bias value, which indicates, on average, an underestimation of the calculated velocities compared to the measured ones. The GMF from [36] and CSARMOD2 models perform significantly worse (the latter demonstrates the largest absolute values of RMSE and bias) (see Figure 6c,d). For both models, bias is a negative value, while CSARMOD2 demonstrates an underestimation of speeds in the entire considered range, in contrast to the other three models. Thus, we can make a preliminary conclusion that the CMOD5.N model is best suited for calculations for the reservoir under consideration.
5. Towards a New Geophysical Model Function Based on the Data for Gorky Reservoir
Due to the fact that calculations according to the GMF proposed in [36] do not describe the measurements for the Gorky Reservoir accurately enough (see Figure 7c), we made an attempt to create a model that would be more adequate and could be used for inland water bodies alternatively to [36]. In the present study, we use a two-scale composite model (see [37,38]). In general, this model, similar to the Small-Slope Approximation (SSA2) model proposed in [39], describes electromagnetic scattering from a wavy water surface but its main feature is that it takes into account the tilting modulation due to long waves. In general, both models adequately describe scattering parameters for direct polarization, but the two-scale model is somewhat simpler for calculations, so it was chosen in the present study.
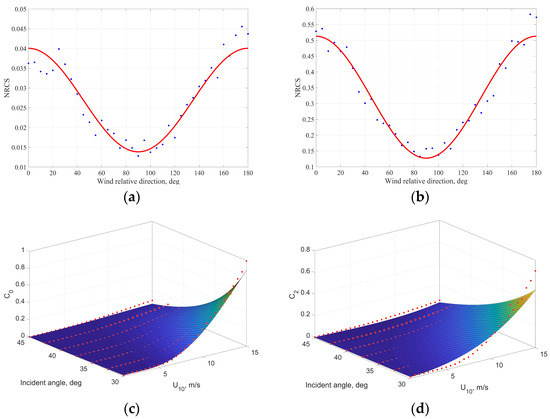
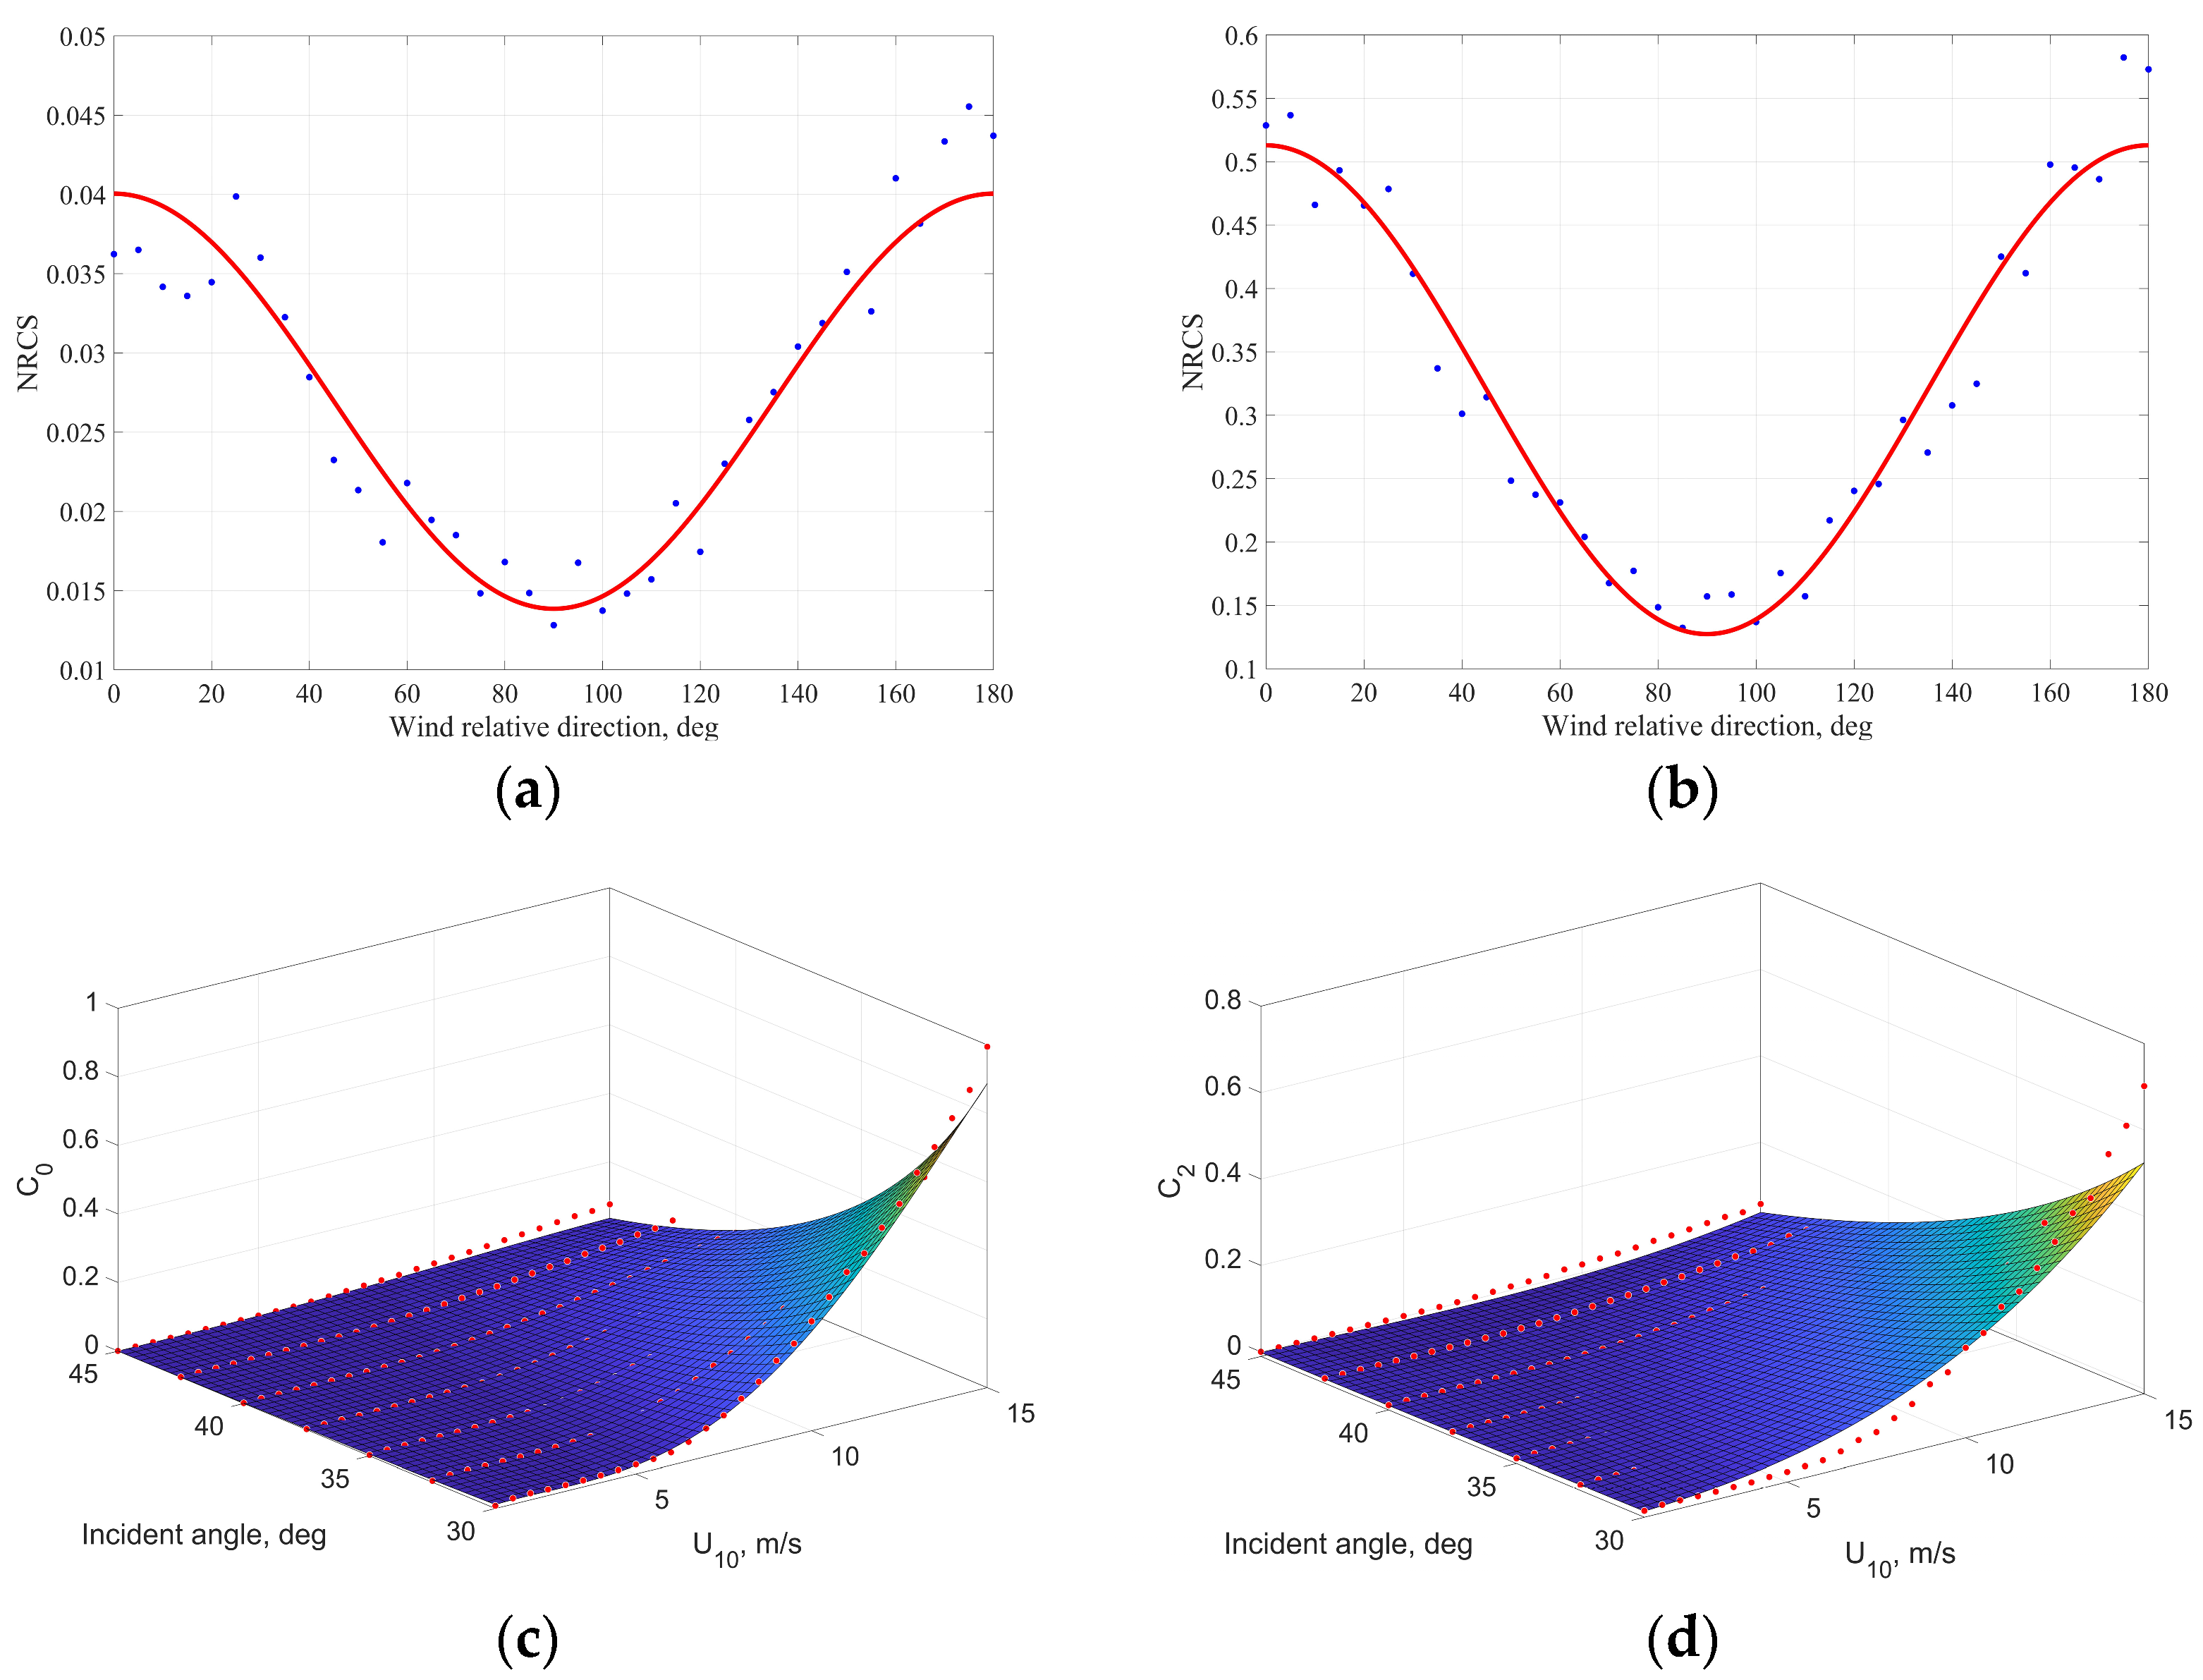
Figure 7.
The dependency of modeled NRCS vs. the wind relative direction for wind speed 5 m/s (a) and 10 m/s (b), for both illustrations θi = 30° (points represent the modeled values, red curve corresponds to approximation (6)). The 3-D illustration of C0 (c) and C2 (d) coefficients depends on the incident angle and wind speed. Red points correspond to the modeled values and the surfaces represent to the approximation with the expressions (6)–(7).
We use the following expression for NRCS (see [37,38]):
where is the incidence angle, is the polarization coefficient which describes the tilting waves impact, is the directional curvature spectrum, is the Bragg wavenumber, is the radar wavenumber, is the mean square slope of tilting waves in the direction of incidence plane and geometrical coefficient has the following form:
where represents the relative permittivity which has the value of 81.5736 for the mean annual temperature equal to 16 °C [40].
The calculations are made for the frequency of 5.405 GHz and VV polarization corresponding to the Sentinel-1 SAR equipment. For the Gorky Reservoir, weak or moderate winds are the most typical—in the spring-summer period, the average wind speeds observed at the Reservoir are 3.4–5.2 m/s, and in the autumn-winter period 3.9–7.4 m/s. At the same time storm wind speeds (more than 15 m/s) are observed extremely rarely, winds of more than 28 m/s have never been recorded [41]. Thus, the considered wind speed range will include only weak or moderate winds (less than 15 m/s). We used the same as was reported in [36] ranges for incidence angles (30°–45°) and the wind relative direction (0°–180°).
In contrast to the study reported in [36] where the Hwang spectrum was used for the omnidirectional part, we used the Elfouhaily spectrum [42] for the entire range of wave numbers, since for waves in the meter range it has a k−3 asymptotics, which was observed in field data for the Gorky Reservoir [43]. We also used a Gaussian random process for the variations of power spectral density for the Bragg wavenumber. The calculations were performed with the step of 2.5° for the incidence angle, 5° for the wind relative direction and 0.5 m/s for wind velocity analogous to the study reported in [36].
To construct the new GMF we will use an empirical functional relation proposed for all CMOD models which contains the dependency of NRCS σ on the wind speed U10, incidence angle θi and wind relative direction φ:
We will assume that the C1 is equal to zero, because we use the spectrum symmetrical from the point of view of upwind and downwind directions. To determine the values of C0 and C2 we use the same procedure and approximations as were used in [36]. As a result, we obtain the dependencies of C0 and C2 on the wind relative direction for each wind speed and incident angle (see Figure 7a,b).
In the next step, we approximated the obtained dependencies of C0 and C2 using the polynomial approximations for U10 and power functions for θi dependencies (see [36]):
The values of obtained coefficients c from expressions (6) and (7) are presented in Table 3.

Table 3.
The coefficients used in (6), (7).
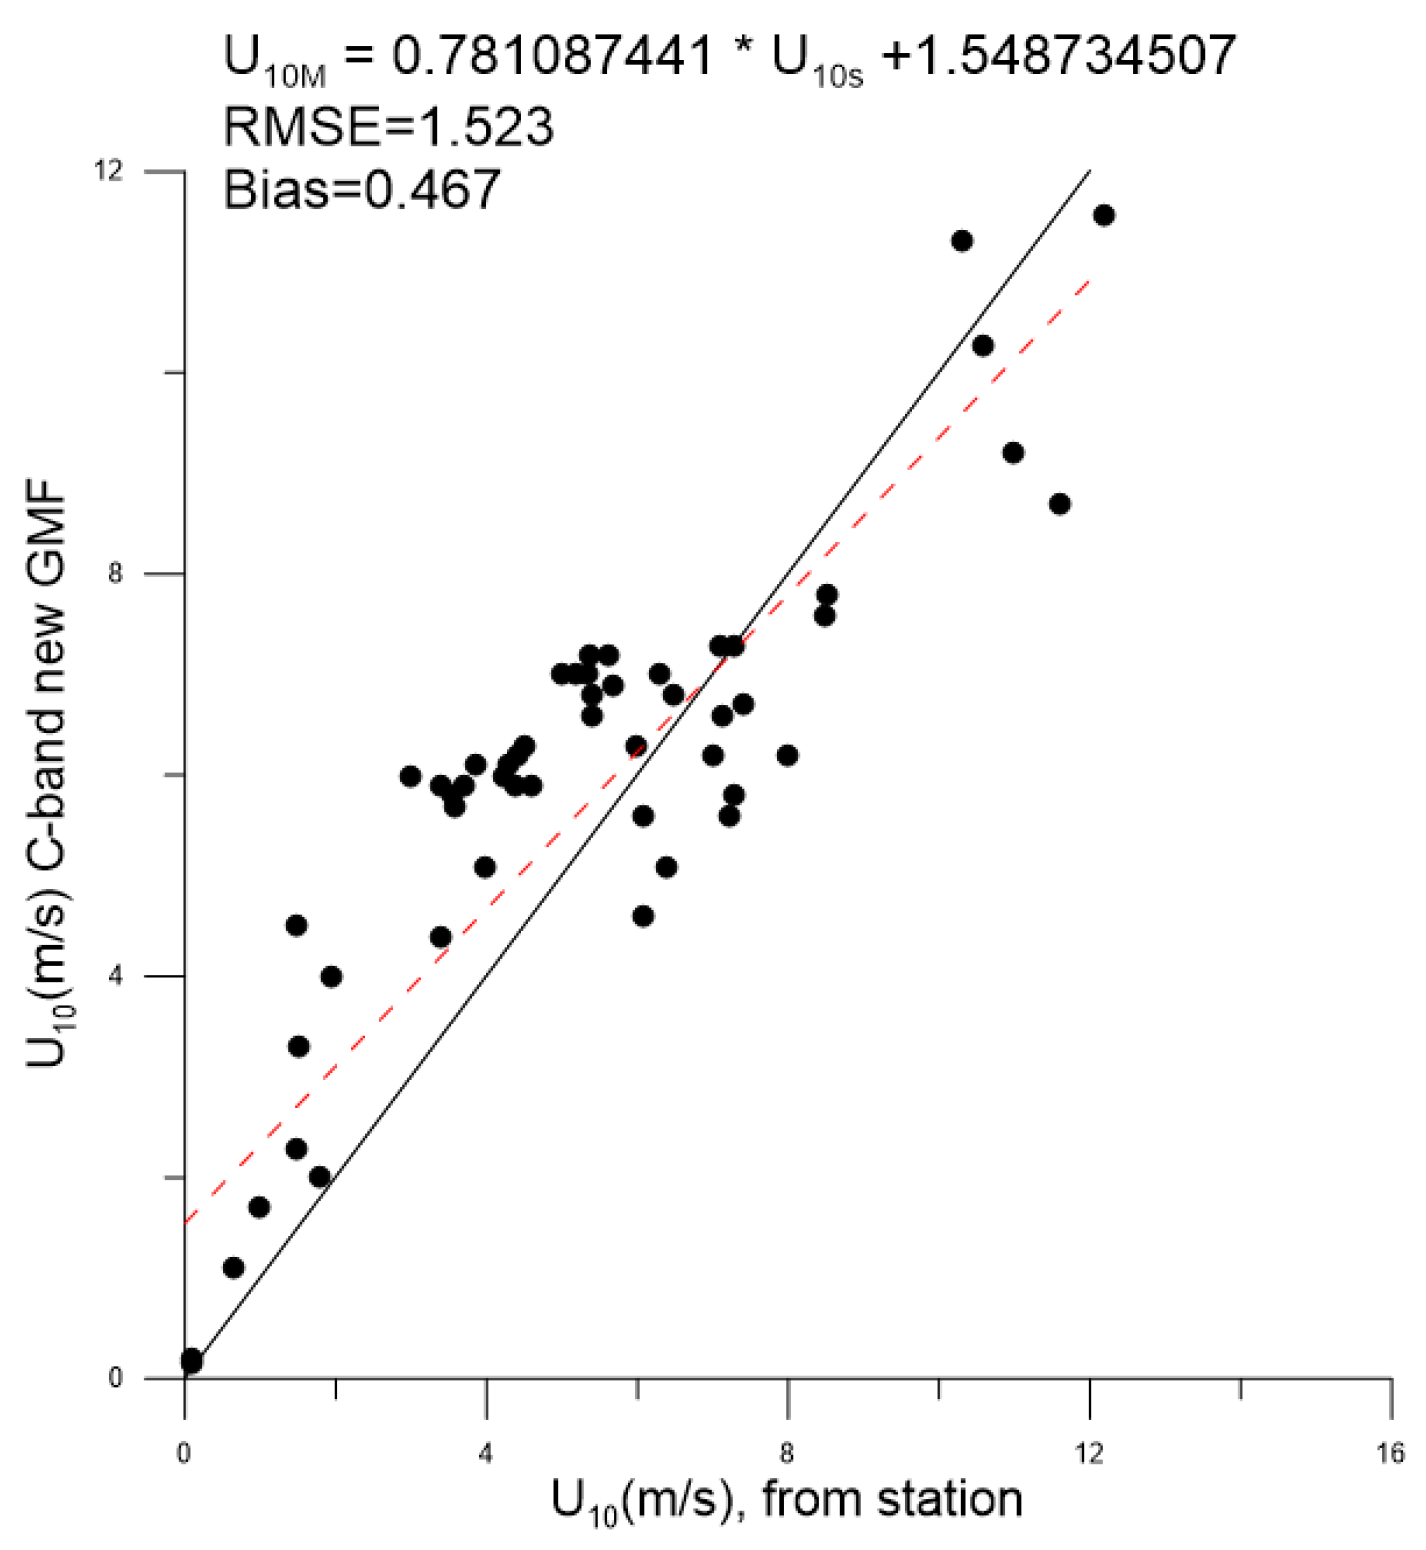
The proposed model was validated using the dataset from the meteorological station located at the Gorky Reservoir and collocated NRCS data from Sentinel-1 SAR (see Figure 8).
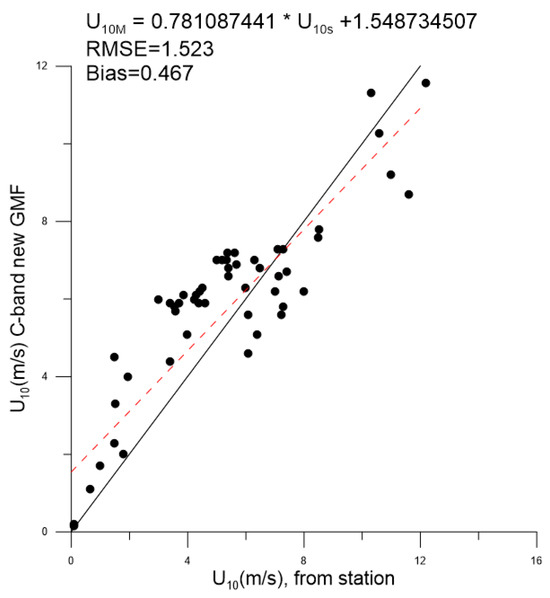
Figure 8.
The results of comparison of U10 anemometer measurements from the meteorological station at the Gorky reservoir and the results of calculations using proposed C-band GMF. Black line corresponds to y = x, red dashed line represents linear best fit.
A comparison of the simulated velocity values with the measured ones demonstrates slightly lower RMSE and bias values than in the case of CSARMOD2 and the model reported in [36]. In addition, calculations within the proposed model demonstrate some overestimation of the calculated wind speed values, in contrast to these two models and similar to the CMOD models. However, the statistical characteristics of the data calculated using the proposed GMF turn out to be somewhat worse than in the case of CMOD5.N and CMOD7. Obviously, the model reported in [36] works worse for the case of the Gorky Reservoir, since the spectra that are used in this model are probably not entirely typical for this reservoir As measurements have shown, the Gorky Reservoir is characterized by a Phillips spectrum in the wavelength range of the order of a meter and significantly shorter (up to 12 cm) [43]. As for the long-wave part of the spectrum, it is more correct to use age-dependent wave spectra, since the reservoir is characterized by a large difference in longitudinal and transverse dimensions, and therefore the surface waves fetch can vary widely (from a few up to hundreds of kilometers). The problem of choosing the optimal spectrum to describe adequately the statistics of surface waves will be a subject of future studies.
6. Conclusions
A comprehensive verification of the C-band geophysical model functions for the open ocean as well as for the conditions of an inland water body (Gorky reservoir) was carried out on the basis of SAR images obtained from the Sentinel-1 mission. The main motivation that served as the impetus for this study is the need to clarify the possibility of applying widely used in current practice algorithms developed mainly for scatterometers for SAR conditions, as well as to study the influence of various sources on the results of calculations to obtain the magnitude of the wind speed direction. A special place in this case is occupied by the possibility of using the CMOD5.N algorithm for the conditions of inland waters.
A total of 133 SAR images for IW mode were considered in the period from 2019–2020 for open ocean conditions and 40 IW SAR images for the conditions of the Gorky reservoir. When applying the wind speed retrieval algorithms and determining the magnitude of the wind speed, it is required to obtain information about the wind direction from external sources. In our study, we used measurements of oceanographic buoys NOAA NDBC and NCEP reanalysis data for open ocean and data from a meteorological station for conditions of the Gorky Reservoir. One of the main tasks in the selection of satellite images was to expand the geography of the regions under consideration and to apply a number of widely used wind speed retrieval algorithms. 5 different geographical areas were considered within which it was possible to obtain regular images of the Sentinel-1 mission with a duty cycle of 14 days for which collocation with buoy data is possible. These areas corresponded to different climatic regions, including subpolar, temperate, and tropical regions, which were located in the Atlantic as well as in the Pacific Ocean.
A comparison of the buoy data was made with the wind speed retrievals using a number of widely used geophysical model functions–CMOD7, GMF from [36] and CSARMOD2. The discrepancies between the results calculated with CMOD5.N and with CMOD7 are negligible. As for the GMF from [36], it describes ocean conditions quite well, slightly better results are obtained in the case of calculations for the Elfouhaily spectrum. Thus, we can conclude that the model, originally intended to retrieve wind speed above enclosed seas, describes the results satisfactorily for the ocean as well. This is quite understandable since the model uses the Hwang spectrum and the Elfouhaily spreading function, which are quite typical for the ocean, and the calculations are carried out for the dielectric permittivity of salt water. As for the CSARMOD2, it showed itself to be somewhat worse than other GMFs, demonstrating larger values of bias and RMSE.
Comparison of wind speed calculation obtained from the CMOD5.N algorithm using wind direction data from buoys measurements together with the data provided by NCEP reanalysis simulation showed a good agreement demonstrating a value of RMSE = 0.73 and bias = 0.15. This result says, firstly, that regardless of the geographic location, the algorithm performs quite well, while the result does not depend significantly on the choice of the source of the wind speed angle value. As for the conditions of the inland water body for the considered Gorky reservoir, a comparison of the results of calculations carried out within the framework of CMOD5.N with the data obtained from the meteorological station showed, in general, a satisfactory agreement, at the same time, they demonstrated lower values of bias and RMSE than for the conditions of the open ocean, despite a significantly smaller amount of data. This effect may be concerned with the effect of short wave fetches typical for inland water bodies or with the impacts of water depth on wave characteristics. The data obtained from the meteorological station were also compared with the results of calculations carried out within the framework of CMOD7, GMF from [36] and CSARMOD2. It was shown that for GMF from [36] and CSARMOD2 the largest RMSE and biases were observed. At the same time, among the four models considered, the CMOD5.N showed itself best and demonstrated the smallest RMSE and bias (RMSE = 0.961, bias = −0.228).
Finally, we made an attempt to develop a new C-band geophysical model function, which is based on a two-scale model that describes the scattering of electromagnetic radiation on a rough sea surface. Initially, the Elfouhaily spectrum was chosen to describe surface waves since it takes into account the Phillips asymptotics, typical for the Gorky Reservoir, up to the wavelengths on the order of tens of centimeters (12 cm) and is widely used to describe short waves. It turned out that the proposed model fits the field data much better than the CSARMOD2 and the model reported in [36], but worse than the CMOD models. In general, we can conclude that there is a need to find the optimal spectrum (or maybe a composite one) to describe adequately the mean square slopes of tilting waves and to take into account the wave age. As the question regarding the choice of wind wave spectrum remains open it may serve as a basis for future research.
Author Contributions
Conceptualization, D.S.; methodology, D.S.; software, N.R. and E.P.; validation, D.S. and N.R.; formal analysis, D.S.; investigation, D.S., O.E., D.G., N.R. and E.P.; data curation, D.S., O.E., N.R. and E.P.; writing—original draft preparation, D.S. and O.E.; writing—review and editing, D.S. and O.E.; visualization, D.S. and N.R.; supervision, D.S.; funding acquisition, D.S., O.E., D.G., N.R. and E.P. All authors have read and agreed to the published version of the manuscript.
Funding
This work was carried out under the financial support of the Russian Science Foundation Project No 21-17-00214.
Data Availability Statement
The data presented in this study are available on request from the corresponding author.
Conflicts of Interest
The authors declare that they have no conflict of interest.
References
- Offiler, D. The Calibration of ERS-1 Satellite Scatterometer Winds. J. Atmos. Ocean. Technol. 1994, 11, 1002–1017. [Google Scholar] [CrossRef]
- Verhoef, A.; Portabella, M.; Stoffelen, A. High-resolution ASCAT scatterometer winds near the coast. IEEE Trans. Geosci. Remote Sens. 2012, 50, 2481–2487. [Google Scholar] [CrossRef]
- Vachon, P.W.; Dobson, F.W. Validation of wind vector retrieval from ERS-1 SAR images over the ocean. Glob. Atmos. Ocean Syst. 1996, 5, 177–187. [Google Scholar]
- Wackerman, C.; Rufenach, C.L.; Shuchman, R.A.; Johannessen, J.A.; Davidson, K.L. Wind vector retrieval using ERS-1 synthetic aperture radar imagery. IEEE Trans. Geosci. Remote Sens. 1996, 34, 1343–1352. [Google Scholar] [CrossRef]
- Lin, H.; Xu, Q.; Zheng, Q. An Overview on SAR Measurements of Sea Surface Wind. Prog. Nat. Sci. 2008, 18, 913–919. [Google Scholar] [CrossRef]
- Liu, W.T.; Xie, X. Sea surface wind/stress vector. In Encyclopedia of Remote Sensing; Springer: New York, NY, USA, 2014; pp. 759–767. [Google Scholar] [CrossRef]
- Liu, W.T.; Tang, W. Relating wind and stress under tropical cyclones with scatterometer. J. Atm. Ocean Tech. 2016, 33, 1151–1158. [Google Scholar] [CrossRef]
- Monin, A.S.; Obukhov, A.M. Basic laws of turbulent mixing in the surface layer of the atmosphere. Tr. Akad. Nauk. SSSR Geophiz. Inst. 1954, 24, 164–187. [Google Scholar]
- Stoffelen, A.; Anderson, D. Scatterometer data interpretation: Estimation and validation of the transfer function CMOD-4. J. Geophys. Res. 1997, 102, 5767–5780. [Google Scholar] [CrossRef]
- Donnelly, W.J.; Carswell, J.R.; McIntosh, R.E.; Chang, P.S.; Wilkerson, J.; Marks, F.; Black, P.G. Revised Ocean Backscatter Models at C and Ku-band under High-wind Conditions. J. Geophys. Res. 1999, 104, 11485–11497. [Google Scholar] [CrossRef]
- Hersbach, H.; Stoffelen, A.; de Haan, S. An improved C-band scatterometer ocean geophysical model function: CMOD5. J. Geophys. Res. 2007, 112, C03006. [Google Scholar] [CrossRef]
- Hersbach, H. CMOD5.N: A C-Band Geophysical Model Function for Equivalent Neutral Wind. Available online: http://www.ecmwf.int/sites/default/files/elibrary/2008/9873-cmod5n-c-band-geophysical-model-function-equivalent-neutral-wind.pdf (accessed on 17 August 2023).
- Quilfen, Y.; Chapron, B.; Elfouhaily, T.; Katsaros, K.; Tournadre, J. Observation of tropical cyclones by high-resolution scatterometry. J. Geophys. Res. 1998, 103, 7767–7786. [Google Scholar] [CrossRef]
- Stoffelen, A.; Verspeek, J.A.; Vogelzang, J.; Verhoef, A. The CMOD7 Geophysical Model Function for ASCAT and ERS Wind Retrievals. IEEE J. Sel. Top. Appl. Earth Obs. Remote Sens. 2017, 10, 2123–2134. [Google Scholar] [CrossRef]
- Stoeffelen, A. Toward the true near-surface wind speed: Error modeling and calibration using triple collocation. J. Geophys. Res. 1998, 103, 7755–7766. [Google Scholar] [CrossRef]
- Verspeek, J.; Stoffelen, A.; Verhoef, A.; Portabella, M. Improved ASCAT wind retrieval using NWP ocean calibration. IEEE Trans. Geosci. Remote Sens. 2012, 50, 2488–2494. [Google Scholar] [CrossRef]
- Yun, R.; Stofflen, A.; Verspeek, J.; Verhoef, A. NWP ocean calibration of Ku-band scatterometers. In Proceedings of the IEEE International Geoscience and Remote Sensing Symposium, Munich, Germany, 22–27 July 2012. [Google Scholar] [CrossRef]
- Li, Z.; Stoffelen, A.; Verhoef, A.; Verspeek, J. Numerical Weather Prediction Ocean Calibration for the Chinese-French Oceanography Satellite Wind Scatterometer and Wind Retrieval Evaluation. Earth Space Sci. 2021, 8, e2020EA001606. [Google Scholar] [CrossRef]
- Li, Z.; Verhoef, A.; Stoffelen, A.; Shang, J.; Dou, F. First Results from the WindRAD Scatterometer on Board FY-3E: Data Analysis, Calibration and Wind Retrieval Evaluation. Remote Sens. 2023, 15, 2087. [Google Scholar] [CrossRef]
- Lehner, S.; Horstmann, J.; Koch, W.; Rosenthal, W. Mesoscale wind measurements using recalibrated ERS SAR images. J. Geophys. Res. 1998, 103, 7847–7856. [Google Scholar] [CrossRef]
- Lehner, S.; Schulz-Stellenfleth, J.; Schattler, B.; Breit, H.; Horstmann, J. Wind and wave measurements using complex ERS SAR wave mode data. IEEE Trans. Geosci. Remote Sens. 2000, 38, 2246–2257. [Google Scholar] [CrossRef]
- Horstmann, J.; Schiller, H.; Schulz-Stellenfleth, J.; Lehner, S. Global wind speed retrieval from SAR. IEEE Trans. Geosci. Remote Sens. 2003, 41, 2277–2286. [Google Scholar] [CrossRef]
- Horstmann, J.; Koch, W. Measurement of ocean surface winds using synthetic aperture radars. IEEE J. Ocean. Eng. 2005, 30, 508–515. [Google Scholar] [CrossRef]
- Vachon, P.W.; Dobson, F.W. Wind retrieval from radarsat sar images: Selection of a suitable C-band HH polarization wind retrieval model. Can. J. Rem. Sens. 2000, 26, 306–313. [Google Scholar] [CrossRef]
- Monaldo, F.; Jackson, C.; Li, X.; Pichel, W.G. Preliminary evaluation of Sentinel-1A wind speed retrievals. IEEE J. Sel. Top. Appl. Earth Obs. Remote Sens. 2016, 9, 2638–2642. [Google Scholar] [CrossRef]
- Wang, H.; Yang, J.; Mouche, A.; Shao, W.; Zhu, J.; Ren, L.; Xie, C. GF-3 SAR ocean wind retrieval: The first view and preliminary assessment. Remote Sens. 2017, 9, 694. [Google Scholar] [CrossRef]
- Wei, S.; Yang, S.; Xu, D. On accuracy of SAR wind speed retrieval in coastal area. Appl. Ocean Res. 2020, 95, 102012. [Google Scholar] [CrossRef]
- Yang, X.; Li, X.; Pichel, W.G.; Li, Z. Comparison of ocean-surface winds retrieved from QuikSCAT scatterometer and RADARSAT-1 SAR in offshore waters of the US west coast. IEEE Geosci. Remote Sens. Lett. 2011, 8, 163–167. [Google Scholar] [CrossRef]
- Horstmann, J.; Koch, W.; Lehner, S.; Tonboe, R. Ocean winds from RADARSAT-1 ScanSAR. Can. J. Remote Sens. 2002, 28, 524–533. [Google Scholar] [CrossRef]
- Zhang, B.; Perrie, W.; He, Y. Wind speed retrieval from RADARSAT2 quad-polarization images using a new polarization ratio model. J. Geophys. Res. 2011, 116, C08008. [Google Scholar] [CrossRef]
- Takeyama, Y.; Ohsawa, T.; Kozai, K.; Hasager, C.B.; Badger, M. Comparison of Geophysical Model Functions for SAR Wind Speed Retrieval in Japanese Coastal Waters. Remote Sens. 2013, 5, 1956–1973. [Google Scholar] [CrossRef]
- Mouche, A.; Chapron, B. Global C-Band Envisat, RADARSAT-2 and Sentinel-1 SAR Measurements in Copolarization and Cross-polarization. J. Geophys. Res. 2015, 120, 7195–7207. [Google Scholar] [CrossRef]
- Lu, Y.; Zhang, B.; Perrie, W.; Mouche, A.A.; Li, X.; Wang, H. A C-Band Geophysical Model Function for Determining Coastal Wind Speed Using Synthetic Aperture Radar. IEEE J. Sel. Top. Appl. Earth Obs. Remote Sens. 2018, 11, 2417–2428. [Google Scholar] [CrossRef]
- Mallard, M.; Nolte, C.; Spero, T.; Bullock, R.; Alapaty, K.; Herwehe, J.; Gula, J.; Bowden, J. Technical challenges and solutions in representing lakes when using WRF in downscaling applications. Geosci. Model Dev. 2015, 8, 1085–1096. [Google Scholar] [CrossRef]
- Katona, T.; Bartsch, A. Estimation of wind speed over lakes in Central Europe using spaceborne C-band SAR. Eur. J. Remote Sens. 2018, 51, 921–931. [Google Scholar] [CrossRef]
- Radkani, N.; Zakeri, B.G. Southern Caspian Sea wind speed retrieval from C-band Sentinel-1A SAR images. Int. J. Remote Sens. 2020, 41, 3511–3534. [Google Scholar] [CrossRef]
- Kudryavtsev, V.; Hauser, D.; Caudal, G.; Chapron, B. A semiempirical model of the normalized radar cross-section of the sea surface 1. Background model. J. Geophys. Res. 2003, 108, FET 2-1–FET 2-24. [Google Scholar] [CrossRef]
- Zheng, H.; Zhang, J.; Khenchaf, A.; Li, X.-M. Study on Non-Bragg Microwave Backscattering from Sea Surface Covered with and without Oil Film at Moderate Incidence Angles. Remote Sens. 2021, 13, 2443. [Google Scholar] [CrossRef]
- Voronovich, A.; Zavorotny, V. Theoretical model for scattering of radar signals in K u-and C-bands from a rough sea surface with breaking waves. Waves Random Media 2001, 11, 247–269. [Google Scholar] [CrossRef]
- Sadovsky, I.N.; Kuzmin, A.V.; Sharkov, E.A.; Sazonov, D.S.; Pashinov, E.V.; Asheko, A.A.; Batulin, S.A. The Analysis of Dielectric Permittivity’s Models of Water Environment, Used in Tasks of Remote Sensing of Water Areas; Space Research Institute of RAS: Moscow, Russia, 2002; Volume 2172, p. 60. [Google Scholar]
- Girin, S.N. Analysis of the validity of restrictions on the operation of passenger vessels in the Gorky reservoir. Russ. J. Water Transp. 2022, 72, 167–179. [Google Scholar] [CrossRef]
- Elfouhaily, T.; Chapron, B.; Katsaros, K.; Vandemark, D. A unified directional spectrum for long and short wind-driven waves. J. Geophys. Res. Oceans. 1997, 102, 15781–15796. [Google Scholar] [CrossRef]
- Baydakov, G.A.; Kandaurov, A.A.; Kuznetsova, A.M.; Sergeev, D.A.; Troitskaya, Y.I. Field studies of features of wind waves at short fetches. Izv. Ross. Akad. Nauk. Seriya Fiz. 2018, 82, 1569–1572. [Google Scholar] [CrossRef]
Disclaimer/Publisher’s Note: The statements, opinions and data contained in all publications are solely those of the individual author(s) and contributor(s) and not of MDPI and/or the editor(s). MDPI and/or the editor(s) disclaim responsibility for any injury to people or property resulting from any ideas, methods, instructions or products referred to in the content. |
© 2023 by the authors. Licensee MDPI, Basel, Switzerland. This article is an open access article distributed under the terms and conditions of the Creative Commons Attribution (CC BY) license (https://creativecommons.org/licenses/by/4.0/).

