Abstract
The objective of this work is to analyze the spatial-temporal features of the trends in the frequency and amount of erosion-hazardous precipitation in the European part of Russia (EPR) for the period 1966–2020, as a reflection of the influence of climatic changes on surface runoff from the cultivated slopes during the warm season. One hundred and fifty-nine EPR weather stations were selected for analysis based on the length of the time series and the amount of missing data. Several characteristics of erosion-hazardous precipitation were considered: the number of days with a daily precipitation of more than 12.7 mm, the number of days with a daily precipitation of 12.7 to 40 mm, the number of days with a daily precipitation of more than 40 mm, the maximum one-day precipitation. In general, it can be stated that even within the southern taiga, mixed forests, and forest-steppe ecoregion (broad-leaved forests), within which a positive increase in the frequency of erosion-hazardous precipitation was detected, there was no significant increase in the rate of washout and linear washout, which is primarily due to a more significant reduction of slope runoff and soil washout during spring snowmelt. Precipitation, the daily amount of which is more than 40 mm, as well as the maximum daily amount of precipitation, show an upward trend in the western contact zone of mixed forests and forest-steppe, on the Black Sea coast, as well as in the northern foothills of the Caucasus, where their contribution to erosion processes is likely to increase against the decrease in the number of days with precipitation of a 12.7–40 mm daily amount.
1. Introduction
The current climatic epoch is characterized by a global intensification and redistribution of the water cycle [1,2,3]. The greater the amount and the more intense precipitation results in a greater runoff, which in turn contributes to increased soil erosion in different regions of the world [4,5]. Showers, which are rainfalls of high intensity, are the leading factor in soil erosion. Rainfall erosion of soils is mainly due to two processes: the impact of raindrops on the soil surface and surface runoff, which is formed when the amount of incoming water exceeds the soil’s infiltration capacity [6,7,8]. According to the Fifth Assessment Report of the Intergovernmental Panel on Climate Change [9] the coming decades are expected to bring more intense rains. This trend has been traced since the twentieth century for Europe and the European part of Russia (EPR) [10,11,12,13,14,15,16,17]. Summer precipitation on EPR increased by 10% for the period 1936–2010 [14,18]. This growth is also accompanied by a significant redistribution of the precipitation regime, which is observed both for the EPR and for Europe as a whole: heavy rainfall becomes more intense and longer [15]. As indicated in [15], the average daily amount of extreme precipitation for the EPR has increased by 4–9 mm over the past 60 years. The reason for such a change in the precipitation regime can be an increase in the water-holding capacity of the air as a result of an increase in its temperature [19,20]. At the same time, long-term changes in precipitation are characterized by high spatial-temporal irregularity within the EPR. For example, in the Middle Volga region (more than 1 million km2), the annual precipitation in the period from 1955 to 1972 decreased on average by 28 mm. This was followed by a sharp increase in precipitation amounts (by 45 mm over next 17 years), which ended in the late 1980s. After that time, the amount of precipitation did not change significantly in the Middle Volga region [21].
Rainfall erosion recently played an important role in the southern half of the European part of Russia, because it led to soil losses up to 30–40 t ha−1 per extreme rainfall event [22]. As a result, the contribution of extreme events in annual soil losses reached 80–85% from the total soil losses due to both snowmelt and rainfall erosion in forest-steppe and steppe ecotone zones of the EPR. At the same time, the main gully headcuts retreat occurs during the snowmelt period according to the long-term monitoring for growth of agricultural gullies in the Vyatka–Kama interfluve [23].
Erosive precipitation is defined as rainfall with the daily amount (cumulative rainfall depth) exceeding 10 mm [24], but according to the results of long-term monitoring of the rate of soil runoff from plowed slope catchments, more than 75–80% of total soil losses were due to extreme rainfall, the daily amount of which is more than 40–50 mm [25]. In the 1980s, a map of the erosion potential of precipitation was compiled for the entire territory of the USSR based on the processing of pluviograms of 660 meteorological stations over a 20-year (1961–1980) period [26]. The erosion potential of rains, calculated as the product of the kinetic energy of rain and the maximum 30-min rain intensity, showed a high correlation with the amount of precipitation [26], which makes it possible to use data on the frequency of erosion-hazardous precipitation to assess trends in the intensity of soil runoff.
The objective of this work is to analyze the spatial-temporal features of the trends in the frequency and amount of erosion-hazardous rainfall on the EPR for the period of 1966–2020, as a reflection of the influence of climatic changes on the formation of surface runoff from the cultivated slopes during the warm season, to get an insight of possible present changes in the erosive potential of precipitation compared to the picture established in 1980, while pluviograms are not publicly available.
2. Materials and Methods
2.1. Territory under Study
Estimates of the trends of erosion-hazardous precipitation were carried out for the territory of the European part of Russia (EPR). The EPR covers an area of approximately 4 million km2 and contains several ecological regions, from tundra to deserts (Figure 1). The territory stretches from north to south for more than 2400 km. This territory is inhabited by the majority of the Russian population (almost 95 million people). The zonal distributions of climatic elements (as well as disproportionate heat and moisture in different parts) are considered to be the main characteristics of the climate. Atlantic air masses are transformed as they move inland, and climatic conditions change significantly from west to east, resulting in long-term landscape differentiation [27]. The distributions of temperature characteristics can be seen. The average annual temperature changes from 8 °C in the north-eastern part of the EPR to 12–14 °C on the Black Sea coast and the Caspian lowland [28]. Annual precipitation has a maximum value in the western plain part of the EPR and is about 600 mm, with a trend to decrease in the north and, in the south-east, an extremely heterogeneous distribution of precipitation is typical for different ecoregions. The maximum annual rainfall is reached in the Caucasus Mountains where the annual precipitation is 3200 mm.
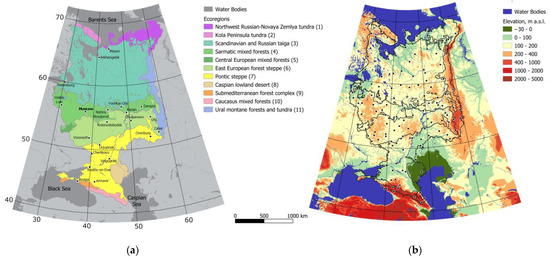
Figure 1.
Map of the territory under study: (a) Ecoregions (Olson et al., 2001; Dinerstein et al., 2017) are shown by color filling and reference geographical objects are labelled; (b) Relief of the territory is shown by color filling, the meteorological stations are shown by dots, the ecoregions are delineated.
It should be noted that the rates of soil water erosion on the slopes of the interfluves in undisturbed landscapes within the EPR, most of which is in the temperate climatic zone, are negligible [24]. However, in the case of plowing and any other disruption of the vegetation cover, which protects the soil from the impact of raindrops and the eroding activity of surface runoff, the soil erosion rates increase up to 30–50 t ha−1 per event [29]. The average soil erosion rate on the arable land in the territory studied amounts to 4.04 t ha−1yr−1, considering the soil-protective coefficients of crops. In the annual soil loss by erosion, storm runoff erosion prevails at 3.78 t ha−1yr−1 and the erosion by snowmelt is considerably lower at only 0.26 t ha−1 yr−1 [30,31].
Three groups of ecoregions within the EPR (Figure 1) can be distinguished. The first group includes territories with a limited proportion of arable land and local but quite significant anthropogenic disturbances of the vegetation cover, associated mainly with transport arteries (pipelines, roads) and mining (tundra and taiga). The second group includes ecoregions with arable farming, which mainly accounts for less than 20–40% of the total area (Central European mixed forests, high-altitude zones of the Caucasus). In addition,, in fact, only the third group (the forest-steppe and steppe ecoregions, as well as the sub-Mediterranean forests of the Black Sea coast and the Caucasus mixed forests) are the territories where arable land accounts for 30% to 80% of the total area and for which rainfall soil erosion leads to soil degradation. These territories are particularly in need of assessing possible changes in the frequency of erosion-hazardous rainfall, especially because intense rainfalls very rarely are observed outside the area of widespread development of arable farming. Precipitation in the north of the forest zone (tundra, northern taiga, middle taiga) is scarce as well as in desert ecoregion.
2.2. Data
Daily precipitation data of the network of meteorological stations are provided by the Russian Research Institute of Hydrometeorological Information—World Data Center [32].
One hundred and fifty-nine EPR weather stations were selected for the analysis based on the length of the time series and the amount of missing data. Until 1966, the protocols for measuring precipitation changed several times. Since 1966, the precipitation data can be considered homogeneous [33]. We excluded from the data years that encountered more than 5% of missing daily observations during the warm period (a slightly stricter criterion was taken compared to the recommendations of [15]).
Threshold values of erosion-hazardous rainfalls may differ depending on the ecoregion, underlying surface, and timing during the season. Nevertheless, a single quantitative precipitation threshold for every ecoregion, as proposed by Renard [34], was considered adequate to analyze the precipitation regime as a natural background of erosion processes and its trends. The cumulative rainfall of an event greater than 12.7 mm is the criteria for the identification of an erosive event, which is widely used elsewhere [34]. The current study uses the daily precipitation greater than 12.7 mm as a surrogate of an erosive rainfall due to the lack of information about individual rainfalls. It should be admitted that such a daily amount of precipitation does not always characterize intense rainfall, it can also be erosion-free incessant rains with a relatively large daily amount, but not giving surface runoff and, consequently, soil washout.
Several characteristics of erosion-hazardous precipitation were considered (Table 1).

Table 1.
Indices of erosion-hazardous precipitation.
The value of the total precipitation of the warm season (Rwtot) was also considered, which, overall, correlates substantially with the erosion index of precipitation for the given area [35]. The total precipitation of the warm season was used as supplement information about overall processes accompanying redistribution of the erosion-hazardous precipitation.
Since the study involves a large latitudinal gradient, the start date and the duration of the warm season associated with liquid precipitation depends on the location of the meteorological station within EPR. The boundaries of the warm season at each station were defined in such a way as to minimize the likelihood of solid precipitation. The boundaries of the warm season at each station were calculated as the dates of the beginning and the end of the period, during which the number of days with solid precipitation (snow, snow pellets, sleet, etc.) for all observation years is less than 0.1% in relation to all observation days.
Each station has its own estimated start and end dates for the warm season, which were set constant throughout the study period.
2.3. Regression Models
Analysis of time trends was carried out for threshold indices of precipitation, for the total amount of precipitation, and the 1-day precipitation maximum of the warm period.
The precipitation trends at each weather station were estimated using generalized additive models of location, scale, and shape (GAMLSS) [36], linking the analyzed characteristics of precipitation (dependent variable) with the calendar year (predictor). GAMLSS allows to evaluate both linear and nonlinear trends, as well as to take into account various laws of distribution of dependent variables. The link function between the dependent and predictor variables varied and depended on the distribution of the dependent variable. The most appropriate distribution of each dependent variable at each weather station was selected using an optimization algorithm of the GAMLSS package [37]. The variety of possible configuration of precipitation dynamic was formalized by two trend models: (1) monotonic (increase, decrease), (2) non-monotonic (unimodal, parabola opening down or up). Two competitive precipitation trend models were created: monotonic with first-degree-polynomial predictor and unimodal model based on a second-degree polynomial predictor. The choice of the model that better describes the dynamics of precipitation time series was based on the Akaike information criterion (AIC). The trend statistical significance of the final model was assessed.
To analyze the spatial patterns of changes in the rainfall regime, the estimated precipitation trends were divided into two groups: current growth (monotonic growth or growth after a decline), current decline (monotonic decline or decline after growth).
A model was used to calculate the following features of the trend: (1) expectation of the initial state of the variable in 1966; (2) expectation of the variable at the end of the study in 2020; (3) the difference between expectations of the variable in 2020 and 1966; (4) the amplitude of variable as the difference between the maximum and minimum model expectations for the period 1966–2020.
The results are summarized for ecological regions (Figure 1). It should be noted that the mixed forest and steppe ecoregions having the highest density of meteorological stations are the most representative.
Calculations, model fitting, statistical tests and visualization were performed in the R environment [38].
3. Results
The ecoregions of EPR could be divided into three groups according to the precipitation regime. The first group includes both tundra ecoregions featured by the lowest amount of precipitation (labelled as 1, 2 in Figure 2). The second group constitutes of forest (taiga, mixed forest, Ural montane forest) and steppe ecoregions and possesses more precipitation, with the frequency of the most erosion-hazardous precipitation (>40 mm per day) being less than one per year (ecoregions labelled 3–8, 11 in Figure 2). The precipitation richest group of ecoregions comprises sub-Mediterranean and Caucasus forests, having the 1–5 days with more than 40 mm of precipitation per warm season (labelled as 9, 10 in Figure 2).
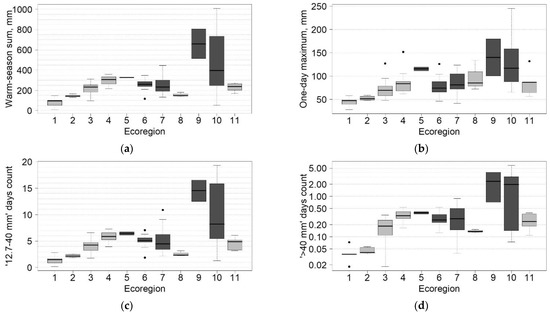
Figure 2.
Precipitation regime of ecoregions: (a) histogram of mean sums of warm-season precipitation (Rwtot), mm. (b) histogram of the mean warm-season one-day maximum precipitation (R × 1 day), mm. (c) histogram of the mean number of days with daily precipitation from 12.7 to 40 (R12.7–40) mm. (d) histogram of the mean number of days with daily precipitation more than 40 mm (R40); vertical axis is logarithmic. Darkened boxes correspond to ecoregions with arable lands. Numeration of ecoregions corresponds to Figure 1.
Most of the precipitation trends are statistically insignificant (Table 2), which is due to the stochastic nature of the precipitation and its high temporal variability; however, a spatial consistency of trends can be stated.

Table 2.
Trend models per ecoregion. Numbers in cells denote the number of time series (stations) with model fitted. Numbers in brackets denote number of statistically significant models. Bold font highlights cells with statistically significant models. Italic font denotes the percent of time series with the fitted model by the total number of stations.
Daily precipitation in the range of 12.7 to 40 mm comprises a substantial part of precipitation of the warm season, so spatial pattern of their trends is similar (Figure 3A,C).
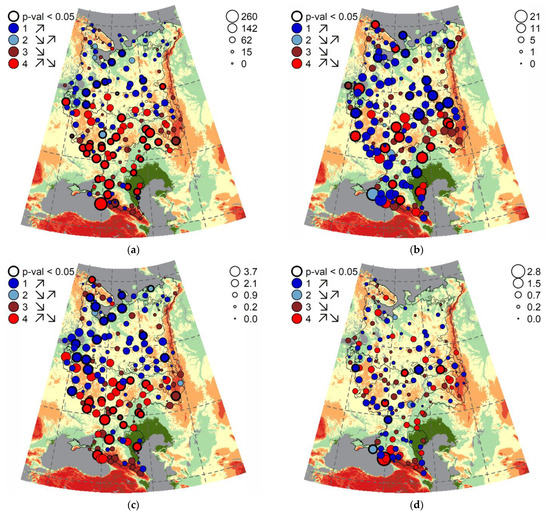
Figure 3.
Maps of precipitation trends amplitude. The amplitude is estimated as the difference between the maximum and minimum expectations of the model during the period of 1966–2020. (a) the amplitude of the total precipitation of the warm season (Rwtot), mm; (b) the amplitude of the warm season one-day maximum (R × 1 day), mm; (c) the amplitude of the number of days with daily precipitation from 12.7 to 40 mm (R12.7–40), days; (d) the amplitude of the number of days with daily precipitation more than 40 mm (R40), days. Legend to the left of the figure: thicker outline of the circles corresponds to statistically significant trends; the color of the icon indicates the type of model that characterizes the time series of the erosion index. Legend to the right of the figure: the size of the icon is proportional to the magnitude of the change.
The taiga ecoregion is characterized by a predominance of tendencies towards an increase in the total amount of the warm season precipitation, as well as an increase in the number of days with the amount of daily precipitation ranging from 12.7 to 40 mm and increase of the one-day maximum precipitation (Table 2, Figure 3A–C and Figure 4). These trends are typical for the provinces of the northern and central taiga, partly for mixed forest and tundra ecoregions except the Kola Peninsula. However, the area of arable land on this territory until 1991 was less than 20% of the total area [39], and after 1991 it decreased by more than half [40]. Given the high projective of vegetation cover even on arable land, due to the significant proportion of perennial grasses in crop rotations, and the prevailing flat relief (low erosion potential of the relief), such a change in the magnitude and structure of precipitation does not lead to an increase in the intensity of soil erosion in given ecoregion [40]. The territory south of the taiga ecoregions, on the contrary, shows more decreasing precipitation trends in the total amount of the warm season precipitation and the amount of daily precipitation ranging from 12.7 to 40 mm (Figure 3A,C and Figure 5).
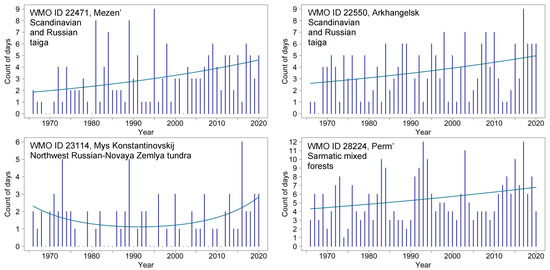
Figure 4.
Examples of current growth trends in the number of days with precipitation from 12.7 to 40 mm (R12.7–40). The station number (WMO ID) is shown in the figures. The trend models are statistically significant at the 0.05 significance level.
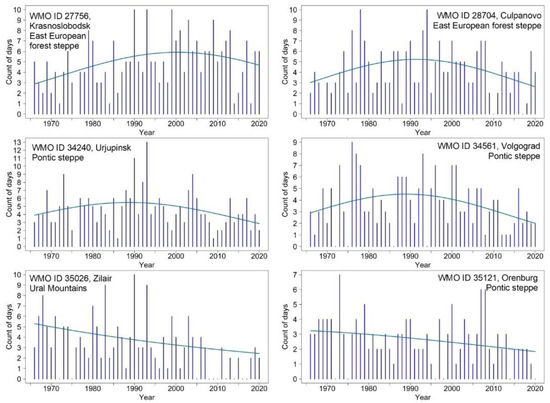
Figure 5.
Trends of the current decline in the number of days with precipitation from 12.7 to 40 mm (R12.7–40). The station number (WMO ID) is shown in the figures. The trend models are statistically significant at the 0.05 significance level.
The model of nonlinear changes “parabola opening upward”, probably is a special case of the current increase against the background fluctuations or wave-like changes, an example of this trend is the number of days with the amount of precipitation ranging from 12.7 to 40 mm at the weather station uttermost north of the forest ecoregion (see station WMO ID 23114 Mys Konstantinovskiy at the Figure 4).
Due to its rarity, precipitation of a daily amount of more than 40 mm demonstrates statistically significant growing trends at only four meteorological stations per European Plain (see the blue circles with a thick outline on the map in Figure 3D): east and west of southern taiga, WMO ID 26477 Velikie Luki and 27485 Yoshkar-Ola; north of steppe ecoregion, WMO ID 34432 Chertkovo, Black sea coast of sub-Mediterranean ecoregion WMO ID 37001 Anapa (see time series and trend models in Figure 6). Recently stabilized growth is observed in the south of the steppe ecoregion WMO ID 37031 Armavir, which is characterized by a statically significant first-degree polynomial predictor (see Figure 7). Despite the scarce erosion-potential rainfalls, the rate of changes of days with precipitation >40 mm is maximal there: the expectation of a number of days with precipitation over 40 mm at the beginning of the studied period in 1966 was zero (WMO ID 27485) or one (WMO ID 26477, 34432) day per decade (0.1), but by the end of the period in 2020 expectation was around 1 day per year (0.9), which means relative increase of 9 times (Figure 8(AIII,BIII) and Figure 9). The expectation of rainfall at Armavir 37,031 in 1966 was 0.4 (about 1 rainfall per 2–3 years) and in 2020 was 1.8 (about 2 rainfalls per year), which means about 4 times relative increase (Figure 8(AIII,BIII) and Figure 9). These weather stations are featured as well by a positive increase in the maximum one-day precipitation (Figure 3B), highlighting the centers of the zones where changes take place. At the same time, there is not any weather station exhibiting a statistically significant monotonically decreasing trend of rainfall events of more than 40 mm of the daily amount. Oscillating trends in the number of days with daily precipitation of more than 40 mm are observed only in the two stations of mixed forests ecoregion, one of forest-steppe ecoregion and one of Caucasus mixed forest ecoregion. Here the maximums were observed in 1980–2000 and currently there is a decline (see the red circles with a thick outline on the map in Figure 3D, see trend models in Figure 7): southern taiga station WMO ID 27459 Nizhny Novgorod, 28418 Sarapul; forest-steppe ecoregion WMO ID 34123 Voronezh.
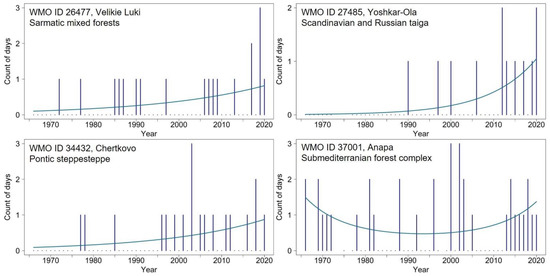
Figure 6.
Linear trends of the current increase in the number of days with precipitation over 40 mm (R40). The station number (WMO ID) is shown in the figures. The trend models are statistically significant at the 0.05 significance level.
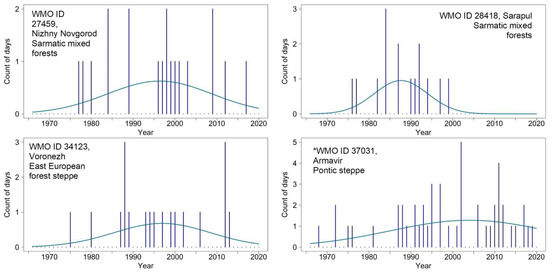
Figure 7.
Unimodal trends of the current decline in the number of days with precipitation over 40 mm (R40). The station number (WMO ID) is shown in the figures. The trend models are statistically significant at the 0.05 significance level. * Exception-trend model for Armavir: model with second degree polynomial is the best by AIC, but only the first term is statistically significant.
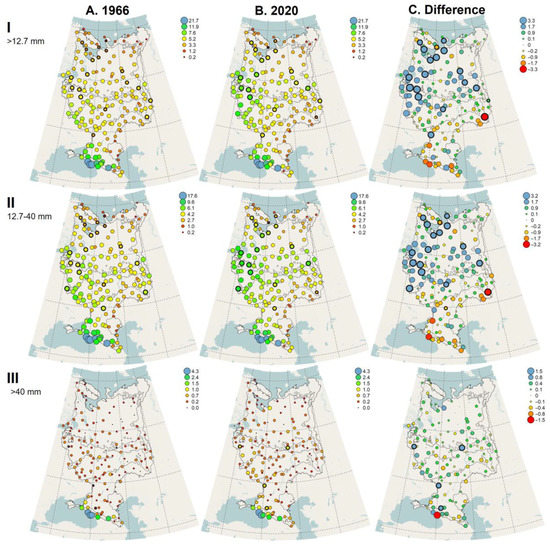
Figure 8.
Maps of the expectation of number of days with erosion-hazardous precipitation for 1966, 2020 and the difference in the number of showers in 2020 compared to 1966. The expectation of the number of days in 1966 and 2020 was estimated by regression models. Column (A): maps of the number of days with erosion-hazardous precipitation in 1966. Column (B): maps of the number of days with erosion-hazardous precipitation in 2020. Column (C): the difference in the number of days with erosion-hazardous precipitation in 2020 compared to 1966. The size and color of the circles reflect the amount of precipitation that falls during the warm season. The thickened outline of the circle corresponds to statistically significant monotonic trends, both rising and falling.
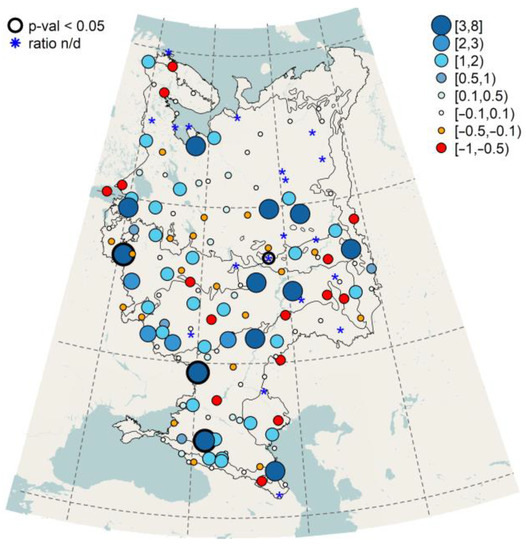
Figure 9.
Relative change of number of days with daily precipitation more than 40 mm (R40) in 2020 compared to 1966 (calculated as the difference between the number of days divided by the reference number of days of 1966). The number of days is computed as regression model prediction. An asterisk denotes non-defined relative change when no rainfall exceeding 40 mm of the daily amount is expected by the regression model in 1966, but the difference is positive.
The stations in the foothills of the Caucasus, the Black Sea coast, the northwest of the steppe ecoregion, and the west of the forest-steppe ecoregion (the periphery of the Central Russian Upland), demonstrate a divergence in the trends of more and less intense precipitation. The trends of the number of days with precipitation amounts ranging from 12.7 to 40 mm there are decreasing (Figure 3C), whereas the trends of the number of days with an amount of precipitation of more than 40 mm are growing (Figure 3D).
One-day precipitation maximum (Figure 3B) is a more informative characteristic of erosion-hazardous precipitation in comparison with the number of days with precipitation of more than 40 mm in those ecoregions that are characterized by low seasonal precipitation: see increasing trend of one-day maximum at weather station 34,579 Verkhniy Baskunchak in the Caspian lowland plain. An increase in the one-day precipitation maximum can be seen in most of the EPR weather stations. At the same time two territories with a distinct modern decrease in this characteristic are clearly distinguished: the belt between 50- and 55-degrees north latitude in forest steppe ecoregion (Trans-Volga region, Oka-Don lowland and Valley of Polesie in the middle Taiga) and north-west of Caspian sea.
The identified trends estimate the expectation of the days with the most massive precipitation, but this expectation may be significantly less than the real number of days with observed extreme precipitation events. The trend direction of the expected number of days with a certain precipitation amount in most cases coincides with a similar direction of variance trend. However, some trends featured by a statistically significant model of monotonic increase or decrease have peak outliers in 1980–2000 (see several examples at Figure 5, station WMO ID 35026 Zilair; Figure 7, station WMO ID 22471 Mezen and WMO ID 22550 Arkhangelsk).
4. Discussion
It is possible to note that increase of a total amount of warm season precipitation and the number of days with daily precipitation from 12.7 to 40 mm is only observed in the northern part of the Russian Plain, while the south half of the EPR territory has probably already passed the peak of the growth of precipitation amount and erosion-hazardous precipitation that occurred decades ago. Similar increasing trends were found in studies covering the territory of Russia and neighboring countries, mainly in terms of annual precipitation and, in part, precipitation in the summer period [10,16,41,42,43,44]. Thus, according to [13], there is an increase in heavy precipitation (95% quantile) in the north of the European part of Russia (excluding the Kola Peninsula), in the west of the EPR (border with Belarus); a decrease in the amount of heavy precipitation is observed in the South Urals, in the Lower Volga region. The spatial patterns identified in this study for the forest-steppe and steppe ecoregions are also consistent with previous study [33], according to which, for the period 1977–2006, there is a decrease in the number of days with heavy precipitation in the south and south-west of the EPR, then as for the period 1951–2006, no significant linear trend coefficients were noted for summer precipitation (which could probably be due to the presence of a nonlinear trend). Trends in the southern part of Russia, in the Black Sea coast, and the foothills of the Caucasus are consistent with the study [45], which shows an increase in the daily precipitation maxima for summer season.
Despite the presence of the identified trends of the most abundant precipitation, it should be noted that the overwhelming number of models are not statistically significant, which may be largely due to the rare periodicity and high spatial unevenness of erosion-hazardous precipitation, as is observed within other plains of the temperate climatic zone [46,47,48,49].
In general, even the identified positive trends in the frequency of erosion-hazardous precipitation noted for the forest ecoregion did not find their reflection, as could be expected, in an increase in the gully top retreat rates. The results of seasonal monitoring of more than 45 tops of gullies, which have been carried out in the Udmurtia (the eastern part of the southern taiga zone) since 1978 to the present, show that in the last 20 years the rate of summer surface runoff related to heavy rainfall practically did not change in comparison with the previous period, but at the same time, the linear retreat of gully tops related to snow melting sharply decreased, especially after 1998, which indicates a corresponding decrease in surface runoff from arable slopes during spring runoff [23]. A sharp reduction in the active gully density, the number and length of actively growing gullies over the past 30-50 years was revealed based on the interpretation of high-resolution aerial and satellite images for the corresponding periods for the eastern part of the forest (mixed and broad-leaved forests, southern taiga), forest-steppe ecoregions, eastern part of steppe ecoregion [50,51]. This is also indicates an overall reduction in surface runoff from arable slopes. Mal’tsev et al. [52] estimated the rates of soil erosion in four river basins with a high proportion of arable lands, and it was also shown that the rates of soil erosion have decreased in the forest and eastern part of the steppe ecoregions and have slightly increased in the south of the steppe ecoregion.
The revealed tendencies of changes in the frequency of occurrence of erosion-dangerous showers allow considering the changes in runoff and washout in the most agriculturally developed ecoregions of the EPR at the current moment compared to 1966 to be small (Figure 8), although significant fluctuations of indices of erosion hazardous precipitation were observed throughout the period (Figure 3). At the same time evaluations of sediment deposition rates in the bottoms of first-order valleys with completely plowed catchments in the west of the forest-steppe ecoregion (central and north parts of Central Russian Upland), based on bomb-derived and Chernobyl-derived 137Cs dating, indicate a distinct trend of erosion decrease in the period after 1986 compared with the previous time window 1963–1986 [31,53,54]. This unambiguously testifies a similar decrease in the rate of soil washout on arable land after 1986, since, in fact, the main source of accumulated sediments in the valley bottoms is the soil washed away from arable land. It is likely that the peak manifestations of erosion-hazardous precipitation observed in the forest-steppe ecoregion at the turn of the 1980s–1990s could have led to the appearance of new gullies three decades ago. However, this did not affect the general trend of a decrease in the rate of washout in the period 1986–2020, due to a sharp decrease in runoff and washout from cultivated slopes during the snowmelt period, which decreased in recent decades due to an increase in soil temperatures in winter [55] and reduction in the depth of frozen soil [53]. Secondly, soil protection coefficients of crop rotations also change over time, depending on the sown crops and, accordingly, their changes can lead to both an increase and a decrease in total soil losses due to sheet and rill erosion [4,24].
The analysis makes it possible to refine the estimates and hypotheses about the direction of the trends of the regime of erosion-hazardous precipitation for the EPR. In general, insignificant changes in the frequency of precipitation at the beginning of the 21st century compared to the 1966s to 1980s were identified, which have not led to a significant impact on the soil erosion rates from the arable lands of EPR. However, further climate changes may lead to a sharper increase in the erosion potential of rainfall, as it is already observed in several regions of the world, especially in parts of central and western Europe [5,56]. In this regard, it is necessary to improve the models used to identify trends in erosion-hazardous precipitation. A superior model will allow simultaneous modeling of the frequency and amount of precipitation, as opposed to the orthogonal approach used in this article, where each parameter is modeled independently of the other. A spatio-temporal model is needed, which could deal with the parameters of temporal trends in each station, “smoothly” changing in space, and consider their spatial covariance.
It is possible that the current study underestimates increasing precipitation trends because the timing of the warm season has been assumed to be constant. Climate change, which also affected the EPR, led to an increase in the duration of the warm season and as a consequence, an extension of the period of erosive rains [57,58]. Climate projections indicate that the change in the length of the summer season will continue, and therefore a reassessment of erosion hazards is also required [59].
5. Conclusions
The frequency of warm season precipitation, the daily amount of which is 12.7–40 mm, is currently increasing in the forest taiga ecoregion (except the Kola Peninsula) of the EPR. At the same time, the number of days with the daily amount of precipitation of 12.7–40 mm in the central part of the southern taiga, in the steppe ecoregion, in the forest and alpine altitudinal zones, and in the subtropics of the Black Sea coast reached maximum values in 1980–2000 and is currently decreasing to the level of 1966. The exception is the most continental south-eastern part of the steppe zone (Elevated Syrt Trans-Volga region and South Ural landscape province), where a pronounced monotonic decreasing trend is observed.
Precipitation, the daily amount of which is more than 40 mm, as well as the maximum daily amount of precipitation, show an upward trend in the southern periphery of the Central Russian Upland, on the Black Sea coast, as well as in the northern foothills of the Caucasus, where their role is likely to increase against the decrease in the number of days with precipitation of a 12.7–40 mm daily amount. The southern part of the Russian plain is currently experiencing a decrease in the total amount of precipitation falling during the warm season. This decrease seems to be due to a decrease in the frequency and amount of less intense precipitation (daily precipitation from 12.7 to 40 mm), with an increasing role of the most intense precipitation (increasing daily maximum, increase in days with daily precipitation over 40 mm).
Decrease in some of the erosion indices does not eliminate the possibility of the occurrence of individual extreme rain events and pronounced erosion consequences or even natural disasters, since the variability of precipitation, even against the background of a decrease in the frequency and amount of precipitation, remains high. The decrease in the total precipitation of the warm period Rwtot in a large part of the European territory of Russia is accompanied by an increase in the maximum 1-day precipitation R × 1 day.
In general, it can be stated that even within the southern taiga, broad-leaved forests, within which a positive increase in the frequency of erosion-hazardous precipitation was detected, there was no significant increase in the sheet, rill, and gully erosion rates, which is primarily due to a more significant reduction of slope runoff and soil erosion during spring snowmelt and due to developed vegetation cover. Probably, this conclusion does not apply to the southern part of the steppe ecoregion and the foothills of the Caucasus, where the contribution of snow-melt runoff to the total erosion has been negligible for a long time, but against the background of a slight decrease in the frequency of daily precipitation less than 40 mm, a slight increase in the frequency of extreme rainfall was noted.
To quantify the possible contribution of increased storm runoff due to increased frequency of the most abundant precipitation, additional field studies are needed in those parts of the ETR where significant changes are stated. Using any erosion models will show an increase in washout rates in these regions. However, without field verification, such estimates are not convincing enough. This study can serve as the basis for the selection of field research sites to assess the washout rate.
Author Contributions
Conceptualization, N.C., O.Y. and V.G.; Data curation, N.C. and S.M.; Formal analysis, N.C., V.G., S.M. and A.S.; Funding acquisition, O.Y. and V.G.; Investigation, N.C., V.G. and A.S.; Methodology, N.C., O.Y., V.G., S.M. and A.S.; Project administration, O.Y. and V.G.; Software, N.C.; Visualization, N.C.; Writing—original draft, N.C. and V.G.; Writing—review & editing, N.C., O.Y., V.G., S.M. and A.S. All authors have read and agreed to the published version of the manuscript.
Funding
This research was funded by the Russian Science Foundation (grant No. 22-17-00025, https://rscf.ru/project/22-17-00025/, accessed on 14 June 2022)—working methodology, preparation, and analysis of data; mathematical and statistical data processing; by State topic Scientific Research Laboratory of Soil Erosion and Fluvial Processes, Faculty of Geography no. 12105110166-4-discussion.
Data Availability Statement
Daily precipitation data of the network of meteorological stations are provided by the Russian Research Institute of Hydrometeorological Information—World Data Center can be accessed via http://meteo.ru/data, accessed on 14 June 2022.
Conflicts of Interest
The authors declare no conflict of interest.
References
- Durack, P.J.; Wijffels, S.E.; Matear, R.J. Ocean Salinities Reveal Strong Global Water Cycle Intensification during 1950 to 2000. Science 2012, 336, 455–458. [Google Scholar] [CrossRef] [PubMed]
- Huntington, T.G. Evidence for intensification of the global water cycle: Review and synthesis. J. Hydrol. 2006, 319, 83–95. [Google Scholar] [CrossRef]
- Dore, M.H. Climate change and changes in global precipitation patterns: What do we know? Environ. Int. 2005, 31, 1167–1181. [Google Scholar] [CrossRef] [PubMed]
- Nearing, M.A.; Pruski, F.F.; O’Neal, M.R. Expected climate change impacts on soil erosion rates: A review. J. Soil Water Conserv. 2004, 59, 43–50. [Google Scholar]
- Panagos, P.; Ballabio, C.; Borrelli, P.; Meusburger, K.; Klik, A.; Rousseva, S.; Tadic, M.P.; Michaelides, S.; Hrabalíková, M.; Olsen, P.; et al. Rainfall erosivity in Europe. Sci. Total Environ. 2015, 511, 801–814. [Google Scholar] [CrossRef]
- Ellison, W.D.; Ellison, O.T. Soil erosion studies part VI: Soil detachment by surface flow. Agric. Eng. 1947, 28, 402–406. [Google Scholar]
- Makkaveev, N.I. River Channel and Erosion in Its Basin; Russian Academy of Sciences: Moscow, Russia, 1955; p. 347. [Google Scholar]
- Schwebs, G.I. Theoretical Foundations of Erosion Science; Vischaya School: Kiev-Odessa, Russia, 1981; p. 224. [Google Scholar]
- IPCC. Climate Change 2013: The Physical Science Basis. Contribution of Working Group I to the Fifth Assessment Report of the Intergovernmental Panel on Climate Change; Cambridge University Press: Cambridge, UK, 2013; p. 1535. [Google Scholar] [CrossRef]
- Roshydromet. Second Roshydromet Assessment Report on Climate Change and Its Consequences in Russian Federation; Roshydromet: Moscow, Russsia, 2014; p. 1008. [Google Scholar]
- Jones, R.J.; Le Bissonnais, Y.; Bazzoffi, P.; Sanchez, D.J.; Düwel, O.; Loj, G.; Øygarden, L.; Prasuhn, V.; Rydell, B.; Strauss, P.; et al. Nature and Extent of Soil Erosion in Europe. In EU Reports of the Technical Working Groups Established under the Thematic Strategy for Soil Protection; Van-Camp, L., Bujarrabal, B., Gentile, A.R., Jones, R.J.A., Montanarella, L., Olazabal, C., Selvaradjou, S.-K., Eds.; Office for Official Publications of the European Communities: Luxembourg, 2004; pp. 145–185. [Google Scholar]
- Routschek, A.; Schmidt, J.; Kreienkamp, F. Impact of climate change on soil erosion–A high-resolution projection on catchment scale until 2100 in Saxony/Germany. Catena 2014, 121, 99–109. [Google Scholar] [CrossRef]
- Bardin, M.Y.; Platova, T.V. Changes in thresholds of extreme temperatures and precipitation on territory of Russia with global warming. Probl. Ekol. Monit. I Modelirovaniya Ekosist. 2013, 25, 71–93. [Google Scholar]
- Groisman, P.Y.; Knight, R.W.; Zolina, O.G. Recent Trends in Regional and Global Intense Precipitation Patterns. In Climate Vulnerability: Understanding and Addressing Threats to Essential Resources; Pielke, A.R., Adegoke, J., Niyogi, D., Kallos, G., Seastedt, R.T., Hossain, F., Eds.; Academic Press: Cambridge, MA, USA, 2013; Volume 2, pp. 25–55. [Google Scholar] [CrossRef]
- Zolina, O. Change in intense precipitation in Europe. In Changes in Flood Risk in Europe; Special Publication No. 10; Kundzewicz, Z.W., Ed.; IAHS Press: Wallingford, UK, 2012; pp. 97–120. [Google Scholar] [CrossRef]
- Bogdanova, E.G.; Gavrilova, S.Y.; Il’in, B.M. Variation in the number of days with heavy precipitation on the territory of Russia for the period of 1936–2000. Russ. Meteorol. Hydrol. 2010, 35, 344–348. [Google Scholar] [CrossRef]
- Roshydromet. Assessment Report on Climate Change and Its Consequences in Russian Federation; Roshydromet: Moscow, Russia, 2008; p. 228. [Google Scholar]
- Groisman, P.Y.; Knight, R.W.; Easterling, D.R.; Karl, T.R.; Hegerl, G.C.; Razuvaev, V.N. Trends in intense precipitation in the climate record. J. Clim. 2005, 18, 1326–1350. [Google Scholar] [CrossRef]
- Santer, B.D.; Mears, C.; Wentz, F.J.; Taylor, K.E.; Gleckler, P.J.; Wigley, T.M.L.; Barnett, T.P.; Boyle, J.S.; Brüggemann, W.; Gillett, N.P.; et al. Identification of human-induced changes in atmospheric moisture content. Proc. Natl. Acad. Sci. USA 2007, 104, 15248–15253. [Google Scholar] [CrossRef] [PubMed]
- Schneider, T.; O’Gorman, P.A.; Levine, X.J. Water vapor and the dynamics of climate changes. Rev. Geophys. 2010, 48. [Google Scholar] [CrossRef]
- Perevedentsev, Y.P. Klimat i Okruzhajushhaja Sreda Privolzhskogo Federal’nogo Okruga (Climate and Environment of the Volga Federal District); Kazan Federal University: Kazan, Russia, 2013; p. 274. [Google Scholar]
- Belyaev, V.R.; Golosov, V.N.; Kislenko, K.S.; Kuznetsova, J.S.; Markelov, M.V. Combining direct observations, modelling, and 137cs tracer for evaluating individual event contribution to long-term sediment budgets. In Sediment Dynamics in Changing Environments; IAHS Press: Wallingford, UK, 2008; Volume 325, pp. 114–122. [Google Scholar]
- Rysin, I.I.; Golosov, V.N.; Grigoryev, I.I.; Zaitceva, M.Y. Influence of climate change on the rates of gully growth in the Vyatka-Kama watershed. Geomorfologiya 2017, 1, 90–103. [Google Scholar] [CrossRef]
- Larionov, G.A. Soil Erosion and Deflation: Basic Patterns and Quantitative Estimates; Moscow State University: Moscow, Russia, 1993; p. 200. [Google Scholar]
- Edwards, W.M.; Owens, L.B. Large storm effects on total soil loss. J. Soil Water Conserv. 1991, 46, 75–78. [Google Scholar]
- Larionov, G.A. Erosion potential of rainfalls. In The Work of Water Streams; Publishing House of Moscow State University: Moscow, Russia, 1987; pp. 17–21. [Google Scholar]
- Alisov, B.P. Climate of the USSR; Moscow University: Moscow, Russia, 1956; p. 128. [Google Scholar]
- Bardin, M.Y.; Rankova, E.Y.; Platova, T.V.; Samokhina, O.F.; Egorov, V.I.; Nikolaeva, A.M.; Gromov, S.A. Report on Climate Features in the Russian Federation in 2018; Rosgidromet: Moscow, Russia, 2019. [Google Scholar]
- Golosov, V.N.; Belyaev, V.R.; Markelov, M.V. Application of Chernobyl-derived 137Cs fallout for sediment redistribution studies: Lessons from European Russia. Hydrol. Process. 2013, 27, 781–794. [Google Scholar] [CrossRef]
- Maltsev, K.; Yermolaev, O. Assessment of soil loss by water erosion in small river basins in Russia. Catena 2020, 195, 104726. [Google Scholar] [CrossRef]
- Golosov, V.; Yermolaev, O.; Litvin, L.; Chizhikova, N.; Kiryukhina, Z.; Safina, G. Influence of climate and land use changes on recent trends of soil erosion rates within the Russian plain. Land Degrad. Dev. 2018, 29, 2658–2667. [Google Scholar] [CrossRef]
- RIHMI-WDC. Baseline Climatological Data Sets. Obninsk, Russia, 2021. Available online: http://meteo.ru/english/data/ (accessed on 25 May 2022).
- Bulygina, O.N.; Razuvaev, V.N.; Korshunova, N.N.; Groisman, P.Y. Climate variations and changes in extreme climate events in Russia. Environ. Res. Lett. 2007, 2, 044020. [Google Scholar] [CrossRef]
- Renard, K.G.; Foster, G.R.; Weesies, G.A.; McCool, D.K.; Yoder, D.C. Predicting Soil Erosion by Water; A Guide to Conservation Planning with the Revised Universal Soil Loss Equation (RUSLE); USDA-ARS: Washington, DC, USA, 1997; p. 404.
- Renard, K.G.; Freimund, J.R. Using monthly precipitation data to estimate the R-factor in the revised USLE. J. Hydrol. 1994, 157, 287–306. [Google Scholar] [CrossRef]
- Rigby, R.A.; Stasinopoulos, D.M. Generalized additive models for location, scale and shape (with discussion). J. Appl. Stat. 2005, 54, 507–554. [Google Scholar] [CrossRef]
- Stasinopoulos, D.M.; Rigby, R.A.; Heller, G.; Voudouris, V.; De Bastiani, F. Flexible Regression and Smoothing: Using GAMLSS in R; Chapman and Hall/CRC: London, UK, 2017; p. 571. [Google Scholar] [CrossRef]
- R Core Team. R: A Language and Environment for Statistical Computing; R Foundation for Statistical Computing: Vienna, Austria, 2022; Available online: https://www.R-project.org/ (accessed on 25 May 2022).
- Litvin, L.F.; Zorina, Y.F.; Sidorchuk, A.Y.; Chernov, A.V.; Golosov, V.N. Erosion and sedimentation on the Russian Plain; Part 1, Contemporary processes. Hydrol. Process. 2003, 17, 3335–3346. [Google Scholar] [CrossRef]
- Litvin, L.F.; Kiryukhina, Z.P.; Krasnov, S.F.; Dobrovol’skaya, N.G. Dynamics of agricultural soil erosion in European Russia. Eurasian Soil Sci. 2017, 50, 1343–1352. [Google Scholar] [CrossRef]
- Rimkus, E.; Kazys, J.; Bukantis, A.; Krotovas, A. Temporal variation of extreme precipitation events in Lithuania. Oceanologia 2011, 53, 259–277. [Google Scholar] [CrossRef]
- Tammets, T.; Jaagus, J. Climatology of precipitation extremes in Estonia using the method of moving precipitation totals. Theor. Appl. Climatol. 2013, 111, 623–639. [Google Scholar] [CrossRef]
- Croitoru, A.E.; Chiotoroiu, B.C.; Todorova, V.I.; Torică, V. Changes in precipitation extremes on the Black Sea Western Coast. Glob. Planet. Chang. 2013, 102, 10–19. [Google Scholar] [CrossRef]
- Voskresenskaya, E.; Vyshkvarkova, E. Extreme precipitation over the Crimean Peninsula. Quat. Int. 2016, 409, 75–80. [Google Scholar] [CrossRef]
- Ashabokov, B.; Tashilova, A.; Kesheva, L.; Taubekova, Z. Trends in Precipitation Parameters in the Climate Zones of Southern Russia (1961–2011). Russ. Meteorol. Hydrol. 2017, 42, 150–158. [Google Scholar] [CrossRef]
- Mätlik, O.; Post, P. Synoptic weather types that have caused heavy precipitation in Estonia in the period 1961–2005. Estonian J. Eng. 2008, 14, 195–208. [Google Scholar] [CrossRef]
- Fiener, P.; Neuhaus, P.; Botschek, J. Long-term trends in rainfall erosivity analysis of high resolution precipitation time series (1937–2007) from Western Germany. Agric. For. Meteorol. 2013, 171, 115–123. [Google Scholar] [CrossRef]
- Soulis, E.; Sarhadi, A.; Tinel, M.; Suthar, M. Extreme precipitation time trends in Ontario, 1960–2010. Hydrol. Process. 2016, 30, 4090–4410. [Google Scholar] [CrossRef]
- Sarhadi, A.; Soulis, E.D. Time-varying extreme rainfall intensity-duration-frequency curves in a changing climate. Geophys. Res. Lett. 2017, 44, 2454–2463. [Google Scholar] [CrossRef]
- Golosov, V.; Yermolayev, O.; Rysin, I.; Vanmaercke, M.; Medvedeva, R.; Zaytseva, M. Mapping and spatial-temporal assessment of gully density in the Middle Volga region, Russia. Earth Surf. Process. Landf. 2018, 43, 2818–2834. [Google Scholar] [CrossRef]
- Medvedeva, R.A.; Golosov, V.N.; Ermolaev, O.P. Spatio-Temporal Assessment of Gully Erosion in the Zone of Intensive Agriculture in the European Part of Russia. Geogr. Nat. Resour. 2018, 39, 204–211. [Google Scholar] [CrossRef]
- Mal’tsev, K.A.; Ivanov, M.A.; Sharifullin, A.G.; Golosov, V.N. Changes in the Rate of Soil Loss in River Basins within the Southern Part of European Russia. Eurasian Soil Sci. 2019, 52, 718–727. [Google Scholar] [CrossRef]
- Golosov, V.N.; Ivanova, N.N.; Gusarov, A.V.; Sharifullin, A.G. Assessment of the trend of degradation of arable soils on the basis of data on the rate of stratozem development obtained with the use of 137 Cs as a chronomarker. Eurasian Soil Sci. 2017, 10, 1195–1208. [Google Scholar] [CrossRef]
- Golosov, V.N.; Walling, D.E.; Konoplev, A.V.; Ivanov, M.M.; Sharifullin, A.G. Application of bomb- and Chernobyl-derived radiocaesium for reconstructing changes in erosion rates and sediment fluxes from croplands in areas of European Russia with different levels of Chernobyl fallout. J. Environ. Radioact. 2018, 186, 78–89. [Google Scholar] [CrossRef]
- Park, H.; Sherstiukov, A.B.; Fedorov, A.N.; Polyakov, I.V.; Walsh, J.E. An observation-based assessment of the influences of air temperature and snow depth on soil temperature in Russia. Environ. Res. Lett. 2014, 9, 064026. [Google Scholar] [CrossRef]
- Mueller, E.N.; Pfister, A. Increasing occurrence of high-intensity rainstorm events relevant for the generation of soil erosion in a temperate lowland region in central Europe. J. Hydrol. 2011, 411, 266–278. [Google Scholar] [CrossRef]
- Golosov, V.N.; Gennadiev, A.N.; Olson, K.R.; Markelov, M.V.; Zhidkin, A.P.; Chendev, Y.G.; Kovach, R.G. Spatial and temporal features of soil erosion in the forest-steppe zone of the East-European Plain. Eurasian Soil Sci. 2011, 44, 794–801. [Google Scholar] [CrossRef]
- Yermolaev, O.P.; Golosov, V.N.; Dvinskikh, A.P.; Litvin, L.F.; Kumani, M.V.; Rysin, I.I. Recent changes in sediment redistribution in the upper parts of the fluvial system of European Russia: Regional aspects. Proc. Int. Assoc. Hydrol. Sci. 2015, 367, 333–339. [Google Scholar] [CrossRef][Green Version]
- Wang, J.; Guan, Y.; Wu, L.; Guan, X.; Cai, W.; Huang, J.; Dong, W.; Zhang, B. Changing lengths of the four seasons by global warming. Geophys. Res. Lett. 2021, 48, e2020GL091753. [Google Scholar] [CrossRef]
Publisher’s Note: MDPI stays neutral with regard to jurisdictional claims in published maps and institutional affiliations. |
© 2022 by the authors. Licensee MDPI, Basel, Switzerland. This article is an open access article distributed under the terms and conditions of the Creative Commons Attribution (CC BY) license (https://creativecommons.org/licenses/by/4.0/).