Abstract
The role of culture conditions on the production of exopolymeric substances (EPS) by Synechococcus strain PCC7942 was investigated. Carbonate mineral precipitation in these EPS was assessed in forced precipitation experiments. Cultures were grown in HEPES-buffered medium and non-buffered medium. The pH of buffered medium remained constant at 7.5, but in non-buffered medium it increased to 9.5 within a day and leveled off at 10.5. The cell yield at harvest was twice as high in non-buffered medium than in buffered medium. High molecular weight (>10 kDa) and low molecular weight (3–10 kDa) fractions of EPS were obtained from both cultures. The cell-specific EPS production in buffered medium was twice as high as in non-buffered medium. EPS from non-buffered cultures contained more negatively charged macromolecules and more proteins than EPS from buffered cultures. The higher protein content at elevated pH may be due to the induction of carbon-concentrating mechanisms, necessary to perform photosynthetic carbon fixation in these conditions. Forced precipitation showed smaller calcite carbonate crystals in EPS from non-buffered medium and larger minerals in polymers from buffered medium. Vaterite formed only at low EPS concentrations. Experimental results are used to conceptually model the impact of pH on the potential of cyanobacterial blooms to produce minerals. We hypothesize that in freshwater systems, small crystal production may benefit the picoplankton by minimizing the mineral ballast, and thus prolonging the residence time in the photic zone, which might result in slow sinking rates.
1. Introduction
Biological carbon fixation by phytoplankton plays a major role in the short and long-term carbon cycles [1], by buffering the oceans through dissolved inorganic carbon speciation, producing dissolved organic matter and precipitating CaCO3 minerals. These carbonate minerals can be transported and integrated into the sedimentary rock record [2]. The picoplankton fraction of pelagic phytoplankton, consisting predominantly of cyanobacteria <3 µm [3], is responsible for ~40% of the total annual CO2 removal from the atmosphere through photosynthesis [4,5,6]. Major picoplankton taxa include the cosmopolitan unicellular cyanobacterial genera Prochlorococcus and Synechococcus [7].
Precipitation of calcium carbonate facilitated by phytoplankton has played a key role in climate regulation through geologic time [2,8], possibly including cyanobacteria [9]. Oxygenic photosynthesis, dating back ~2.5–2.7 Gyr [10], evolved in cyanobacteria [11]. Cyanobacterial metabolism has had a pronounced impact on our planet through oxygen and hydrogen production and nitrogen fixation [12,13,14,15] and continues to do so today [16,17].
The role of picoplankton in photosynthetic carbon production has been extensively studied [18], and their contribution to calcium carbonate precipitation has been proposed [19,20]). In laboratory experiments, Thompson and Ferris [21] demonstrated that Synechococcus spp. are responsible for a major proportion of the marl sediment and carbonate bioherms in Green Lake. Studies of cyanobacterial carbonate precipitation have focused on a change in the saturation index through photosynthetic activity in favor of mineral precipitation:
where [CH2O] depicts organic carbon. In typical aquatic systems, the carbon dioxide removed during photosynthesis is replenished by the atmosphere and through dissociation of bicarbonate ions [22] in the water column:
which enables calcium carbonate precipitation:
by removal of acidity by hydroxyl:
CO2 + H2O ⇆ [CH2O] + O2
HCO3− ⇆ CO2 + OH
HCO3− + Ca2+ ⇆ CaCO3 + H+
H+ + OH− ⇆ H2O
Overall:
2 HCO3− + Ca2+ ⇆ CaCO3 + [CH2O] + O2
However, changes in the saturation index of calcium carbonate typically do not suffice to support precipitation (Equations (3) and (5)): an organic nucleation template is required to catalyze carbonate mineral production [23,24,25,26]. Organic nucleation sites reduce kinetic barriers [27] facilitating initial precipitation and crystal growth. Negatively charged amino acids in proteins, such as deprotonated aspartic or glutamic acids, and in sugars, such as uronic or sialic acids, in exopolymeric substances (EPS) fulfill the role of such a mineral nucleation site [28,29,30]. These constituents have functional groups, such as deprotonated carboxyl groups, that can bind cations such as Ca2+ and Mg2+ [31]. This initially prevents CaCO3 precipitation by removal of these cations from solution and thus has an inhibitory effect. When all binding sites in EPS are occupied, precipitation can commence by forming carbonate mineral nuclei [31] catalyzing carbonate mineral precipitation. Through their specific functional group composition, EPS can exert control on the morphology of the minerals that are formed [26,32].
The composition, physical and chemical properties of EPS vary between species and depend on the specific growth rate [33,34]. Constituents making up microbial EPS include polysaccharides, proteins, nucleic acids, and lipids [29,35,36], with polysaccharides and proteins typically accounting for ~75–90% [37]. The molecular size of EPS ranges from 0.5 to >100 kDa [29], and the hydrophobicity, amphiphilicity, and intermolecular hydrogen bonds determine the colloidal density and dimensions of the polymeric matrix [37,38,39], which in turn depend on the properties (pH, ionic strength) of the solvent [39,40]. EPS interact with their environment through electrostatic and ionic forces, hydrophobic interactions, hydrogen bonds, and covalent crosslinking [33,38].
Both pelagic and benthic cyanobacteria are prolific producers of EPS [41,42], especially under stress conditions [41]. Up to 93% of the photosynthate can be allocated for EPS [42]. Benthic cyanobacteria produce EPS, among other things, to adhere to surfaces [43], provide motility [44], cope with dehydration [45], limit UV exposure [46], or prevent predation [47]. In contrast, EPS excretion in pelagic cyanobacteria is predominantly associated with nutrient limitation, excessive light conditions in the photic zone, and increases in salinity during transport from freshwater to estuaries [34,48,49,50]. High rates of photosynthesis in dense picoplankton populations notably increase the environmental pH [51,52]. Soluble EPS produced by the cyanobacterial picoplankton are a precursor for transparent exopolymeric particles (TEP) [53,54]. The TEP eventually sink, and thus cyanobacterial EPS production is important in organic carbon fluxes in oceanic and freshwater systems [55].
Synechococcus spp. are found in marine and freshwater systems worldwide, and, by their EPS production, contribute to the export of organic carbon to the aphotic zone and sediments [7,48,56,57]. In addition to the flux of organic matter, Synechococcus species have been involved in carbonate precipitation in oligotrophic waters of the open ocean [58,59] and freshwater lakes [20,60,61], typically in elevated pH conditions [20]. The observation of calcium carbonate precipitation in the field by Synechococcus spp. has been corroborated in several laboratory studies [30,62,63,64,65,66].
The role of CO2 fixation by Synechococcus spp. in CaCO3 precipitation has been the topic of several investigations [20,67]. In contrast, the role in carbonate precipitation of the EPS produced by these picoplankton species is largely unknown. This study aims to gain a mechanistic understanding of the EPS production by the freshwater Synechococcus PCC7942 strain under different pH regimes and investigate the potential impact on calcium carbonate precipitation.
2. Materials and Methods
2.1. Cultivation of Synechococcus PCC7942 Strain
The freshwater cyanobacterial strain Synechococcus PCC7942 used in this study was obtained from Centre de Ressources Biologiques de l’Institut Pasteur (CRBIP, Paris, France). Stock cultures were kept in one-third strength BG-11 liquid medium, sterilized by autoclaving [68,69]. Full-strength BG-11 medium consists of (per liter) 1.5 g of NaNO3; 0.04 g of K2HPO4·2H2O; 0.075 g of MgSO4·7H2O; 0.036 g of CaCl2·2H2O; 6 mg of citric acid combined with 6 mg of ferric citrate; 0.001 g of Na2EDTA·2H2O and 0.02 g of Na2CO3. Trace metal solutions contained (per liter) 2.86 mg of H3BO3; 1.81 mg of MnCl2·4H2O; 0.222 mg of ZnSO4·7H2O; 0.39 mg of Na2MoO4·2H2O; 0.079 mg of CuSO4·5H2O and 0.0494 mg of Co(NO3)2·6H2O. The buffered medium was amended with HEPES (25 mM final concentration). The pre-inoculation pH of both buffered and non-buffered medium was 7.5. A culture grown in a full-strength non-buffered BG-11 medium was used as inoculum for the experiments. Cultures were incubated at 21 ± 2 °C, under 12 h:12 h light/dark conditions, with a light intensity of 36.8 μE m−2 s−1 and with constant shaking at 200 rpm. The pH was monitored in each culture twice daily. Growth of cultures was measured through optical density measurements at 750 nm (OD750). In addition, approximately 100 to 200 cells were counted using a hemocytometer in five randomly selected fields of view.
2.2. EPS Extraction and Purification
After 18 days of incubation, cells were harvested by centrifugation (3893× g) for 15 min. The supernatant (S1) was stored at 4 °C for further purification. The cell pellet (P1) was re-suspended in 60 mL of three-times diluted BG-11 medium, gently heated at 36–40 °C for 1 h while shaken at 300 rpm to remove EPS that was loosely attached to the cell surface (LEPS). This cell suspension was then centrifuged at 3983× g for 15 min to remove the remaining EPS from cell walls. The cell pellets (P2) were homogenized, and the extracted supernatant (S2) was combined with supernatant (S1) for subsequent purification by filtration (MF-MilliporeTM 0.22 µm, cellulose nitrate membrane) to remove cell residues. The high molecular weight EPS fraction (HMW; >10 kDa = retentate) was obtained by ultrafiltration on an Amicon Stirred Cell 8400 (Schomdorf, Germany). The EPS permeate (<10 kDa) was subsequently processed by ultrafiltration again on a 3 kDa cutoff membrane and is referred to as the low molecular weight fraction (LMW; 3–10 kDa). Both steps were performed with Ultracel® 10 kDa ultrafiltration regenerated cellulose discs, at 3–4 bar of N2 and concentrated to a volume of approximately 7–15 mL. EPS fractions were dialyzed at 1 kDa (Spectra/Por® Dialysis Membrane) against ultrapure water at 4 °C in the dark for 4 days with constant stirring with water changes every 16 h. Solutions were then frozen in liquid nitrogen and lyophilized for 3 days in a freeze dryer (Telstar Cryodos-50, Terrassa, Spain). The weight of lyophilized material was recorded on a high-performance analytical balance (Quintix 35-1S, Sartorius, Göttingen, Germany) and samples were stored at room temperature until further analysis.
2.3. Chemical Composition of EPS
2.3.1. FT-IR Spectroscopy
Fourier-transform infrared (FT-IR) spectroscopy was performed on a minute subsample of dried EPS. FT-IR spectra were obtained on an FT-IR Bruker Alpha spectrometer (Bruker Optics Sarl, Marne la Vallée, France) fitted with an Attenuated Total Reflectance (ATR) ALPHA-P device equipped with a mono-reflection diamond crystal. A total of 24 scans were performed for each sample at a spectral resolution of 4 cm−1 in the 4000–375 cm−1 wavenumber range. The qualitative assignment of absorption bands was performed by comparison with spectra available in the literature [70].
2.3.2. Protein, Sugar and Glycosaminoglycan Assays
The protein content of the EPS was measured using the Bicinchoninic acid method (Pierce™ BCA Protein Assay Kit) with bovine serum albumin as standard [71]. The sugar content of the EPS was estimated using the phenol-sulfuric acid assay [72] with glucose as standard for LMW EPS, and xanthan and dextran (Sigma-Aldrich, St. Louis, MO, USA) as standards for HMW EPS fraction [73,74]. The total sulfated glycosaminoglycans (sGAG) content was quantified using the Blyscan assay according to the manufacturer’s protocol (Blyscan Kit B1000, Biocolor Ltd., Antrim, UK). This test was previously used for skeletal matrices [75] and required chondroitin sulfate as a standard. All assays were carried out in triplicate.
2.3.3. Molecular Size Distribution Using SDS-PAGE
Sodium Dodecyl Sulfate–Polyacrylamide Gel Electrophoresis (SDS-PAGE) was used to estimate the molecular mass distribution of the EPS extracts, using silver nitrate staining [76], and to identify negatively-charged polymers with Alcian Blue staining [77] in the EPS. Silver nitrate staining reveals all macromolecules, including sugars and proteins [78,79]. Samples were analyzed by conventional mono-dimensional denaturing SDS-PAGE (Mini-Protean 3; Bio-Rad; Hercules, CA, USA), on precast gradient gels (Mini-PROTEAN TGX Gel 4–15% acrylamide, 90 mm × 70 mm, Bio-Rad; Hercules, CA, USA), as previously described [80]. EPS lyophilizates were dissolved in ultrapure water and mixed with Laemmli sample buffer. All EPS preparations were heat-denatured for 5 min at 100 °C. The samples were then cooled on ice and shortly centrifuged (5–10 s) before being applied to the gel. A prestained protein ladder (EUROMEDEX, #06P-0111; MW: 17 kDa to >170 kDa) was used for reference.
2.3.4. Inhibition of CaCO3 Precipitation Using pH-Drift Assay
The pH-drift assay analyzed the effect of negatively charged groups in EPS on the in vitro CaCO3 precipitation [81,82,83]. In this assay, Ca is added stepwise to a sample that contains negatively charged groups capable of binding this cation. When no additional Ca is bound, CaCO3 will precipitate, decreasing the pH (Equation (3)). CaCO3 precipitation was followed by recording the decrease in pH in a solution containing 2 mL of 20 mM NaHCO3 (pH~8.6) and either 0.1 mL of H2O (negative control) or EPS sample and 2 mL of 20 mM CaCl2 (pH~8.6). Increasing concentrations of EPS (from 10 to 150 µg) were tested. A duplicated experiment of the HMW EPS sample from non-buffered medium was performed. The pH was measured with a mini glass electrode (Mettler-2+ Toledo) and recorded on a pH meter (Laboratory Research Grade Benchtop pH/mV Meter with 0.001 pH Resolution-HI5221) connected to a PC with a USB cable. Data were recorded by the HANNA HI92000 software. The pH was measured each 2 s for 20 min. The electrode was treated with 0.1 N HCl between every run, before being rinsed and stabilized in the sodium bicarbonate solution.
2.3.5. Forced Precipitation of Calcium Carbonate
The potential of the EPS to precipitate calcium carbonate was tested in vitro in the presence of a closed NH3/CO2 saturated atmosphere [84]. Eight concentrations of EPS (0, 1, 2, 4, 8, 16, 32, 64 µg·mL−1) were prepared in a 0.22-µm filtered CaCl2 solution (10 mM). A solution of each of the EPS concentrations was incubated in duplicate in 16-well culture plates (Lab-Tek, Nunc/Thermo Scientific, Rochester, NY, USA). The microwell plates were covered, but the gas exchange was possible through a hole drilled in the cover. After 72 h of incubation at 4 °C in the dark, the pH was measured in each well and the overlying solutions were carefully removed by aspiration. The crystals that had formed during the incubation had settled at the bottom of the wells. The microplates were stored under vacuum until image analysis and determination of morphology and mineralogy of the precipitates.
2.3.6. Morphology and Mineralogy of Carbonate Crystals
Carbonate mineral morphology was observed using a tabletop scanning electron microscope (Hitachi TM1000, Ibariki, Tokyo, Japan) in back-scattered electron mode. Mineralogy was determined by FT-IR spectroscopy with an FT-IR Bruker Alpha (Bruker Optics, Sarl, Champs-sur-Marne, Paris, France) with the use of the RRUFF Project database (https://rruff.info (accessed on 1 December 2021)). Samples for SEM viewing, and FT-IR spectroscopy were in their original wells of the microplates used in the forced precipitation experiment.
2.3.7. Crystal Count and Size Distribution
Calcium carbonate crystals were counted using an NACHET-inverted microscope (Paris, France) equipped with Mosaic 2.2.1 image analysis software. Images were processed to obtain the sizes (average width and length of sizes classes 1–50 µm and 50–500 µm) and the total count of the crystals in each of the microplate wells. Ten fields of view, totaling 15.6 mm2, were analyzed. The surface area covered by minerals was estimated by multiplying the average length of short and long crystal axes to obtain the mean crystal surface. This mean surface estimates for the size classes 1–50 µm and 50–500 µm were then multiplied by the crystal counts in each well.
3. Results
3.1. Cell Growth and pH Evolution
Two growth experiments were carried out in duplicate with cultures of Synechococcus PCC7942. The medium had an initial pH of 7.5 and was either non-buffered or buffered by HEPES (25 mM final concentration). In the non-buffered medium, the pH increased within a day from 7.5 to ~9.5, likely due to the high pH of the inoculum in the absence of a buffer (Figure 1). Then, the pH increased slowly during cell growth to reach 10.5 after 18 days at the time of EPS harvest. In the buffered medium, the pH remained constant at 7.5. After a lag phase of a few days, the optical density and cell number increased until harvest for EPS extraction after 18 days (Figure 1). The growth in the non-buffered medium was faster than in the buffered medium. The cell yield in the non-buffered media was 5.1 ± 0.2 × 10¹¹ cell·L−1 and reached 2.1 ± 0.1 × 10¹¹ cell·L−1 in buffered medium.
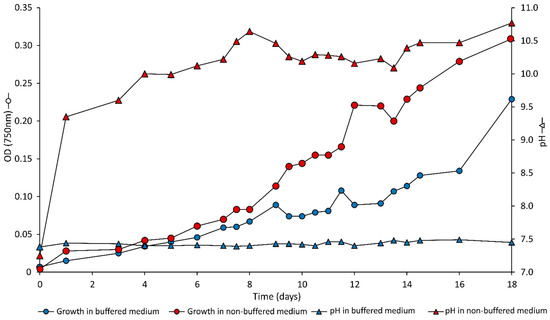
Figure 1.
Optical density (OD750 nm; circles) and pH (triangles) during growth of Synechococcus PCC7942 in non-buffered (red symbols) and buffered (blue symbols) media. The points represent the average of two replicates.
3.2. EPS Production
The total amount of EPS (dry weight) was calculated by adding HMW (>10 kDa) and LMW (3–10 kDa) fractions. In a non-buffered medium, the HMW EPS yield was 12.7 ± 1.0 mg EPS·L−1 and LMW EPS 1.5 ± 0.5 mg EPS·L−1, resulting in a total amount of 14.2 ± 1.5 mg EPS·L−1. In the buffered medium, the recovery of the HMW fraction was 9.3 ± 1.7 mg EPS·L−1 and the LMW was 6.0 ± 0.3 mg EPS·L−1 totaling 15.3 ± 2.0 mg EPS·L−1 (Table 1). The cell-specific EPS production in the non-buffered medium was approximately three times lower than in the buffered medium. The HMW fraction in the non-buffered medium comprised 85–93% of the total EPS weight, and 7–15% was made up of the LMW fraction. In contrast, the buffered medium contained 55–66% of the HMW fraction and 34–45% of the LMW contributed to the total amount of exopolymers.

Table 1.
Cell yield and EPS production in Synechococcus PCC7942 cultures at the time of harvest. Two fractions of EPS were extracted. Data represent the mean of two independent experiments ± standard deviation.
3.3. EPS Characteristics
FT-IR spectroscopy—FT-IR spectra revealed differences in functional group composition between the two culture conditions. There were only minor differences between spectra of the LMW and HMW fractions from each culture condition (i.e., non-buffered and buffered media). The characteristic infrared absorptions bands for polysaccharides and proteins moieties were visualized (Figure 2). Vibrations at 1042–1078 cm−1 (see arrows) could be attributed to n(C–O) stretching vibration of polymers, both proteins [85] and carbohydrates [70]. The bands (930–940 cm−1; see arrows) falling in the range of 927–940 cm−1 were only present in EPS extracts of buffered grown cells and could be assigned to β-glycosidic linkages. The bands (1534–1649 cm−1; see arrows) present between 1445 and 1650 cm−1 were likely due to n(C–N) and n(C=O) stretching vibrations of Amide I-II bands that are typically associated with proteins [70]. Spectra for both HMW and LMW EPS from non-buffered grown cultures show higher peaks of protein than those observed for EPS from cells grown in buffered medium (Figure 2). Additional peaks observed around 3000 cm−1 were assigned to n(C–H) (either in CH3 or CH2) and could be indicative of long-chain polymers (e.g., sugars or proteins). Peaks at 3400 cm−1 could represent stretching elongation of O-H bonds, in either water, alcohols, or sugars.
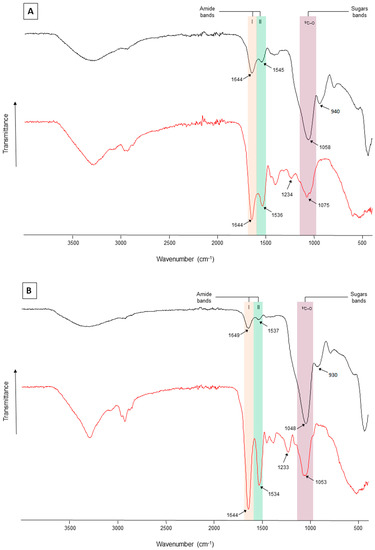
Figure 2.
FT-IR spectra of (A) LMW and (B) HMW EPS fractions produced by Synechococcus PCC7942 grown in non-buffered (red spectra) and buffered (black spectra) media. Amides I-II absorb in the range of 1530–1650 cm−1 (pink and green bands), sulfate groups at ~1233 cm−1, polysaccharides at ~1040–1070 cm−1 (purple band), and the β-glycosidic linkages visible as a shoulder at 930–940 cm−1.
Sugar content—The sugar content of EPS from the non-buffered medium was higher than from the buffered medium. In the HMW fraction, the quantify of sugar in EPS from non-buffered medium was 1.6 times higher than in EPS from buffered medium (Table 2). The sugar content of LMW EPS from non-buffered medium was only slightly higher than that of the EPS from buffered medium (Table 3). When accounting for the difference in cell yield between the two growth conditions, the cell-specific sugar content of HMW EPS extracted from buffered media was 1.2–1.8 times higher than in HMW EPS from non-buffered media. Similarly, the cell-specific sugar content of LMW EPS fraction was 1.4 to 4.0 times higher non-buffered media than in buffered media.
Table 2.
Sugar, protein, and glycosaminoglycan content of the HMW EPS fraction produced by Synechococcus PCC7942 in non-buffered and buffered media. Values represent the average of two replicates ± standard deviation.
Table 3.
Sugar, protein, and glycosaminoglycan content of the LMW EPS fraction produced by Synechococcus PCC7942 in non-buffered and buffered media. Values represent the average of two replicates ± standard deviation.
Protein content—The protein content of the HMW EPS fraction from non-buffered cultures was approximately ten times higher than in buffered cultures (Table 2). The protein content of the LMW in the EPS from the non-buffered cultures was approximately two times higher than in the EPS extracted from the buffered cultures (Table 3). Using cell yield data (Table 1), the cell-specific protein content was 3.0–8.0 times higher in HMW EPS obtained from non-buffered media compared with that from buffered media. In LMW EPS from non-buffered media, the cell-pacific protein content was only 1.3–3.0 times higher compared with that from the buffered media.
Glycosaminoglycan (GAGs) content—GAG analyses included both amino sugars and glycoproteins. Our results indicate that these compounds were present in small quantities only accounting for approximately <1% of EPS (Table 2 and Table 3). In other words, the sugars and proteins in EPS were not sulfated GAGs.
SDS PAGE—Our gel electrophoresis revealed bands between 10 and >170 kDa in HMW EPS fractions when stained with either silver nitrate (Figure 3A) or Alcian Blue (Figure 3B). Replicates showed similar banding patterns. Molecules with an apparent weight <10 kDa were not present in the gel and consequently, macromolecules in the LMW EPS fraction were not detected. Silver-stained gels revealed common bands between 10–17 kDa and 34–43 kDa, which were more intensely stained in EPS from non-buffered medium (Figure 3A, lanes 2–3 vs. lanes 4–5). One replicate EPS sample of non-buffered medium (Figure 3A, lane 3) contained additional macromolecules with molecular weights around 20 kDa (intensely stained) and (>170 kDa). On Alcian Blue-stained gels, a single common band (10–12 kDa) (Figure 3B, lanes 2–5), as well as other single bands between 34–43 kDa (Figure 3B, lanes 2–5) were visible in both EPS from non-buffered and buffered pH conditions. Stronger bands were apparent in EPS from non-buffered medium, indicating a greater presence of negatively charged groups in that EPS (Figure 3B, lanes 2 and 3). In the non-buffered medium, EPS showed other bands with a molecular mass between 34–43 kDa (Figure 3B, lanes 2 and 3) and >170 kDa (Figure 3B, lane 2) that were also more intense compared with the same MW bands expressed in the buffered medium (Figure 3B, lanes 4 and 5). The Alcian Blue staining revealed more macromolecules with negatively charged groups in HMW-EPS extracted from non-buffered medium than from buffered medium, indicative of a higher Ca2+-binding potential.
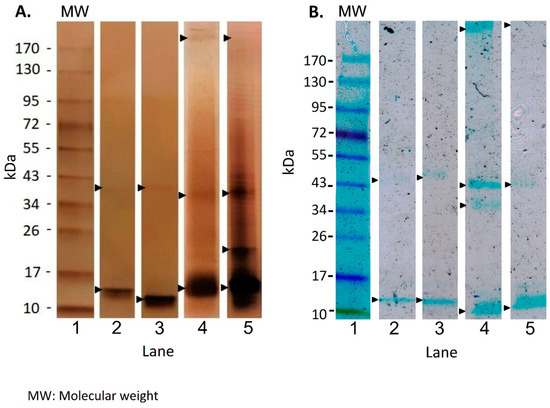
Figure 3.
SDS-PAGE of HMW EPS fraction. Silver nitrate (A) and Alcian Blue (B) staining were applied. Black arrows indicate major bands expressed in EPS from non-buffered (lanes 2, 3) and buffered (lanes 4, 5) media. Molecular ladder reference is shown in lane 1.
Inhibition of CaCO3 precipitation by EPS using pH drift experiments—The pH drift assay determined the inhibition effect of negatively charged groups of the EPS matrix on the rate of calcium carbonate precipitation [81,82,83]. Negatively charged groups of EPS can bind calcium ions from the solution. The more of these functional groups are present, the more calcium can be bound, and the longer precipitation is delayed. This is referred to as inhibition. Complete inhibition is accomplished when the Ca-binding capacity is reached and minerals precipitate lowering the pH (Equation (3)). Clear differences were observed between EPS extracted from buffered and non-buffered cultures (Figure 4A–D; Supplementary Figure S1). Strong inhibition of CaCO3 precipitation was observed in the HMW EPS fraction from the non-buffered medium in solutions containing >20 μg EPS·mL−1 (Figure 4A). The LMW-EPS fraction from the non-buffered medium exhibited less inhibition (Figure 4B). This length of inhibition period increased with increasing EPS concentrations. No inhibition was observed in EPS obtained from the buffered medium (Figure 4C,D).
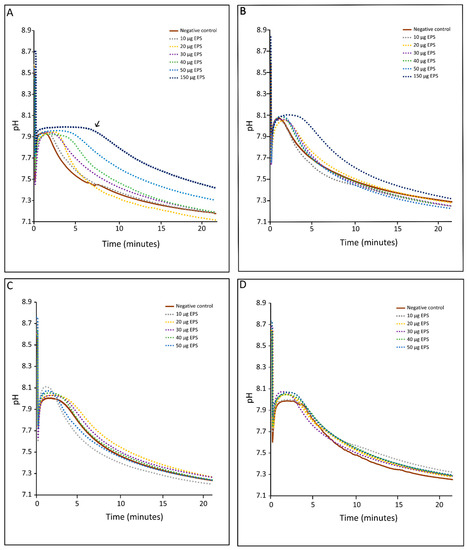
Figure 4.
In vitro inhibition of calcium carbonate precipitation using (A) HMW EPS from non-buffered medium, (B) LMW EPS from non-buffered medium, (C) HMW EPS from buffered medium and (D) LMW EPS from buffered medium. Each panel shows the experiments using EPS extracts with concentrations of 10, 20, 30, 40, 50 and 150 µg·mL−1 on CaCO3 inhibition experiment. The decrease in pH indicates precipitation and a plateau inhibition of carbonate precipitation. A larger plateau indicates stronger inhibition of CaCO3 precipitation (e.g., see arrow in panel (A)). The results in each panel represent single experiments. Replication using HMW EPS from non-buffered medium showed identical results (see Supplementary Figure S1).
3.4. Forced Precipitation and Mineral Properties of Calcium Carbonate
Forced precipitation experiments were carried out in solutions without EPS (Supplementary Figure S2) and in EPS concentrations ranging from 1 to 64 µg·mL−1. Compared with the crystals of the control sample, the different EPS compositions impacted in a specific manner the crystals’ morphology, mineralogy, and size distribution.
Mineral morphology—SEM imaging (Figure 5) showed that EPS supported the precipitation of calcium carbonate. We observed clear differences in mineral morphology with crystals varying from spheroids and rhombohedrons with modified edges to more truncated rhombohedrons that occasionally formed polycrystalline aggregates and measured from 1 µm up to >50 µm. Crystals in EPS solution from buffered medium were round and had smoother faces than crystals that formed in EPS solution from non-buffered media (Figure 5A–D), which were mostly rhombohedral (Figure 5C,D). There was no clear correlation between EPS concentration and crystal morphology.
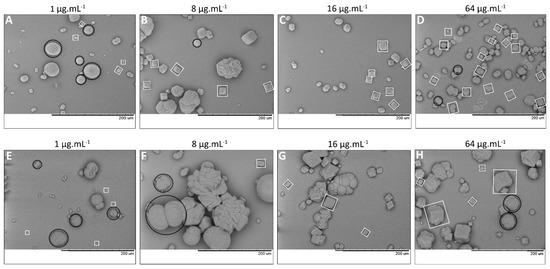
Figure 5.
In vitro forced CaCO3 precipitation in the presence of (A–D) HMW EPS fraction from non-buffered and (E–H) buffered media at increasing EPS concentrations (1, 8, 16 and 64 µg·mL−1). SEM images show two CaCO3 morphologies: rhombohedral (white squares) and spheroidal (black circles) crystals (in some cases shown as polycrystalline spheres, e.g., panel (F)). In EPS from non-buffered medium (A–D), a large number of small crystals formed. In EPS from buffered medium (E–H), a small number of large crystals precipitated. The scale bar (black) at the bottom of the images is 200 µm.
Mineralogy—FT-IR microscopy performed on selected individual crystals > 10 µm revealed that calcite was the most common carbonate polymorph formed in controls and in EPS from both buffered and non-buffered cultures at all tested EPS concentrations. In addition, spheroidal vaterite crystals (>30–50 µm) were detected but only at low EPS concentrations (1 and 8 µg EPS·mL−1; Figure 6A). Calcite precipitated in all EPS concentrations tested (0–64 µg EPS·mL−1). The FT-IR spectra showed that some of rhombohedrons with modified edges (Figure 5B,F) had both vaterite and calcite signatures. Smaller calcite crystals often agglomerated into large composite structures (>50 µm; Figure 5F black circles and Figure 6B).
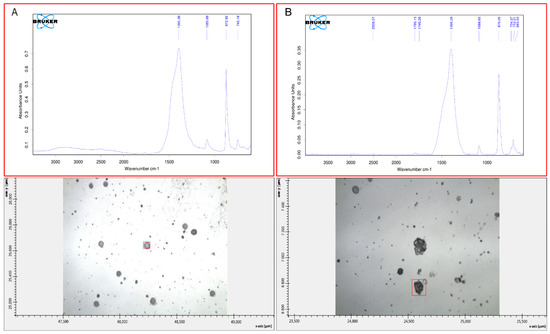
Figure 6.
FT-IR spectra of vaterite (A) and calcite (B). The two calcium carbonate polymorphs precipitated in solutions of both HMW and LMW EPS extracted from buffered and non-buffered media. Data shown for HMW EPS from buffered medium with a concentration of (A) 4 µg·mL−1 and (B) 2 µg·mL−1.
Mineral counts and size distribution—Image analysis of minerals showed differences in the size and number of crystals precipitated in solutions of HMW and LMW EPS fractions from both non-buffered and buffered media. In the HMW EPS fraction from non-buffered medium, the number of small crystals (1–50 µm) increased with increasing EPS concentration (Table S1). This increase was not observed for the HMW EPS fraction from buffered medium. In contrast, the number of large crystals (50–500 µm) increased with increasing polymer concentration in a solution of HMW EPS from buffered medium, but this was not observed in a solution of HMW of EPS from non-buffered medium. Therefore, in order to compare the effect of buffered and non-buffered EPS on crystal size, we calculated the ratio between large and small crystals at each EPS concentration (Figure 7A,B). In the solution of HMW EPS fraction from non-buffered medium, the ratio of large to small crystals decreases slightly with increasing EPS concentration, indicating that the proportion of small crystals increased with increasing polymer concentration (Figure 7A, blue symbols; downward trend). The opposite trend was seen in the solution of HMW EPS from buffered medium, where the relative contribution of large crystals increased with increasing EPS concentration (Figure 7A, orange symbols; upward trend). In the solution of LMW EPS fractions from both media, the difference in the ratio of small to large crystals was less obvious (Figure 7B). The few anomalies in the above ratios (visible as deviations from the trend line in Figure 7) could be due to the complex nature of the EPS structure and interactions of the macromolecules [33,49]. Both replicate experiments showed similar results (Figure 7; Supplementary Figure S3).
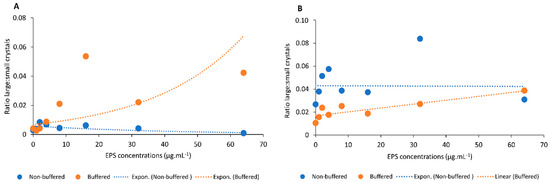
Figure 7.
Ratios between large and small crystals that precipitated in solutions of (A) the HMW EPS fraction from non-buffered medium (blue symbols and trend line) and from buffered medium (orange symbols and trend line); (B) the LMW EPS fraction from non-buffered medium (blue symbols and trend line) and from buffered medium (orange symbols and trend line. The orange and blue symbols shown at each EPS concentration (0–64 µg·mL−1) indicate individual ratios for single precipitation experiments.
Estimation of carbonate precipitation by crystal size class—An approximation of the total amount of carbonate precipitated in EPS solutions from HMW and LMW fractions of both non-buffered and buffered media is shown in Figure 8. A comparison of the small crystal size class (1–50 µm) with the large crystal size class (50–500 µm) in non-buffered HMW EPS solutions showed a clear trend of increasing surface area cover by small crystals and a decrease in surface cover by large crystals with increasing EPS concentrations. This trend was reversed in the same EPS fraction from buffered medium and showed a small increase in surface cover by the large crystal size class (Figure 8A,B). A similar trend showing an increase in small crystal coverage and no clear change in the cover by large crystals was found in solutions of LMW EPS fractions of both buffered and non-buffered media (Figure 8C,D).
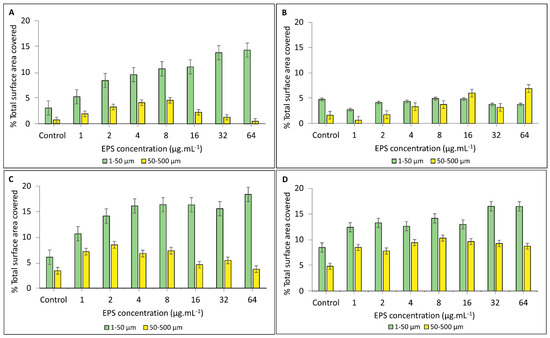
Figure 8.
Estimation of carbonate precipitation in solutions containing the HMW EPS fraction from (A) non-buffered and (B) buffered growth medium and solutions containing the LMW EPS fraction from (C) non-buffered and (D) buffered conditions. The estimates are based on the percentage of surface area covered by small (1–50 µm) and large (50–500 µm) crystals size classes in 1–64 µg·mL−1 EPS concentrations.
4. Discussion
The pH is known to affect cyanobacterial growth [86,87,88], but its impact on the production and properties of the exopolymeric substances is unclear [89,90]. Some studies have investigated the behavior of purified EPS under different pH conditions [38,91], but the current work investigates the properties of EPS produced by Synechococcus strain PCC7942 during growth under different pH regimes. In our study, the pH in non-buffered medium increased from 7.5 to 9.5 within a day after inoculation and continued to increase slowly to 10.5. In contrast, the pH of our buffered medium remained constant at 7.5 (Figure 1). The cell yield was higher, but the cell-specific EPS production was lower in non-buffered medium than in buffered medium (Table 1). The cell-specific sugar content was similar under both EPS conditions, but at higher pH, the EPS had a higher protein content (Table 3) and comprised larger polymers with a large number of negatively charged groups (Figure 3A,B). These different EPS properties ultimately affect the mineral products that can form in this organic matrix. Our findings in laboratory experiments may provide new insights into carbonate production in natural systems.
Cyanobacteria typically produce large amounts of high molecular weight heteropolysaccharides [47,92,93]. The production and secretion of these EPS is a complex process, possibly controlled by specific genes [29,94]. The chemical composition and density of EPS depend on the environmental conditions in which it is produced [36]. Studies in purified EPS demonstrated that the experimental pH and ionic strength impacted the three-dimensional structure and surface properties [38,91]. EPS itself exhibits a buffering capacity that is determined by the presence of specific functional groups. Carboxyl-, hydroxyl-, phosphoryl-, sulfur-, and amino- groups deprotonate with increasing pH [95,96,97]. The pKa value of sulfate groups is below 2.5 [97] and carboxylic groups have a pKa between 2 and 6 and deprotonate at a low pH. Phosphatic groups commonly exhibit a pKa between 5 and 8 and hydroxyl and amino groups have pKa values ranging from 8 to 11 [95,98]. The large range of these pKa values is the result of different medium conditions in which they were measured (e.g., pH and ionic strength). Electrostatic and steric interactions in complex biological molecules such as EPS may also cause differences in pKa values. The extent of these interactions varies with environmental conditions [99] and depends on the location of the functional groups within the EPS matrix and the polymer concentration, which can change the electrostatic properties [38,100]. In our investigation, the deprotonation of carboxyl and sulfur functional groups, if present, are expected in both pH conditions tested, as well as possibly the deprotonation of amino groups in EPS produced in non-buffered medium. The negatively charged groups that result from deprotonation have the capacity to bind cations.
FT-IR spectroscopy showed the presence of carboxylic groups, characteristic constituents of polysaccharides but also important in proteins. The signature of carboxylic groups was found in all HMW and LMW EPS fractions (Figure 2A,B). As noted, evidence for β-glycosidic linkages was only found in EPS from buffered medium, where the relative contribution of polysaccharides appeared higher than in EPS from non-buffered medium. In contrast, amide I-II groups (~1445–1650 cm−1; Figure 2A,B; red spectra) diagnostic markers for peptide bonds [47], were more abundant in both HMW and LMW non-buffered EPS (Figure 2A,B). This finding corroborates our observation that the EPS from non-buffered medium contained a much higher fraction of proteins than the EPS obtained from buffered medium (Table 2 and Table 3). In other words, the contribution of proteins to macromolecules comprising EPS was more pronounced in polymers from cultured grown in non-buffered medium than in buffered medium. Furthermore, intensely Alcian Blue stained bands in SDS-PAGE gels of HMW EPS from non-buffered cultures suggested that this protein fraction contained many negatively charged functional groups (Figure 3B, lanes 4 and 5). Consequently, the cation binding capacity of the EPS from non-buffered medium is expected to be higher than that of EPS from buffered medium [31,97]. In the EPS from cells grown in non-buffered medium, only a small shoulder was observed at 1233–1234 cm−1 in the FT-IR spectrum (Figure 2A,B; black arrows) that is attributed to the presence of sulfate groups such as S=O and C–O–S [101,102]. These sulfur functional groups can be linked to cation binding. However, the glycosaminoglycans content of our study, indicative of sulfated sugars, was only <1% (Table 2 and Table 3, sGAG), ruling out a role of these functional groups in EPS from Synechococcus sp. The small number of sulfated groups could be an effect of the approximately 70 times lower sulfate concentration in our freshwater medium compared with that of a marine medium [103]. These authors reported that the FT-IR spectra of EPS extracted from the cyanobacterial freshwater strain Nostoc carneum displayed much lower sulfur peaks than those obtained from the marine strain Cyanothece sp. [103].
A range of specific macromolecules (e.g., enzymes, molecular chaperones, compatible solutes and transport proteins) is produced by cyanobacteria under stress conditions [104]. Under elevated pH levels, 55 specific transport and binding proteins were produced by another unicellular cyanobacterial strain, Synechocystis sp. PCC6803 [90]. A larger quantity of proteins (Table 2 and Table 3) in EPS from non-buffered cultures (Figure 3B, lanes 4–5) could thus be a specific physiological response of Synechococcus PCC7942 to high pH (~10.5) as well. Negatively charged macromolecules with a mass >170 kDa were only found in EPS from non-buffered cultures (Figure 3B, lane 4), further indicating that at high pH, Synechococcus produced specific large molecules to cope with alkaline conditions. High pH values favor the presence of CO32− over HCO3−, and little or no CO2. A low carbon dioxide concentration can induce a carbon-concentrating mechanism (CCM) in some photosynthetic organisms [105] including Synechococcus [106]. CCMs comprise bicarbonate transporters in the cell membrane [107], intracellular (iCA) [108], extracellular carbonic anhydrases (eCA) [109], and concentrated RuBisCO activity located in carboxysomes. Carbonic anhydrase (CA) is a protein that catalyzes the conversion of HCO3- to CO2 (Equation (2)) and, thus, eCA further increases the pH [110].
CA plays a key role in photosynthetic assimilation of inorganic carbon especially in alkaline conditions [108,111], including in Synechococcus PCC7942 [112] and can have negatively charged sites [113]. The half-saturation constant Ks for CO2 of the RuBisCO enzyme in this Synechococcus strain is 350 µM [114]. Consequently, the rate of carbon fixation at pH 9 is extremely slow when the CO2 concentration is only 1 µM. In contrast, the HCO3− concentration at pH 9 is 475 µM, indicating the importance of CCM and CA. We detected a strong 34–43 kDa band in our PAGE gels of EPS from cells grown at high pH (Figure 3A, lanes 4–5). An eCA with a molecular weight of 42–44 kDa was found in Synechococcus PCC7942 [109]. Given the requirement for a CCM to fix inorganic carbon in alkaline conditions, it is plausible that our 34–43 kDa band, which, based on its Alcian Blue staining contained negatively-charged macromolecules (Figure 3B, lanes 4–5), may represent an extracellular carbonic anhydrase but its characterization is beyond the scope of the present paper. Acidic proteins (e.g., aspartic or glutamic acid-rich proteins) and acidic polysaccharides (e.g., uronic acids, sialic acids), both present in EPS can be negatively charged and thus inhibit CaCO3 precipitation by binding Ca2+ cations [26,28,82,114,115]. Although we observed an important contribution of proteinaceous macromolecules to the EPS composition, it is not yet clear whether calcium binding in our study is predominantly carried out by the protein fraction or by sugars, as polysaccharides can also control mineral growth [116,117]. Specifically, uronic acids, a major fraction of typical EPS are known to sequester cations [82]. However, in their study, these authors reported that not acidic polysaccharides, but proteins influenced the mineralogy of calcium carbonate that precipitated in a cyanobacterial culture. Regardless of this, EPS play a critical role in sequestering calcium ions and providing a template for mineral nucleation, thus facilitating carbonate precipitation [31,32]. The Ca-binding capacity can be indirectly assessed by the pH-drift method [81,82,83]. This assay showed a larger initial plateau in both solutions of HMW (Figure 4A, arrow) and LMW (Figure 4B) EPS fractions from cultures grown in non-buffered medium than from that of EPS samples produced in buffered medium (Figure 4C,D). This indicated that the presence of a greater abundance of negatively charged groups produced at high pH bind more divalent cations such as Ca2+. In addition, negative charges can possibly bind nascent mineral nuclei if these are produced in solution, inhibiting further crystal growth. As mentioned earlier, these negatively charged groups can be part of both sugars and proteins.
In addition to cation binding, EPS act as a template for mineral nucleation and control crystal growth [28,31,32,118]. Analysis of crystals produced in forced precipitation experiments showed that the abundance of negatively charged groups in EPS, most likely protein, had a distinct effect on the mineral properties. The effect of the negatively charged groups is visualized by the trend lines of the ratio large:small crystals (Figure 7A). The downward slope of the trend line for HMW EPS solutions from non-buffered medium extract shows that the relative number of small crystals increased with increasing EPS concentration. In contrast, the upward trend line for HMW EPS solution obtained from buffered medium extracts, with a lower abundance of negative binding sites, indicates that the proportion of large crystals increases with increasing polymer concentration. The trend for the ratio of large to small crystals in the solutions of LMW fractions is less clear (Figure 7B). The same pattern of small crystal dominance in EPS from non-buffered medium and large crystals in EPS from buffered medium emerges from the relative contribution of both crystal size classes to total CaCO3 coverage (Figure 8). The effect of specific EPS properties on mineral products is even more pronounced when considering that 82–96% of the EPS produced in the non-buffered medium is made up of the HMW fraction but this value is only 49–71% in the buffered medium, making the contribution of the LMW fractions less important in EPS from non-buffered medium. Large crystals were prevalent in buffered EPS due to lower negatively charged group density in non-limiting calcium concentrations. In other words, nucleation sites were less abundant, and the available calcium supported a better crystal growth.
Mineral size and crystal growth are controlled by the acidity (i.e., negatively charged groups) of the EPS, but the concentration of these colloids also exerts control on the polymorphism of carbonates that may form (this study; [28,97]). Specific properties of proteins, such as conformation, size, and surface charge can change the mineral phase [119]. These authors reported inhibition of vaterite formation with an increase in acidic proteins, similar to our study, where we only observed vaterite at the lowest EPS concentrations investigated (i.e., 1 and 8 µg·mL−1; Figure 6A). Precipitation of vaterite polymorphs was found in cyanobacterial EPS [120]. However, an increase in acidity of amino acids in artificial EPS did not inhibit vaterite formation, but an increase in the density of the polymers favored precipitation of vaterite over calcite [28]. In our study, vaterite polymorphs were present in solutions of EPS from non-buffered and buffered media, suggesting that the density of the macromolecules is the main control, and not the acidity of the polymers. However, the vaterite was not quantified in our experiments and it is conceivable that the EPS produced in both buffered and non-buffered media contained sufficient acidic proteins that support vaterite formation, although a role for acidic polysaccharides cannot be ruled out [121].
Calcite crystals displayed the characteristic rhombohedral habits and at high EPS concentrations (16–64 µg·mL−1), they often formed large aggregates of small crystals, notably in solutions of EPS from buffered medium (Figure 5F–H; calcite crystals indicated by white squares). In contrast, spheroidal vaterite precipitated in low EPS concentrations as isolated crystals, in some cases as polycrystalline spherical clusters (Figure 5A,B,E,F, black circles). Spheroidal morphology is the most typical shape of this CaCO3 polymorph [28]. In our study, rhombohedrons with smooth edges (Figure 5B,F) 4 µg HMW EPS·mL−1 fraction possibly represent the transitional phase from metastable vaterite to more stable calcite crystals. Increasing EPS concentration from non-buffered cultures supported nucleation and growth of rhombohedral calcite crystals (Figure 5A–D).
The growth rate of organisms can impact the EPS production [34,36] and functional groups composition [122]. In our study, in buffered conditions, the growth rate of Synechococcus was an order of magnitude lower than the maximum specific growth rate [123], which may impact the quality and quantity of the cyanobacterial EPS [124] and thus also the mineral properties of the crystals. In our buffered medium, the growth of Synechococcus was likely suboptimal because of the HEPES buffer addition, a compound known to reduce cyanobacterial growth [125,126,127]). Based on observations by Kurian (2009) [127], we assume that there was no HEPES effect on the protein expression, but that the different protein patterns we observed were a response to specific medium pH values. Furthermore, growth at elevated pH requires the induction of a CCM [128], the synthesis of which is energetically costly [129], resulting in a slower growth rate. The two different growth conditions in our study show different protein signatures, most likely because non-buffered growth requires a physiological response such as CA induction. This difference in protein signatures main ultimately impacts mineral properties. The concentration of phosphate in full-strength BG-11 can lead to artifacts in carbonate precipitation experiments, such as precipitation of phosphate minerals [130]; therefore, we grew our strain in a one-third strength medium.
From the Lab to the Field–Potential Importance of pH Effects in Bloom Formation
Picoplankton growth in poorly buffered natural systems resembles that of our non-buffered medium. The physiological response of Synechococcus to growth at pH 10.5, particularly the specific EPS properties produced under alkaline conditions, may thus shed light on cyanobacterial blooms in freshwater lakes [20,21]) (Figure 9A). These picoplankton blooms are typically characterized by high cell densities and photosynthesis rates [19,51,131,132,133]. The rapid uptake of DIC increases the pH ([67]; see Equation (2)), causing a physiological response of the picoplankton, that based on our results, could lead to the production of protein-rich, acidic EPS (Figure 9B). These EPS are either associated with the cell surface (i.e., capsular EPS (cEPS), tightly bound to the cell wall), or are suspended in the aqueous phase as soluble EPS (sEPS) [33]. Cyanobacteria often have a thick mucoid EPS sheath (i.e., cEPS) surrounding their cell wall [134]), but also excrete carbohydrates, possible including sEPS, as a photosynthetic “carbon overflow” mechanism under nutrient limitation, notably that of nitrogen and phosphorous [36,135,136].

Figure 9.
Model of EPS-associated carbonate precipitation in alkaline and circumneutral pH and potential implications for natural bloom conditions. Top panels: (A) non-buffered Synechococcus cultures respond to alkaline pH and bloom conditions. The pH increases due to high rates of photosynthetic CO2 uptake. (B) predominantly high molecular weight (HMW) protein-rich EPS with (C) large amounts of negatively charged groups are formed. More nucleation sites result in small crystals (represented by the small red sphere in the lower right corner) (D–F) with a lower sinking rate, limited crystal growth, and rapid dissolution. This is in contrast to bottom panels: (A) Buffered media have a circumneutral pH, and cultures mimic non-bloom conditions without pH increase, and (B) equal amounts of HMW and low molecular weight (LMW) fractions with low protein content and less negatively charged groups. (C) Large carbonate crystals are formed in EPS (represented by the small blue sphere in the lower right corner) that (D–F) sink fast, may not grow further, and dissolve slowly.
Both sEPS and cEPS [38,137] are precursors of larger colloid particles that form under natural conditions [138,139]. Electrostatic interaction between EPS molecules and the hydrophilicity of the aggregates plays a critical role in this [39,53]. Large EPS aggregates with neutral buoyancy, referred to as transparent exopolymeric particles (TEP), were produced in an artificial marine Synechococcus bloom under nutrient limitation. Alkaline conditions, similar to those in our culture grown in non-buffered medium, are typically associated with picoplankton blooms [52] and support a less dense, water-soluble dispersed EPS structure [38]. These conditions are attributed to the onset of TEP formation in coastal waters and lakes [53,140]. Curiously, TEP aggregation is enhanced through cross-linking of EPS by calcium ions [36], a process that also has been implicated in supporting calcium carbonate precipitation [141]. The protein-rich EPS, because of its high calcium-binding capacity, supports the production of small minerals, may inhibit crystal growth [141] and possibly promotes the formation of large floating aggregates.
Carbonate mineral precipitation in EPS increases the cyanobacterial-specific density several-fold: ρSynechococcus is 1.040 g·cm−3 [142], near-neutral buoyancy. In contrast, ρcalcite is 2.710 g·cm−3 [143]. Thus, smaller crystals in a dispersed colloidal TEP network are advantageous for the cells as they reduce the mineral ballast [57], prevent rapid sinking [144], and prolong the residence time in the photic zone ([145]; Figure 9D). On the other hand, the TEP-associated calcium carbonate may limit the light availability and reduce photosynthesis [146], although smaller-sized crystals have light-scattering properties that can locally increase the light intensities [147]. Clearly, the benefits of increased residence time in the photic zone thanks to EPS production that results in TEP formation [53,148] and the potential of dispersal to areas with more favorable conditions, outweighs the disadvantage of reduced light. Our study provides a better understanding of the role of specific EPS properties in carbonate precipitation during bloom conditions. Negatively charged and protein-rich EPS may provide a mechanism to prolong exposure to favorable nutrient and light conditions. This could provide competitive advantages for planktonic cyanobacteria such as Synechococcus.
Supplementary Materials
The following supporting information can be downloaded at: https://www.mdpi.com/article/10.3390/geosciences12050210/s1, Table S1: The total number of crystals counted in 10 fields of view (=15.6 mm2) for all EPS concentrations (1–64 µg·mL−1), in both HMW and LMW EPS fractions from non-buffered and buffered growth conditions. The numbers show the patterns of the total number of minerals (1–50 µm and 50–500 µm crystal size classes) precipitated with increasing EPS concentrations. Figure S1 Replication of in vitro inhibition of calcium carbonate precipitation experiment of (A) HMW EPS from non-buffered medium. A negative control (without EPS) and EPS extracts of concentrations of 10, 20, 30, 40, and 50 µg·mL−1 were used in the CaCO3 inhibition assay. The decrease of pH indicates precipitation and a plateau inhibition of carbonate precipitation. A larger plateau (> 30 µg) indicates stronger inhibition of CaCO3 precipitation (e.g., see arrow in panel A). Figure S2: SEM images of CaCO3 crystals formed in the controls of forced precipitation experiment (solutions without EPS) in HMW from A-B: non-buffered medium, C-D: buffered medium and LMW from E-F: non-buffered medium and G-H: buffered medium. Figure S3: Replication of ratios between large and small crystals that precipitated in solutions of (A) the HMW EPS fraction from non-buffered medium (blue symbols and trend line) and from buffered medium (orange symbols and trend line); (B) the LMW EPS fraction from non-buffered medium (blue symbols and trend line) and from buffered medium (orange symbols and trend line). The orange and blue symbols shown at each EPS concentration (0–64 µg·mL−1) indicate individual ratios for single precipitation experiments.
Author Contributions
Conceptualization I.B. and P.T.V.; methodology, M.M.d.B., I.B., P.T.V., F.M., A.W. and L.P.; formal analysis, M.M.d.B., I.B., P.T.V., E.V., F.M. and L.P., investigation, M.M.d.B. and I.B.; writing—original draft preparation, M.M.d.B., P.T.V. and I.B.; writing—review and editing, M.M.d.B., P.T.V., I.B., E.V., F.M. and A.W.; supervision, P.T.V., I.B. and E.V.; project administration, P.T.V. and E.V.; funding acquisition, E.V. and P.T.V. All authors have read and agreed to the published version of the manuscript.
Funding
This research was funded by I-SITE, grant number UB18016-BGS-IS (France) to E.V. and P.T.V., and NSF grant OCE 1561173 (US) to P.T.V.
Data Availability Statement
Not applicable.
Acknowledgments
This study is a contribution of the SEDS and SAMBA teams of Biogeosciences laboratory (Bourgogne Franche-Comté University, Dijon, France) to the I-SITE project UB18016-BGS-IS. The authors express their gratitude to Nelly Debrosse (Bourgogne Franche-Comté University, Dijon), Michel Picquet and Christine Stern (ICMUB Institut de Chimie Moléculaire, Bourgogne Franche-Comté University, Dijon, France) for their technical assistance. A.W. is Senior Research Associate of the FRS-FNRS. The authors would like to thank the three anonymous reviewers whose work has helped to improve the manuscript. All individuals included in this section have consented to the acknowledgement.
Conflicts of Interest
The authors declare no conflict of interest. The funders had no role in the design of the study; in the collection, analyses, or interpretation of data; in the writing of the manuscript; or in the decision to publish the results.
References
- Raven, J. The Twelfth Tansley Lecture. Small Is Beautiful: The Picophytoplankton. Funct. Ecol. 1998, 12, 503–513. [Google Scholar] [CrossRef]
- Ridgwell, A.; Zeebe, R.E. The Role of the Global Carbonate Cycle in the Regulation and Evolution of the Earth System. Earth Planet. Sci. Lett. 2005, 234, 299–315. [Google Scholar] [CrossRef]
- Ivanikova, N.V.; Popels, L.C.; McKay, R.M.L.; Bullerjahn, G.S. Lake Superior Supports Novel Clusters of Cyanobacterial Picoplankton. Appl. Environ. Microbiol. 2007, 73, 4055–4065. [Google Scholar] [CrossRef] [PubMed] [Green Version]
- Falkowski, P.G. The Role of Phytoplankton Photosynthesis in Global Biogeochemical Cycles. Photosynth. Res. 1994, 39, 235–258. [Google Scholar] [CrossRef] [PubMed] [Green Version]
- Falkowski, P.G.; Barber, R.T.; Smetacek, V. Biogeochemical Controls and Feedbacks on Ocean Primary Production. Science 1998, 281, 200–206. [Google Scholar] [CrossRef] [PubMed] [Green Version]
- Agawin, N.S.; Duarte, C.M.; Agustí, S. Nutrient and Temperature Control of the Contribution of Picoplankton to Phytoplankton Biomass and Production. Limnol. Oceanogr. 2000, 45, 591–600. [Google Scholar] [CrossRef]
- Coello-Camba, A.; Agustí, S. Picophytoplankton Niche Partitioning in the Warmest Oligotrophic Sea. Front. Mar. Sci. 2021, 8, 429. [Google Scholar] [CrossRef]
- Pomar, L.; Hallock, P. Carbonate Factories: A Conundrum in Sedimentary Geology. Earth-Sci. Rev. 2008, 87, 134–169. [Google Scholar] [CrossRef]
- Kranz, S.A.; Gladrow, D.W.-; Nehrke, G.; Langer, G.; Rosta, B. Calcium Carbonate Precipitation Induced by the Growth of the Marine Cyanobacteria Trichodesmium. Limnol. Oceanogr. 2010, 55, 2563–2569. [Google Scholar] [CrossRef] [Green Version]
- Buick, R. When Did Oxygenic Photosynthesis Evolve? Philos. Trans. R. Soc. B Biol. Sci. 2008, 363, 2731–2743. [Google Scholar] [CrossRef] [Green Version]
- Blankenship, R.E.; Hartman, H. The Origin and Evolution of Oxygenic Photosynthesis. Trends Biochem. Sci. 1998, 23, 94–97. [Google Scholar] [CrossRef]
- Berman-Frank, I.; Lundgren, P.; Falkowski, P. Nitrogen Fixation and Photosynthetic Oxygen Evolution in Cyanobacteria. Res. Microbiol. 2003, 154, 157–164. [Google Scholar] [CrossRef]
- Knoll, A.H. Cyanobacteria and Earth History. Cyanobacteria Mol. Biol. Genom. Evol. 2008, 484, 1–19. [Google Scholar]
- Hoehler, T.M.; Bebout, B.M.; Des Marais, D.J. The Role of Microbial Mats in the Production of Reduced Gases on the Early Earth. Nature 2001, 412, 324–327. [Google Scholar] [CrossRef]
- Uyeda, J.C.; Harmon, L.J.; Blank, C.E. A Comprehensive Study of Cyanobacterial Morphological and Ecological Evolutionary Dynamics through Deep Geologic Time. PLoS ONE 2016, 11, e0162539. [Google Scholar] [CrossRef]
- Arrigo, K.R. Marine Microorganisms and Global Nutrient Cycles. Nature 2005, 437, 349–355. [Google Scholar] [CrossRef]
- Litchman, E.; de Tezanos Pinto, P.; Edwards, K.F.; Klausmeier, C.A.; Kremer, C.T.; Thomas, M.K. Global Biogeochemical Impacts of Phytoplankton: A Trait-based Perspective. J. Ecol. 2015, 103, 1384–1396. [Google Scholar] [CrossRef] [Green Version]
- Buitenhuis, E.T.; Li, W.K.; Vaulot, D.; Lomas, M.; Landry, M.; Partensky, F.; Karl, D.; Ulloa, O.; Campbell, L.; Jacquet, S. Picophytoplankton Biomass Distribution in the Global Ocean. Earth Syst. Sci. Data 2012, 4, 37–46. [Google Scholar] [CrossRef] [Green Version]
- Robbins, L.; Tao, Y.; Evans, C. Temporal and Spatial Distribution of Whitings on Great Bahama Bank and a New Lime Mud Budget. Geology 1997, 25, 947–950. [Google Scholar] [CrossRef]
- Schultze-Lam, S.; Schultze-Lam, S.; Beveridge, T.J.; Des Marais, D.J. Whiting Events: Biogenic Origin Due to the Photosynthetic Activity of Cyanobacterial Picoplankton. Limnol. Oceanogr. 1997, 42, 133–141. [Google Scholar] [CrossRef]
- Thompson, J.B.; Ferris, F.G. Cyanobacterial Precipitation of Gypsum, Calcite, and Magnesite from Natural Alkaline Lake Water. Geology 1990, 18, 995. [Google Scholar] [CrossRef]
- Danckwerts, P.; Melkersson, K.-A. Kinetics of the Conversion of Bicarbonate to Carbon Dioxide. Trans. Faraday Soc. 1962, 58, 1832–1838. [Google Scholar] [CrossRef]
- Heywood, B.R.; Mann, S. Template-directed Nucleation and Growth of Inorganic Materials. Adv. Mater. 1994, 6, 9–20. [Google Scholar] [CrossRef]
- Heywood, B.R.; Mann, S. Molecular Construction of Oriented Inorganic Materials: Controlled Nucleation of Calcite and Aragonite under Compressed Langmuir Monolayers. Chem. Mater. 1994, 6, 311–318. [Google Scholar] [CrossRef]
- Mitchell, A.C.; Ferris, F.G. The Influence of Bacillus Pasteurii on the Nucleation and Growth of Calcium Carbonate. Geomicrobiol. J. 2006, 23, 213–226. [Google Scholar] [CrossRef]
- Dupraz, C.; Reid, R.P.; Braissant, O.; Decho, A.W.; Norman, R.S.; Visscher, P.T. Processes of Carbonate Precipitation in Modern Microbial Mats. Earth-Sci. Rev. 2009, 96, 141–162. [Google Scholar] [CrossRef]
- Kamennaya, N.; Ajo-Franklin, C.; Northen, T.; Jansson, C. Cyanobacteria as Biocatalysts for Carbonate Mineralization. Minerals 2012, 2, 338–364. [Google Scholar] [CrossRef]
- Braissant, O.; Cailleau, G.; Dupraz, C.; Verrecchia, E.P. Bacterially Induced Mineralization of Calcium Carbonate in Terrestrial Environments: The Role of Exopolysaccharides and Amino Acids. J. Sediment. Res. 2003, 73, 485–490. [Google Scholar] [CrossRef]
- Marvasi, M.; Visscher, P.T.; Casillas Martinez, L. Exopolymeric Substances (EPS) from Bacillus Subtilis: Polymers and Genes Encoding Their Synthesis. FEMS Microbiol. Lett. 2010, 313, 1–9. [Google Scholar] [CrossRef] [Green Version]
- Dittrich, M.; Sibler, S. Calcium Carbonate Precipitation by Cyanobacterial Polysaccharides. Geol. Soc. Lond. Spec. Publ. 2010, 336, 51–63. [Google Scholar] [CrossRef]
- Dupraz, C.; Visscher, P.T. Microbial Lithification in Marine Stromatolites and Hypersaline Mats. Trends Microbiol. 2005, 13, 429–438. [Google Scholar] [CrossRef] [PubMed] [Green Version]
- Trichet, J.; Defarge, C. Non-Biologically Supported Organomineralization, Bulletin de l’Institut Océanographique (Monaco) Numéro Spécial 14; de l’Institut Oceanographique (Monaco): Monaco City, Monaco, 1995; 203–236.
- Decho, A.W. Microbial Exopolymer Secretions in Ocean Environments: Their Role (s) in Food Webs and Marine Processes. Oceanogr. Mar. Biol. Annu. Rev. 1990, 28, 73–153. [Google Scholar]
- Moreno, J.; Vargas, M.A.; Olivares, H.; Rivas, J.; Guerrero, M.G. Exopolysaccharide Production by the Cyanobacterium Anabaena sp. ATCC 33047 in Batch and Continuous Culture. J. Biotechnol. 1998, 60, 175–182. [Google Scholar] [CrossRef]
- Simon, M.; Grossart, H.-P.; Schweitzer, B.; Ploug, H. Microbial Ecology of Organic Aggregates in Aquatic Ecosystems. Aquat. Microb. Ecol. 2002, 28, 175–211. [Google Scholar] [CrossRef] [Green Version]
- Decho, A.W.; Gutierrez, T. Microbial Extracellular Polymeric Substances (EPSs) in Ocean Systems. Front. Microbiol. 2017, 8, 922. [Google Scholar] [CrossRef] [PubMed]
- Tsuneda, S.; Aikawa, H.; Hayashi, H.; Yuasa, A.; Hirata, A. Extracellular Polymeric Substances Responsible for Bacterial Adhesion onto Solid Surface. FEMS Microbiol. Lett. 2003, 223, 287–292. [Google Scholar] [CrossRef] [Green Version]
- Wang, L.-L.; Wang, L.-F.; Ren, X.-M.; Ye, X.-D.; Li, W.-W.; Yuan, S.-J.; Sun, M.; Sheng, G.-P.; Yu, H.-Q.; Wang, X.-K. PH Dependence of Structure and Surface Properties of Microbial EPS. Environ. Sci. Technol. 2012, 46, 737–744. [Google Scholar] [CrossRef]
- Santschi, P.H.; Chin, W.-C.; Quigg, A.; Xu, C.; Kamalanathan, M.; Lin, P.; Shiu, R.-F. Marine Gel Interactions with Hydrophilic and Hydrophobic Pollutants. Gels 2021, 7, 83. [Google Scholar] [CrossRef]
- Moore, K.R.; Gong, J.; Pajusalu, M.; Skoog, E.J.; Xu, M.; Feliz Soto, T.; Sojo, V.; Matreux, T.; Baldes, M.J.; Braun, D. A New Model for Silicification of Cyanobacteria in Proterozoic Tidal Flats. Geobiology 2021, 19, 438–449. [Google Scholar] [CrossRef]
- Rossi, F.; De Philippis, R. Role of Cyanobacterial Exopolysaccharides in Phototrophic Biofilms and in Complex Microbial Mats. Life 2015, 5, 1218–1238. [Google Scholar] [CrossRef] [Green Version]
- Bertilsson, S.; Jones Jr, J.B. Supply of Dissolved Organic Matter to Aquatic Ecosystems: Autochthonous Sources. In Aquatic Ecosystems; Elsevier: Amsterdam, The Netherlands, 2003; pp. 3–24. [Google Scholar]
- Fisher, M.L.; Allen, R.; Luo, Y.; Curtiss III, R. Export of Extracellular Polysaccharides Modulates Adherence of the Cyanobacterium Synechocystis. PLoS ONE 2013, 8, e74514. [Google Scholar] [CrossRef] [PubMed] [Green Version]
- Hoiczyk, E. A Molecular Motor for Gliding Motility in Cyanobacteria. J. Phycol. 2000, 36, 30–31. [Google Scholar] [CrossRef]
- Billi, D.; Potts, M. Life and Death of Dried Prokaryotes. Res. Microbiol. 2002, 153, 7–12. [Google Scholar] [CrossRef]
- Ehling-Schulz, M.; Scherer, S. UV Protection in Cyanobacteria. Eur. J. Phycol. 1999, 34, 329–338. [Google Scholar] [CrossRef]
- De Philippis, R.; Vincenzini, M. Exocellular Polysaccharides from Cyanobacteria and Their Possible Applications. FEMS Microbiol. Rev. 1998, 22, 151–175. [Google Scholar] [CrossRef]
- Deng, W.; Cruz, B.N.; Neuer, S. Effects of Nutrient Limitation on Cell Growth, TEP Production and Aggregate Formation of Marine Synechococcus. Aquat. Microb. Ecol. 2016, 78, 39–49. [Google Scholar] [CrossRef]
- Pannard, A.; Pedrono, J.; Bormans, M.; Briand, E.; Claquin, P.; Lagadeuc, Y. Production of Exopolymers (EPS) by Cyanobacteria: Impact on the Carbon-to-Nutrient Ratio of the Particulate Organic Matter. Aquat. Ecol. 2016, 50, 29–44. [Google Scholar] [CrossRef]
- Bemal, S.; Anil, A.C. Effects of Salinity on Cellular Growth and Exopolysaccharide Production of Freshwater Synechococcus Strain CCAP1405. J. Plankton Res. 2018, 40, 46–58. [Google Scholar] [CrossRef]
- Li, D.; Wu, N.; Tang, S.; Su, G.; Li, X.; Zhang, Y.; Wang, G.; Zhang, J.; Liu, H.; Hecker, M. Factors Associated with Blooms of Cyanobacteria in a Large Shallow Lake, China. Environ. Sci. Eur. 2018, 30, 27. [Google Scholar] [CrossRef]
- Zepernick, B.N.; Gann, E.R.; Martin, R.M.; Pound, H.L.; Krausfeldt, L.E.; Chaffin, J.D.; Wilhelm, S.W. Elevated PH Conditions Associated With Microcystis spp. Blooms Decrease Viability of the Cultured Diatom Fragilaria Crotonensis and Natural Diatoms in Lake Erie. Front. Microbiol. 2021, 12, 188. [Google Scholar] [CrossRef]
- Passow, U. Transparent Exopolymer Particles (TEP) in Aquatic Environments. Prog. Oceanogr. 2002, 55, 287–333. [Google Scholar] [CrossRef] [Green Version]
- Iuculano, F.; Mazuecos, I.P.; Reche, I.; Agustí, S. Prochlorococcus as a Possible Source for Transparent Exopolymer Particles (TEP). Front. Microbiol. 2017, 8, 709. [Google Scholar] [CrossRef] [PubMed] [Green Version]
- Engel, A. Distribution of Transparent Exopolymer Particles (TEP) in the Northeast Atlantic Ocean and Their Potential Significance for Aggregation Processes. Deep Sea Res. Part I Oceanogr. Res. Pap. 2004, 51, 83–92. [Google Scholar] [CrossRef] [Green Version]
- Callieri, C. Picophytoplankton in Freshwater Ecosystems: The Importance of Small-Sized Phototrophs. Freshw. Rev. 2008, 1, 1–28. [Google Scholar] [CrossRef]
- Cruz, B.N.; Neuer, S. Heterotrophic Bacteria Enhance the Aggregation of the Marine Picocyanobacteria Prochlorococcus and Synechococcus. Front. Microbiol 2019, 10, 1864. [Google Scholar] [CrossRef] [Green Version]
- Robbins, L.; Blackwelder, P. Biochemical and Ultrastructural Evidence for the Origin of Whitings: A Biologically Induced Calcium Carbonate Precipitation Mechanism. Geology 1992, 20, 464–468. [Google Scholar] [CrossRef]
- Larson, E.B.; Mylroie, J.E. A Review of Whiting Formation in the Bahamas and New Models. Carbonates Evaporites 2014, 29, 337–347. [Google Scholar] [CrossRef]
- Dittrich, M.; Obst, M. Are Picoplankton Responsible for Calcite Precipitation in Lakes? AMBIO 2004, 33, 6. [Google Scholar] [CrossRef]
- Ohlendorf, C.; Sturm, M. Precipitation and Dissolution of Calcite in a Swiss High Alpine Lake. Arct. Antarct. Alp. Res. 2001, 33, 410–417. [Google Scholar] [CrossRef]
- Schultze-Lam, S.; Harauz, G.; Beveridge, T. Participation of a Cyanobacterial S Layer in Fine-Grain Mineral Formation. J. Bacteriol. 1992, 174, 7971–7981. [Google Scholar] [CrossRef] [Green Version]
- Dittrich, M.; Müller, B.; Mavrocordatos, D.; Wehrli, B. Induced Calcite Precipitation by Cyanobacterium Synechococcus. Acta Hydrochim. Hydrobiol. 2003, 31, 162–169. [Google Scholar] [CrossRef]
- Lee, B.D.; Apel, W.A.; Walton, M.R. Screening of Cyanobacterial Species for Calcification. Biotechnol. Prog. 2004, 20, 1345–1351. [Google Scholar] [CrossRef] [PubMed]
- Obst, M.; Dynes, J.J.; Lawrence, J.R.; Swerhone, G.D.W.; Benzerara, K.; Karunakaran, C.; Kaznatcheev, K.; Tyliszczak, T.; Hitchcock, A.P. Precipitation of Amorphous CaCO3 (Aragonite-like) by Cyanobacteria: A STXM Study of the Influence of EPS on the Nucleation Process. Geochim. Cosmochim. Acta 2009, 73, 4180–4198. [Google Scholar] [CrossRef]
- Liang, A.; Paulo, C.; Zhu, Y.; Dittrich, M. CaCO3 Biomineralization on Cyanobacterial Surfaces: Insights from Experiments with Three Synechococcus Strains. Colloids Surf. B Biointerfaces 2013, 111, 600–608. [Google Scholar] [CrossRef] [PubMed]
- Yates, K.K.; Robbins, L.L. Production of Carbonate Sediments by a Unicellular Green Alga. Am. Mineral. 1998, 83, 1503–1509. [Google Scholar] [CrossRef]
- Allen, M.M. SIMPLE CONDITIONS FOR GROWTH OF UNICELLULAR BLUE-GREEN ALGAE ON PLATES 1, 2. J. Phycol. 1968, 4, 1–4. [Google Scholar] [CrossRef] [PubMed]
- Rippka, R.; Deruelles, J.; Waterbury, J.B.; Herdman, M.; Stanier, R.Y. Generic Assignments, Strain Histories and Properties of Pure Cultures of Cyanobacteria. Microbiology 1979, 111, 1–61. [Google Scholar] [CrossRef] [Green Version]
- Coates, J. Interpretation of Infrared Spectra, A Practical Approach. In Encyclopedia of Analytical Chemistry; Meyers, R.A., Ed.; John Wiley & Sons, Ltd.: Chichester, UK, 2006; p. a5606. ISBN 978-0-470-02731-8. [Google Scholar]
- de Moreno, M.R.; Smith, J.F.; Smith, R.V. Silver Staining of Proteins in Polyacrylamide Gels: Increased Sensitivity through a Combined Coomassie Blue-Silver Stain Procedure. Anal. Biochem. 1985, 151, 466–470. [Google Scholar] [CrossRef]
- Dubois, M.; Gilles, K.; Hamilton, J.; Rebers, P.; Smith, F. A Colorimetric Method for the Determination of Sugars. Nature 1951, 168, 167. [Google Scholar] [CrossRef]
- DuBois, M.; Gilles, K.A.; Hamilton, J.K.; Rebers, P.A.; Smith, F. Colorimetric Method for Determination of Sugars and Related Substances. Anal. Chem. 1956, 28, 350–356. [Google Scholar] [CrossRef]
- Masuko, T.; Minami, A.; Iwasaki, N.; Majima, T.; Nishimura, S.-I.; Lee, Y.C. Carbohydrate Analysis by a Phenol–Sulfuric Acid Method in Microplate Format. Anal. Biochem. 2005, 339, 69–72. [Google Scholar] [CrossRef] [PubMed]
- Oudot, M.; Shir, I.B.; Schmidt, A.; Plasseraud, L.; Broussard, C.; Neige, P.; Marin, F. A Nature’s Curiosity: The Argonaut “Shell” and Its Organic Content. Crystals 2020, 10, 839. [Google Scholar] [CrossRef]
- Morrissey, J.H. Silver Stain for Proteins in Polyacrylamide Gels: A Modified Procedure with Enhanced Uniform Sensitivity. Anal. Biochem. 1981, 117, 307–310. [Google Scholar] [CrossRef]
- Wall, R.S.; Gyi, T.J. Alcian Blue Staining of Proteoglycans in Polyacrylamide Gels Using the “Critical Electrolyte Concentration” Approach. Anal. Biochem. 1988, 175, 298–299. [Google Scholar] [CrossRef]
- Blake, D.C.; Russell, R.G. Demonstration of Lipopolysaccharide with O-Polysaccharide Chains among Different Heat-Stable Serotypes of Campylobacter Jejuni by Silver Staining of Polyacrylamide Gels. Infect. Immun 1993, 61, 5384–5387. [Google Scholar] [CrossRef] [PubMed] [Green Version]
- Korenevsky, A.A.; Vinogradov, E.; Gorby, Y.; Beveridge, T.J. Characterization of the Lipopolysaccharides and Capsules of Shewanella spp. Appl. Environ. Microbiol. 2002, 68, 4653–4657. [Google Scholar] [CrossRef] [Green Version]
- Marin, F.; Pereira, L.; Westbroek, P. Large-Scale Fractionation of Molluscan Shell Matrix. Protein Expr. Purif. 2001, 23, 175–179. [Google Scholar] [CrossRef]
- Wheeler, A.; George, J.W.; Evans, C. Control of Calcium Carbonate Nucleation and Crystal Growth by Soluble Matrx of Oyster Shell. Science 1981, 212, 1397–1398. [Google Scholar] [CrossRef] [Green Version]
- Kawaguchi, T.; Decho, A.W. ISOLATION AND BIOCHEMICAL CHARACTERIZATION OF EXTRACELLULAR POLYMERIC SECRETIONS (EPS) FROM MODERN SOFT MARINE STROMATOLITES (BAHAMAS) AND ITS INHIBITORY EFFECT ON CACO3 PRECIPITATION. Prep. Biochem. Biotechnol. 2002, 32, 51–63. [Google Scholar] [CrossRef]
- Marin, F.; Corstjens, P.; de Gaulejac, B.; de Vrind-De Jong, E.; Westbroek, P. Mucins and Molluscan Calcification: Molecular Characterization of Mucoperlin, a Novel Mucin-like Protein from the Nacreous Shell Layer of the Fan Mussel Pinna Nobilis (Bivalvia, Pteriomorphia). J. Biol. Chem. 2000, 275, 20667–20675. [Google Scholar] [CrossRef] [Green Version]
- Albeck, S.; Aizenberg, J.; Addadi, L.; Weiner, S. Interactions of Various Skeletal Intracrystalline Components with Calcite Crystals. J. Am. Chem. Soc. 1993, 115, 11691–11697. [Google Scholar] [CrossRef]
- Barth, A. Infrared Spectroscopy of Proteins. Biochim. Biophys. Acta (BBA)-Bioenerg. 2007, 1767, 1073–1101. [Google Scholar] [CrossRef] [Green Version]
- Kallas, T.; Castenholz, R.W. Rapid Transient Growth at Low PH in the Cyanobacterium Synechococcus sp. J. Bacteriol 1982, 149, 237–246. [Google Scholar] [CrossRef] [PubMed] [Green Version]
- Giraldez-Ruiz, N.; Mateo, P.; Bonilla, I.; Fernandez-Piñas, F. The Relationship between Intracellular PH, Growth Characteristics and Calcium in the Cyanobacterium Anabaena sp. Strain PCC7120 Exposed to Low PH. New Phytol. 1997, 137, 599–605. [Google Scholar] [CrossRef]
- Touloupakis, E.; Cicchi, B.; Benavides, A.M.S.; Torzillo, G. Effect of High PH on Growth of Synechocystis sp. PCC 6803 Cultures and Their Contamination by Golden Algae (Poterioochromonas sp.). Appl. Microbiol. Biotechnol. 2016, 100, 1333–1341. [Google Scholar] [CrossRef] [PubMed] [Green Version]
- Kurian, D.; Phadwal, K.; Mäenpää, P. Proteomic Characterization of Acid Stress Response in Synechocystis sp. PCC 6803. Proteomics 2006, 6, 3614–3624. [Google Scholar] [CrossRef]
- Zhang, L.-F.; Yang, H.-M.; Cui, S.-X.; Hu, J.; Wang, J.; Kuang, T.-Y.; Norling, B.; Huang, F. Proteomic Analysis of Plasma Membranes of Cyanobacterium Synechocystis sp. Strain PCC 6803 in Response to High PH Stress. J. Proteome Res. 2009, 8, 2892–2902. [Google Scholar] [CrossRef]
- Dogsa, I.; Kriechbaum, M.; Stopar, D.; Laggner, P. Structure of Bacterial Extracellular Polymeric Substances at Different PH Values as Determined by SAXS. Biophys. J. 2005, 89, 2711–2720. [Google Scholar] [CrossRef] [Green Version]
- De Philippis, R.; Sili, C.; Paperi, R.; Vincenzini, M. Exopolysaccharide-Producing Cyanobacteria and Their Possible Exploitation: A Review. J. Appl. Phycol. 2001, 13, 293–299. [Google Scholar] [CrossRef]
- Pereira, S.; Zille, A.; Micheletti, E.; Moradas-Ferreira, P.; De Philippis, R.; Tamagnini, P. Complexity of Cyanobacterial Exopolysaccharides: Composition, Structures, Inducing Factors and Putative Genes Involved in Their Biosynthesis and Assembly. FEMS Microbiol. Rev. 2009, 33, 917–941. [Google Scholar] [CrossRef]
- Pereira, S.B.; Mota, R.; Vieira, C.P.; Vieira, J.; Tamagnini, P. Phylum-Wide Analysis of Genes/Proteins Related to the Last Steps of Assembly and Export of Extracellular Polymeric Substances (EPS) in Cyanobacteria. Sci. Rep. 2015, 5, 14835. [Google Scholar] [CrossRef] [PubMed] [Green Version]
- Phoenix, V.R.; Martinez, R.E.; Konhauser, K.O.; Ferris, F.G. Characterization and Implications of the Cell Surface Reactivity of Calothrix sp. Strain KC97. Appl. Environ. Microbiol. 2002, 68, 4827–4834. [Google Scholar] [CrossRef] [PubMed] [Green Version]
- Fein, J.B.; Boily, J.-F.; Yee, N.; Gorman-Lewis, D.; Turner, B.F. Potentiometric Titrations of Bacillus Subtilis Cells to Low PH and a Comparison of Modeling Approaches. Geochim. Cosmochim. Acta 2005, 69, 1123–1132. [Google Scholar] [CrossRef]
- Braissant, O.; Decho, A.W.; Dupraz, C.; Glunk, C.; Przekop, K.M.; Visscher, P.T. Exopolymeric Substances of Sulfate-Reducing Bacteria: Interactions with Calcium at Alkaline PH and Implication for Formation of Carbonate Minerals. Geobiology 2007, 5, 401–411. [Google Scholar] [CrossRef]
- d’Abzac, P.; Bordas, F.; Joussein, E.; van Hullebusch, E.D.; Lens, P.N.; Guibaud, G. Metal Binding Properties of Extracellular Polymeric Substances Extracted from Anaerobic Granular Sludges. Environ. Sci. Pollut. Res. 2013, 20, 4509–4519. [Google Scholar] [CrossRef] [PubMed]
- Lamelas, C.; Benedetti, M.; Wilkinson, K.J.; Slaveykova, V.I. Characterization of H+ and Cd2+ Binding Properties of the Bacterial Exopolysaccharides. Chemosphere 2006, 65, 1362–1370. [Google Scholar] [CrossRef] [PubMed]
- Liu, H.; Fang, H.H. Characterization of Electrostatic Binding Sites of Extracellular Polymers by Linear Programming Analysis of Titration Data. Biotechnol. Bioeng. 2002, 80, 806–811. [Google Scholar] [CrossRef] [PubMed]
- Silverstein, R.M.; Bassler, G.C. Spectrometric Identification of Organic Compounds. J. Chem. Educ. 1962, 39, 546. [Google Scholar] [CrossRef]
- Stuart, B.H. Infrared Spectroscopy: Fundamentals and Applications; John Wiley & Sons: Hoboken, NJ, USA, 2004; ISBN 0-470-01113-0. [Google Scholar]
- Parikh, A.; Madamwar, D. Partial Characterization of Extracellular Polysaccharides from Cyanobacteria. Bioresour. Technol. 2006, 97, 1822–1827. [Google Scholar] [CrossRef]
- Babele, P.K.; Kumar, J.; Chaturvedi, V. Proteomic De-Regulation in Cyanobacteria in Response to Abiotic Stresses. Front. Microbiol. 2019, 10, 1315. [Google Scholar] [CrossRef] [Green Version]
- Raven, J.A.; Beardall, J.; Sánchez-Baracaldo, P. The Possible Evolution and Future of CO2-Concentrating Mechanisms. J. Exp. Bot. 2017, 68, 3701–3716. [Google Scholar] [CrossRef] [PubMed] [Green Version]
- Price, G.D.; Badger, M.R.; Box, P.O. Expression of Human Carbonic Anhydrase in the Cyanobacterium Synechococcus PCC7942 Creates a High CO2-Requiring Phenotype. Plant Physiol. 1989, 91, 9. [Google Scholar] [CrossRef] [PubMed] [Green Version]
- Price, G.D.; Pengelly, J.J.; Forster, B.; Du, J.; Whitney, S.M.; von Caemmerer, S.; Badger, M.R.; Howitt, S.M.; Evans, J.R. The Cyanobacterial CCM as a Source of Genes for Improving Photosynthetic CO2 Fixation in Crop Species. J. Exp. Bot. 2013, 64, 753–768. [Google Scholar] [CrossRef] [PubMed] [Green Version]
- Badger, M.R.; Price, G.D. The CO2concentrating Mechanism in Cyanobacteria and Microalgae. Physiol. Plant. 1992, 84, 606–615. [Google Scholar] [CrossRef]
- Kupriyanova, E.V.; Sinetova, M.A.; Bedbenov, V.S.; Pronina, N.A.; Los, D.A. Putative Extracellular α-Class Carbonic Anhydrase, EcaA, of Synechococcus Elongatus PCC 7942 Is an Active Enzyme: A Sequel to an Old Story. Microbiology 2018, 164, 576–586. [Google Scholar] [CrossRef] [PubMed]
- Chrachri, A.; Hopkinson, B.M.; Flynn, K.; Brownlee, C.; Wheeler, G.L. Dynamic Changes in Carbonate Chemistry in the Microenvironment around Single Marine Phytoplankton Cells. Nat. Commun. 2018, 9, 74. [Google Scholar] [CrossRef] [PubMed] [Green Version]
- Badger, M.R.; Price, G.D. The Role of Carbonic Anhydrase in Photosynthesis. Annu. Rev. Plant Biol. 1994, 45, 369–392. [Google Scholar] [CrossRef]
- Badger, M.R.; Price, G.D. Carbonic Anhydrase Activity Associated with the Cyanobacterium Synechococcus PCC7942. Plant Physiol. 1989, 89, 51–60. [Google Scholar] [CrossRef] [Green Version]
- Kim, J.K.; Lee, C.; Lim, S.W.; Adhikari, A.; Andring, J.T.; McKenna, R.; Ghim, C.-M.; Kim, C.U. Elucidating the Role of Metal Ions in Carbonic Anhydrase Catalysis. Nat. Commun. 2020, 11, 4557. [Google Scholar] [CrossRef]
- Jong, E.W.; Bosch, L.; Westbroek, P. Isolation and Characterization of a Cat 2+-Binding Polysaccharide Associated with Coccoliths of Emiliania Huxleyi (Lohmann) Kamptner. Eur. J. Biochem. 1976, 70, 611–621. [Google Scholar] [CrossRef]
- Gunthorpe, M.; Sikes, C.; Wheeler, A. Promotion and Inhibition of Calcium Carbonate Crystallization in Vitro by Matrix Protein from Blue Crab Exoskeleton. Biol. Bull. 1990, 179, 191–200. [Google Scholar] [CrossRef] [PubMed]
- Yang, M.; Stipp, S.L.S.; Harding, J. Biological Control on Calcite Crystallization by Polysaccharides. Cryst. Growth Des. 2008, 8, 4066–4074. [Google Scholar] [CrossRef]
- Walker, J.M.; Marzec, B.; Lee, R.B.Y.; Vodrazkova, K.; Day, S.J.; Tang, C.C.; Rickaby, R.E.M.; Nudelman, F. Polymorph Selectivity of Coccolith-Associated Polysaccharides from Gephyrocapsa Oceanica on Calcium Carbonate Formation In Vitro. Adv. Funct. Mater. 2019, 29, 1807168. [Google Scholar] [CrossRef] [Green Version]
- Arp, G.; Reimer, A.; Reitner, J. Photosynthesis-Induced Biofilm Calcification and Calcium Concentrations in Phanerozoic Oceans. Science 2001, 292, 1701–1704. [Google Scholar] [CrossRef] [PubMed] [Green Version]
- Hernández-Hernández, A.; Rodríguez-Navarro, A.B.; Gómez-Morales, J.; Jiménez-Lopez, C.; Nys, Y.; García-Ruiz, J.M. Influence of Model Globular Proteins with Different Isoelectric Points on the Precipitation of Calcium Carbonate. Cryst. Growth Des. 2008, 8, 1495–1502. [Google Scholar] [CrossRef]
- Verrecchia, E.P.; Freytet, P.; Verrecchia, K.E.; Dumont, J.-L. Spherulites in Calcrete Laminar Crusts; Biogenic CaCO3 Precipitation as a Major Contributor to Crust Formation. J. Sediment. Res. 1995, 65, 690–700. [Google Scholar]
- Saraya, M.E.-S.I.; Rokbaa, H.H.A.E.-L. Formation and Stabilization of Vaterite Calcium Carbonate by Using Natural Polysaccharide. Adv. Nanopart. 2017, 6, 158. [Google Scholar]
- Costa, O.Y.; Raaijmakers, J.M.; Kuramae, E.E. Microbial Extracellular Polymeric Substances: Ecological Function and Impact on Soil Aggregation. Front. Microbiol. 2018, 9, 1636. [Google Scholar] [CrossRef] [Green Version]
- McEwen, J.T.; Machado, I.M.; Connor, M.R.; Atsumi, S. Engineering Synechococcus Elongatus PCC 7942 for Continuous Growth under Diurnal Conditions. Appl. Environ. Microbiol. 2013, 79, 1668–1675. [Google Scholar] [CrossRef] [Green Version]
- Cruz, D.; Vasconcelos, V.; Pierre, G.; Michaud, P.; Delattre, C. Exopolysaccharides from Cyanobacteria: Strategies for Bioprocess Development. Appl. Sci. 2020, 10, 3763. [Google Scholar] [CrossRef]
- Morales, E.; Rodríguez, M.; García, D.; Loreto, C.; Marco, E. Crecimiento, Producción de Pigmentos y Exopolisacáridos de La Cianobacteria Anabaena sp. PCC 7120 En Función Del PH y CO2. Interciencia 2002, 27, 373–378. [Google Scholar]
- De Farias Silva, C.E.; Sforza, E.; Bertucco, A. Effects of PH and Carbon Source on Synechococcus PCC 7002 Cultivation: Biomass and Carbohydrate Production with Different Strategies for PH Control. Appl. Biochem. Biotechnol. 2017, 181, 682–698. [Google Scholar] [CrossRef] [PubMed]
- Kurian, N.; Hall, C.J.; Wilkinson, G.F.; Sullivan, M.; Tobin, A.B.; Willars, G.B. Full and Partial Agonists of Muscarinic M3 Receptors Reveal Single and Oscillatory Ca2+ Responses by Β2-Adrenoceptors. J. Pharmacol. Exp. Ther. 2009, 330, 502–512. [Google Scholar] [CrossRef] [PubMed] [Green Version]
- Kaplan, A.; Schwarz, R.; Lieman-Hurwitz, J.; Reinhold, L. Physiological and Molecular Aspects of the Inorganic Carbon-Concentrating Mechanism in Cyanobacteria. Plant Physiol. 1991, 97, 851–855. [Google Scholar] [CrossRef]
- Maeda, S.; Price, G.D.; Badger, M.R.; Enomoto, C.; Omata, T. Bicarbonate Binding Activity of the CmpA Protein of the Cyanobacterium Synechococcus sp. Strain PCC 7942 Involved in Active Transport of Bicarbonate. J. Biol. Chem. 2000, 275, 20551–20555. [Google Scholar] [CrossRef] [Green Version]
- Gallagher, K.; Dupraz, C.; Braissant, O.; Norman, R.; Decho, A.; Visscher, P. Mineralization of Sedimentary Biofilms: Modern Mechanistic Insights. In Biofilm: Formation, Development and Properties.Bailley; Columbus, F., Ed.; Nova Science Publishers: Hauppauge, NY, USA, 2010; pp. 227–258. [Google Scholar]
- Ibelings, B.W.; Maberly, S.C. Photoinhibition and the Availability of Inorganic Carbon Restrict Photosynthesis by Surface Blooms of Cyanobacteria. Limnol. Oceanogr. 1998, 43, 408–419. [Google Scholar] [CrossRef]
- Verspagen, J.M.; Van de Waal, D.B.; Finke, J.F.; Visser, P.M.; Van Donk, E.; Huisman, J. Rising CO2 Levels Will Intensify Phytoplankton Blooms in Eutrophic and Hypertrophic Lakes. PLoS ONE 2014, 9, e104325. [Google Scholar]
- Liao, J.; Zhao, L.; Cao, X.; Sun, J.; Gao, Z.; Wang, J.; Jiang, D.; Fan, H.; Huang, Y. Cyanobacteria in Lakes on Yungui Plateau, China Are Assembled via Niche Processes Driven by Water Physicochemical Property, Lake Morphology and Watershed Land-Use. Sci. Rep. 2016, 6, 36357. [Google Scholar] [CrossRef] [Green Version]
- Hoiczyk, E.; Hansel, A. Cyanobacterial Cell Walls: News from an Unusual Prokaryotic Envelope. J. Bacteriol. 2000, 182, 1191–1199. [Google Scholar] [CrossRef] [Green Version]
- De Philippis, R.; Sili, C.; Vincenzini, M. Response of an Exopolysaccharide-Producing Heterocystous Cyanobacterium to Changes in Metabolic Carbon Flux. J. Appl. Phycol. 1996, 8, 275–281. [Google Scholar] [CrossRef]
- Sohm, J.A.; Webb, E.A.; Capone, D.G. Emerging Patterns of Marine Nitrogen Fixation. Nat. Rev. Microbiol. 2011, 9, 499–508. [Google Scholar] [CrossRef] [PubMed]
- Bhaskar, P.; Bhosle, N.B. Microbial Extracellular Polymeric Substances in Marine Biogeochemical Processes. Curr. Sci. 2005, 88, 45–53. [Google Scholar]
- Dam, H.G.; Drapeau, D.T. Coagulation Efficiency, Organic-Matter Glues and the Dynamics of Particles during a Phytoplankton Bloom in a Mesocosm Study. Deep Sea Res. Part II: Top. Stud. Oceanogr. 1995, 42, 111–123. [Google Scholar] [CrossRef]
- Passow, U. Formation of Transparent Exopolymer Particles, TEP, from Dissolved Precursor Material. Mar. Ecol. Prog. Ser. 2000, 192, 1–11. [Google Scholar] [CrossRef]
- Callieri, C. Synechococcus Plasticity under Environmental Changes. FEMS Microbiol. Lett. 2017, 364, fnx229. [Google Scholar] [CrossRef]
- Polowczyk, I.; Bastrzyk, A.; Fiedot, M. Protein-Mediated Precipitation of Calcium Carbonate. Materials 2016, 9, 944. [Google Scholar] [CrossRef] [Green Version]
- Reynolds, C.S.; Oliver, R.L.; Walsby, A.E. Cyanobacterial Dominance: The Role of Buoyancy Regulation in Dynamic Lake Environments. N. Z. J. Mar. Freshw. Res. 1987, 21, 379–390. [Google Scholar] [CrossRef]
- Dean, J.A. Lange’s Handbook of Chemistry; McGraw-Hill: New York, NY, USA, 1999; ISBN 0-07-016384-7. [Google Scholar]
- Azetsu-Scott, K.; Passow, U. Ascending Marine Particles: Significance of Transparent Exopolymer Particles (TEP) in the Upper Ocean. Limnol. Oceanogr. 2004, 49, 741–748. [Google Scholar] [CrossRef] [Green Version]
- Thornton, D.C. Phytoplankton Mucilage Production in Coastal Waters: A Dispersal Mechanism in a Front Dominated System? Ethol. Ecol. Evol. 1999, 11, 179–185. [Google Scholar] [CrossRef]
- Bach, L.T.; Stange, P.; Taucher, J.; Achterberg, E.P.; Algueró-Muñiz, M.; Horn, H.; Esposito, M.; Riebesell, U. The Influence of Plankton Community Structure on Sinking Velocity and Remineralization Rate of Marine Aggregates. Glob. Biogeochem. Cycles 2019, 33, 971–994. [Google Scholar] [CrossRef] [Green Version]
- Schmidt, I.; Wagermaier, W. Tailoring Calcium Carbonate to Serve as Optical Functional Material: Examples from Biology and Materials Science. Adv. Mater. Interfaces 2017, 4, 1600250. [Google Scholar] [CrossRef] [Green Version]
- Grossart, H.; Simon, M. Limnetic Macroscopic Organic Aggregates (Lake Snow): Occurrence, Characteristics, and Microbial Dynamics in Lake Constance. Limnol. Oceanogr. 1993, 38, 532–546. [Google Scholar] [CrossRef]
Publisher’s Note: MDPI stays neutral with regard to jurisdictional claims in published maps and institutional affiliations. |
© 2022 by the authors. Licensee MDPI, Basel, Switzerland. This article is an open access article distributed under the terms and conditions of the Creative Commons Attribution (CC BY) license (https://creativecommons.org/licenses/by/4.0/).