
Console-Based Mapping of Mongolia Using GMT Cartographic Scripting Toolset for Processing TerraClimate Data


Laboratory of Image Synthesis and Analysis, École Polytechnique de Bruxelles (EPB, Brussels Faculty of Engineering), Université Libre de Bruxelles, Building L, Campus de Solbosch CP131/3, Avenue Franklin D. Roosevelt 50, B-1050 Brussels, Belgium
Geosciences 2022, 12(3), 140; https://doi.org/10.3390/geosciences12030140
Submission received: 18 February 2022
/
Revised: 14 March 2022
/
Accepted: 18 March 2022
/
Published: 21 March 2022
Abstract
:This paper explores spatial variability of the ten climatic variables of Mongolia in 2019: average minimal and maximal temperatures, wind speed, soil moisture, downward surface shortwave radiation (DSRAD), snow water equivalent (SWE), vapor pressure deficit (VPD), vapor pressure anomaly (VAP), monthly precipitation and Palmer Drought Severity Index (PDSI). The PDSI demonstrates the simplified soil water balance estimating relative soil moisture conditions in Mongolia. The research presents mapping of the climate datasets derived from TerraClimate open source repository of the meteorological and climate measurements in NetCDF format. The methodology presented the compiled observations of Mongolia visualised by GMT coding approach using Generic Mapping Tools (GMT) cartographic scripting toolset. The results present 10 new maps of climate data over Mongolia made using automated cartographic techniques of GMT. Spatial environmental and climate analysis were conducted which determine relative distribution of PDSI and temperature extremes, precipitation and soil moisture, wind speed and DSRAD. The DSRAD showed minimum at 40 Wm, maximum at 113 Wm in the Gobi Desert region, SWE (up to 491 mm), VAP and VPD compared with landmass parameters represent powerful cartographic tools to address complex regional climate and environmental issues in Mongolia, a country with contrasting topography, extreme climate conditions and unique environmental setting.
1. Introduction
1.1. Background
Cartographic data visualisation is a key operation in environmental and climate applications in Earth sciences and related disciplines. Given rapidly increasing volumes of available spatial data, the task is to apply the effective tools for processing these data for information retrieval, such that the map can effectively visualise climate and environmental variables that can be used as identifiers for a complex regional climate analysis. Mapping large amount of data quickly and rapidly depends upon effective tools of data processing and spatial information retrieval. In this context, the impact of cartographic approach using script-based tools and relevant software consists in a possibility to develop a practical application for environmental mapping and monitoring. This task may readily be performed by using a script-based approach which accelerates cartographic workflow by utilising special syntax of structured language for rapid processing of the repetitive scripts for mapping. In this way, scripting presents a robust machine-based tool for environmental mapping.
At the same time, the impact of climate change on the environmental setting should be visualised as variables in a project aimed at the environmental analysis or planning of sustainable development.These may include, e.g., soil moisture, possibility of droughts and level of precipitation, to mention a few. For instance, the rise of temperature and the decrease of precipitation lead to water shortage through riverine drainage network downward the slopes, increase the possibility of droughts and contribute to the instability in agricultural activities. Unpredicted changes in climate and the environmental setting may create negative consequences for agricultural activities and in result in a decline of crops. However, proper analysis of the climate and environmental variables may assist in mitigation of such consequences through predictive measures, planning and prognosis. For instance, the analysis of a series of maps visualising the increase of temperatures, wind speed, soil moisture, downward shortwave radiation and snow water equivalent may be used for a complex analysis of regional suitability for agricultural activities and city planning.
Climate has long been recognised to play an important role in the environmental dynamics [1], functionality [2,3], variability and sustainability in various regions of the Earth [4,5,6,7], which has been a subject of numerous studies. This especially concerns Mongolia (Figure 1), a country with extreme continental climate, severe colds winters, occasional presence of permafrost and cryogenic morphostructures [8,9,10] and contrasting dry summers with extremal hot temperatures. Being a country sensitive to climate extremes and environmental impacts affecting its fragile ecosystems, Mongolia presents an example of a unique region of the Earth influenced by global environmental and climate change. Climate variables, such as temperature, precipitation and winds, have a strong effect on the environmental setting of the country well correlating with the topographic structure and the extent of the major eco-zones.
Climate change affects various aspects of vegetation: agricultural potential and crop production [11,12,13], as well as distribution and health conditions of forests [14,15]. Besides environmental effects, climate has an impact on social processes, such as nomadic tourism in Mongolia [16,17], or distribution of nature attractions, e.g., national parks and reserves, aesthetics, quality and suitability of landscapes for visits and recreation [18,19]. Urbanisation is yet another example of climate effects, which indirectly affects the distribution and density of the population depending of basic human conditions necessary for living in Mongolia [20,21,22]. Variations in temperature, frequency and intensity of precipitation, and direction and strength of winds present more factors controlling soil moisture and quality [23], vegetation growth and health [24,25,26] and environmental sustainability [27,28].
At the same time, the two most important climate factors (temperature and precipitation) are largely influenced by the distributions of the topographic landforms and local relief over the region. Those can include notable differences in temperature regime, thermal effects from surface and precipitation patterns in the mountains [29,30], plateau [31,32,33], steppes [34] and deserts [35,36,37,38,39]. In turn, the key exogenous surface processes, such as weathering and erosion, are especially active in the desert areas. These regions are notable for strong winds and highly specific hydrological network pattern largely controlling regional topography by sculpturing and modifying landforms. The examples of such phenomena can be seen both in Mongolia and in neighbouring China [40,41,42].
Besides natural factors, such as climate and topography, the anthropogenic activities present additional aspects contributing to the environmental pressure and thus also affect the environmental sustainability of the region. For instance, grazing intensity and active cattle heading may be the cause of degradation of rangelands in the mountain steppes of Mongolia [21,43,44]. In turn, modified ecosystems affect regional biodiversity and productivity, which well illustrates the sensitivity of the environment to both climate and anthropogenic forces, as reflected in papers on ecological significance [45,46,47]. The interconnectivity between the climate, environmental and social factors, as briefly described above, well illustrates the effects of the climate fluctuations on the ecological system in Mongolia. In fact, natural and anthorogenic factors demonstrate mutual feedbacks between the geographic and climate evolution and human aspects of life [48,49,50].
The actuality of climate change studies is well reflected in the rapid development of methods and approaches to better model and analyse the complexity of the natural processes and their sensitivity to the external factors by modelling. The methodology of climate change assessment is currently experiencing an important challenge. It includes methods of monitoring and mapping, as well as advanced approaches of data analysis [51,52,53]. For example, these include long-term climatic data and biophysical and physiological parameters of pasture grassland and cattle in Mongolia [54,55]; performing interviews supported by meteorological data for analysis of climate change impacts on the provisioning of key ecosystem functions as well as nomadic herders’ livelihoods and pasturelands [56]; and analysis of interactions between ecosystems and nomadic land-use systems in mutually-adaptive ways, for maintaining rangelands and nomadic pastures resilient and sustainable [57].
Such and other studies demonstrate how climate changes, ecosystem dynamics, and socioeconomic factors have been interacting to determine nomadic land-use systems in Mongolia. More examples include, for instance, hydrological analysis of the stream connectivity and their affect on biotic interactions such as species distribution, population dynamics and fragmentation of biotas in the Mongolian riverine system [58]; and integrated analysis of the recent changes in the climate regime of Mongolia using data on atmospheric events, land degradation, desertification and sandstorms [59]. Yet another example of climate-related studies of Mongolia [60] includes studying spatiotemporal variations of aridity by quantitative analysis as a major indicator for land prone to drought, degradation and desertification.
The balance between climate and environment setting in Mongolia can be analysed by monitoring and mapping using regularly updated data. In this context, script-based methods of mapping provide a precious tool for rapid mapping of large amounts of data covering various periods and can be used by monitoring centres. Visualising the climate and environmental setting of the country using advanced cartographic methods can support integrated environmental monitoring that can have various applications: agriculture, biodiversity, sustainable development, city planning, etc. Adapting various datasets in projects aimed towards resilient and sustainable environmental monitoring requires active integration of digital technologies that could enable to process such data rapidly yet effectively.
With an increasingly growing availability of climate and environmental data, cartographic processing is now largely dependent on the advanced technical tools that could be used for effective mapping. Therefore, using script-based methods will enable to develop a smart mapping approach of processing climate and topographic data for environmental monitoring. For instance, precise and accurate visualisation of geo-information on the geometric extent of the fields, types and degree of climate hazards derived from the open geospatial high-resolution datasets can help monitoring and improving climate change prognosis and environmental risk assessment both at national and regional scales including both Mongolia and the neighbouring region of Inner Mongolia, China [61,62,63].
1.2. Objectives
The primary objective of this study is mapping of Mongolia using advanced cartographic methods of the Generic Mapping Tools (GMT) for visualisation of the climate and environmental parameters. Using scripting techniques of GMT, this study presented a series of maps showing how selected climate parameters change across Mongolia with respect to the topography of the country. In such a way, the study aims to focus on the twofold aspects.
The first aspect is related to climate and topographic analysis aimed to detect variations in climate parameters for environmental monitoring at a national scale. Those include average minimal and maximal temperature, wind speed, soil moisture, downward surface shortwave radiation (DSRAD), snow water equivalent (SWE), vapor pressure deficit, vapor pressure anomaly, monthly precipitation and Palmer Drought Severity Index (PDSI). Thus, this paper explores spatial variability and performance of these climatic variables in Mongolia for the period of 2019 using TerraClimate dataset.
The second aspect concerns technical issues of the cartographic methods using GMT that affect methods of data processing and visualisation. Specifically, this includes GMT scripting syntax and proper selection of technical mapping parameters for optimal cartographic representation of spatial phenomena and data modelling. Using effective and advanced cartographic data processing, it becomes possible to better highlight distribution of the geographic and environmental phenomena, for instance, the geomorphology of the country, with effects of the terrain steepness and elevation, by selecting correct colour scheme, hydrologic network density and thematic variables. Specifically, the practices of regional mapping and monitoring of climate data using advanced script-based techniques can support and accelerate the transition to digital data management within environmental, climate and agriculture domains. Detailed analysis of maps can assist in smart farming in special conditions of arid continental climate in Mongolia.
To better understand the driving factors affecting the environment of Mongolia, the study goal was to highlight regional variations in climate and environmental variables of this country well correlating with its complex and diversified topography. To do this, a series of maps has been created using GMT aimed to demonstrate certain correlation between the topographic and climate factors that contribute to the environmental sustainability of Mongolia. Such a cartographic output made based on the advanced script-based tool can assist data-driven recommendations in complex analysis aimed to adapt and develop current climate and environmental setting to human needs, e.g., agricultural digital farming systems or regional environmental monitoring for urban development in Mongolia.
Variations in different climate parameters, described above, were evaluated over the topographic landforms of Mongolia, by comparing maps showing the distribution of the continuous fields of climate variables. As a result, the study illustrated how climate variability in various ecological zones of Mongolia is strongly affected by its complex topography that varies notably in different regions of the country: high-mountain areas [64,65], semi-arid mountainous steppe and shrublands [66], deserts and semi-deserts, steppes, grasslands [67,68], taiga forests [69,70] and alpine regions [71]. To this end, the study has the following aims:
- To test, evaluate and implement script-based technical cartographic methods of geospatial data analysis by GMT;
- To perform semi-automatic mapping of raster data using various GMT modules through utilisation of the script-based data processing for spatial analysis.
In such a way, this research presents a compilation of the visualised climate and environmental data based on the TerraClimate open source repository. The data show measurements of the meteorological and climate global data in the NetCDF format. The methodology applied the compiled data observations over Mongolia and visualised experimental meteorological data using GMT [72]. Environmental monitoring based on the open source data processed using advanced cartographic scripts enables to introduce a system of data-based decisions on climate and environmental data. Processing of these data is supported by innovative approaches of GMT: targeted use of modules for processing layers visualised by codes written using syntax of GMT language.
The study presents a series of the eleven new maps (ten climate maps and a topographic map) made using scripting techniques of GMT, applied in the existing cartographic studies [73,74,75,76,77,78]. Full GMT scripts used for plotting these maps are available in the Appendices with provided live-links to the corresponding maps for repeatability of these techniques in similar cartographic tasks in relevant studies and as a technical reference.
Besides this, the paper discusses the actuality of the advanced scripting methods in contemporary cartography. Scripts enable robust and rapid visualisation of the data, especially in case of mapping large datasets, which presents a significant advantage compared to conventional mapping routine. This is different from the existing numerous applications of GIS [79,80,81,82,83,84,85]. For instance, compared to the scripting mapping, traditional mapping is largely based on the GUI-based approach [86,87,88,89].
However, scripts clearly surpass the traditional ways of mapping in terms of automatisation, speed of data processing and aesthetic quality of maps. At the same time, increasing variability and amount of data requires fast and reliable techniques of their processing, modelling and visualisation. This sets up a need to actualise, update and increase the quantity and quality of the existing maps of Mongolia using high-resolution thematic data and advanced cartographic approaches. Such a task requires advanced, machine-based effective methods with minimised handmade routine for speedy and comprehensive thematic mapping. Some existing examples of such automatisation in cartography can be illustrated by using scripting tools: GRASS GIS [90,91], GMT [92,93,94,95,96], R [97,98] and QGIS [99,100]. This study seeks to contribute to these attempts and continue methodological development of modern cartography by presenting maps of Mongolia.
2. Materials and Methods
2.1. General Approach
2.1.1. Data
The study is based on the integration of the open source high-resolution geospatial data. These were obtained from the TerraClimate and GEBCO as crucial sources of information in climate and environmental domains. The materials used in this study include open source data. Specifically, the data include two data sources: (1) TerraClimate, a publicly available global climate dataset in a raster NetCDF format (website hyperlink: https://climate.northwestknowledge.net/TERRACLIMATE/index_directDownloads.php, accessed on 18 February 2022), originally developed by [101] and updated on a regular basis; (2) GEBCO, processed for topographic mapping of Mongolia, website hyperlink: https://www.gebco.net, accessed on 18 February 2022. The TerraClimate dataset can be used for other periods since 1958 up to now aimed both at retrospective mapping and for estimating mapping proposing prognosis of future scenarios in climate change. Visualisation of such data enables to highlight changes in continuous fields based on the analysis of correlation between the isolines and correspondence of the extremal values.
2.1.2. Software
The GMT is a major technical tool for script-based mapping with advanced functionality and methods of cartographic data handling. The choice of the cartographic tool GMT for data processing is explained by its scripting language that enables to process large volumes of data rapidly and effectively. The production of the geospatial data has been increasing continuously in volume worldwide which is mostly associated with an increase in velocity of data generation and variety of formats. The onset of the large spatial data era results in challenges of processing these data, which can only be done using semi-automated methods, such as GMT scripting, enabling to rapidly exploit large amounts of spatial information.
Therefore, scripting techniques of GMT are used in this study to process high-precision spatial data for environmental, topographic and climate mapping of Mongolia. Data analysis is based on the process of extracting information by interpreting variables using features visualised by cartographic approaches. Specifically, these include adjustments of color, geometric structure and patterns of changed variables as continuous phenomena corresponding to the terrain relief and interpreting the retrieved information from the data for environmental analysis. Due to its embedded scripting language, GMT enables effective data processing and visualisation of raster files in large spatial and temporal scales, which is also an actual task for climate and environmental monitoring in real time regime, for instance by comparison data for multiple years. The algorithms of GMT-based scripting propose the advanced ways of such tasks enabling spatial data processing, computer vision and automated plotting. This explains the choice of the data and the scripting toolset GMT selected for this study.
2.2. Technical Workflow
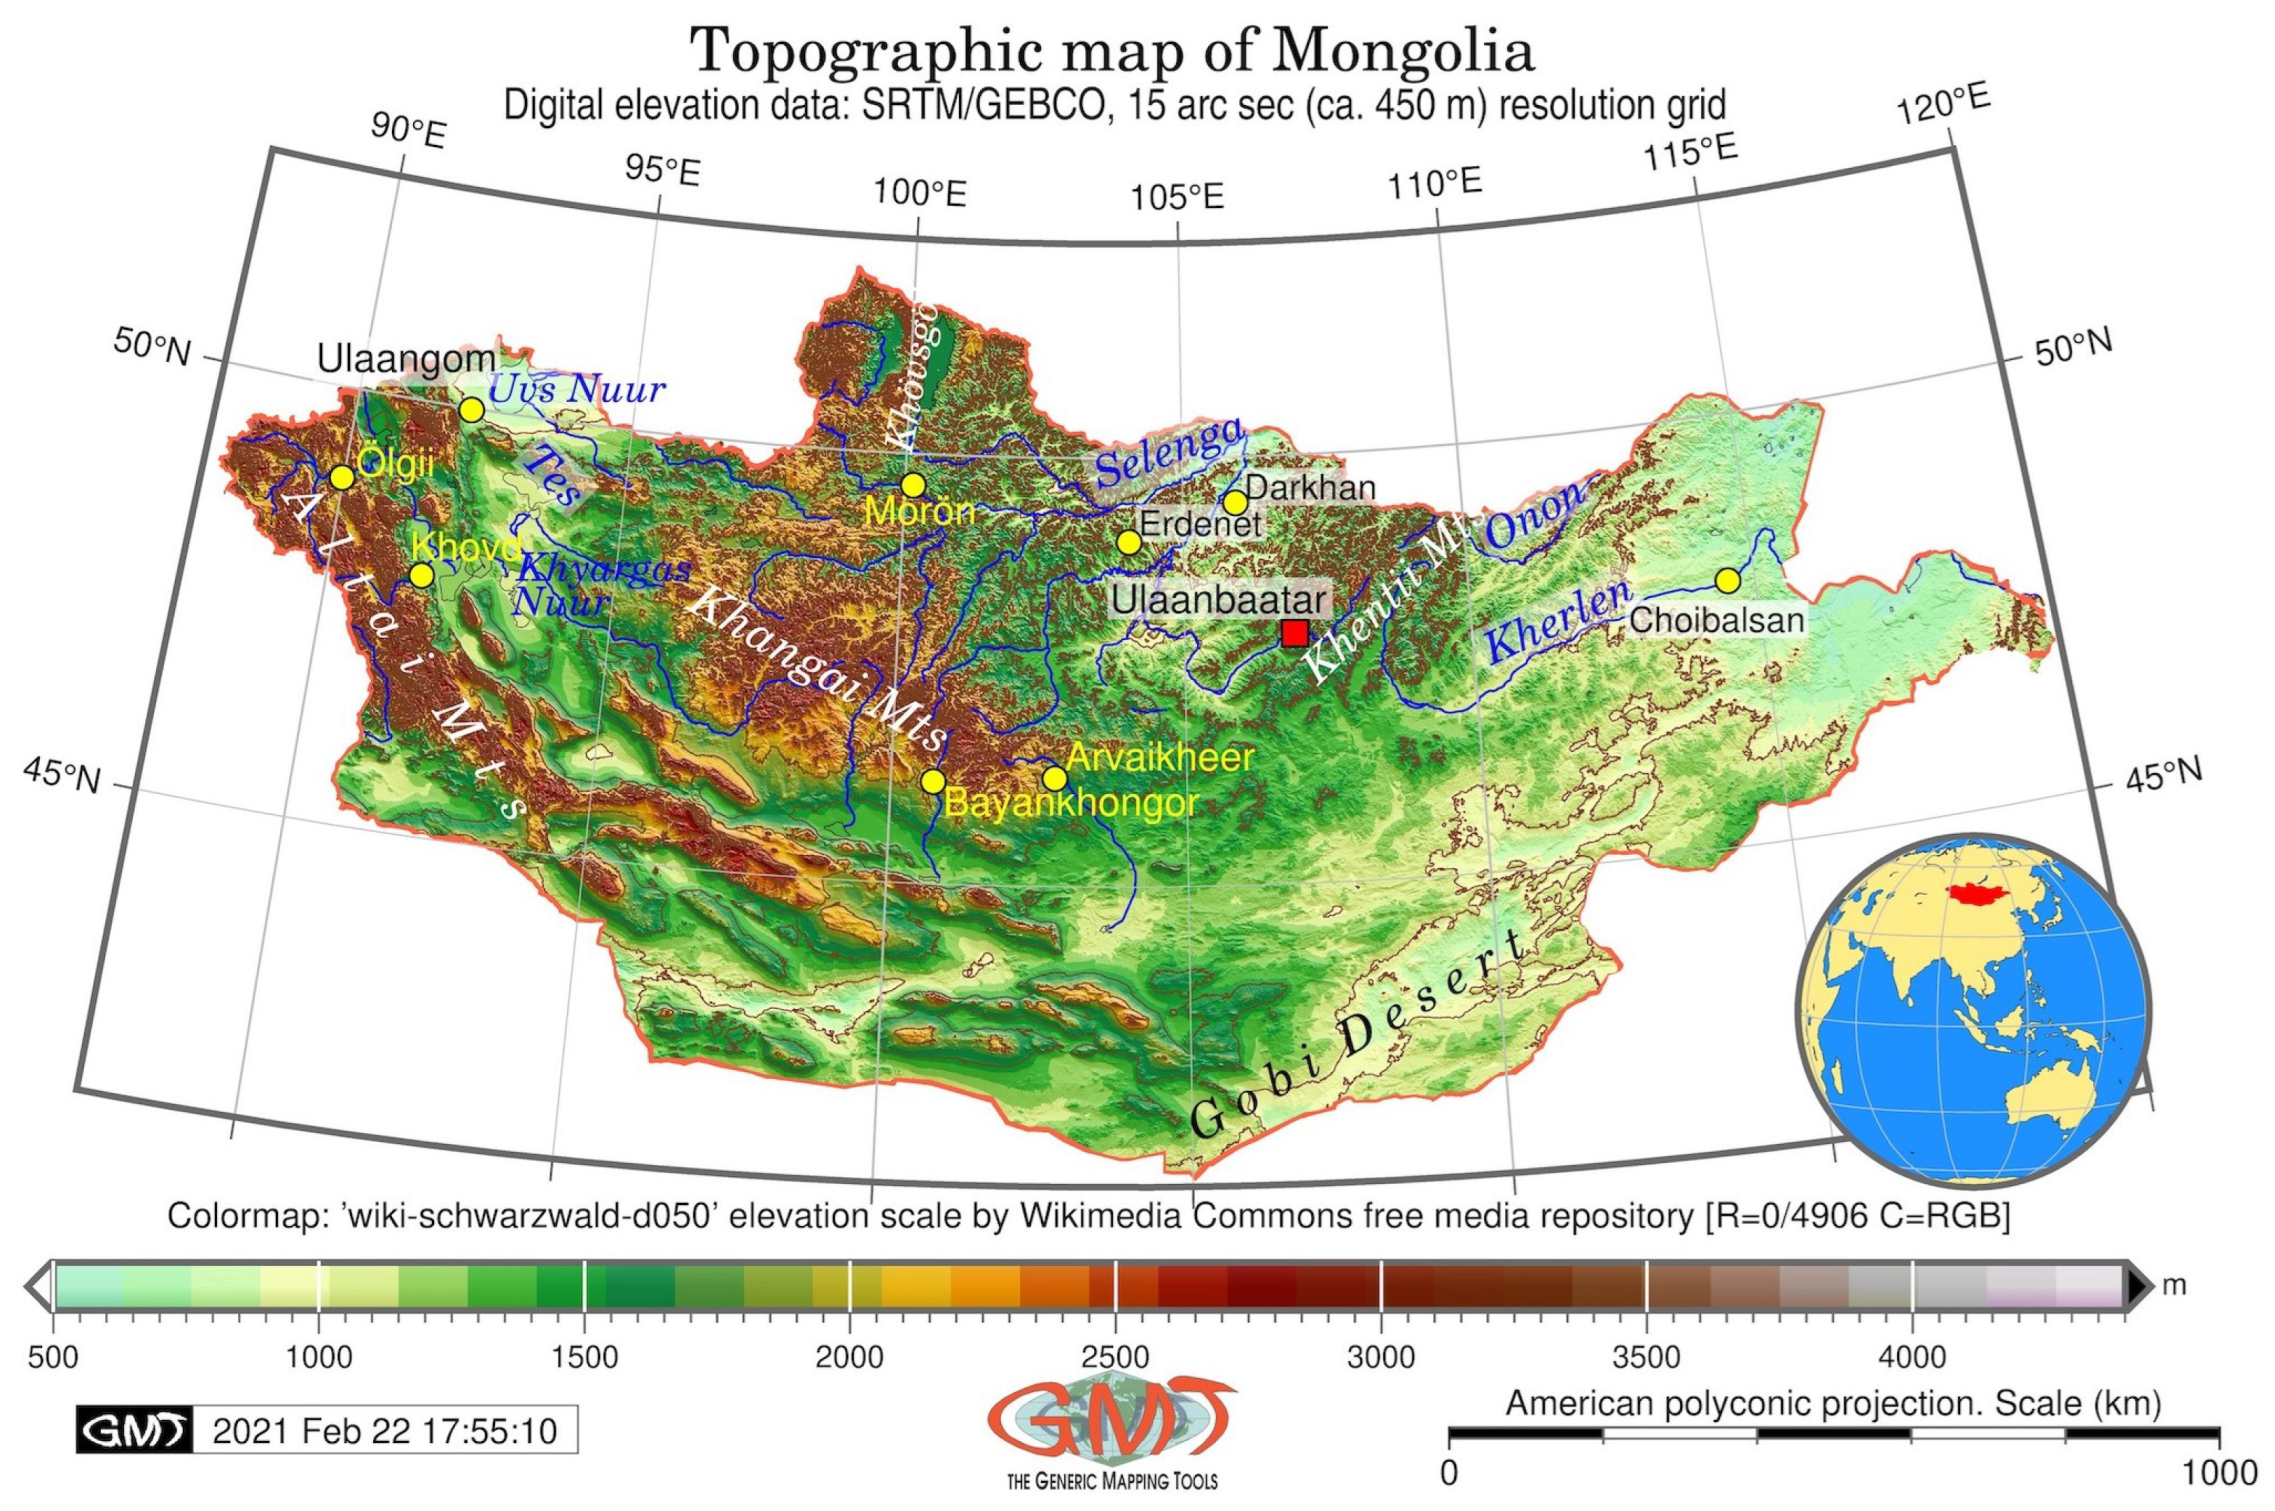
The preliminary processing included initial seps that can be summarised as followed. Data were captured and collected from the available web sources (these included environmental and climate data, GEBCO and descriptive data sources), stored and formatted in a working project directory and processed by GMT, as described below. The GMT full scripts are available on the author’s GitHub webpage accessible using the link: https://github.com/paulinelemenkova/Mapping_Mongolia_GMT, accessed on 18 February 2022. The topographic mapping (Figure 1) was based on the General Bathymetric Chart of the Oceans (GEBCO) grid [102], which aggregates the SRTM data for the terrestrial areas at 15 arc-second (ca. 450 m) resolution. Other maps (Figure 2, Figure 3, Figure 4, Figure 5, Figure 6, Figure 7, Figure 8, Figure 9, Figure 10 and Figure 11) were plotted using TerraClimate raster climate datasets.
The GMT module ‘grdcut’ was applied to clip the region of the country from the global grid using the following code: ‘gmt grdcut GEBCO_2019.nc -R87.5/120/41.5/52.5 -Gmn_relief.nc’ where the ‘-R’ flag controls the coordinates of the study area in WESN convention (87.5°–120° E, 41.5°–52.5° N). The application of the module ‘psclip’ generates a selection of the study area using the DCW contour of the country, which was defined by the following code: ‘gmt psclip -R87.5/120/41.5/52.5 -JPoly/6.5i Mongolia.txt -O -K ≫ $ps’. The river hydrological network was visualised using the ‘pscoast’ module: ‘gmt pscoast -R -J -Ia/thinner,blue -Na -N1/thicker,tomato -W0.1p -Df -O -K ≫ $ps’.
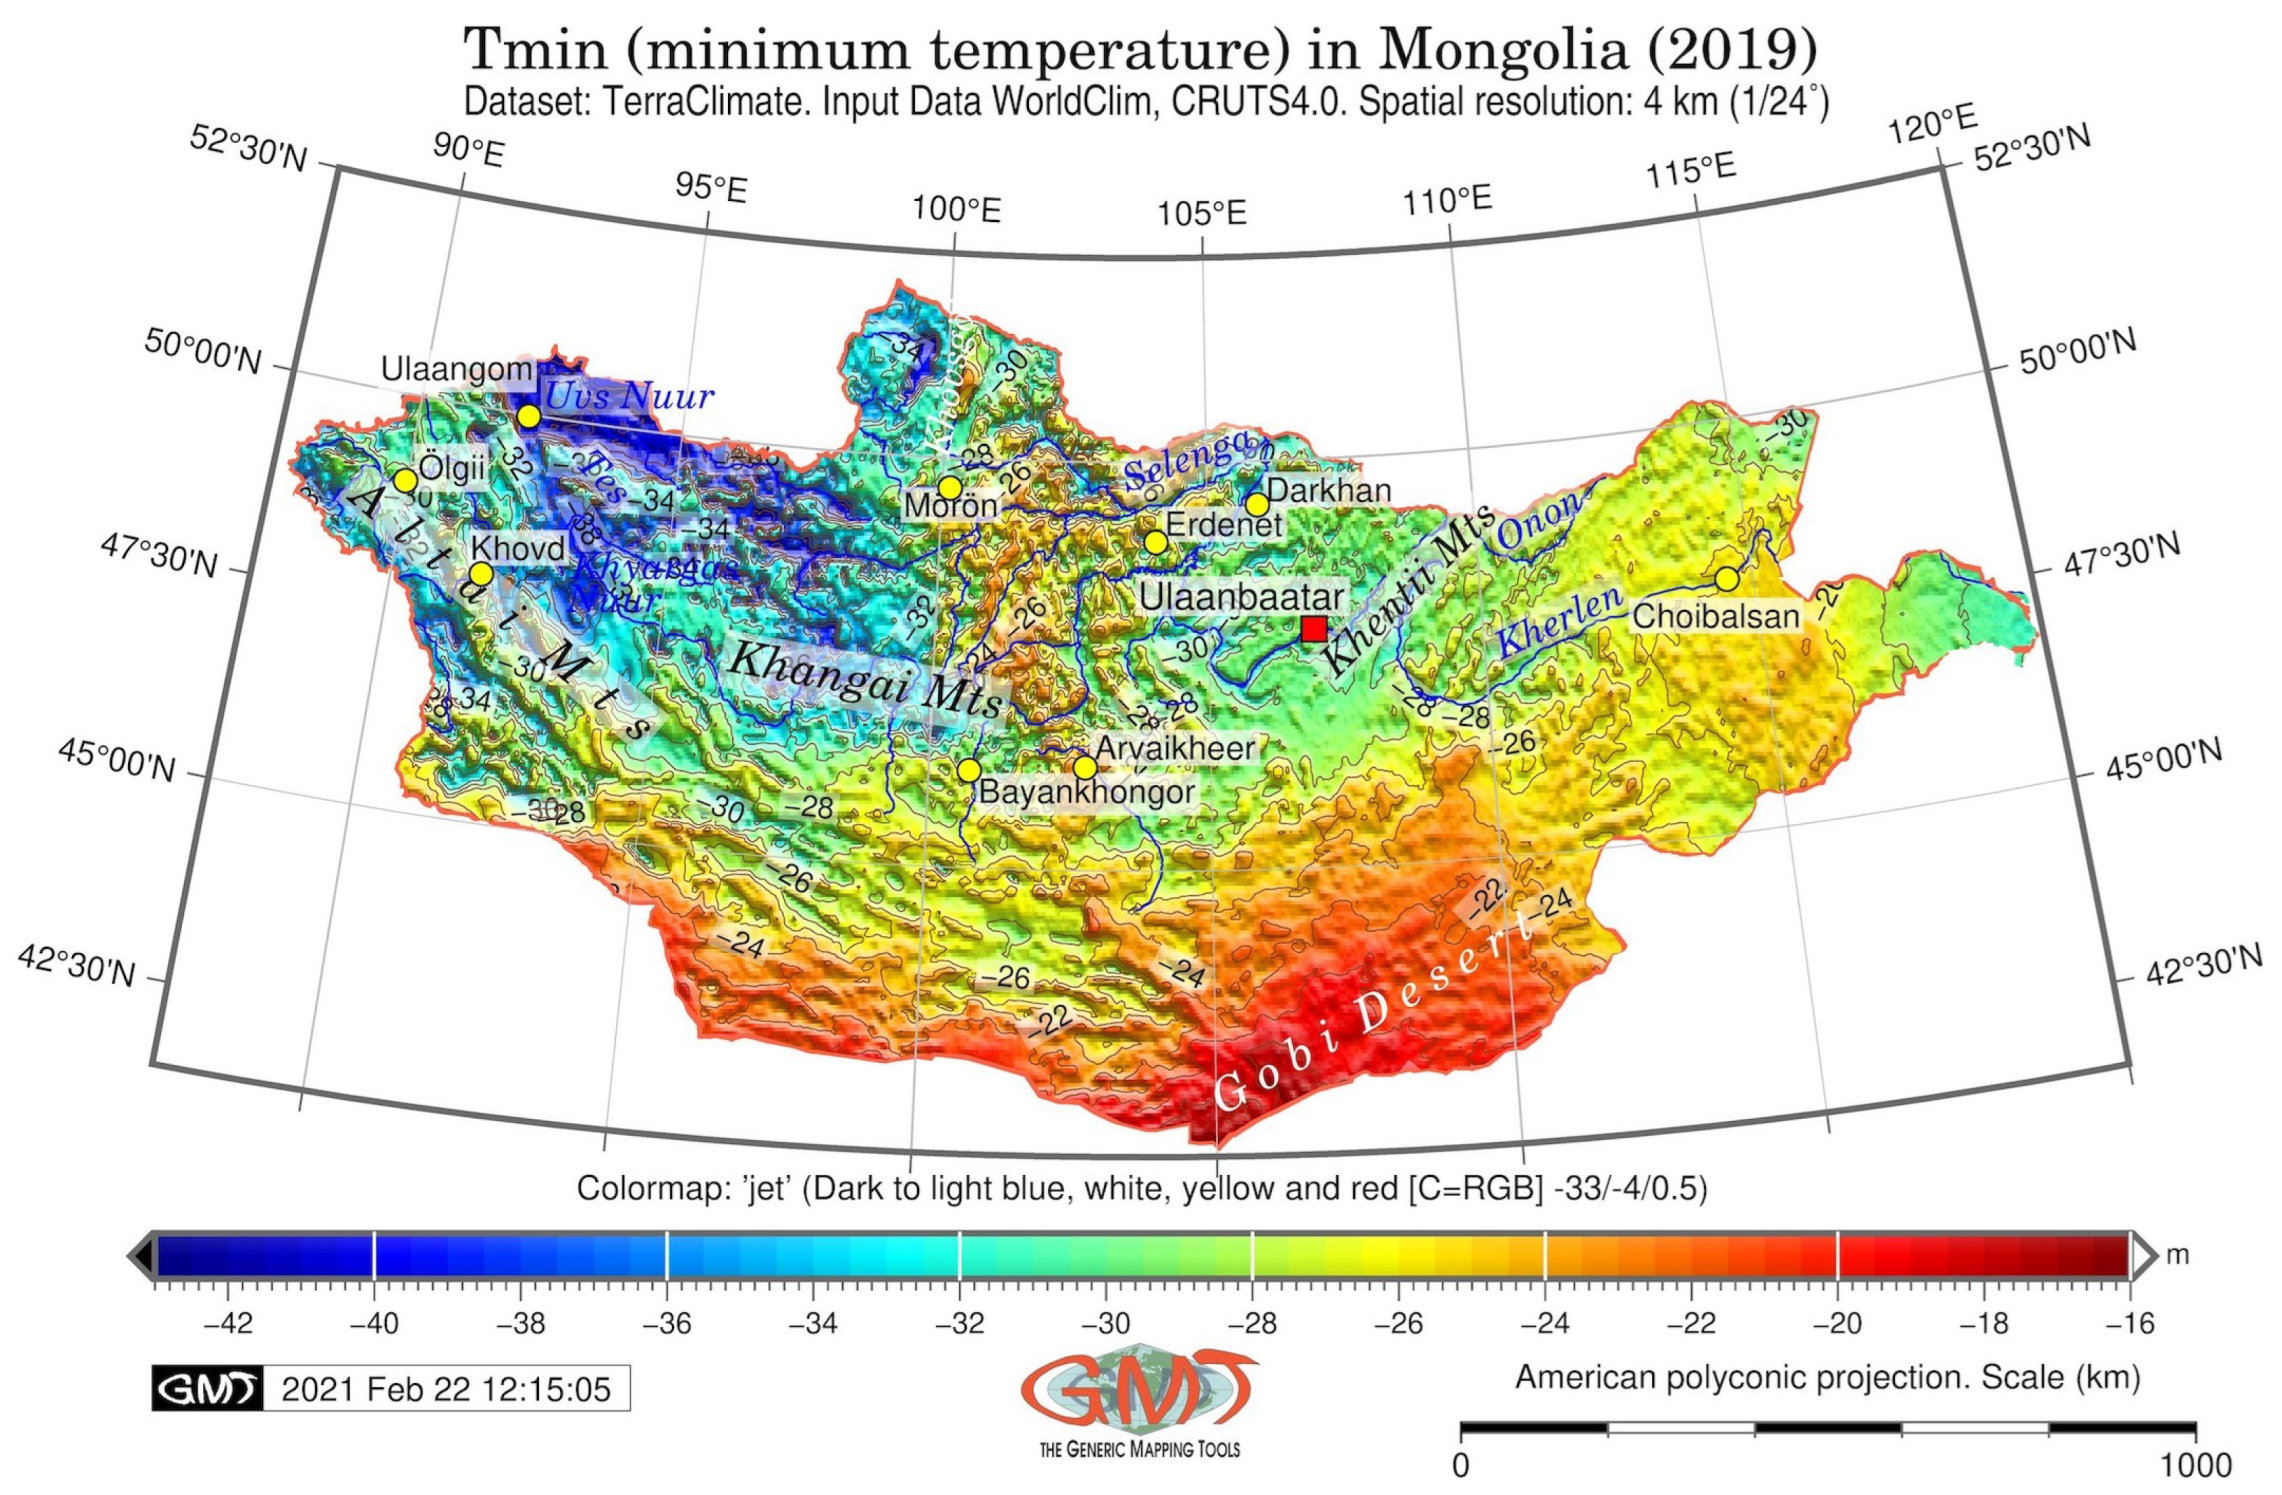
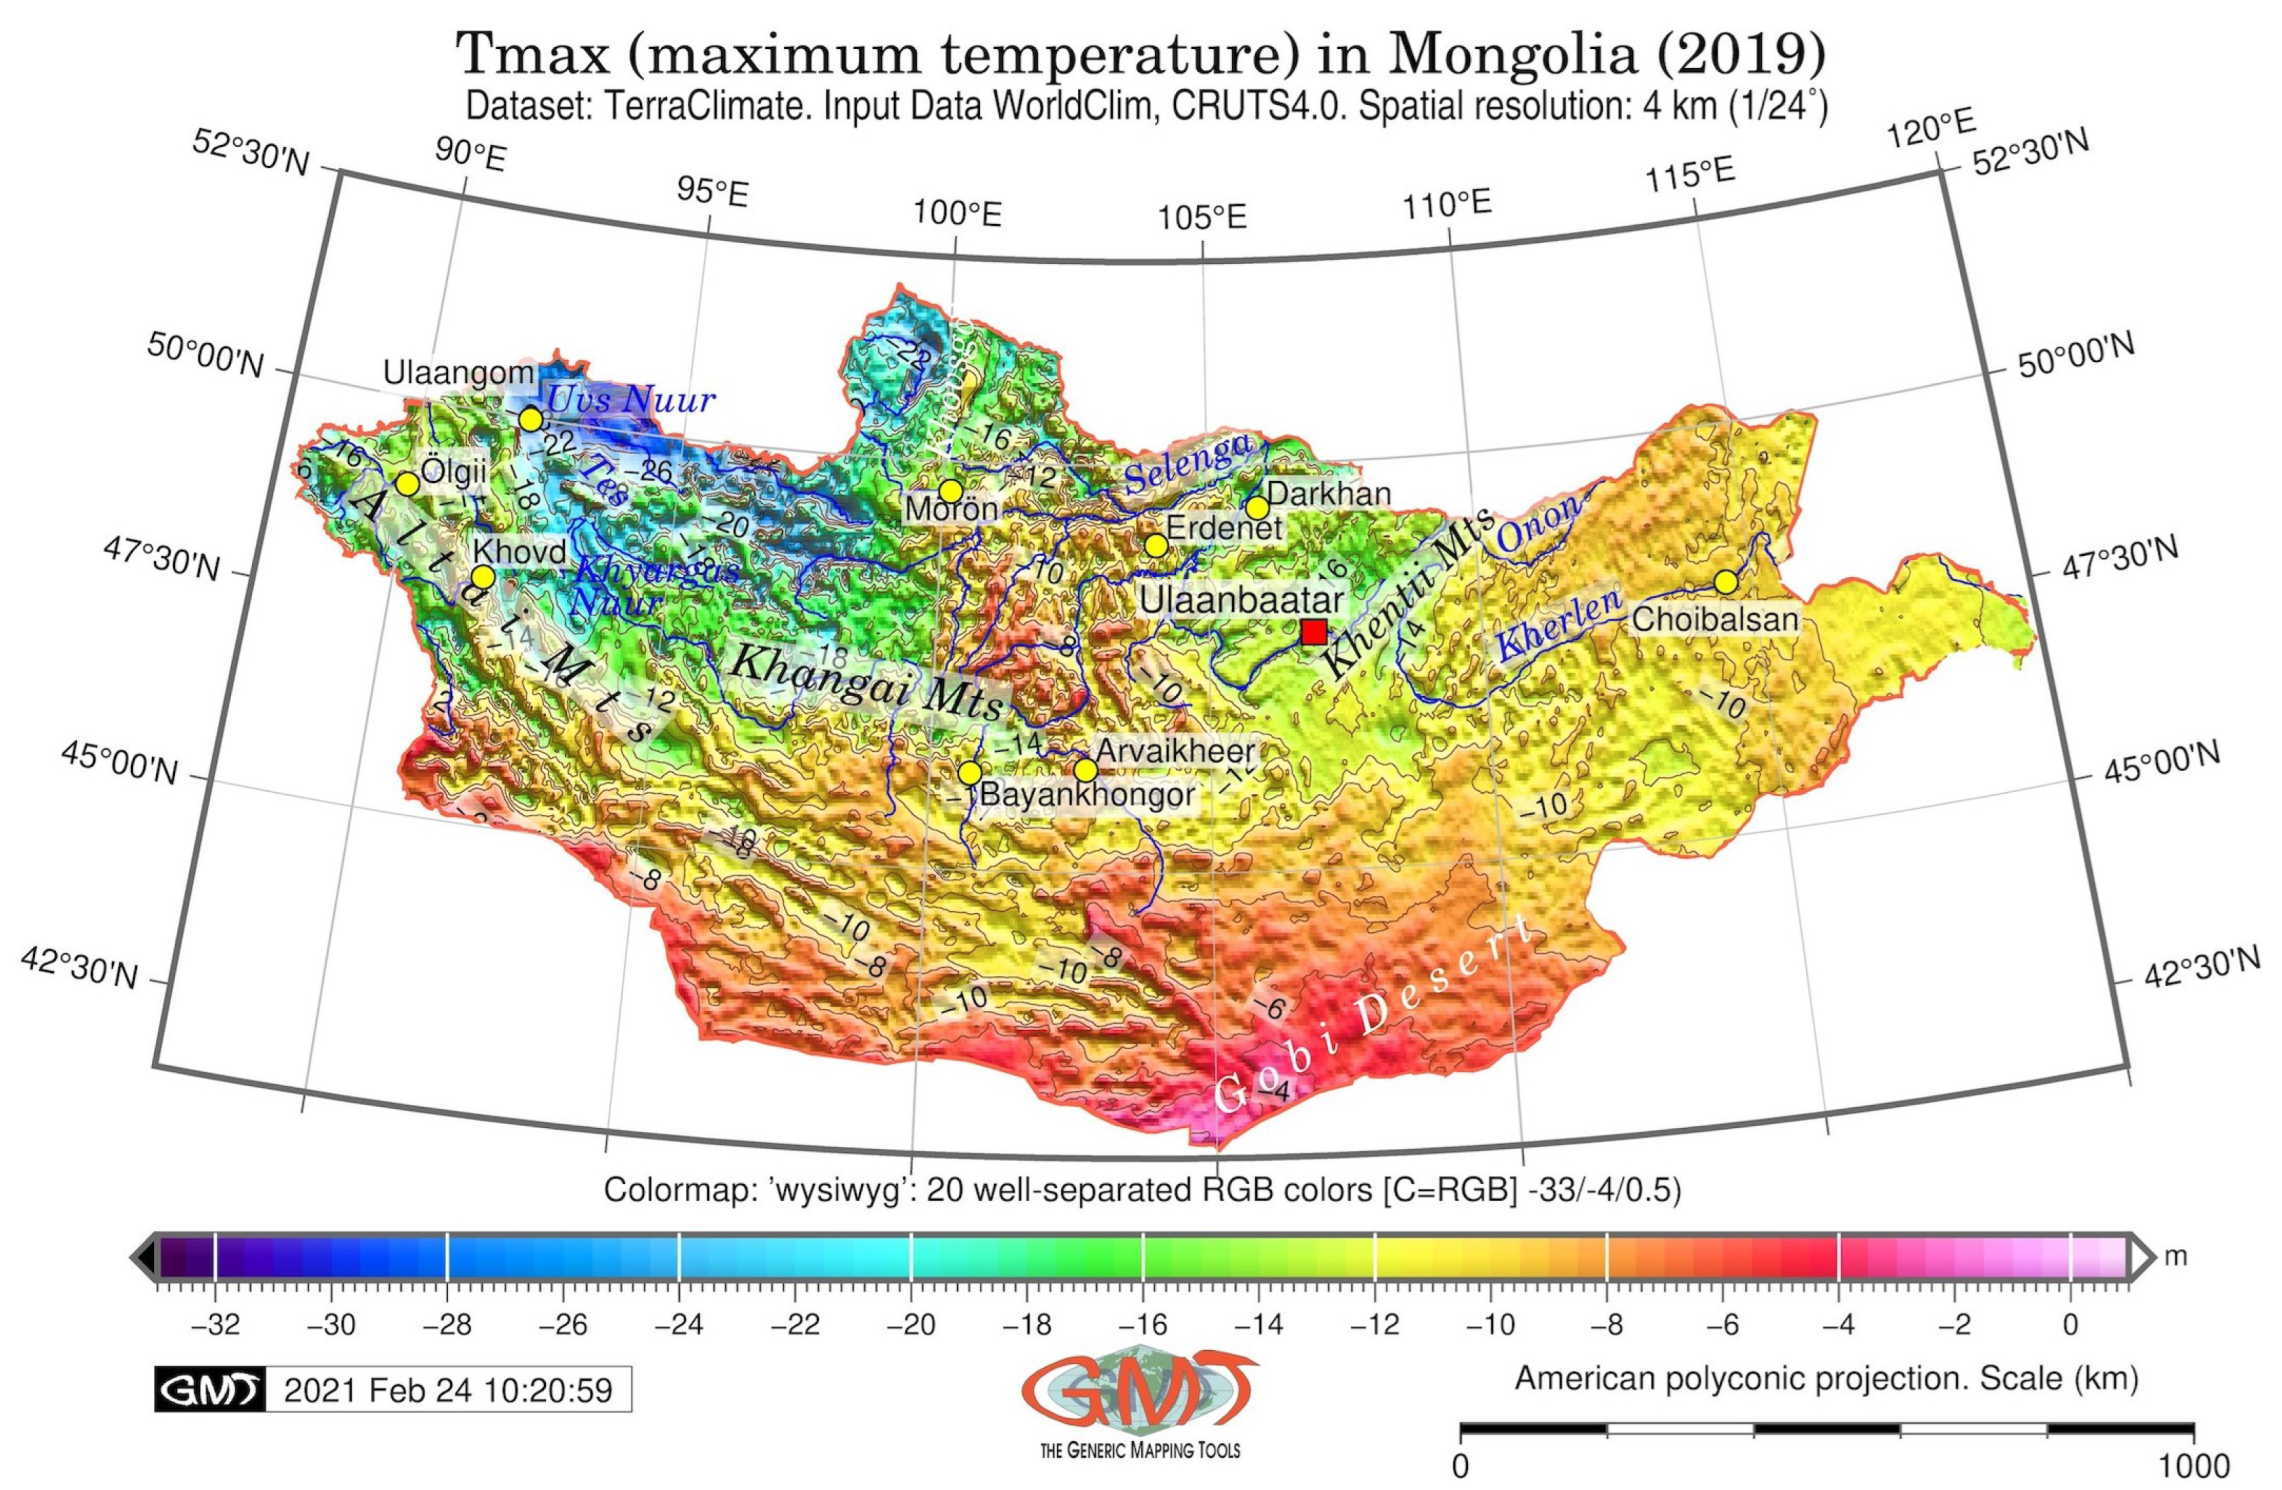
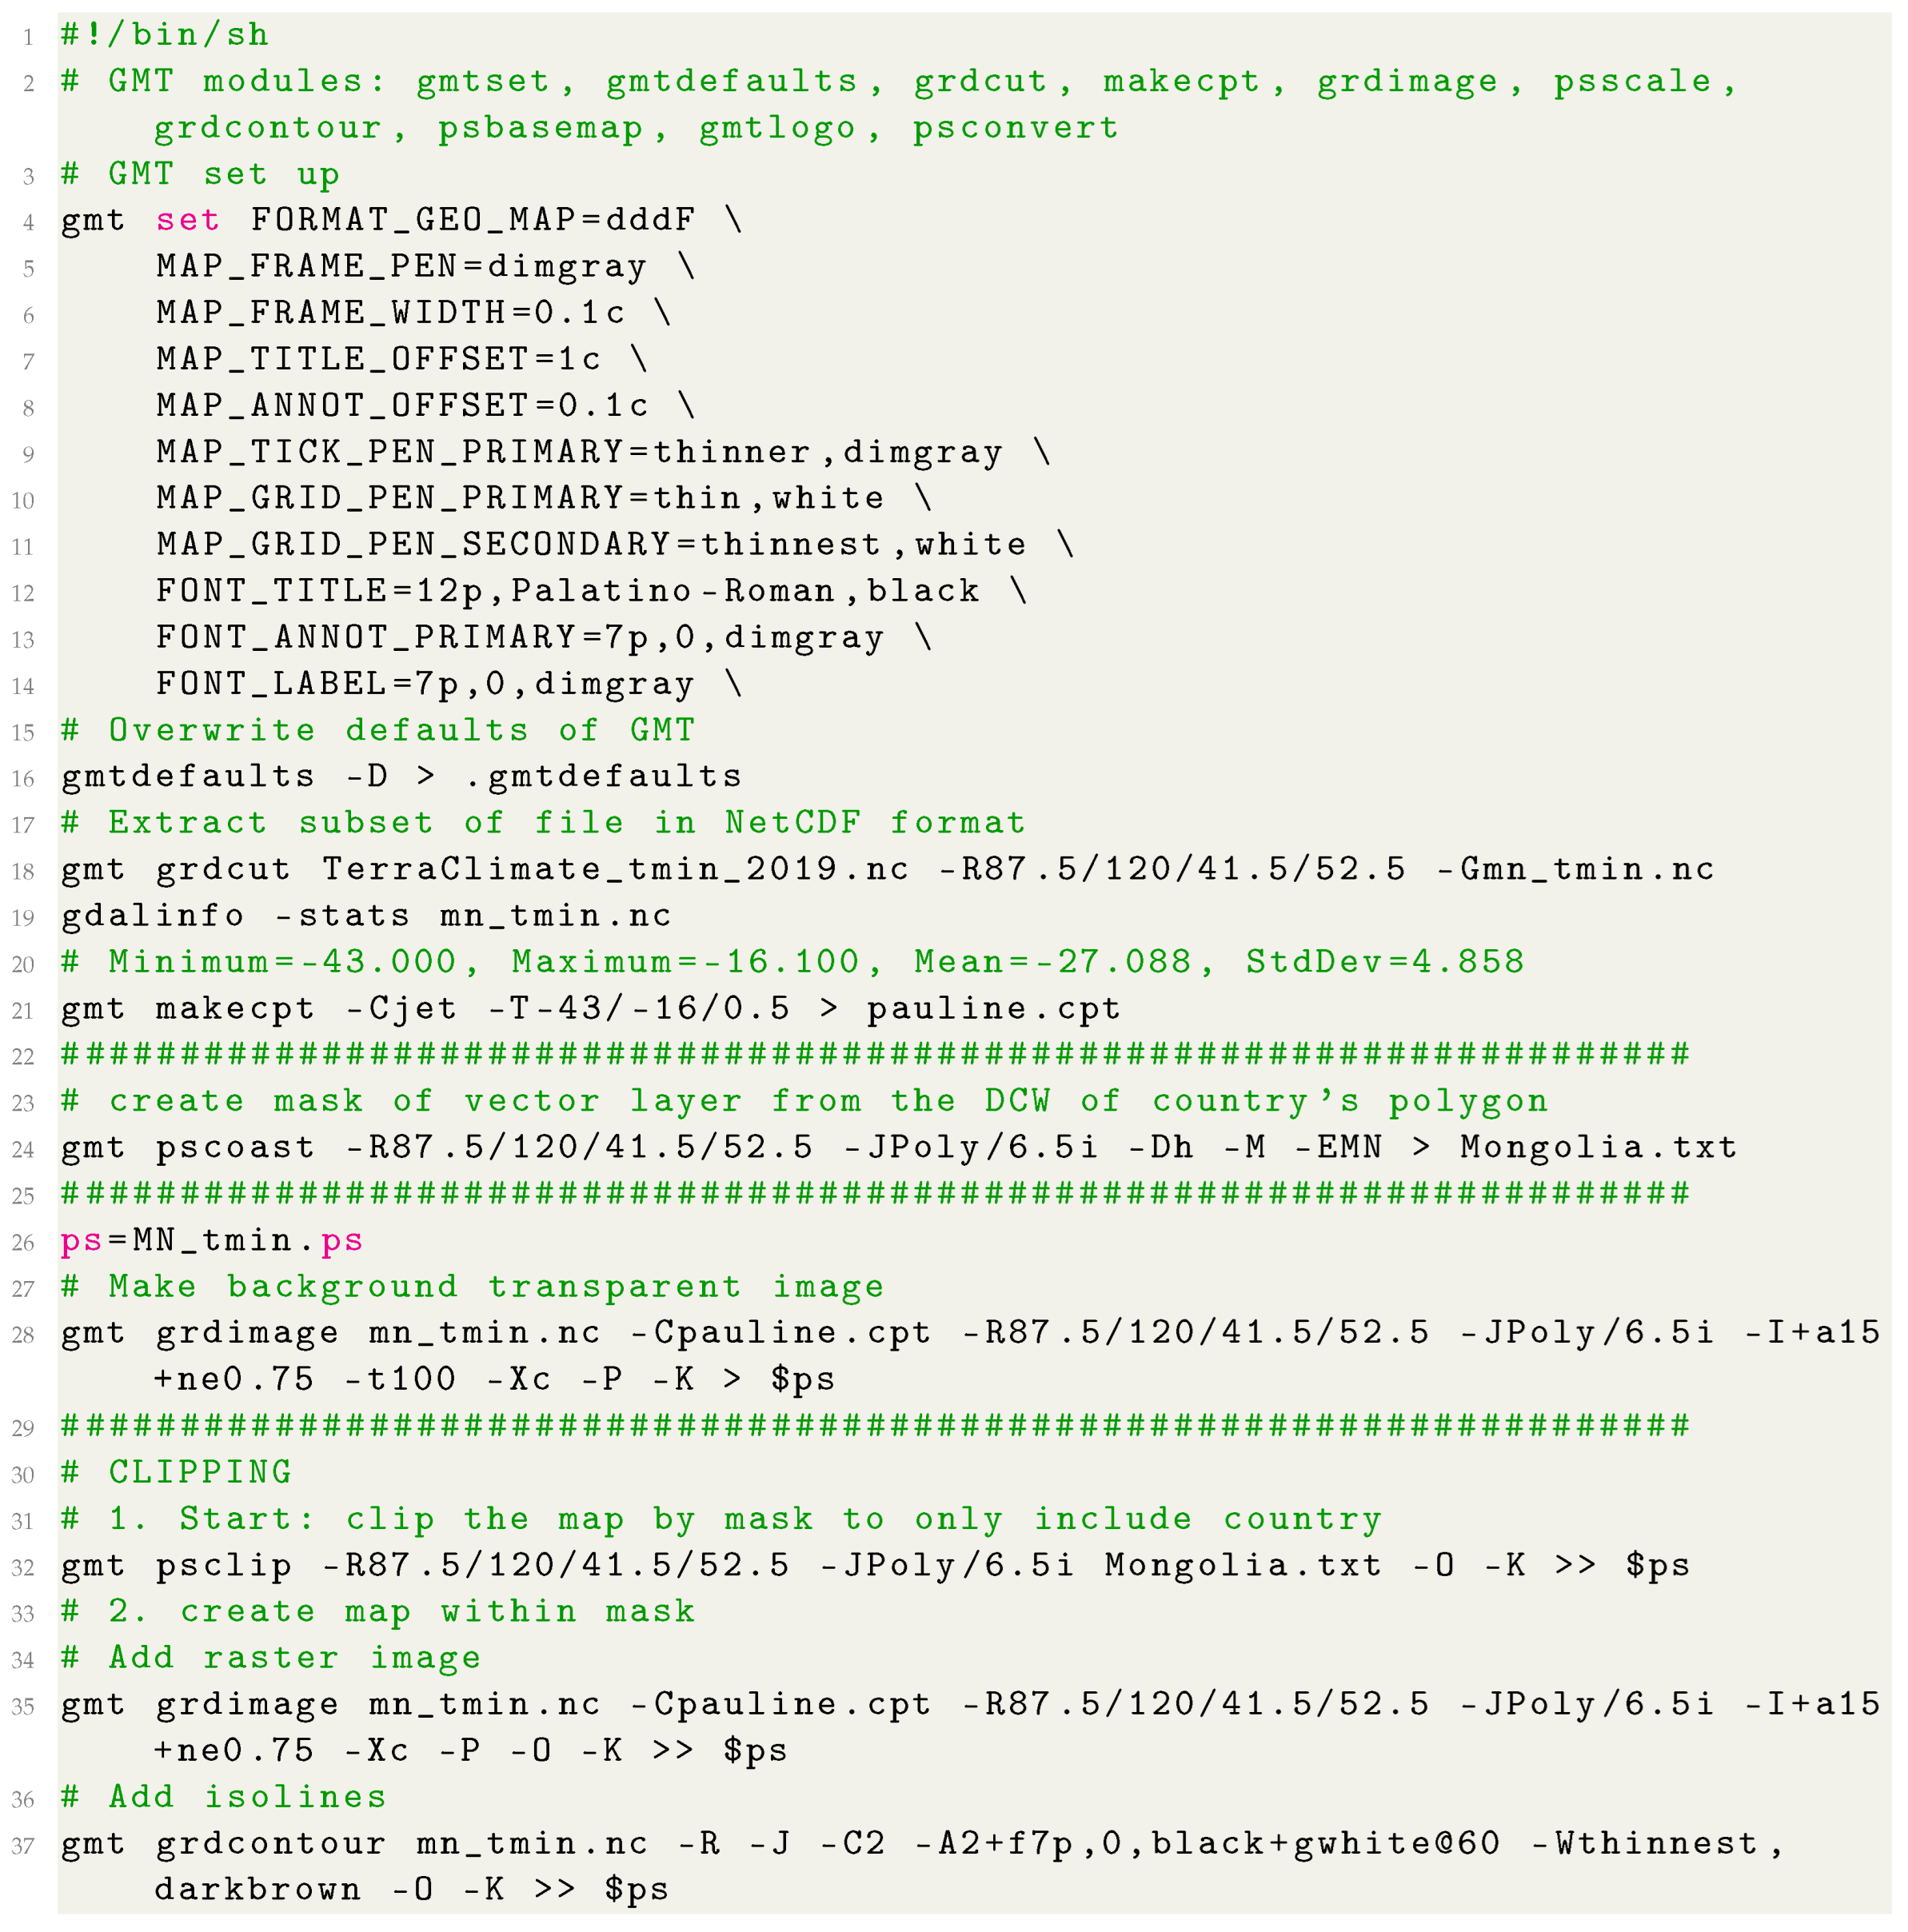
The isolines on the temperature maps (Figure 2 and Figure 3) were modelled using the ‘grdcontour’ module of GMT: ‘gmt grdcontour mn_tmin.nc -R -J -C2 -A2+f7p,0,black+gwhite@60 -Wthinnest,darkbrown -O -K ≫ $ps’. Here the ‘-A’ flag explains the annotations plotted every 2nd line with ascertained transparency as reported in the existing works [103].
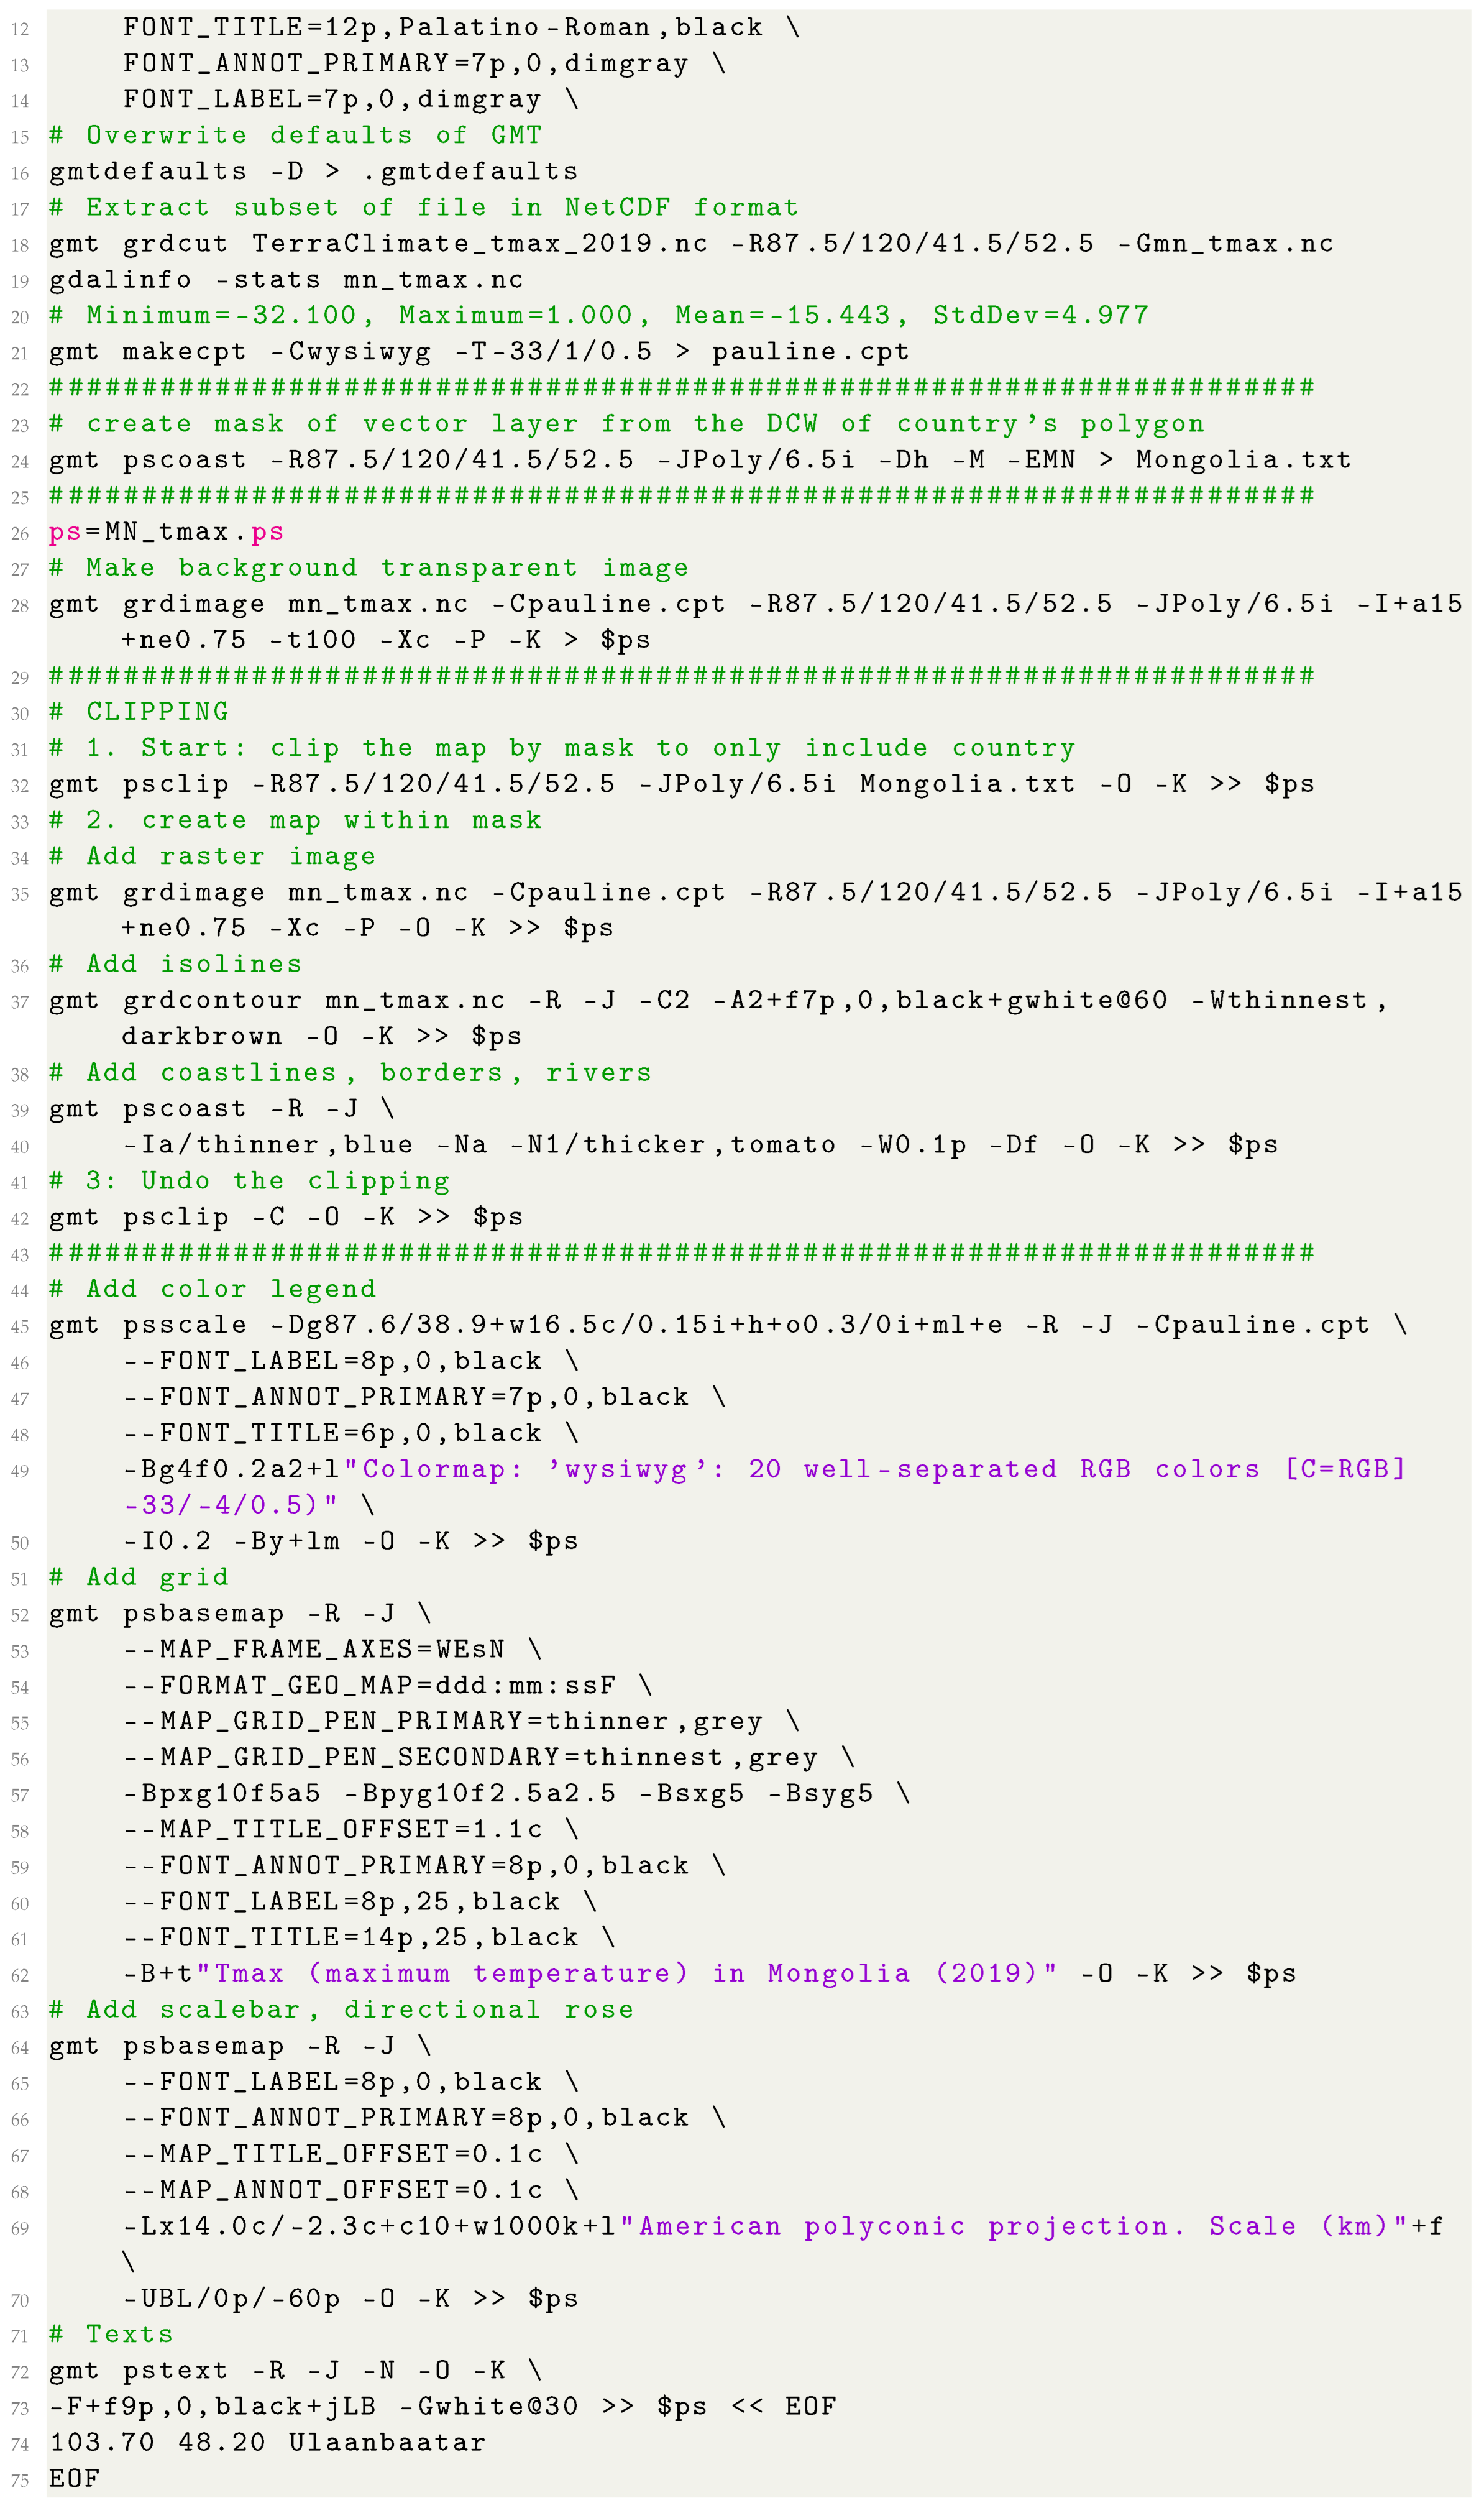
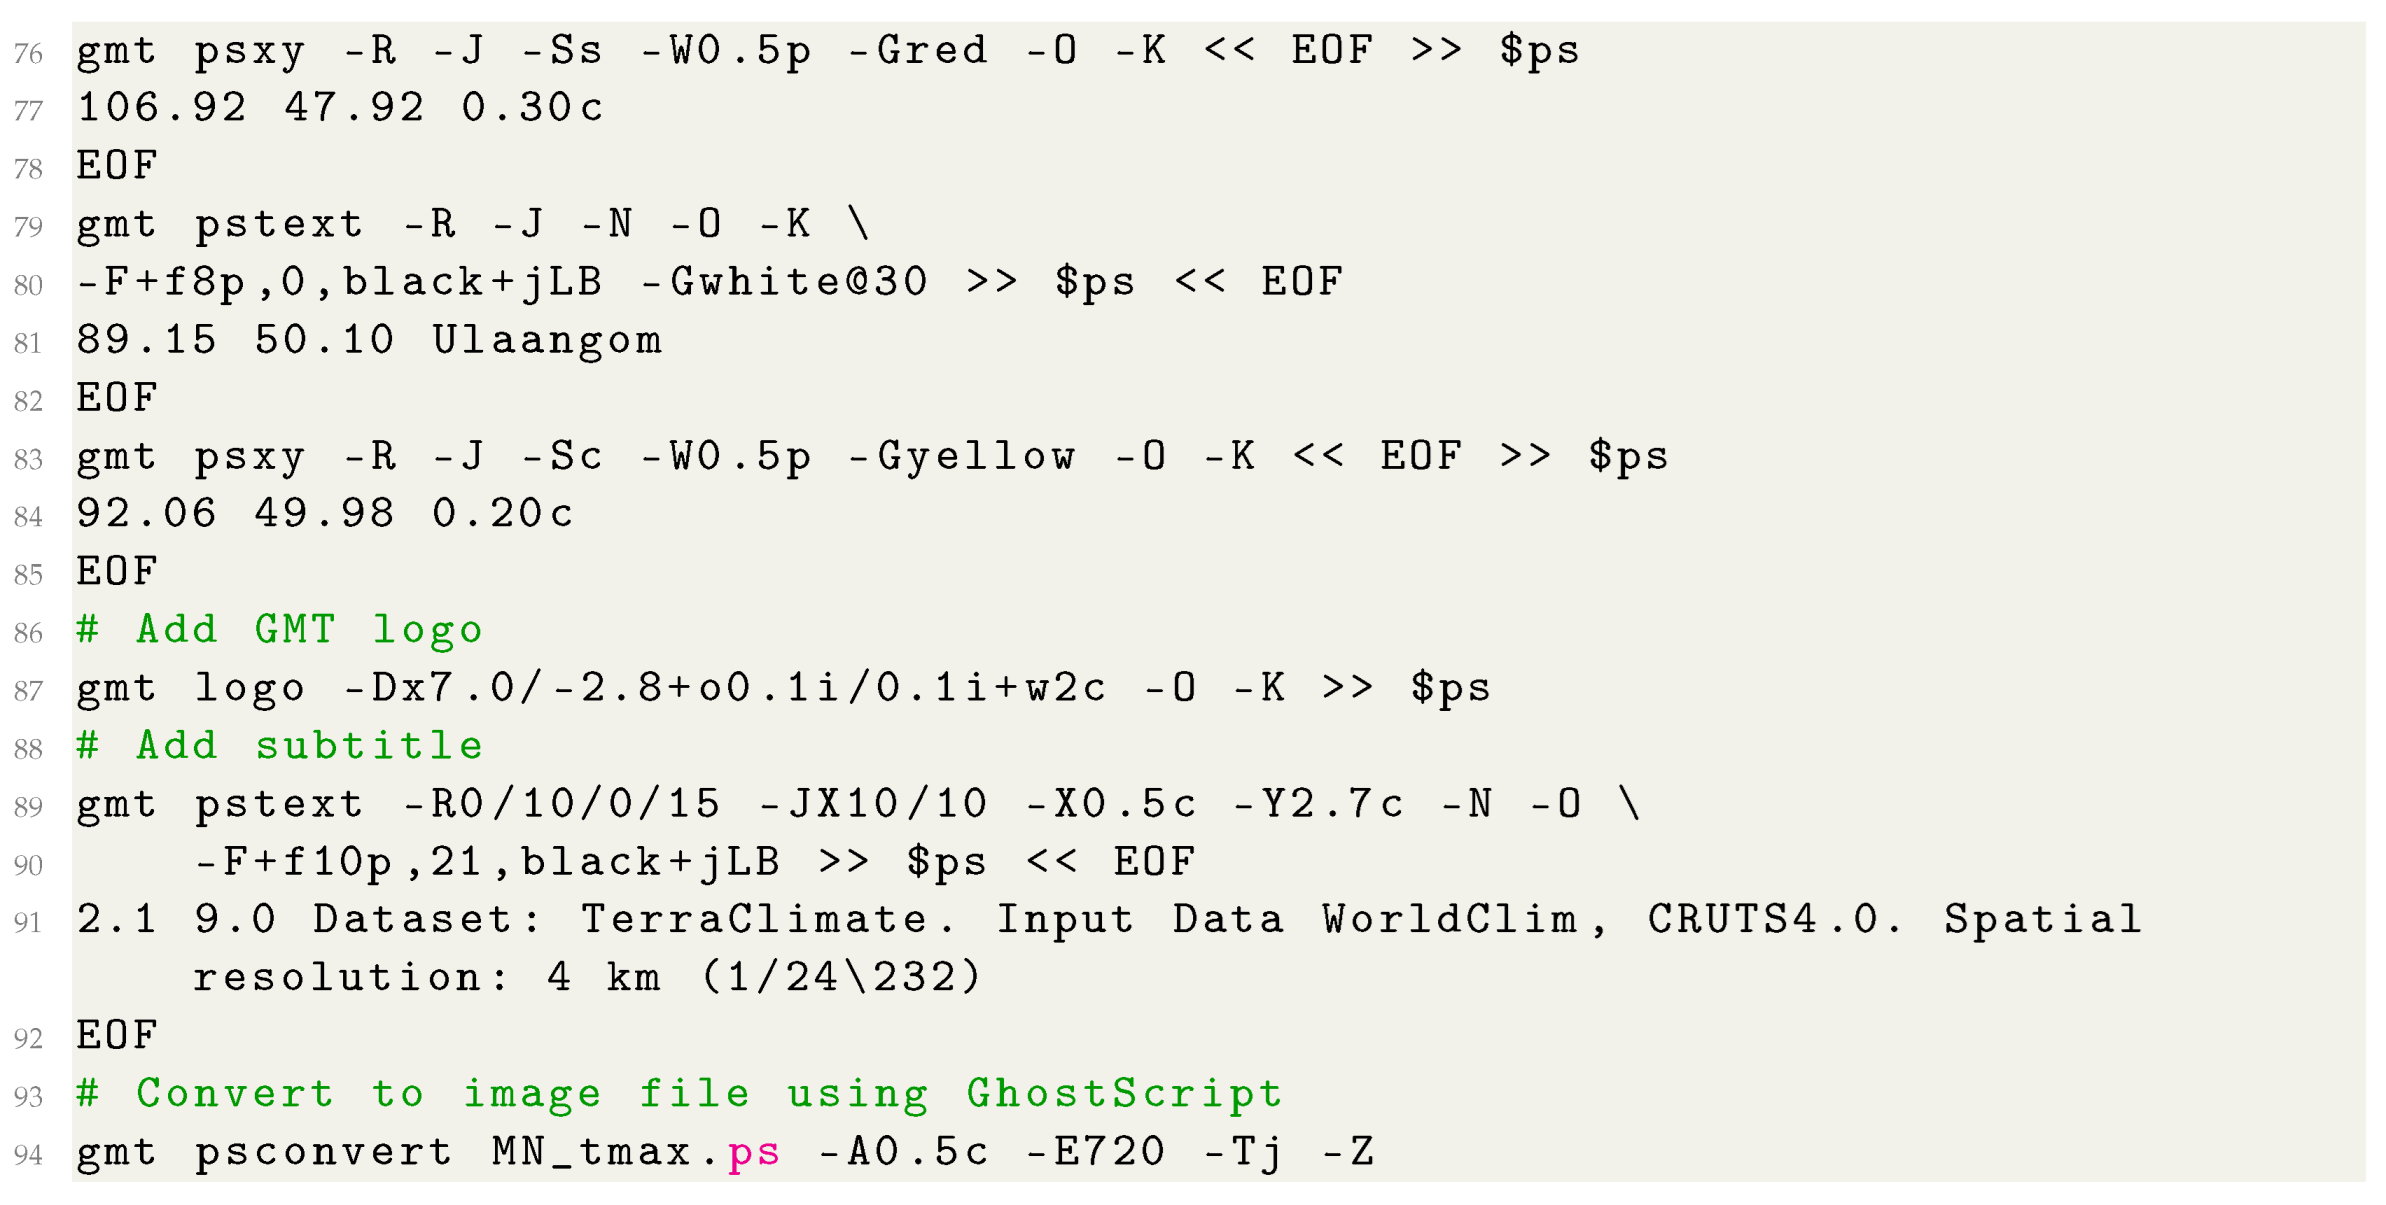
The texts were added by the ‘pstext’ module using the following GMT expression: ‘gmt pstext -R -J -N -O -K -F+jTL+f9p,26,blue2+jLB -Gwhite@60 ≫ $ps ≬ EOF 92.3 50.1 Uvs Nuur EOF’, where the actually printed expression is defined between the coordinates in decimal system and the returned ‘EOF’ signal. The visualisation was made using the ‘makecpt’ module: ‘gmt makecpt -Cjet -T-43/-16/0.5 > pauline.cpt’ and set up for ‘jet’ color table for the both figures (Figure 2 and Figure 3) for comparability. Here the ‘-43/-16/0.5’ flag provides the range of data and the step of the interval in color visualisation.
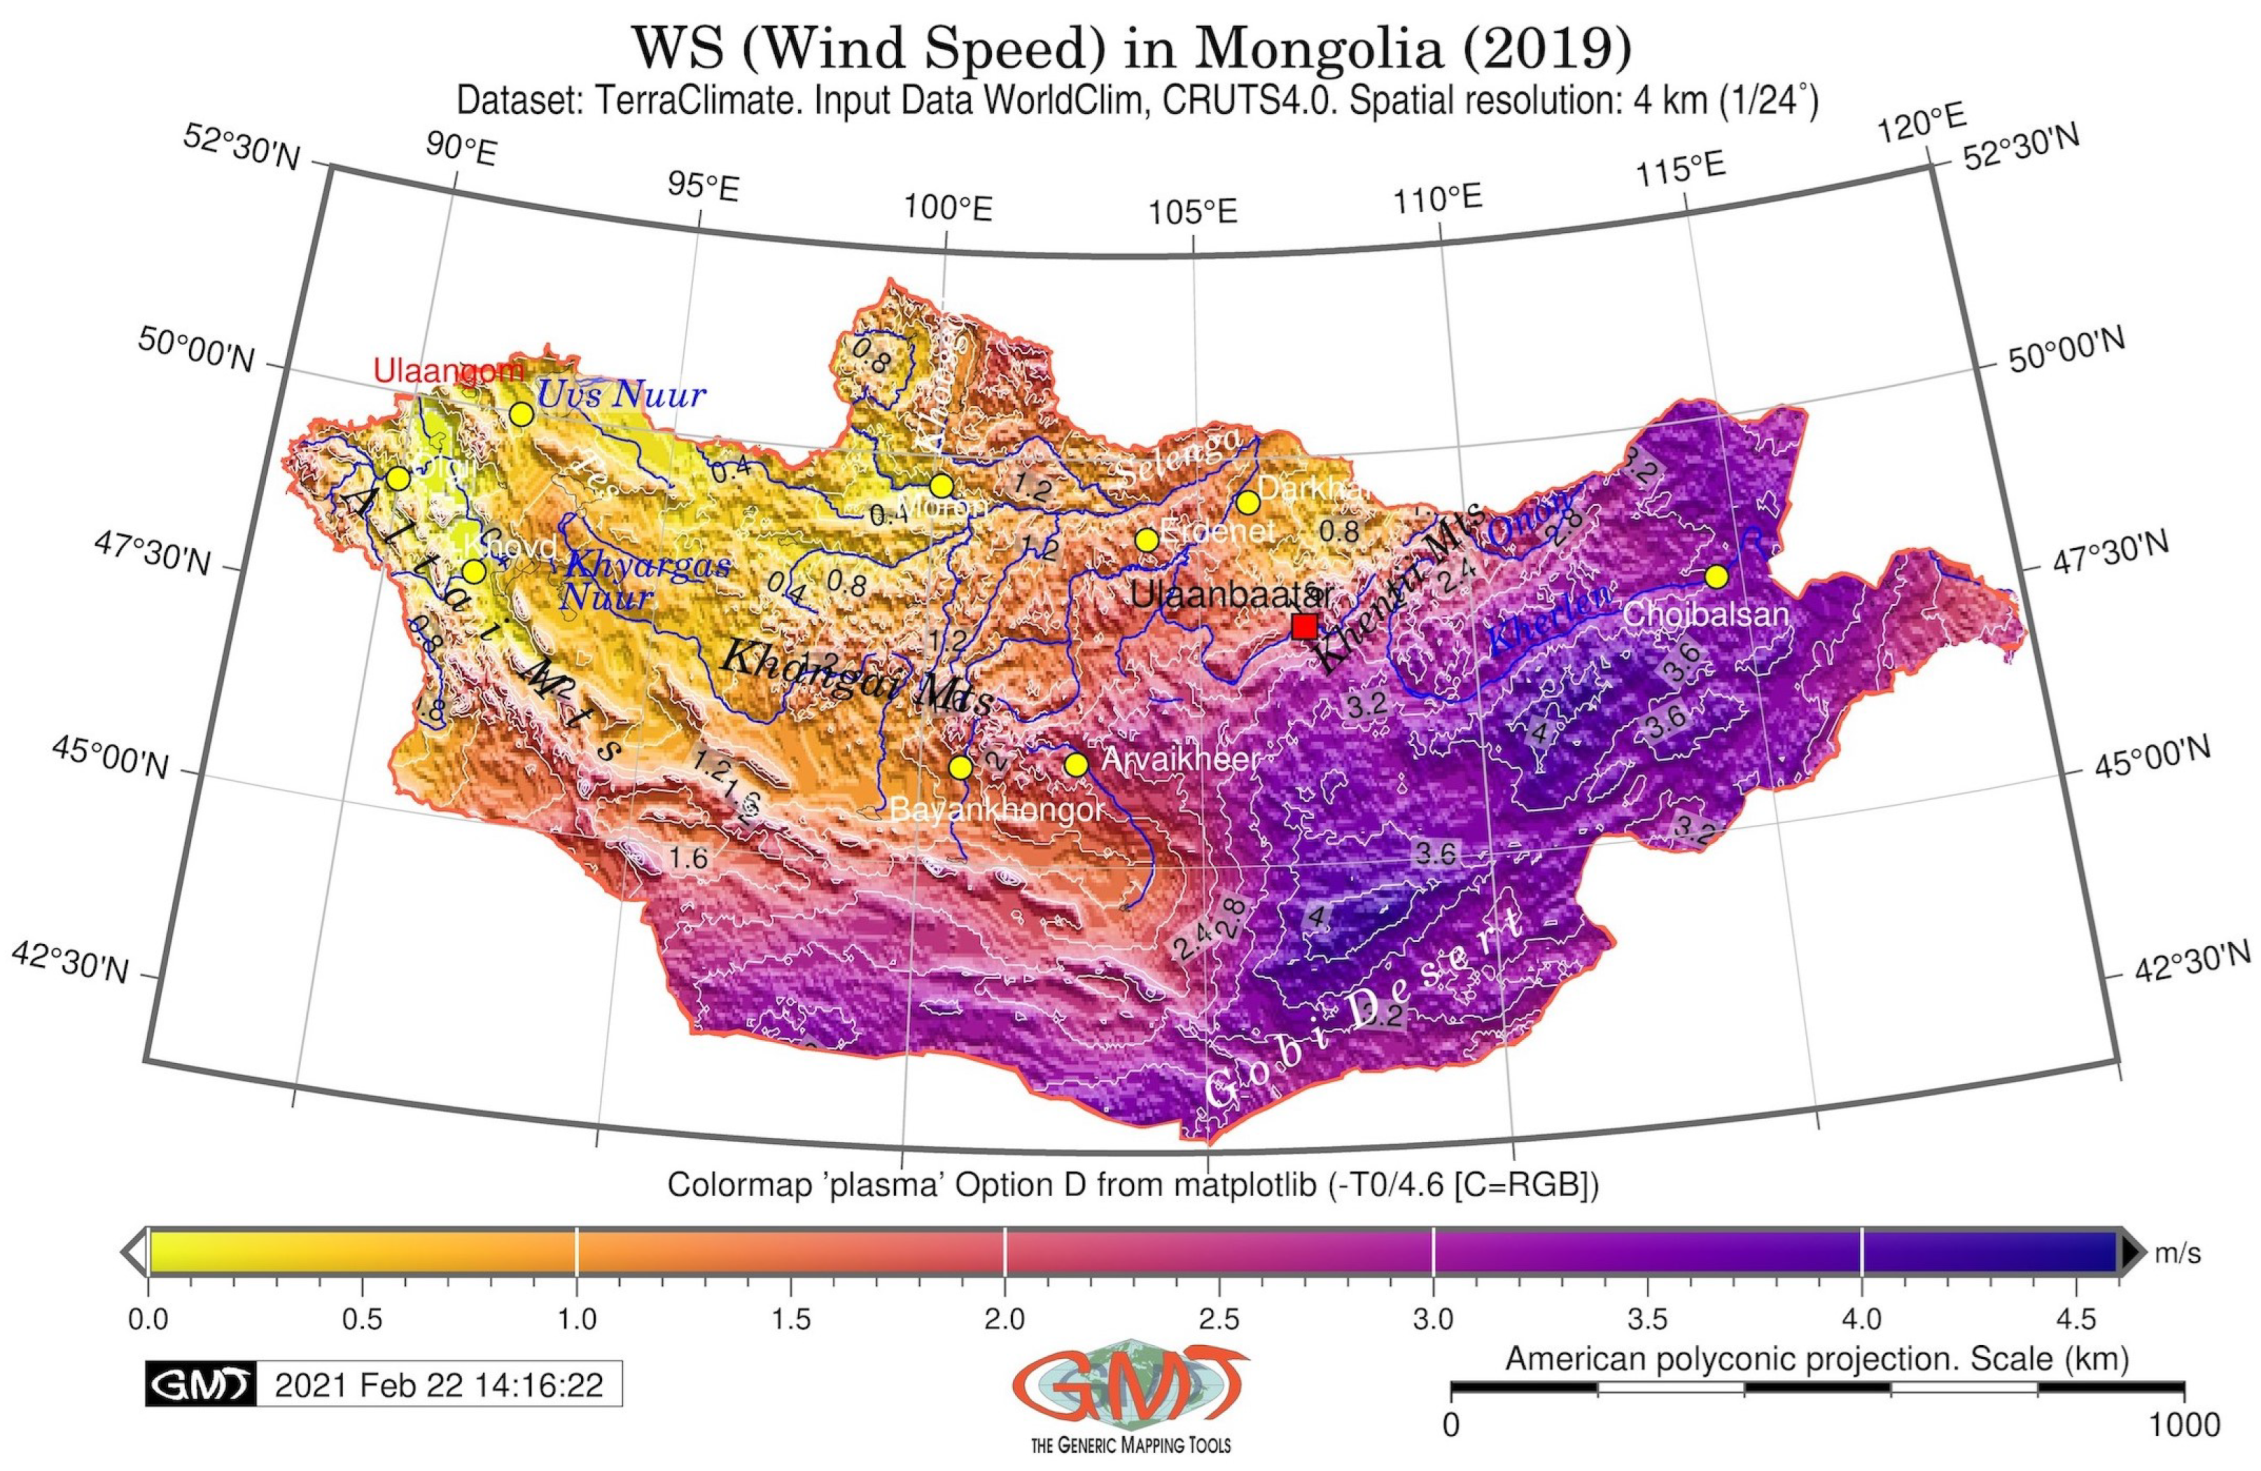
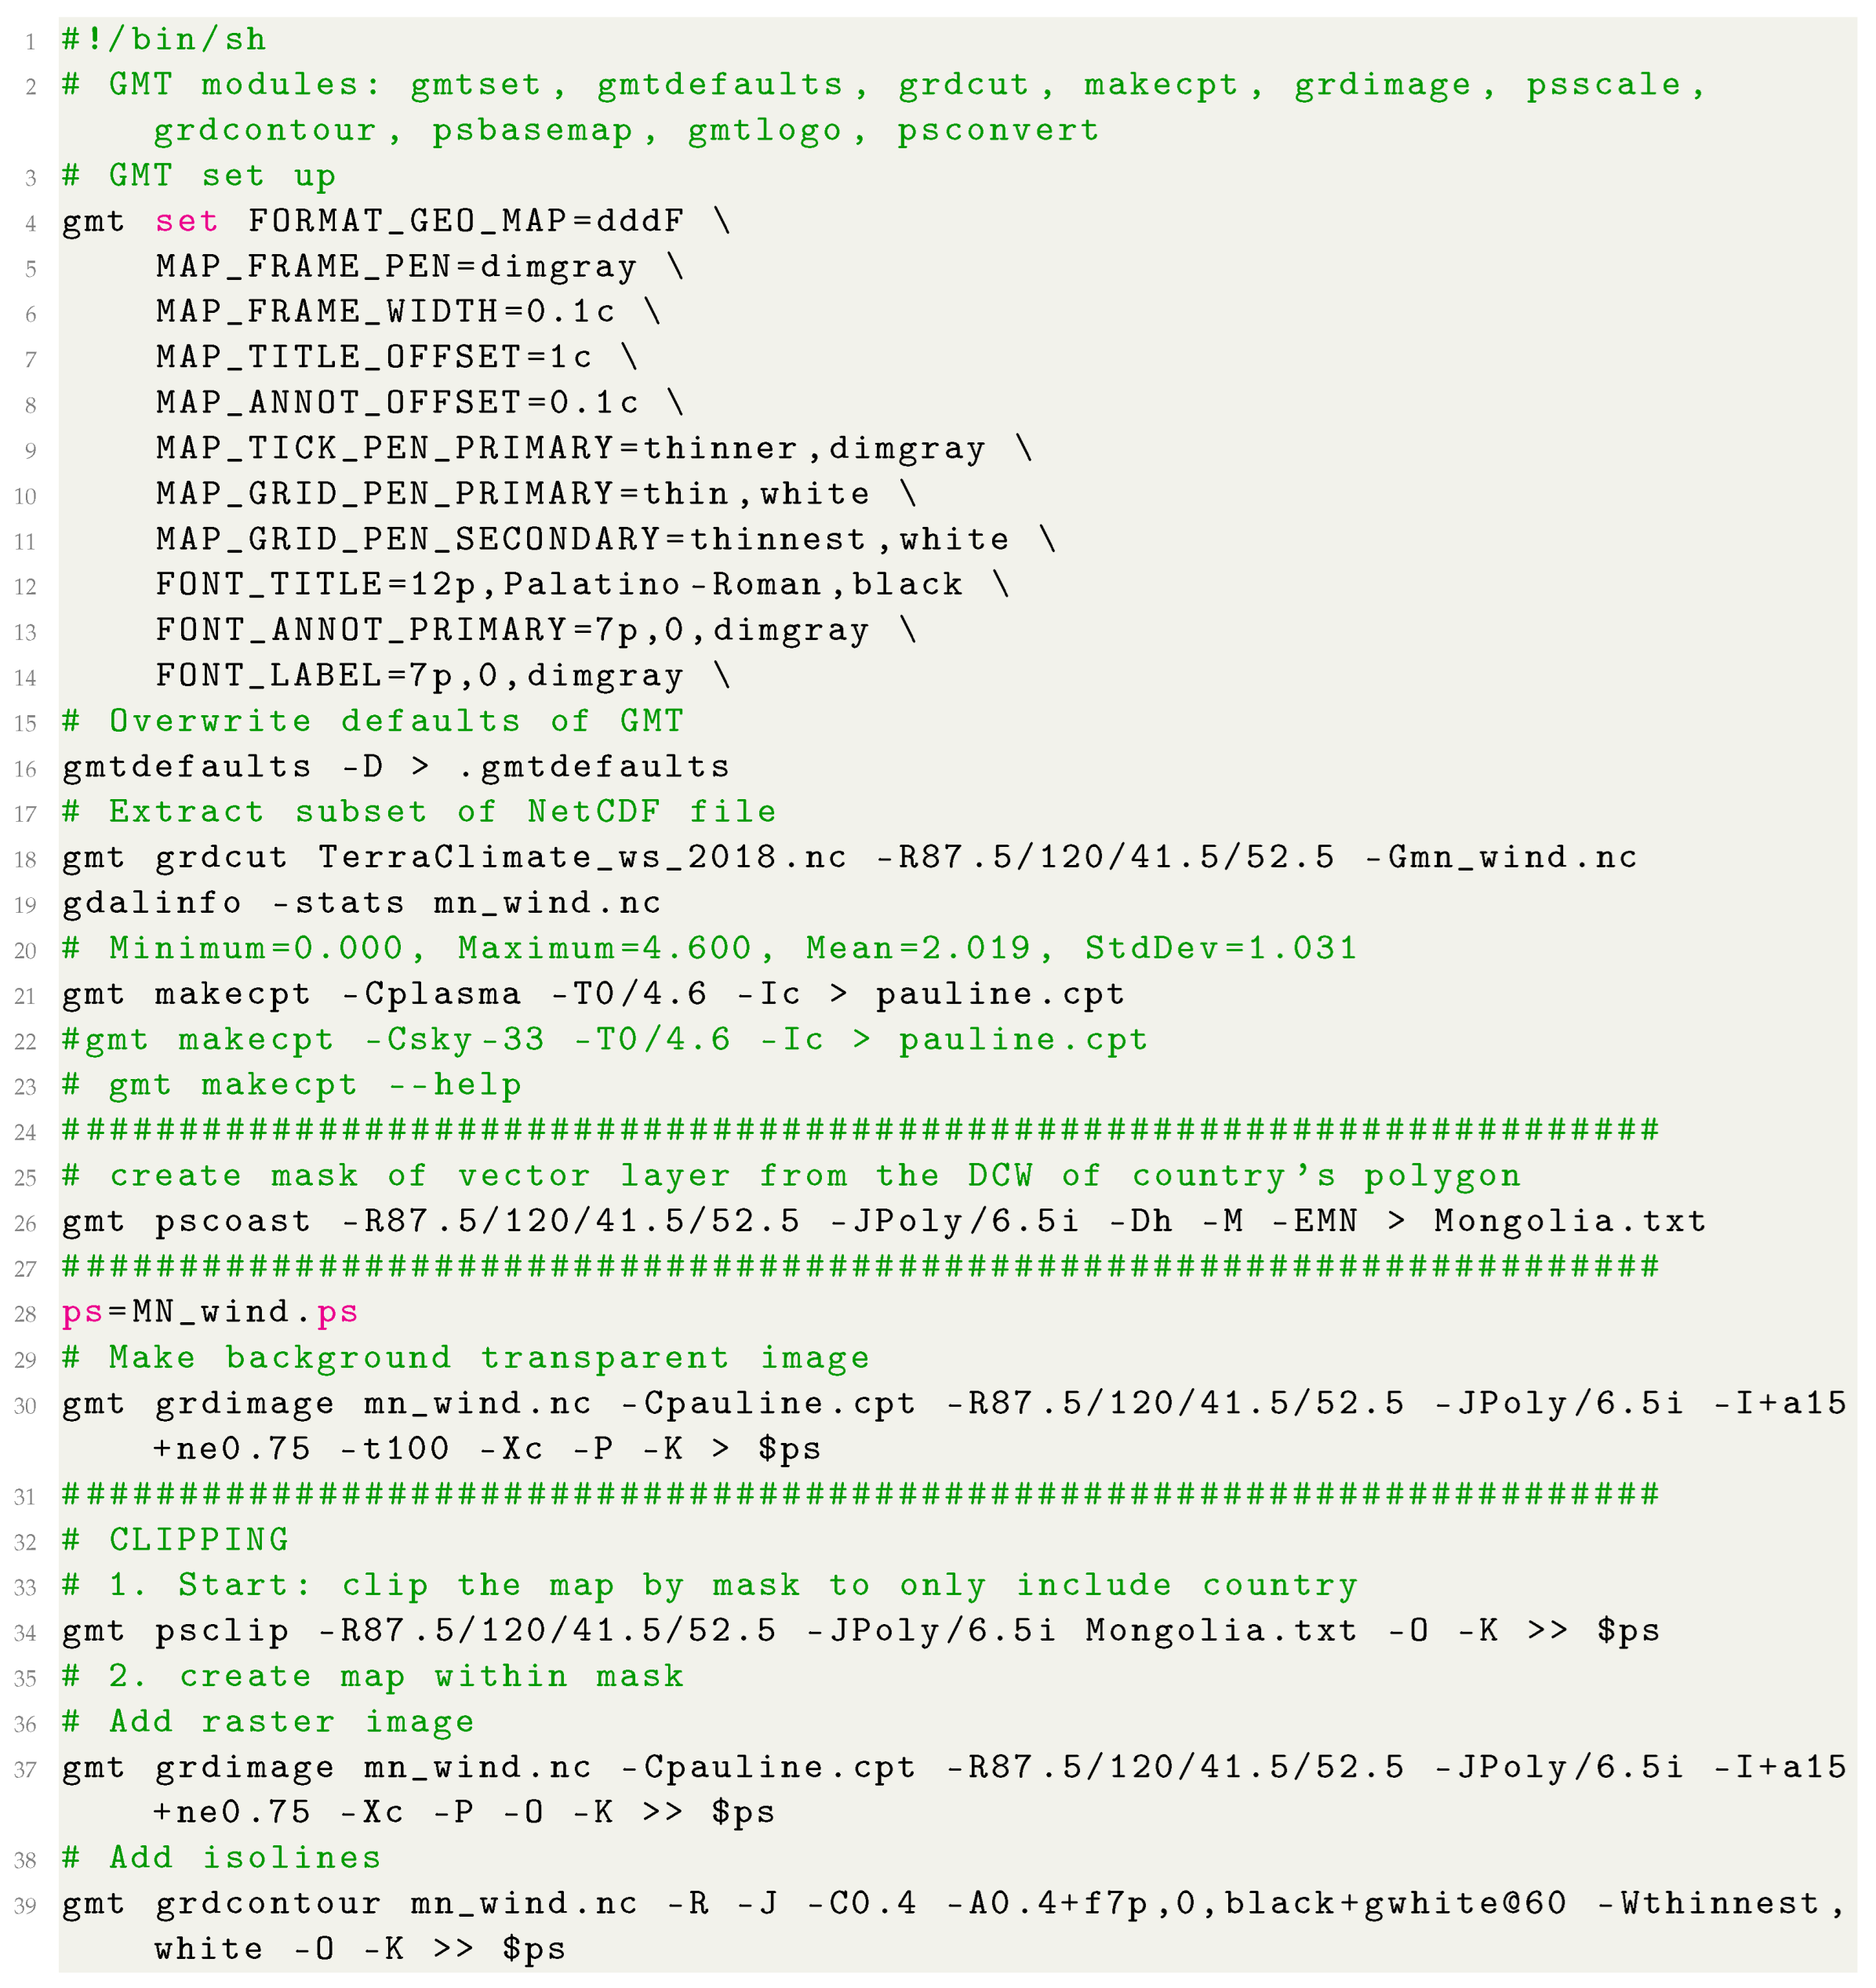
Figure 4 showing the wind speed in m/s was plotted using the wind speed data from the TerraClimate: ‘gmt grdcut TerraClimate_ws_2018.nc -R87.5/120/41.5/52.5 -Gmn_wind.nc’. The surrounding area was set transparent using the ‘-t100’ flag to focus on the study area. The cartographic ticks have been visualised using flag ‘-Bpxg10f5a5 -Bpyg10f2.5a2.5 -Bsxg5 -Bsyg5’, which signifies that major latitude and longitude lines are plotted every 10°, text label annotations are plotted every 2.5° and minor ticks are plotted every 5°, respectively.
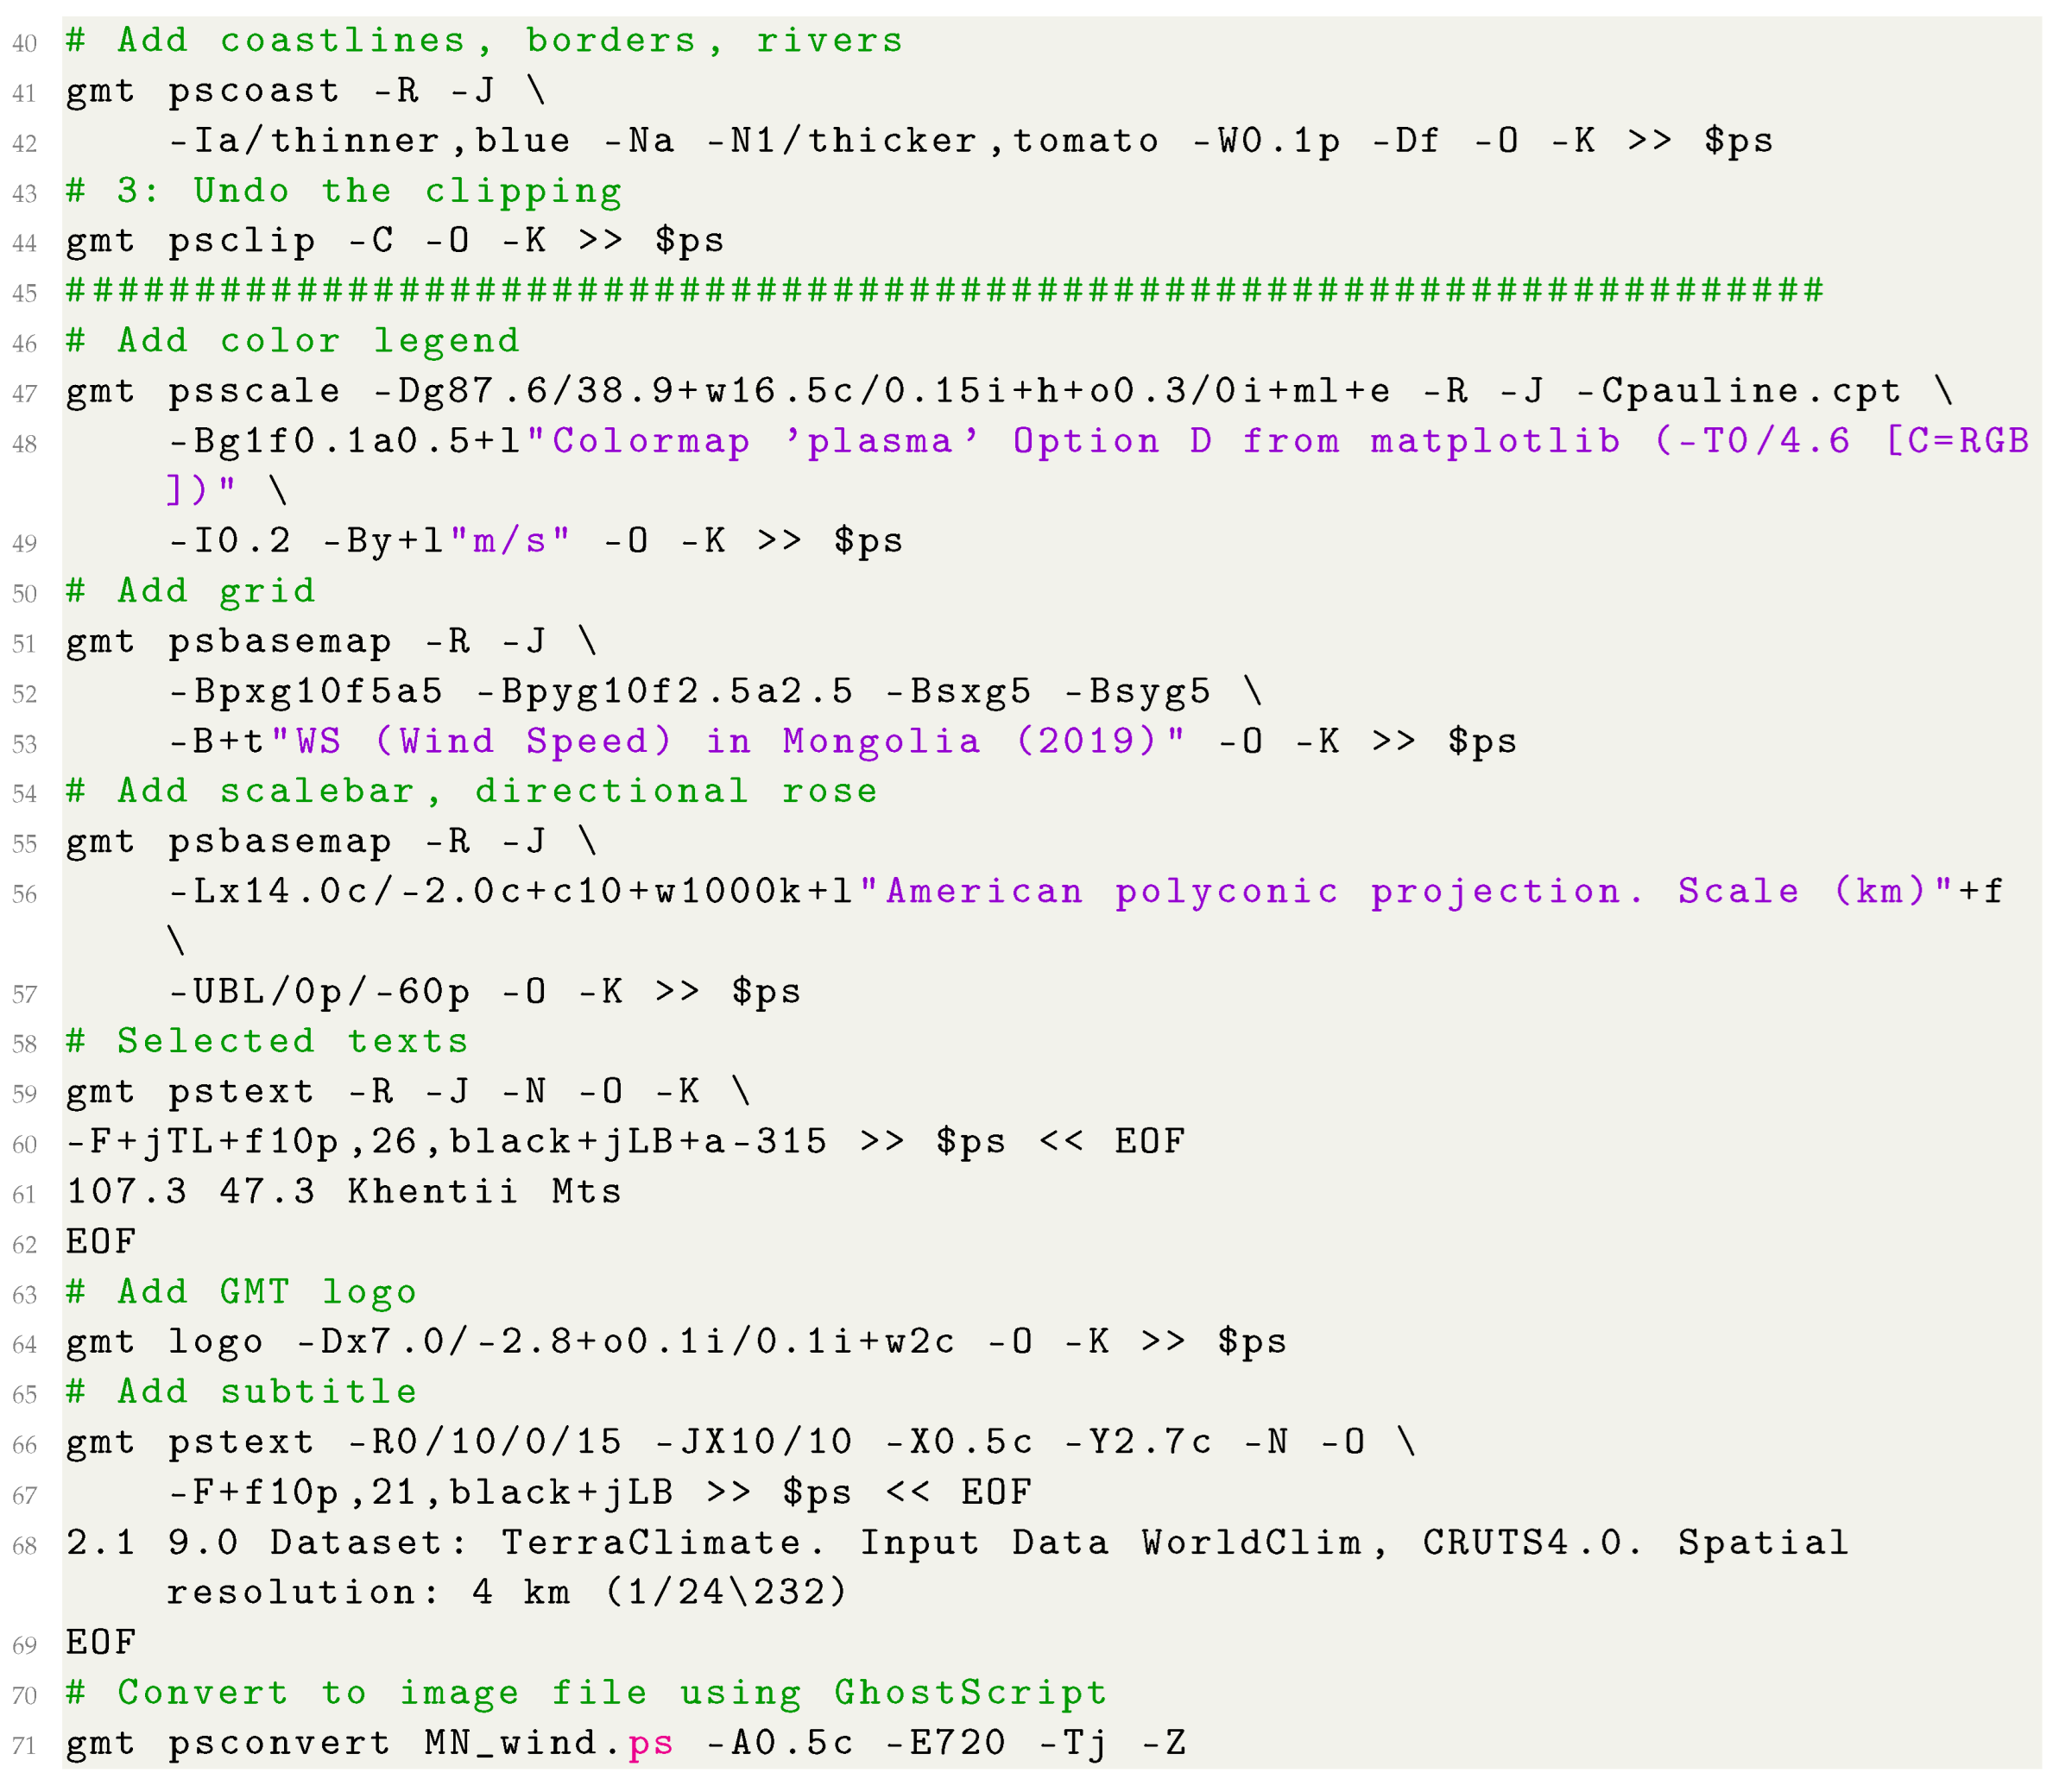
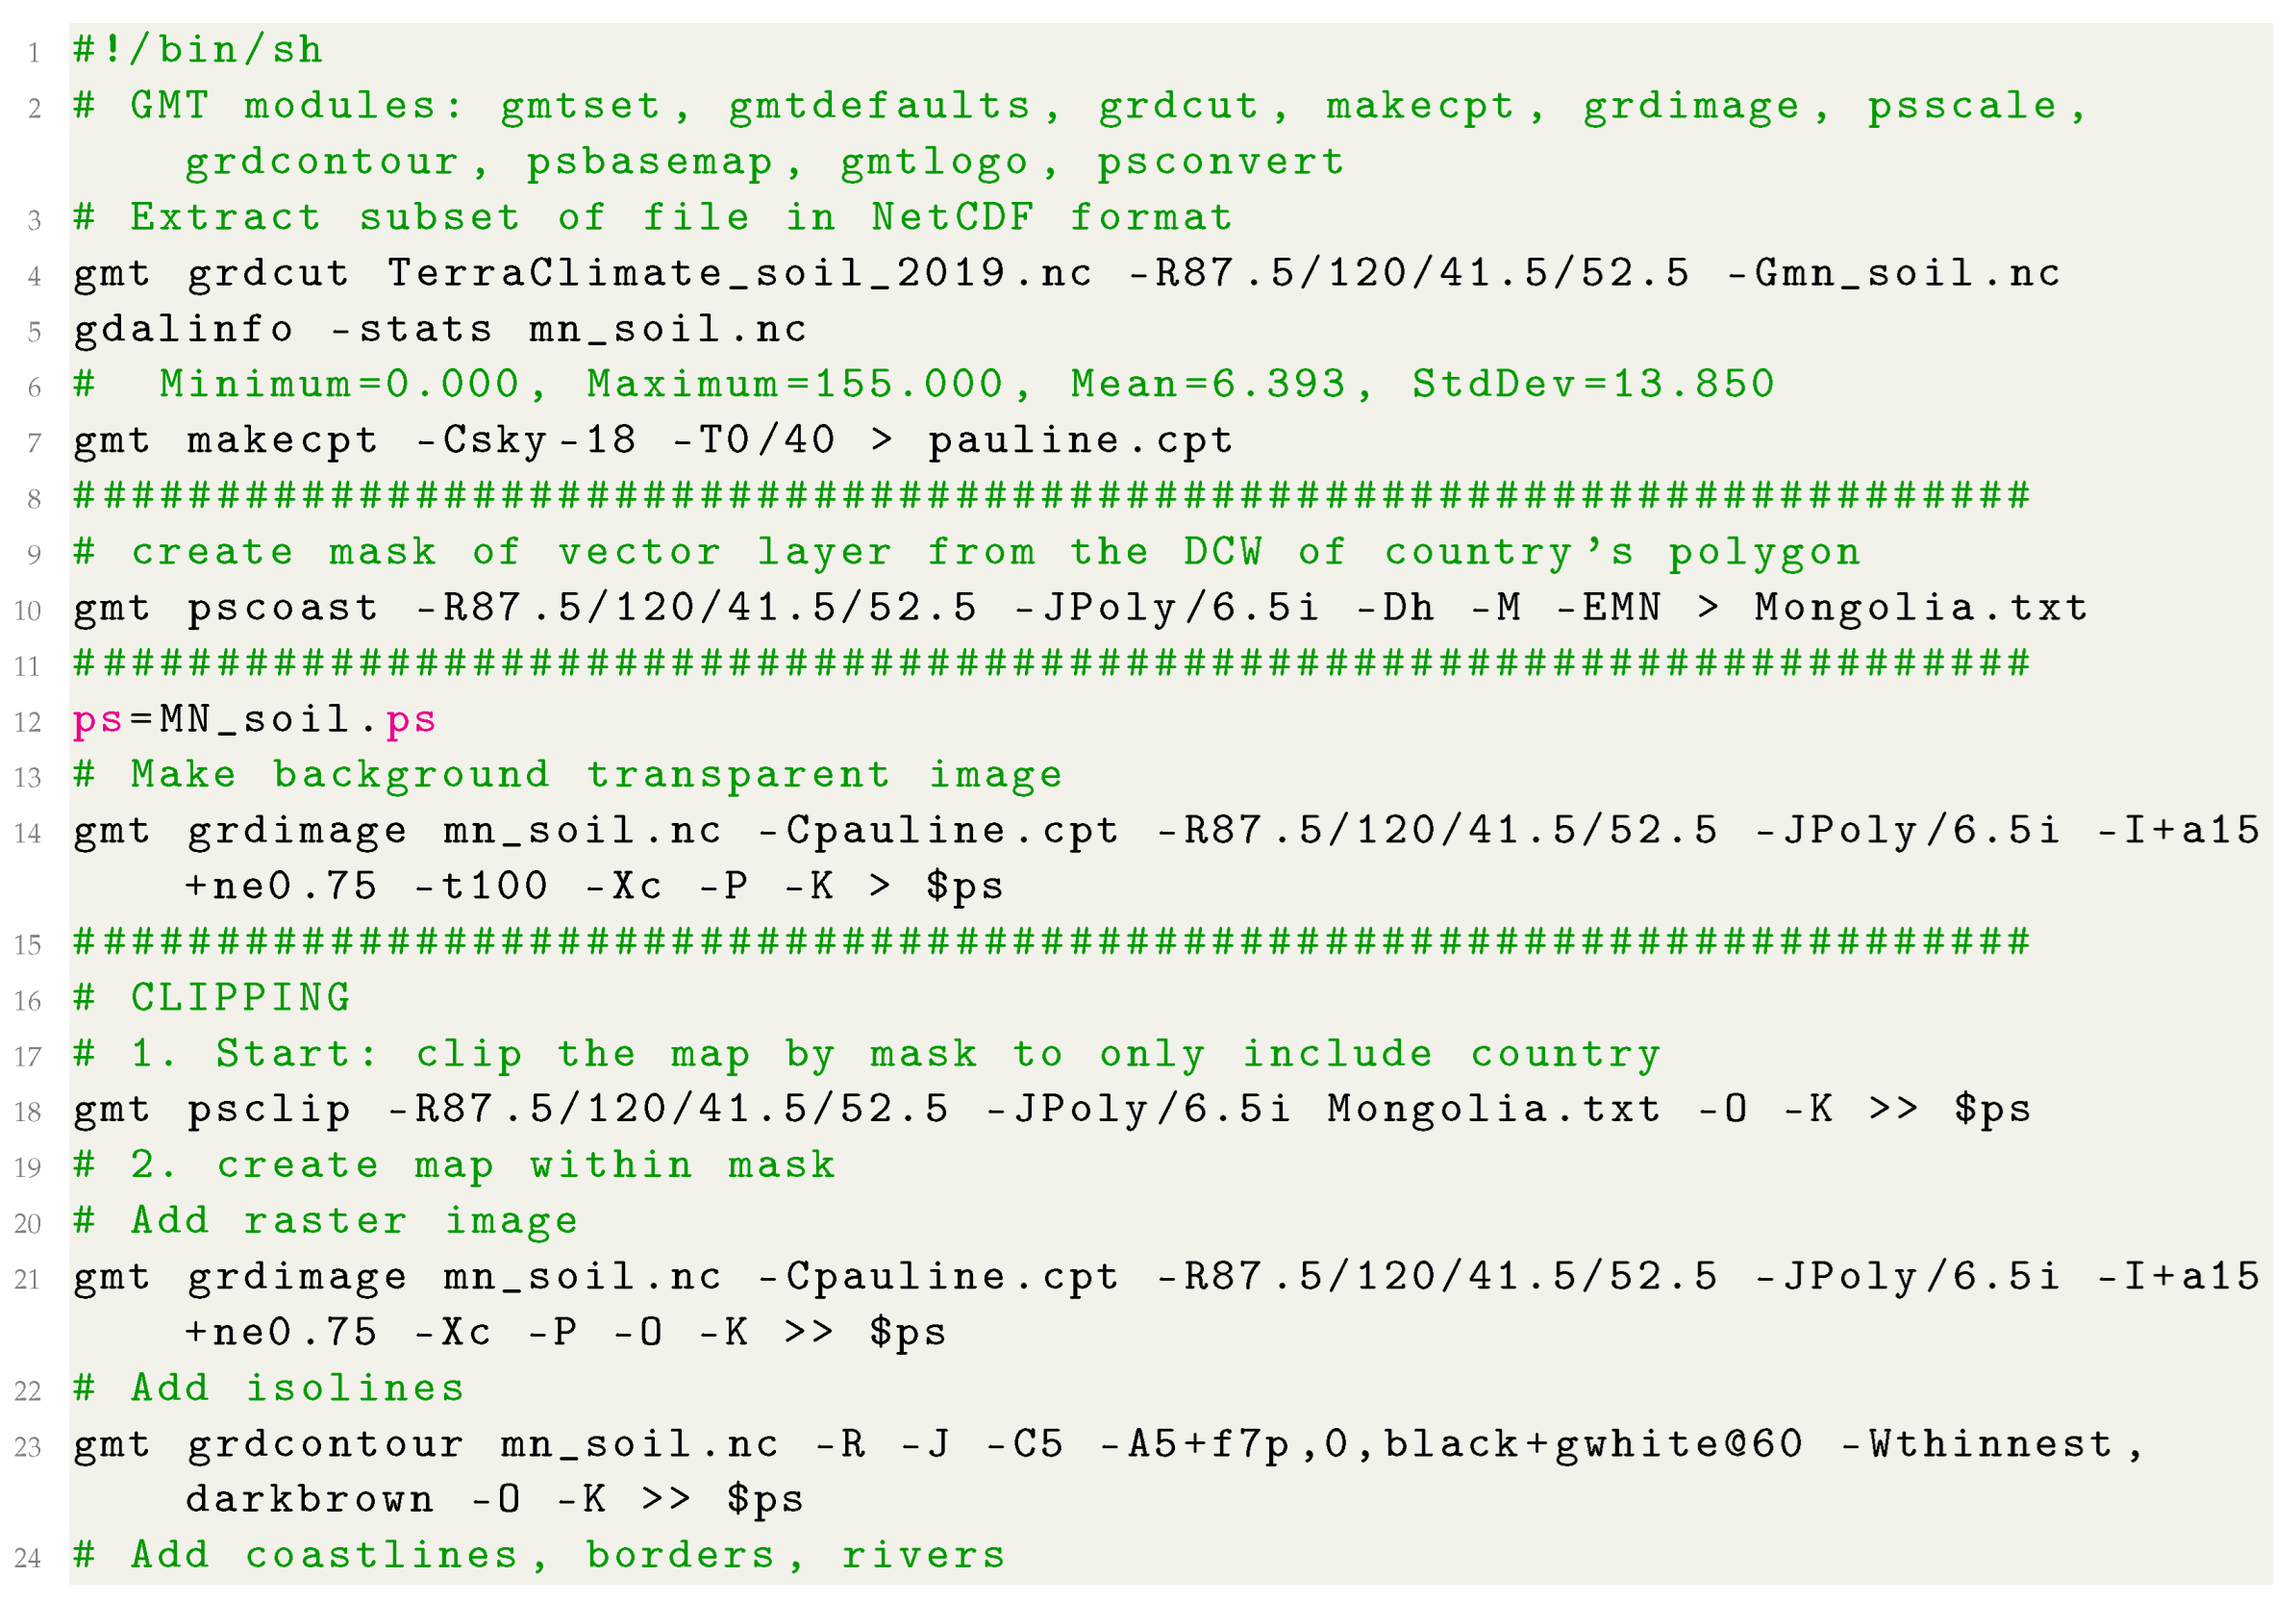
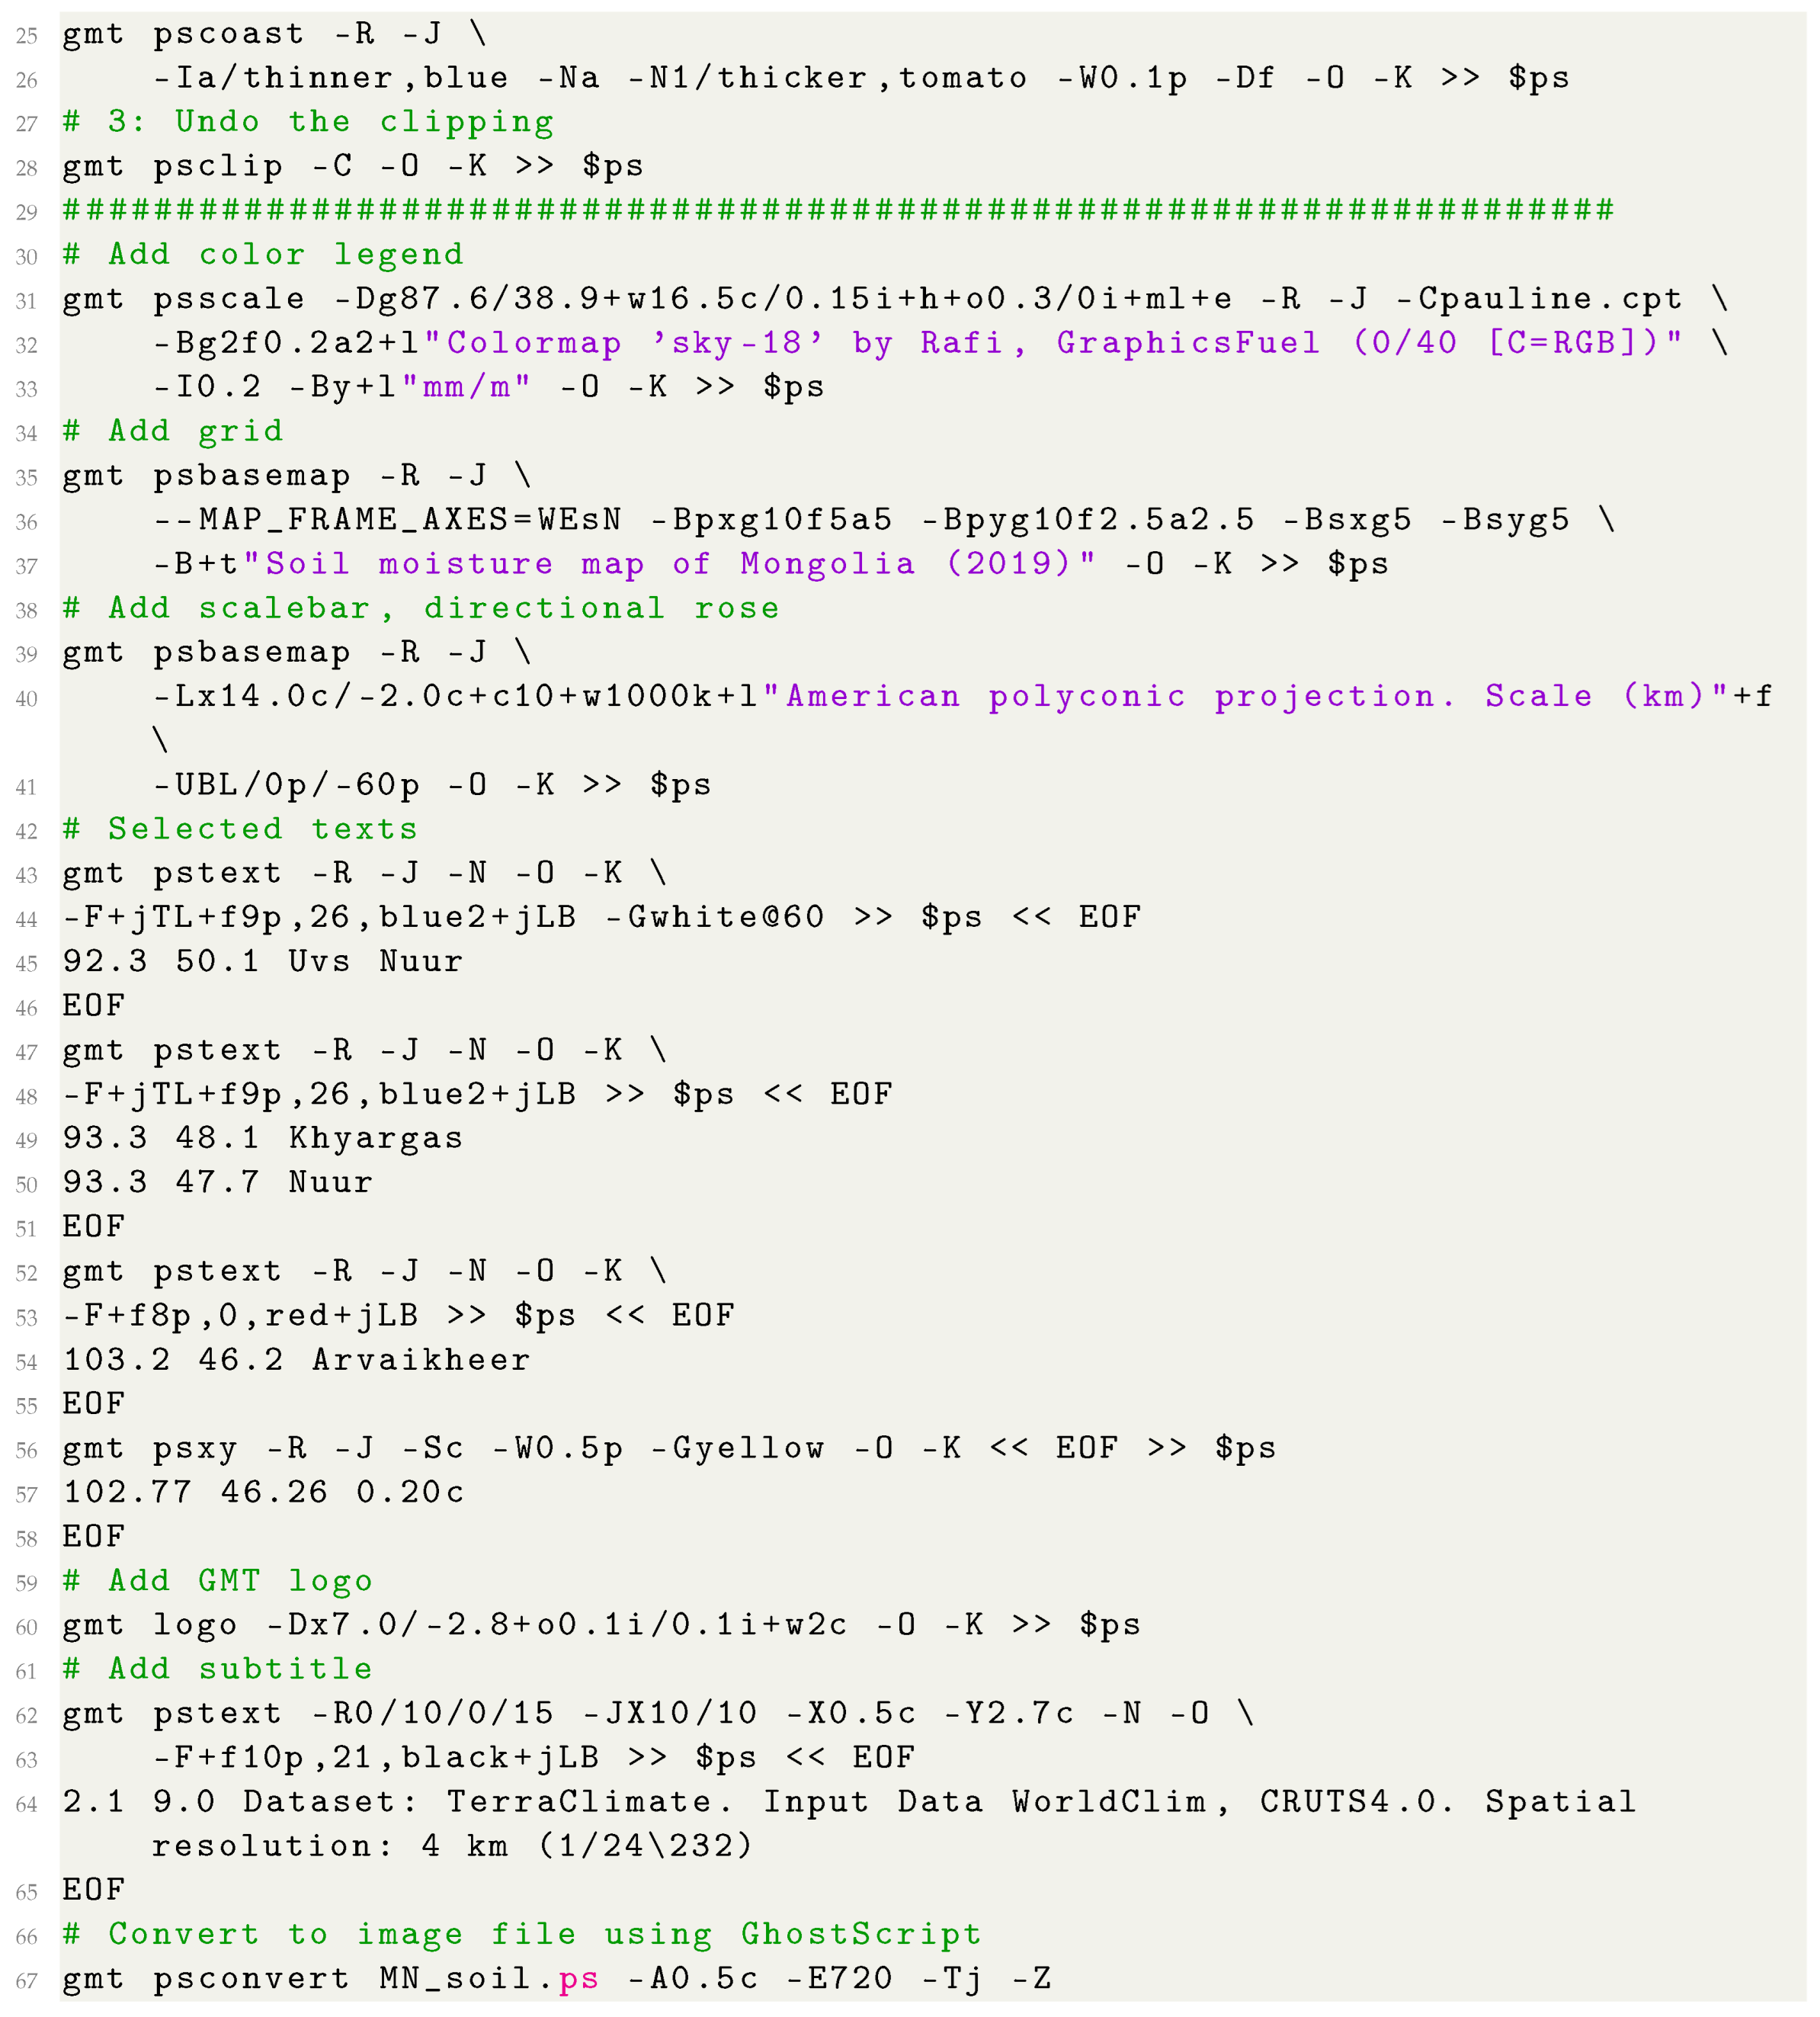
The soil moisture map in Figure 5 has been visualised using the colormap ‘sky-18’ developed by Rafi at GraphicsFuel with the data extent 0/40. The conversion of the PostScript file to the JPG image file was made using the GhostScript as follows: ‘gmt psconvert MN_soil.ps -A0.5c -E720 -Tj -Z’. Here the ‘-E’ flag shows the output resolution of the file (here: 720 dpi) and the ‘-A’ flag gives the image margins (here: 0.5 cm) and ‘-T’ stands for the file format definition (here: JPG).
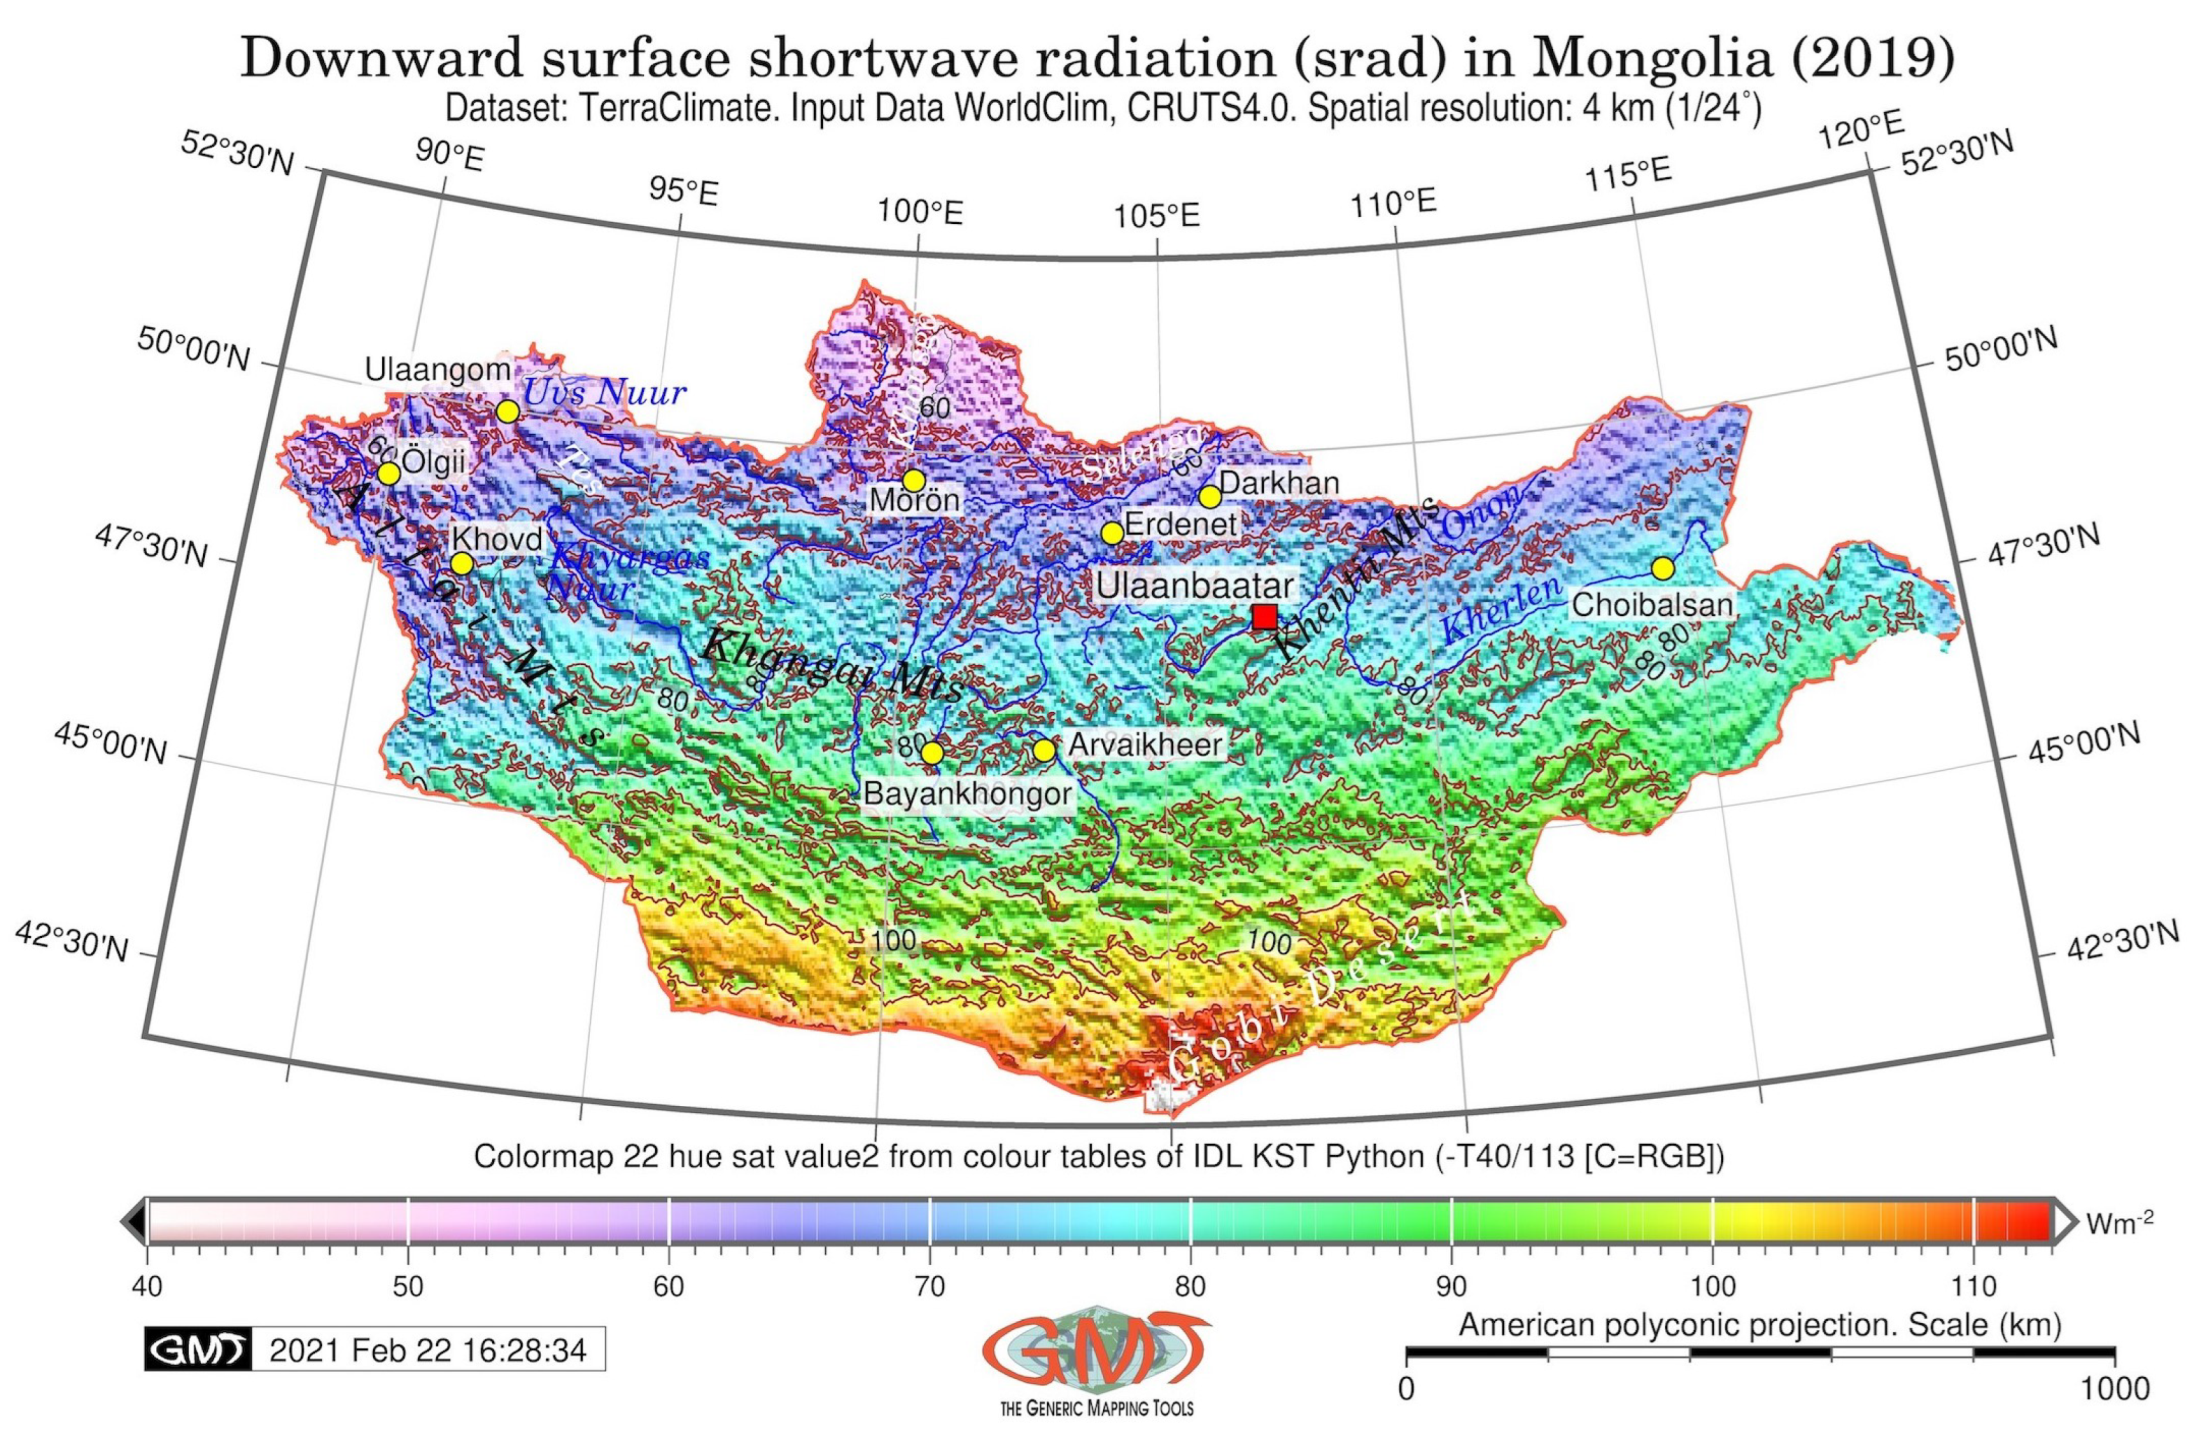
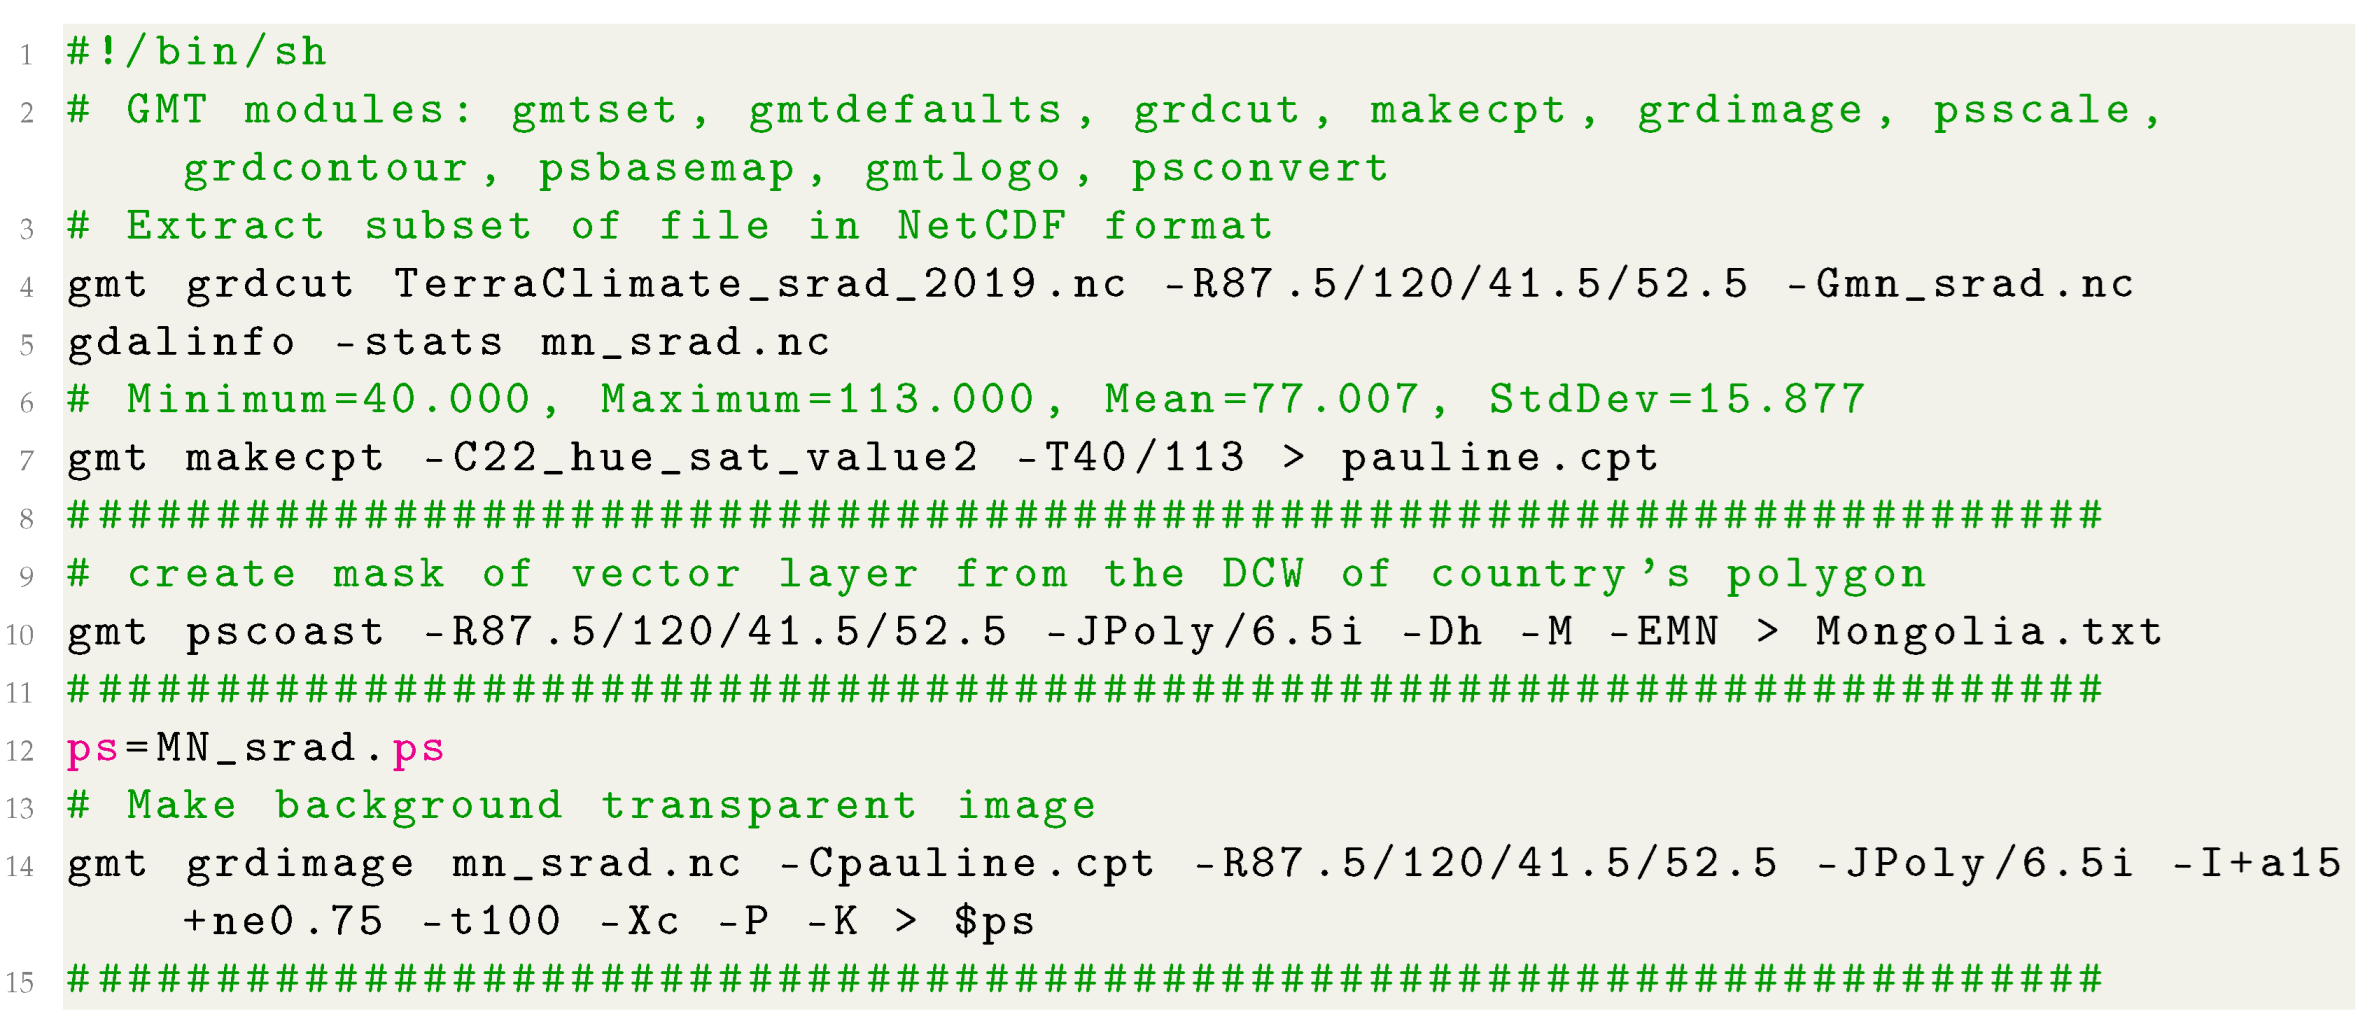
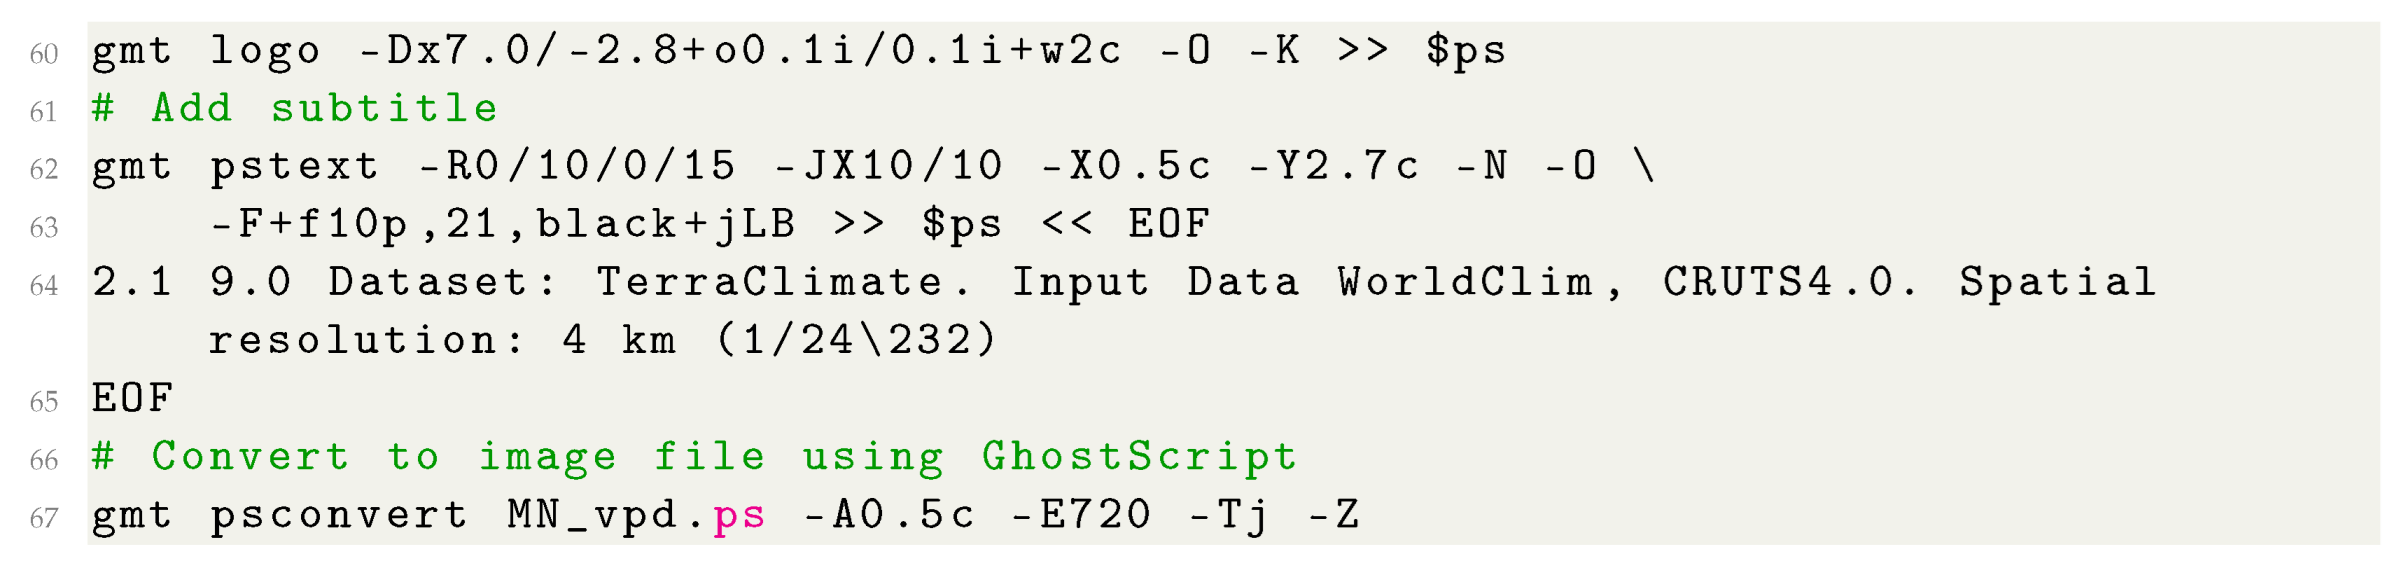
Similarly, the downward surface shortwave radiation (DSR) was visualised for the year 2019 in Mongolia, as shown in Figure 6. The DSR was mapped using the specific data of the TerraClimate estimated of the total amount of shortwave radiation (both direct and diffuse) that reaches the Earth’s surface (average values was 77 Wm) for Mongolia. The model was visualised using colourmap ‘22 hue sat value2’ adopted from the colour tables of IDL KST by Python with the data range from to 113 . The information regarding the coordinate projection was added by the following code: ‘-Lx14.0c/-2.0c+c10+w1000k+l“American polyconic projection. Scale (km)”+f’. The methods of estimation of the original DSR grids use the remote sensing approach which is based on evaluating the signals received from spectral channels in visible and Near Infra-Red (NIR), plus the data on the albedo and atmospheric composition used for calculation of the DSR at the terrain surface.
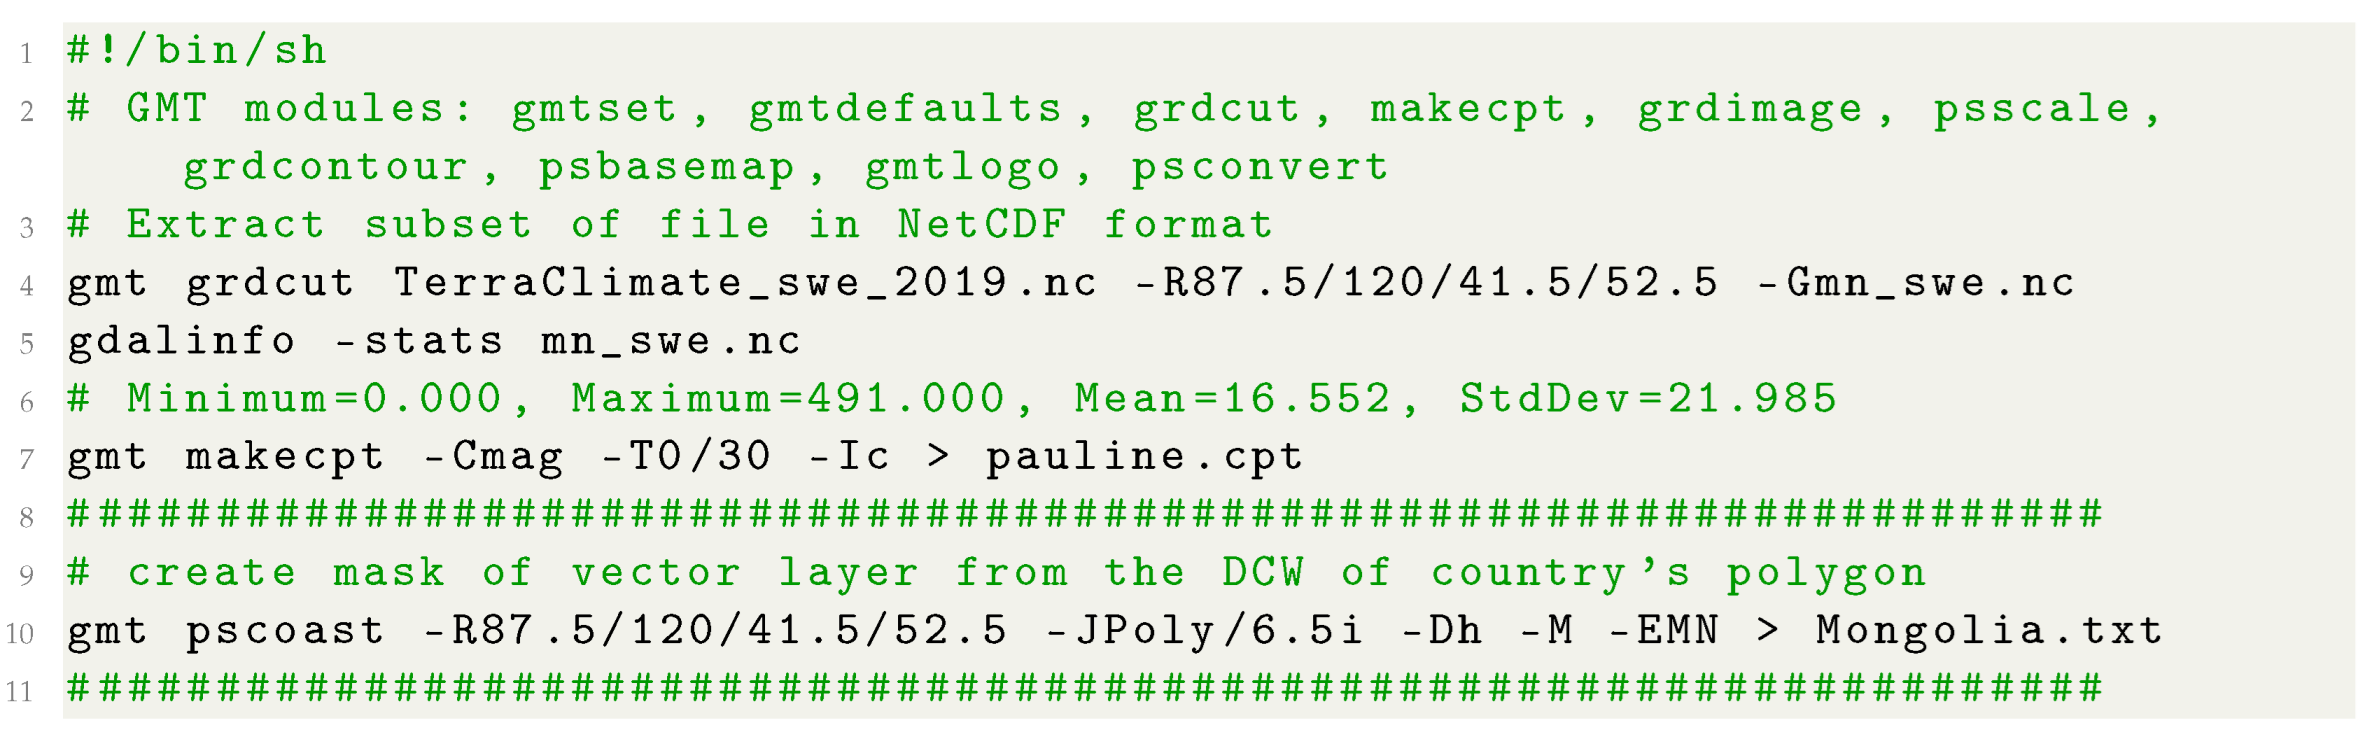
The Snow Water Equivalent (SWE) at end of April month in Mongolia in 2019 (Figure 7) was determined by visualising the grid using the ‘grdimage’ module as follows: ‘gmt grdimage mn_swe.nc -Cpauline.cpt -R87.5/120/41.5/52.5 -JPoly/6.5i -I+a15+ne0.75 -Xc -P -O -K ≫ $ps’ as described in existing papers [104], and adding isolines by the ‘grdcontour’ module: ‘gmt grdcontour mn_swe.nc -R -J -C50 -A50+f7p,0,black+gwhite@60 -Wthinnest,darkbrown -O -K ≫ $ps’. Furthermore, the data range was also determined by the GDAL utility ‘gdalinfo’: ‘gdalinfo -stats mn_swe.nc’, which showed the thresholds in data used for adjusting the Colour Palette Table (cpt) based on the identified data extremities (here: up to 491). Methodologically, the SWE depicts the estimated snowpack measurement showing the amount of water contained within the snowpack over the country.
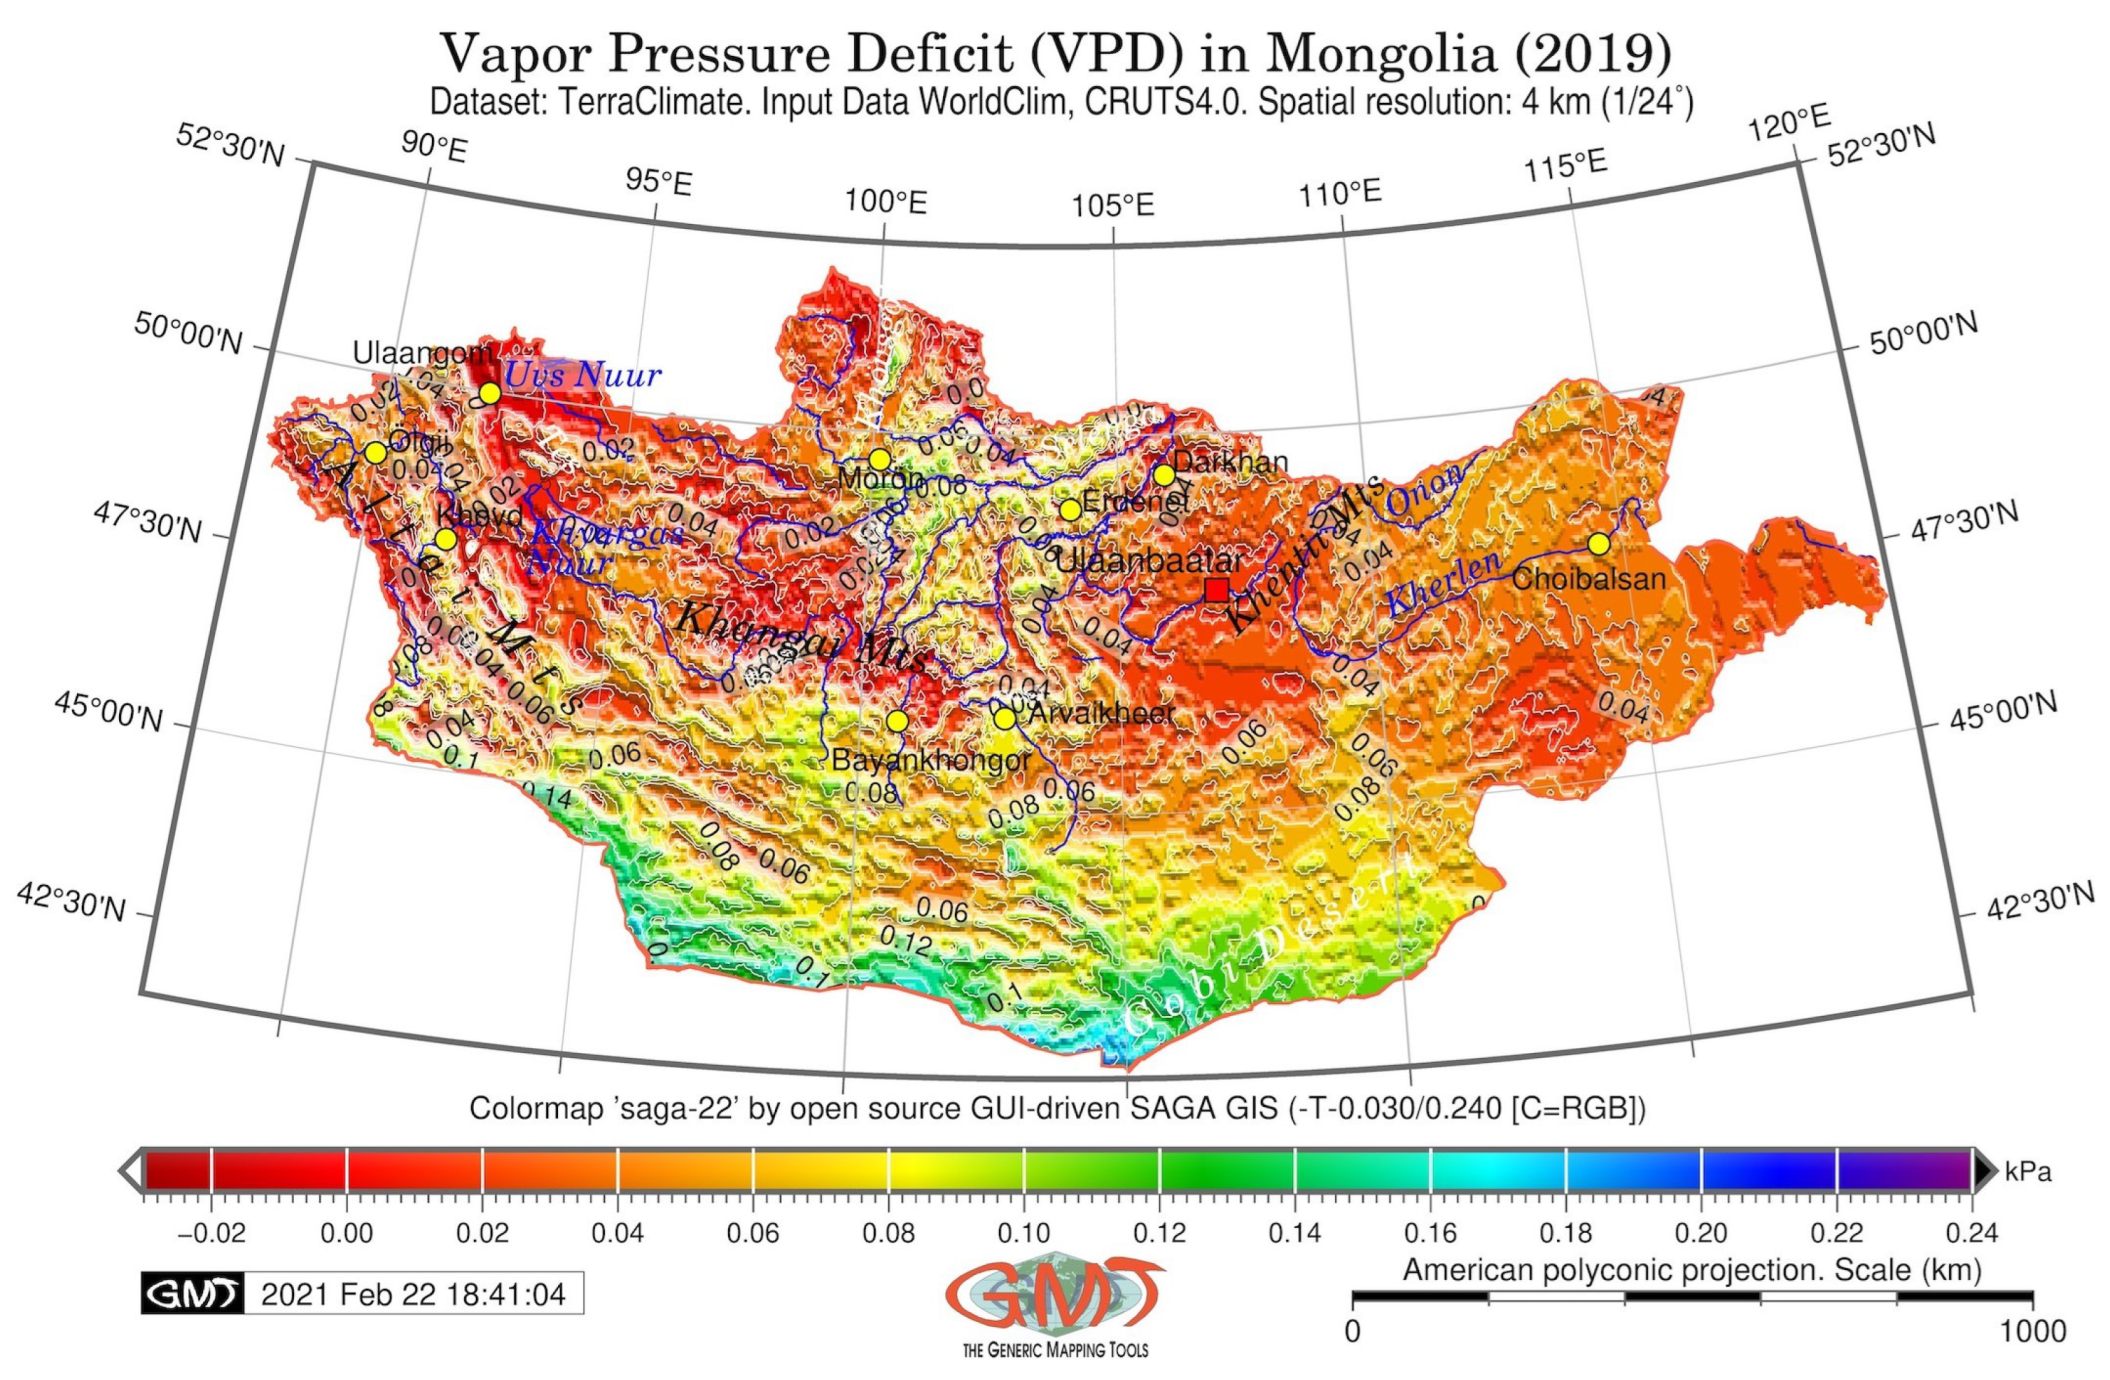
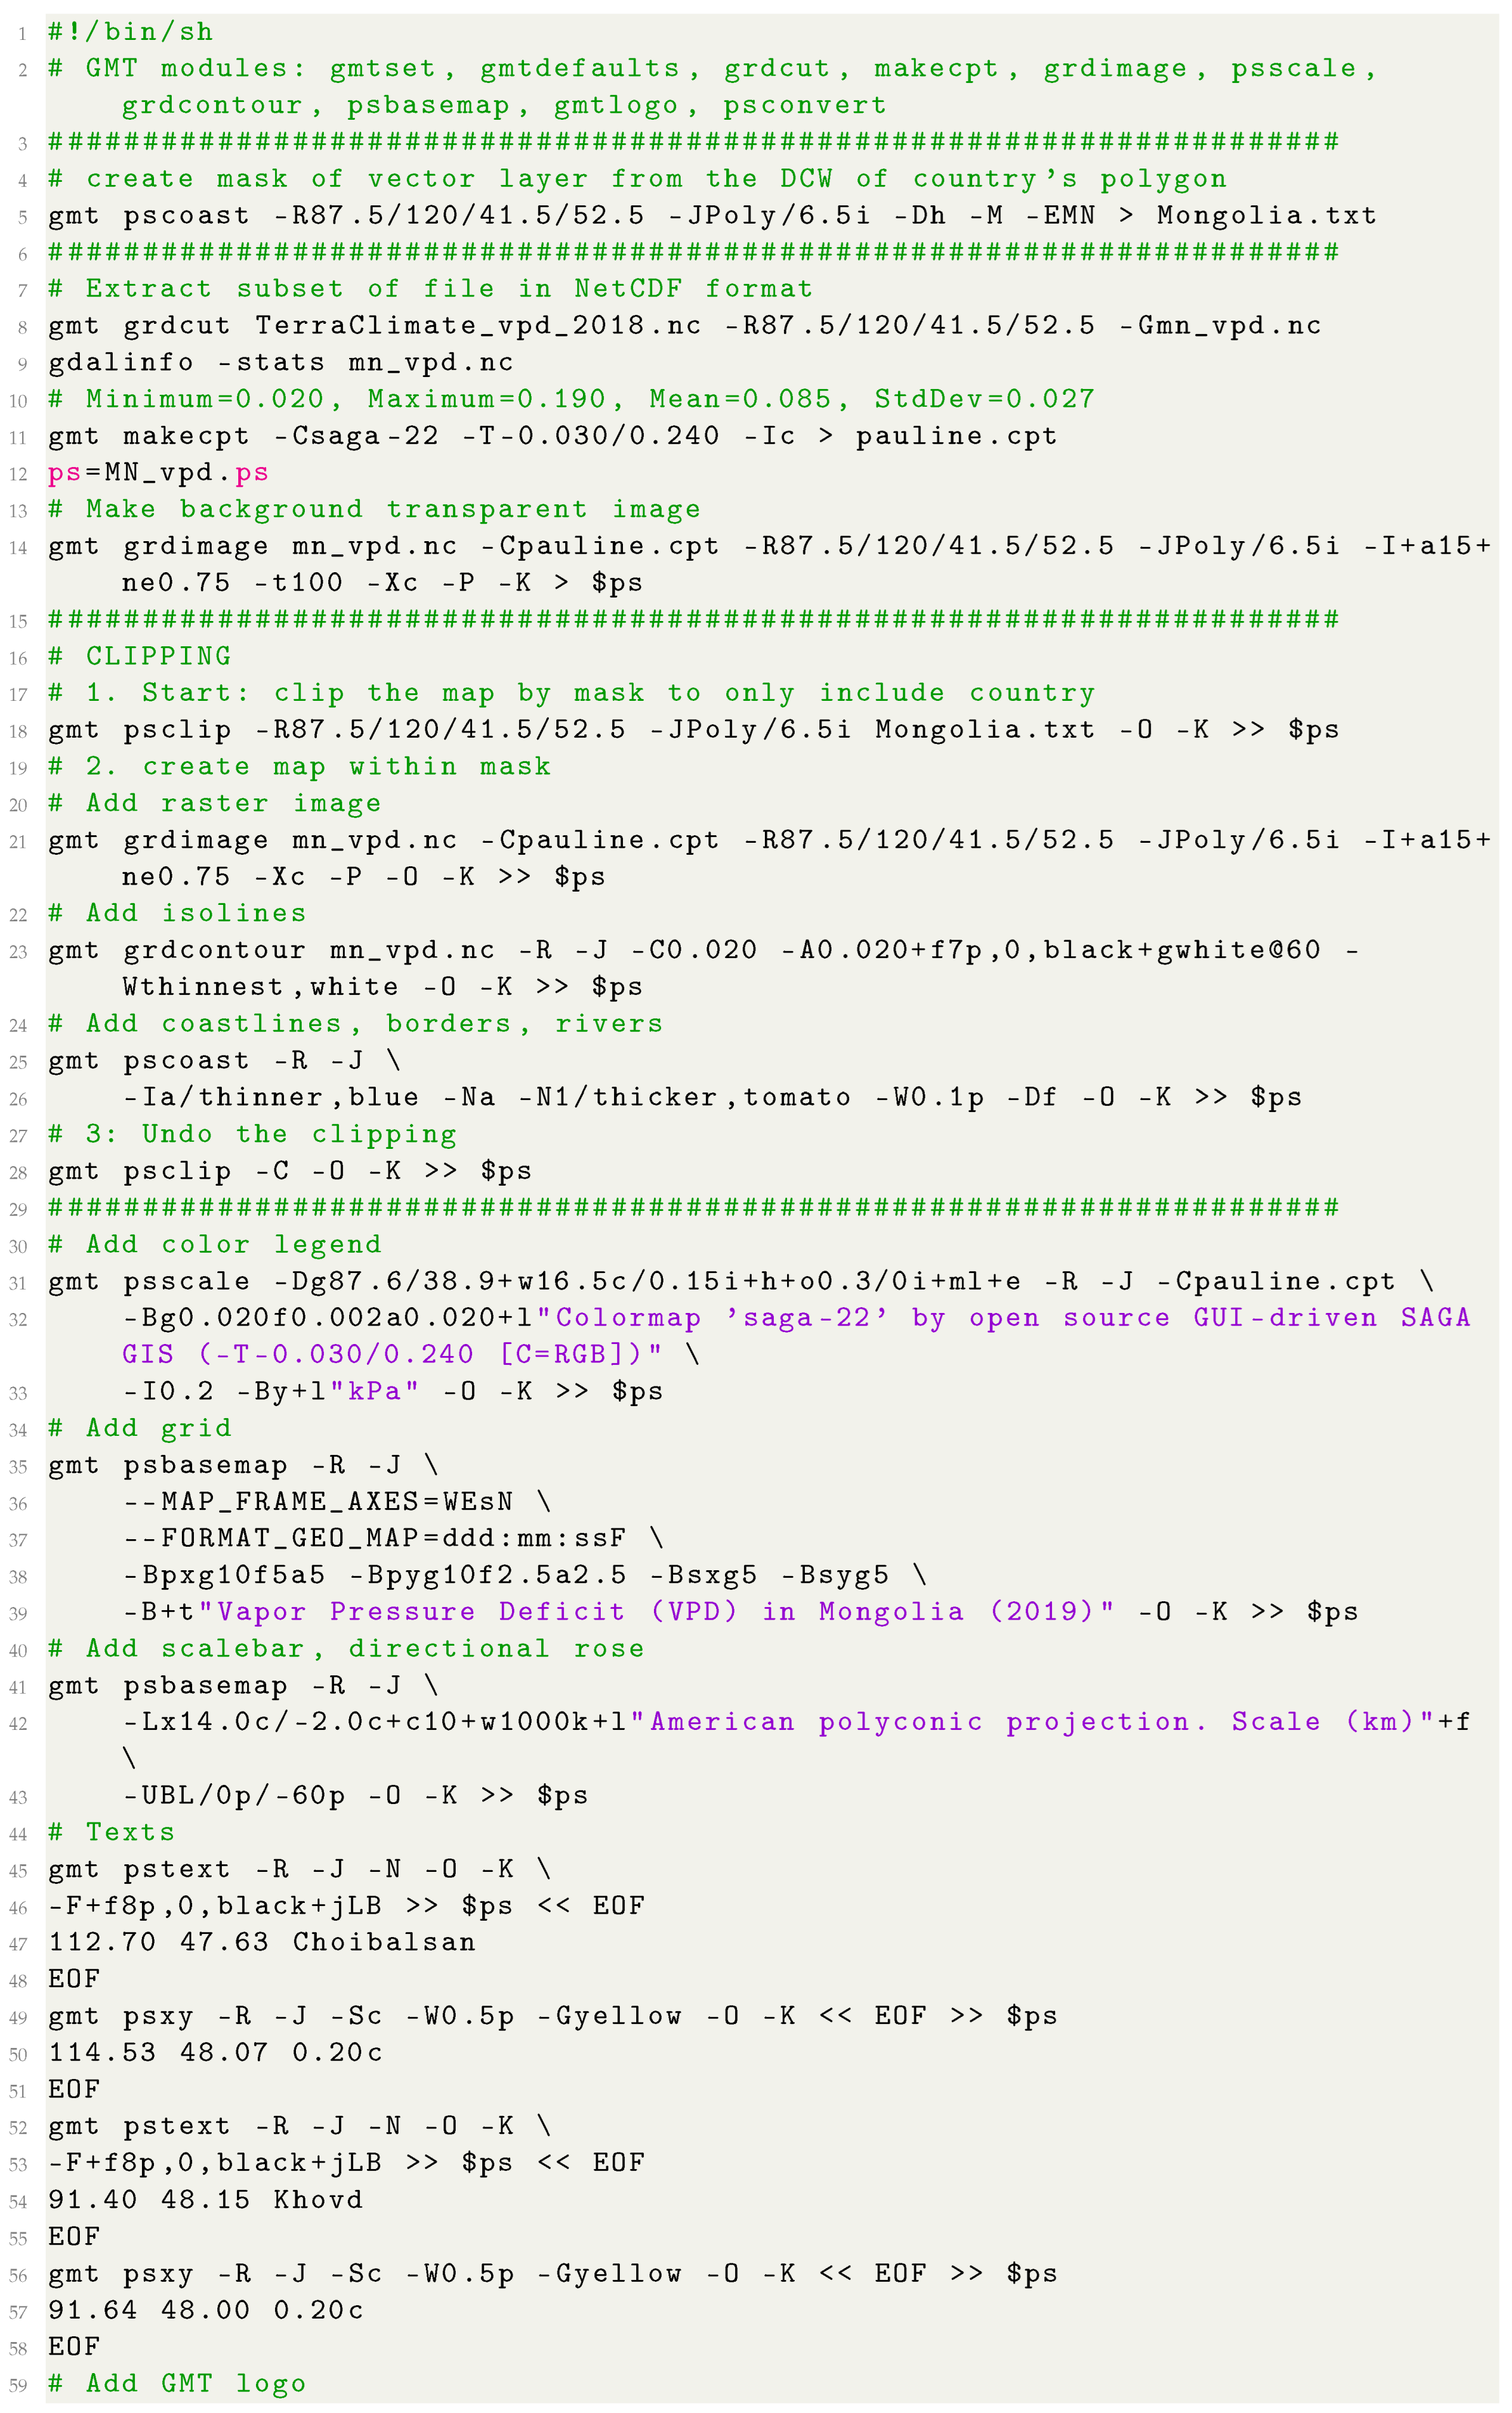
The Vapor Pressure Deficit (VPD) in Mongolia (Figure 8) was estimated using the difference between the calculated atmosphere moisture and the air capacity to contain the moisture if saturated. As such, it utilised the information on the greenhouse air temperature, relative humidity and canopy air temperature. The VPD has correlations with crop transpiration and climate factors, such as warming, water shortage and drying of atmosphere [105,106,107].
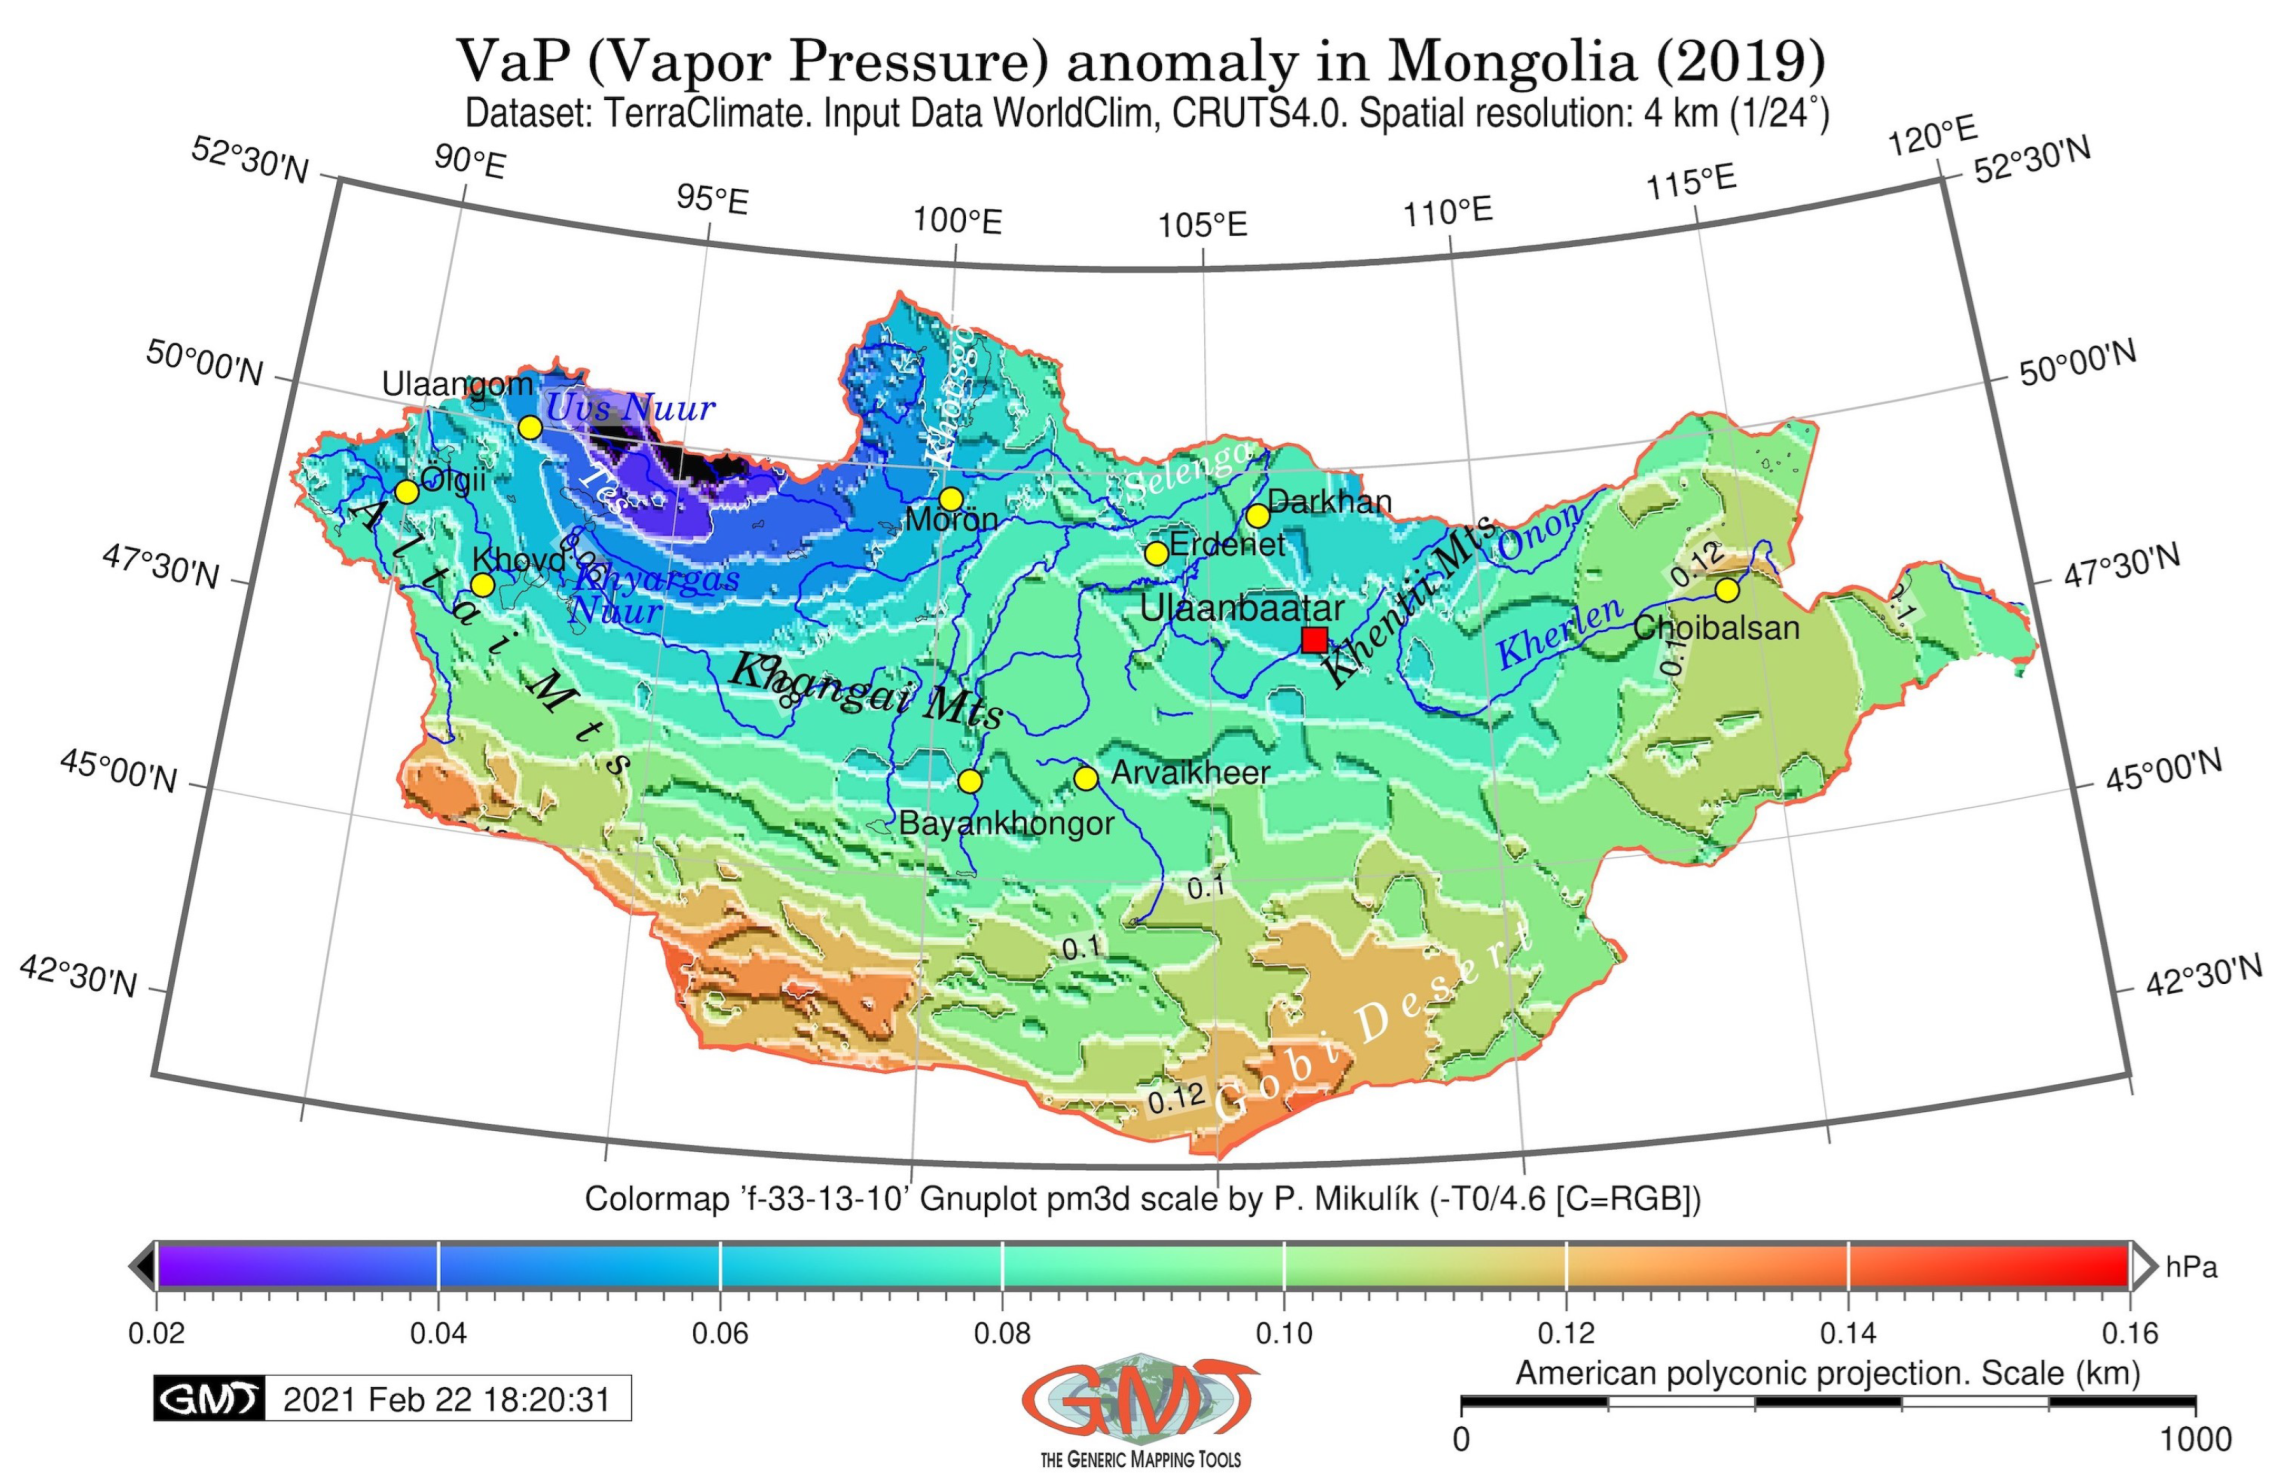
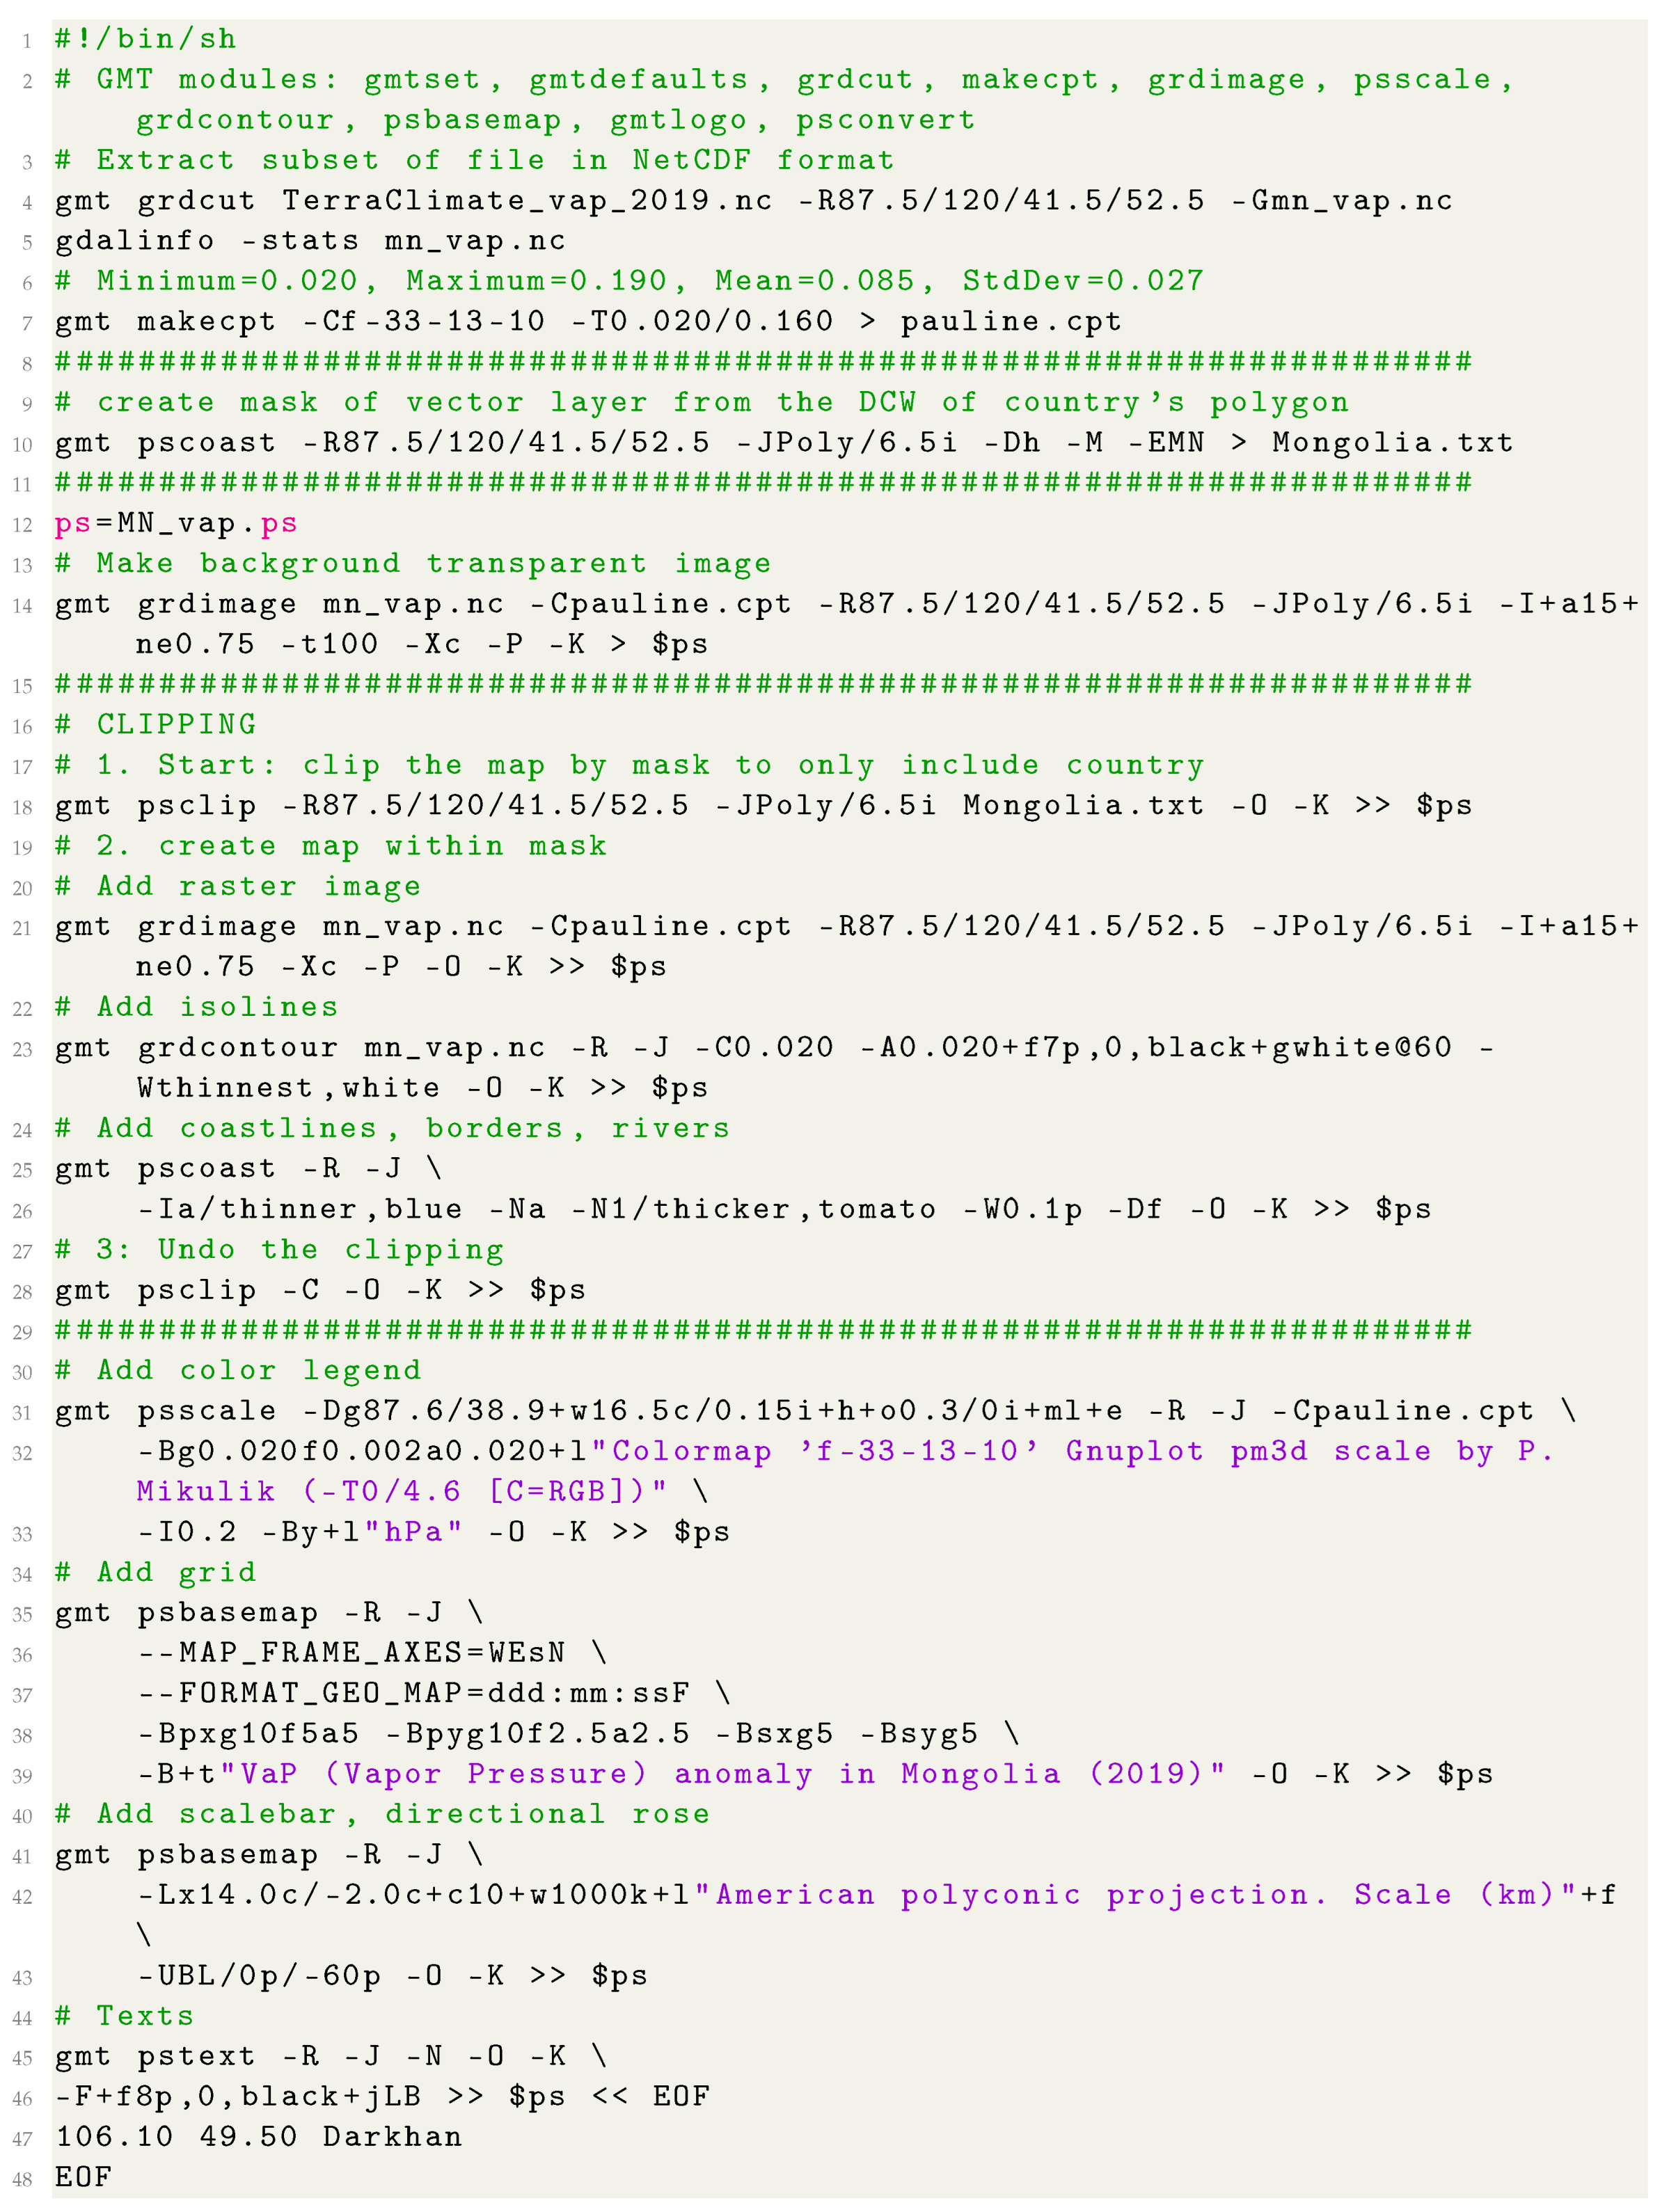
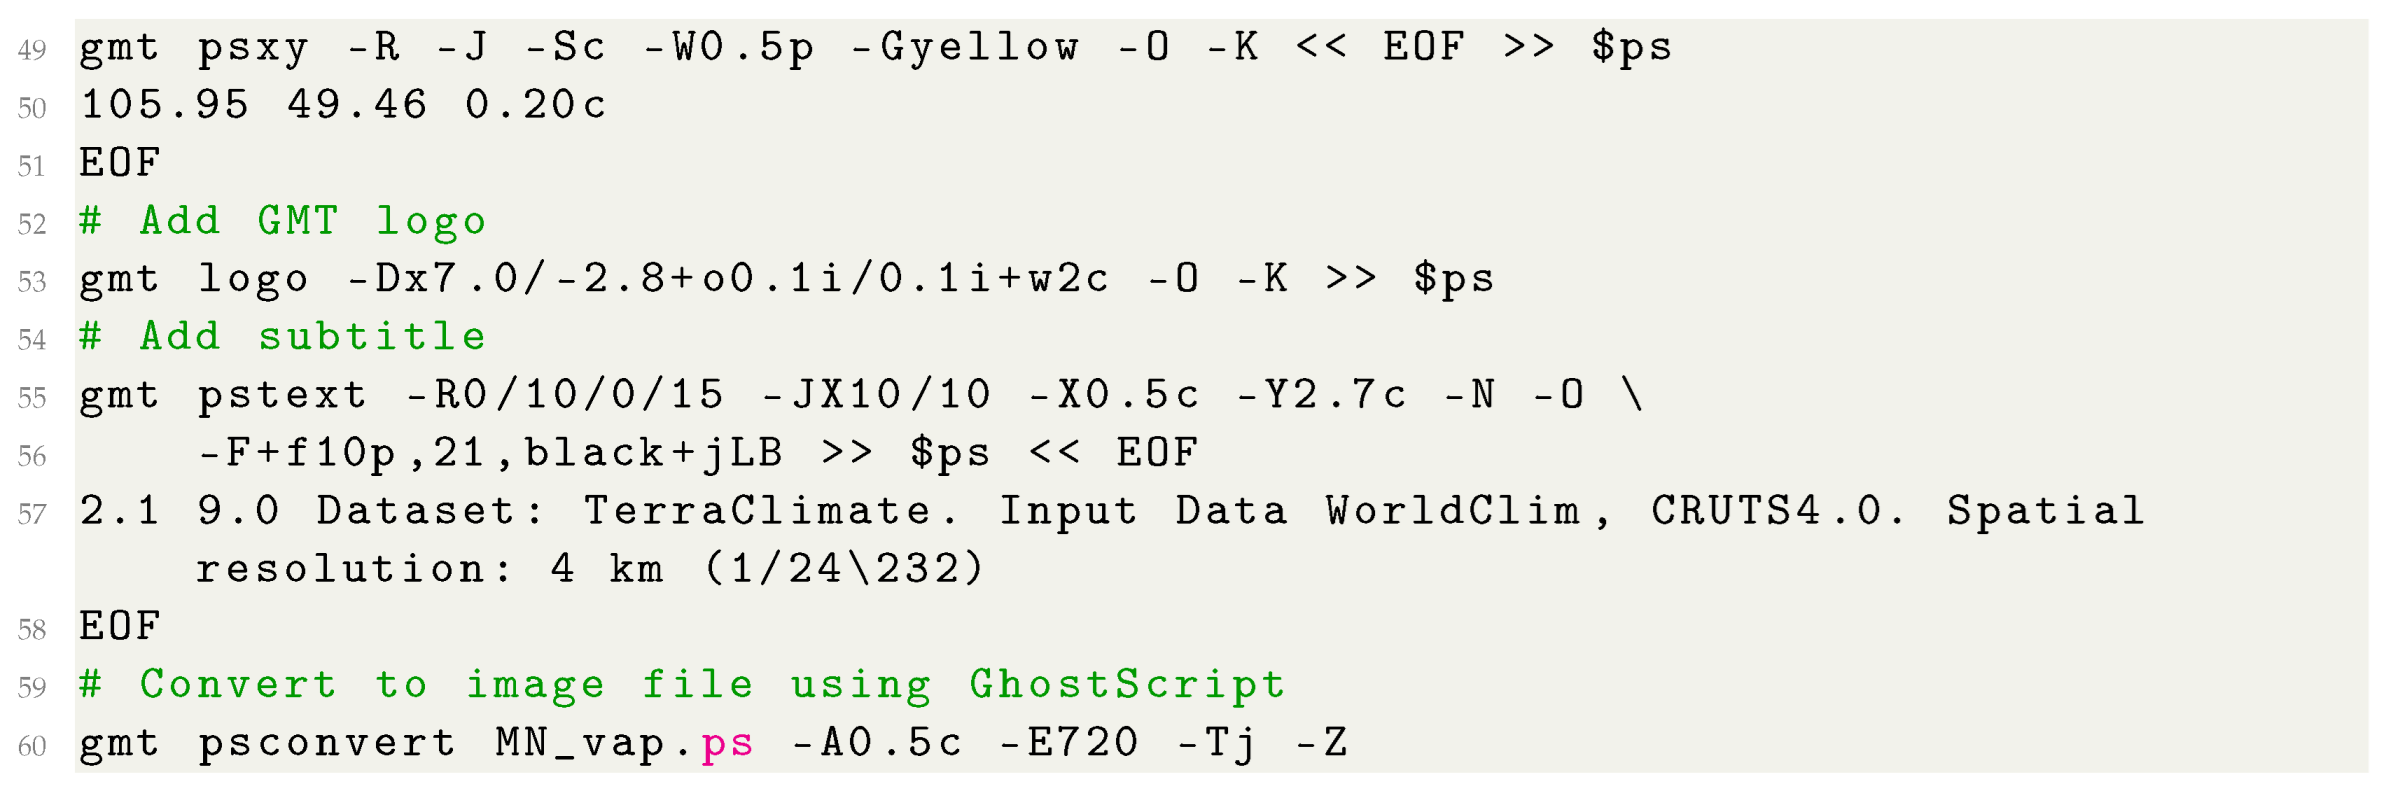
The Vapor Pressure (VAP) in Mongolia shown in Figure 9 is represented using the advanced computation approach based on the equation computing VAP as the pressure from a vapor in thermodynamic equilibrium with solid or liquid phases. Since VAP is the atmospheric pressure exerted by water vapor, it is a method of measuring the humidity of the air and may indicate environmental setting in the country suitable or unsuitable for crop planting and agricultural activities. The visualisation of VAP map has been performed using the colourmap ‘f-33-13-10’ by the Gnuplot pm3d CPT which was developed as a scale by P. Mikulík (data range here is from 0 to 4.6 for an RGB CPT).
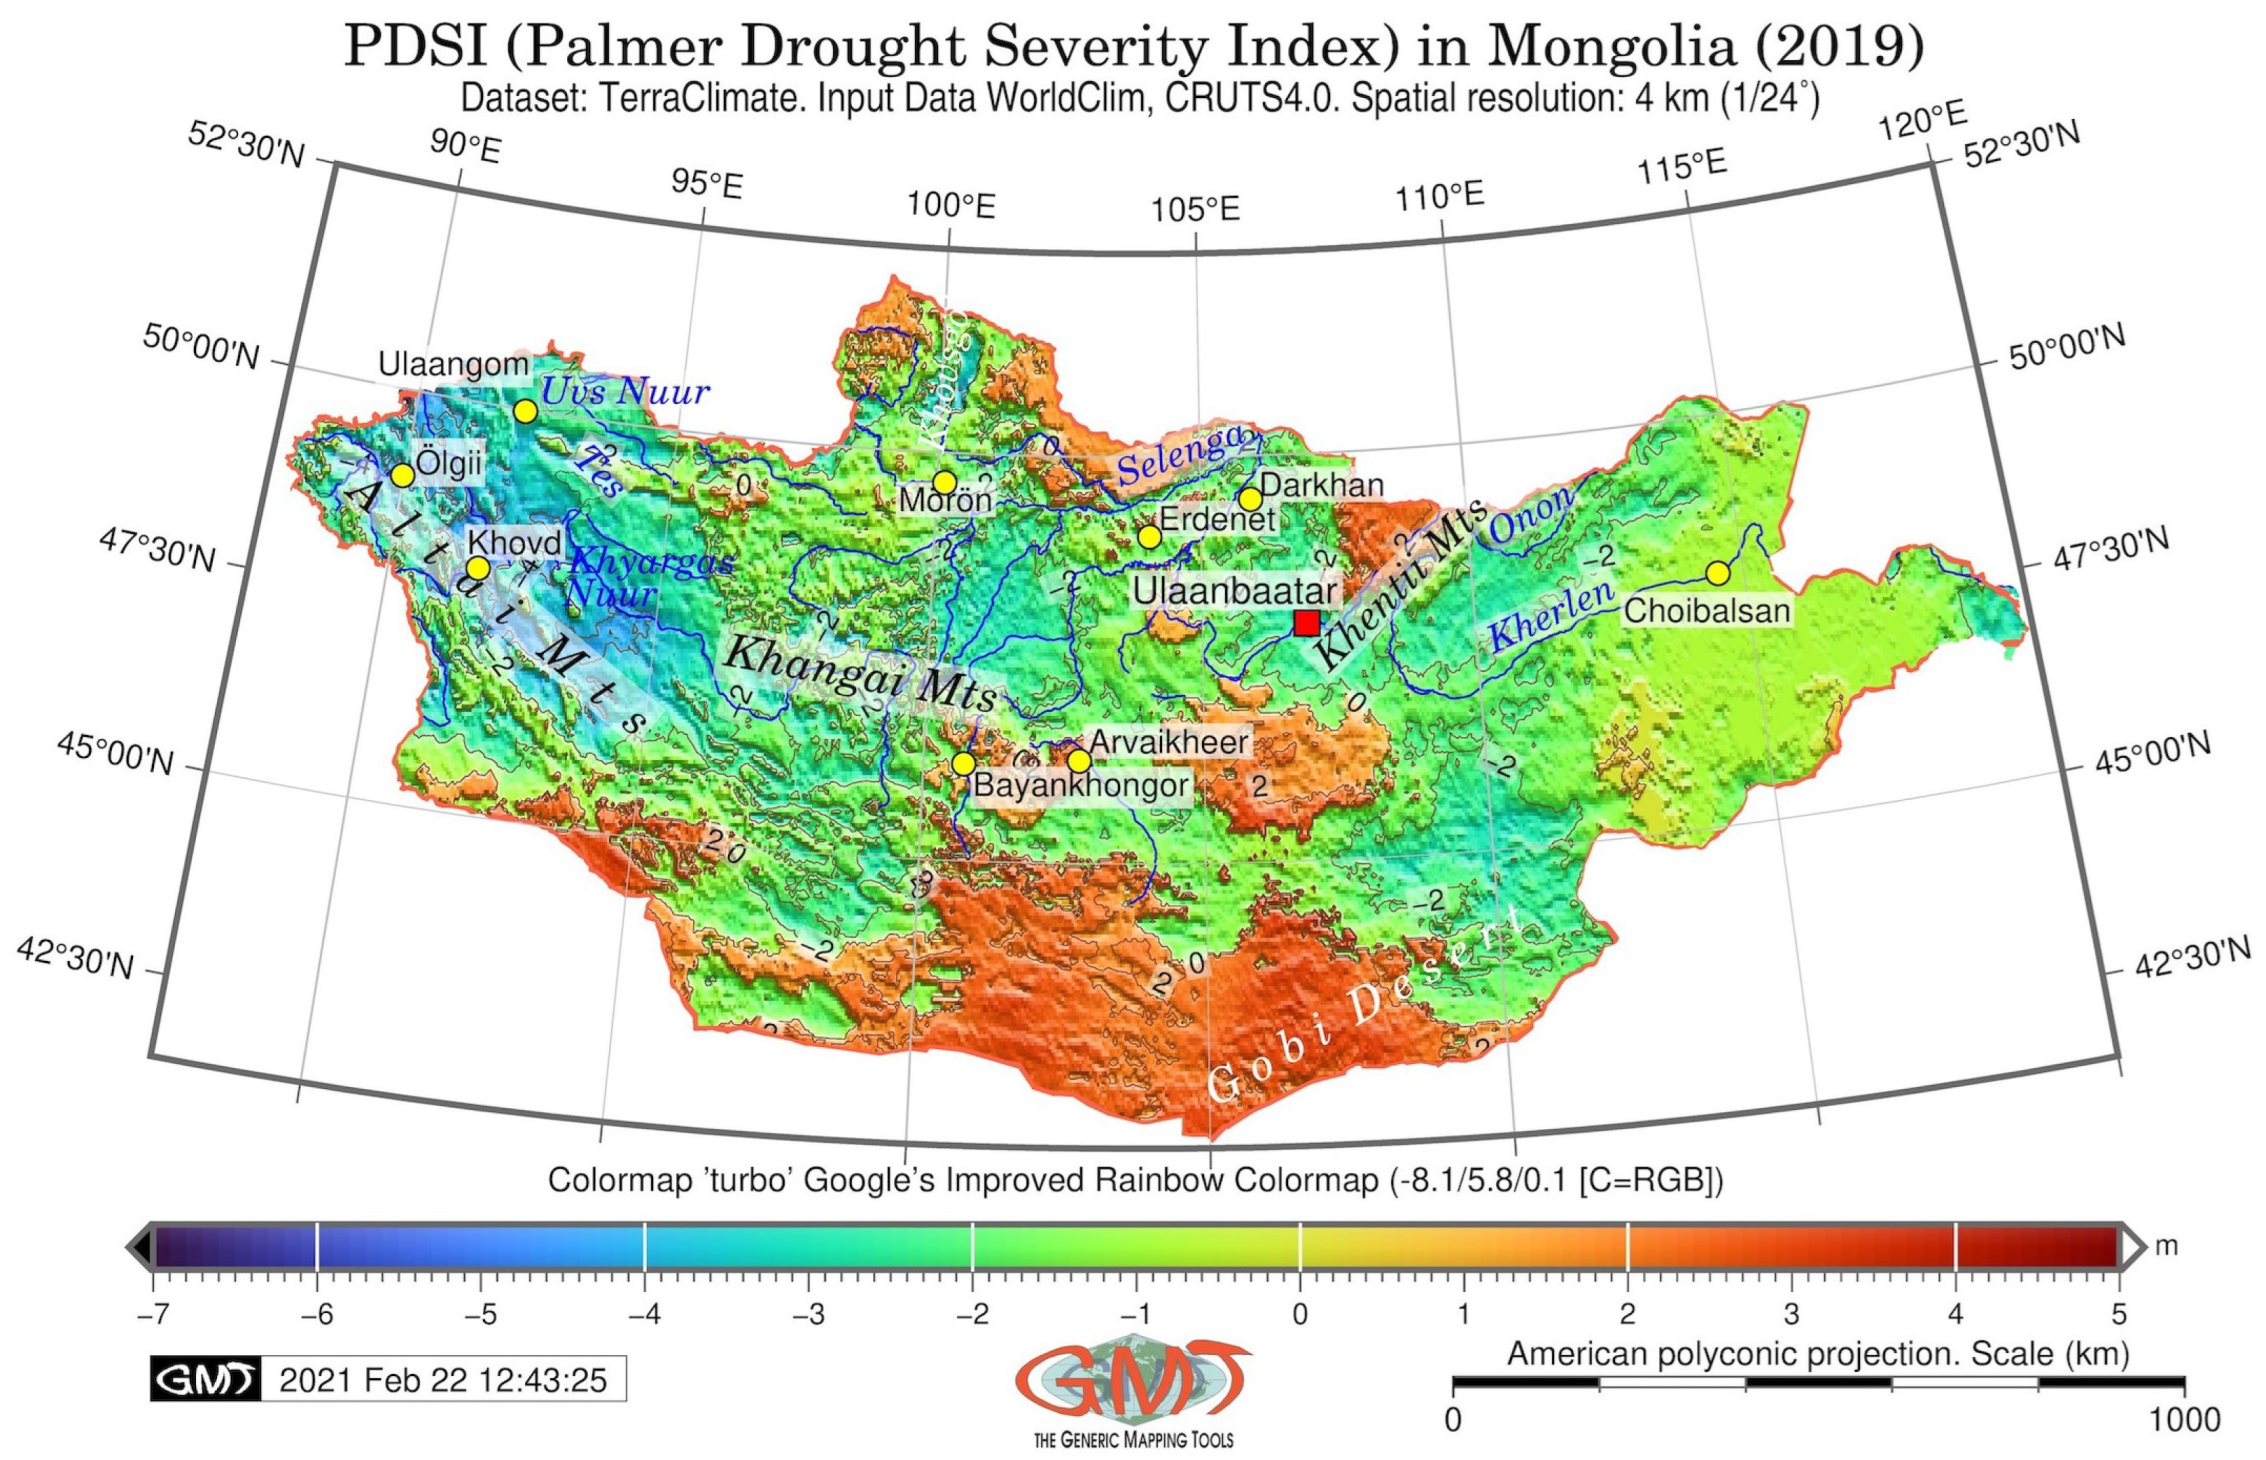
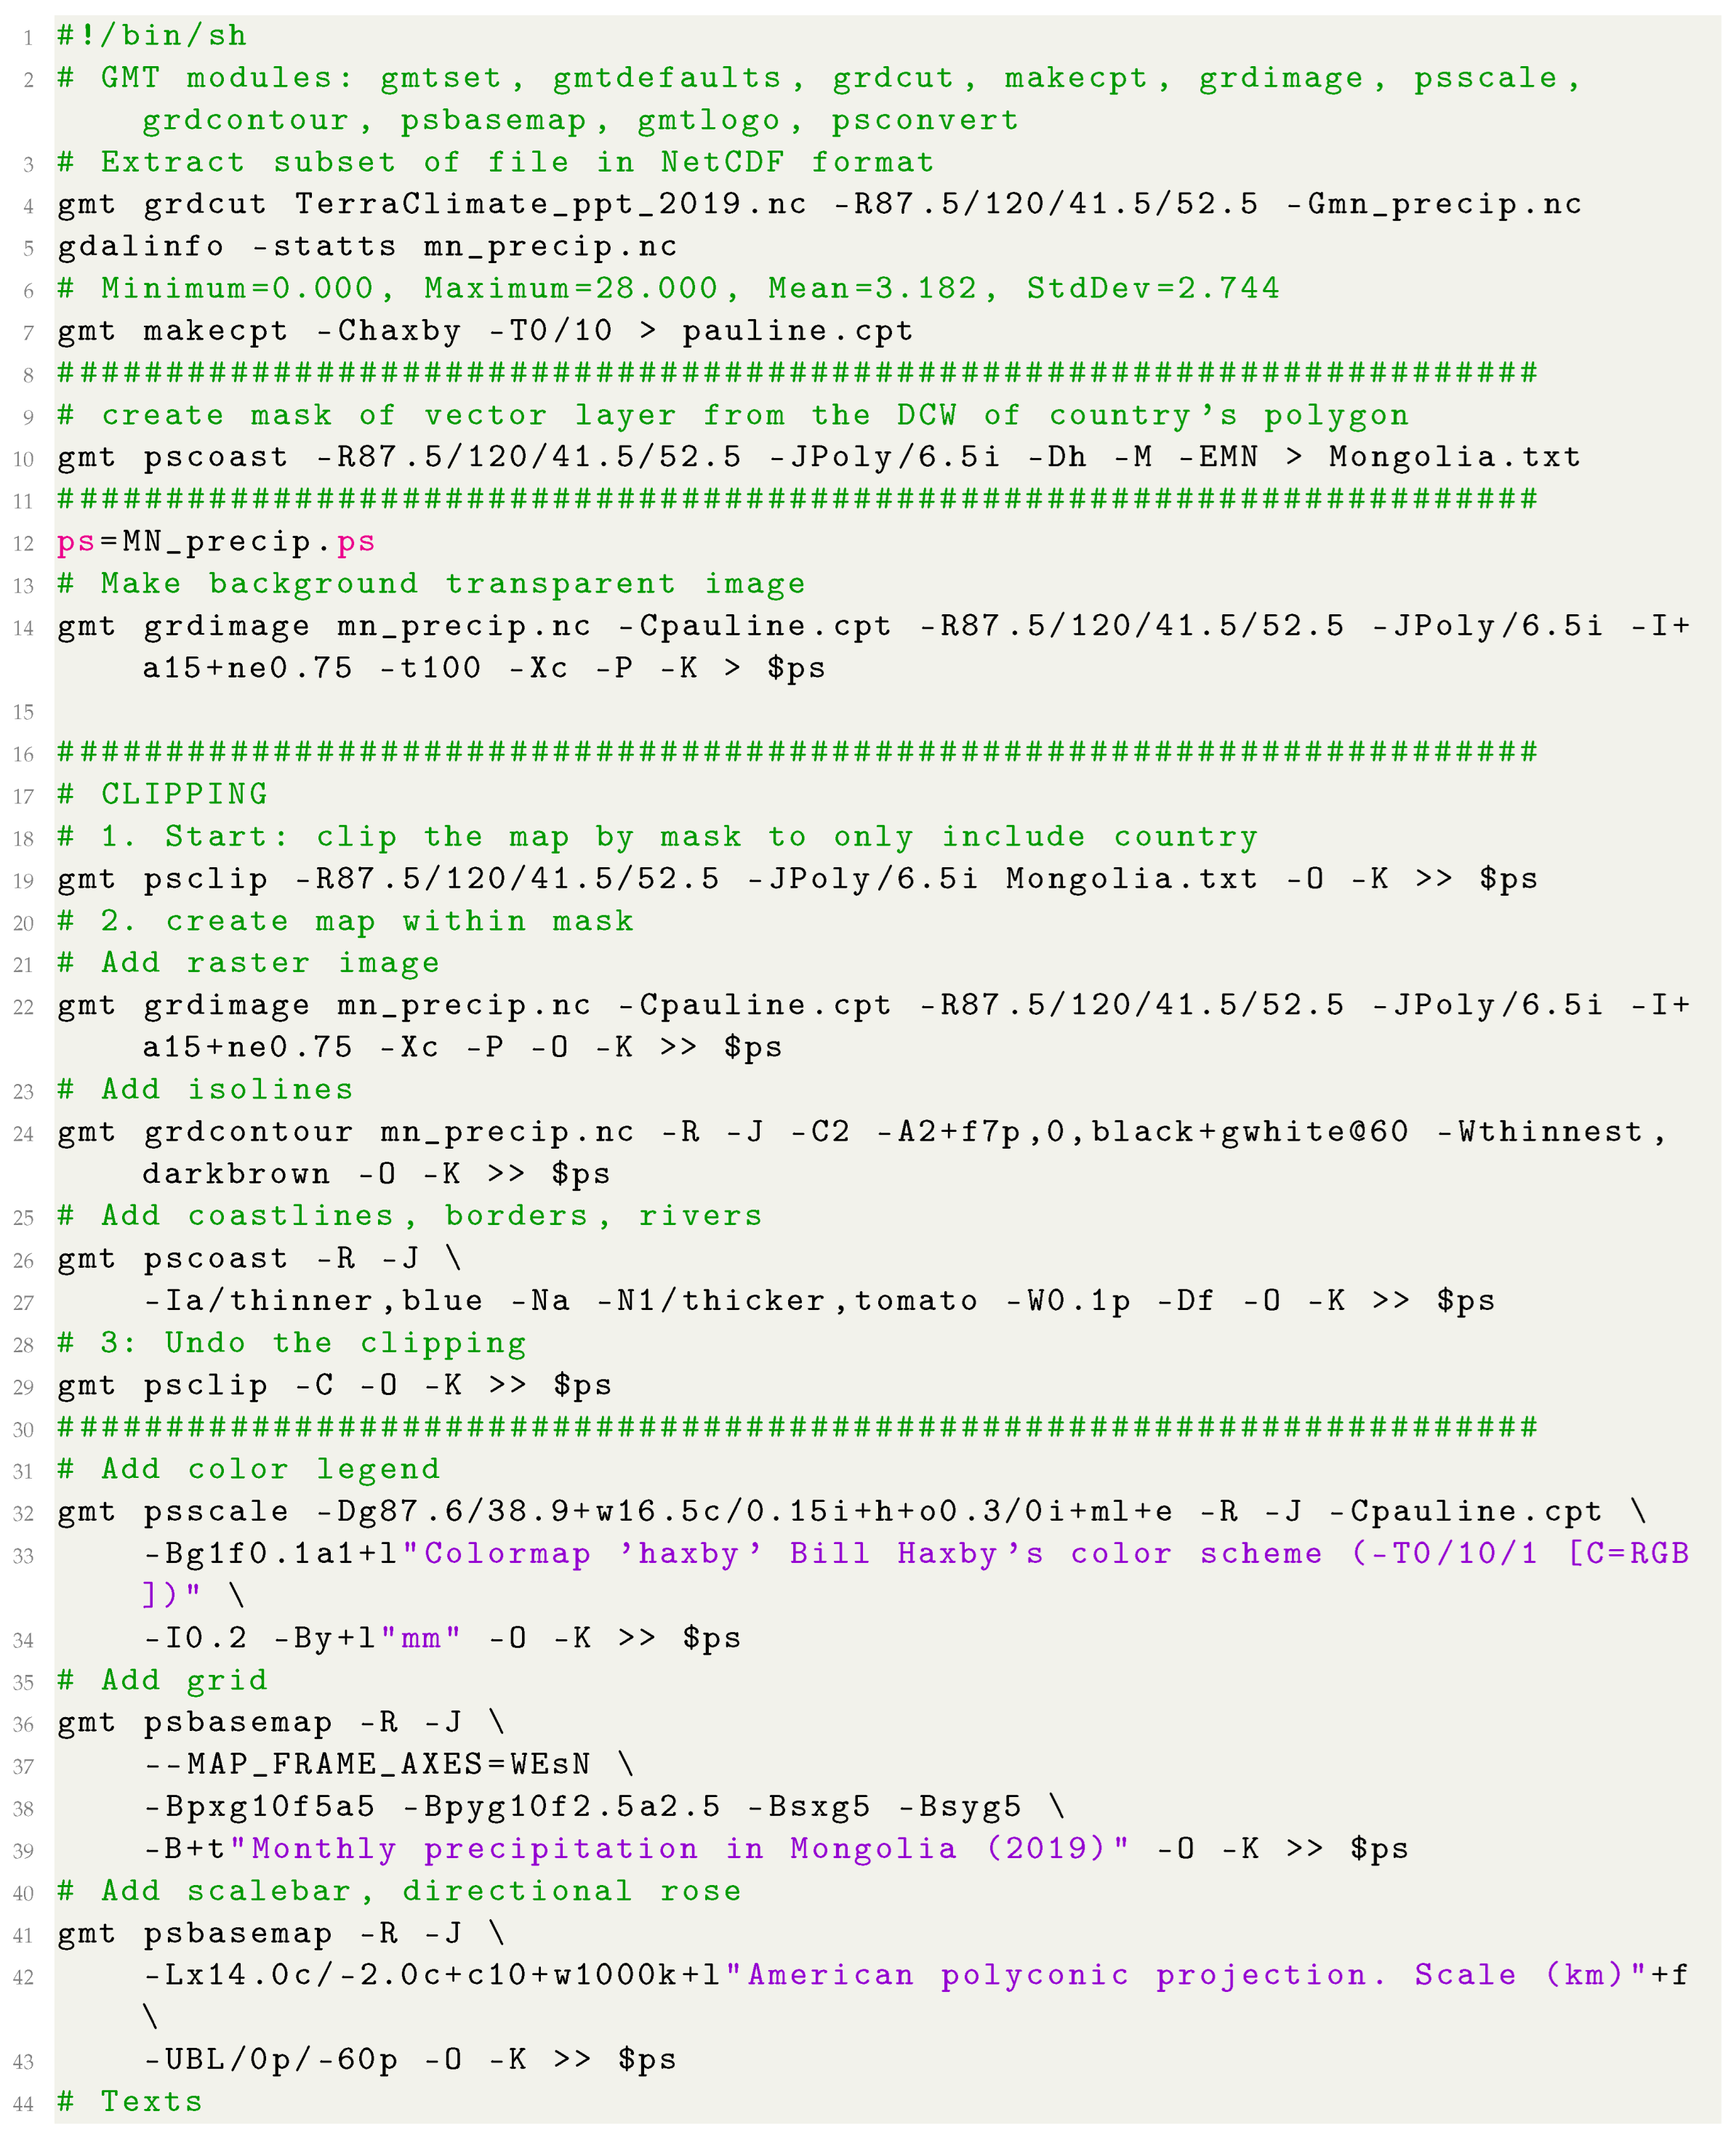
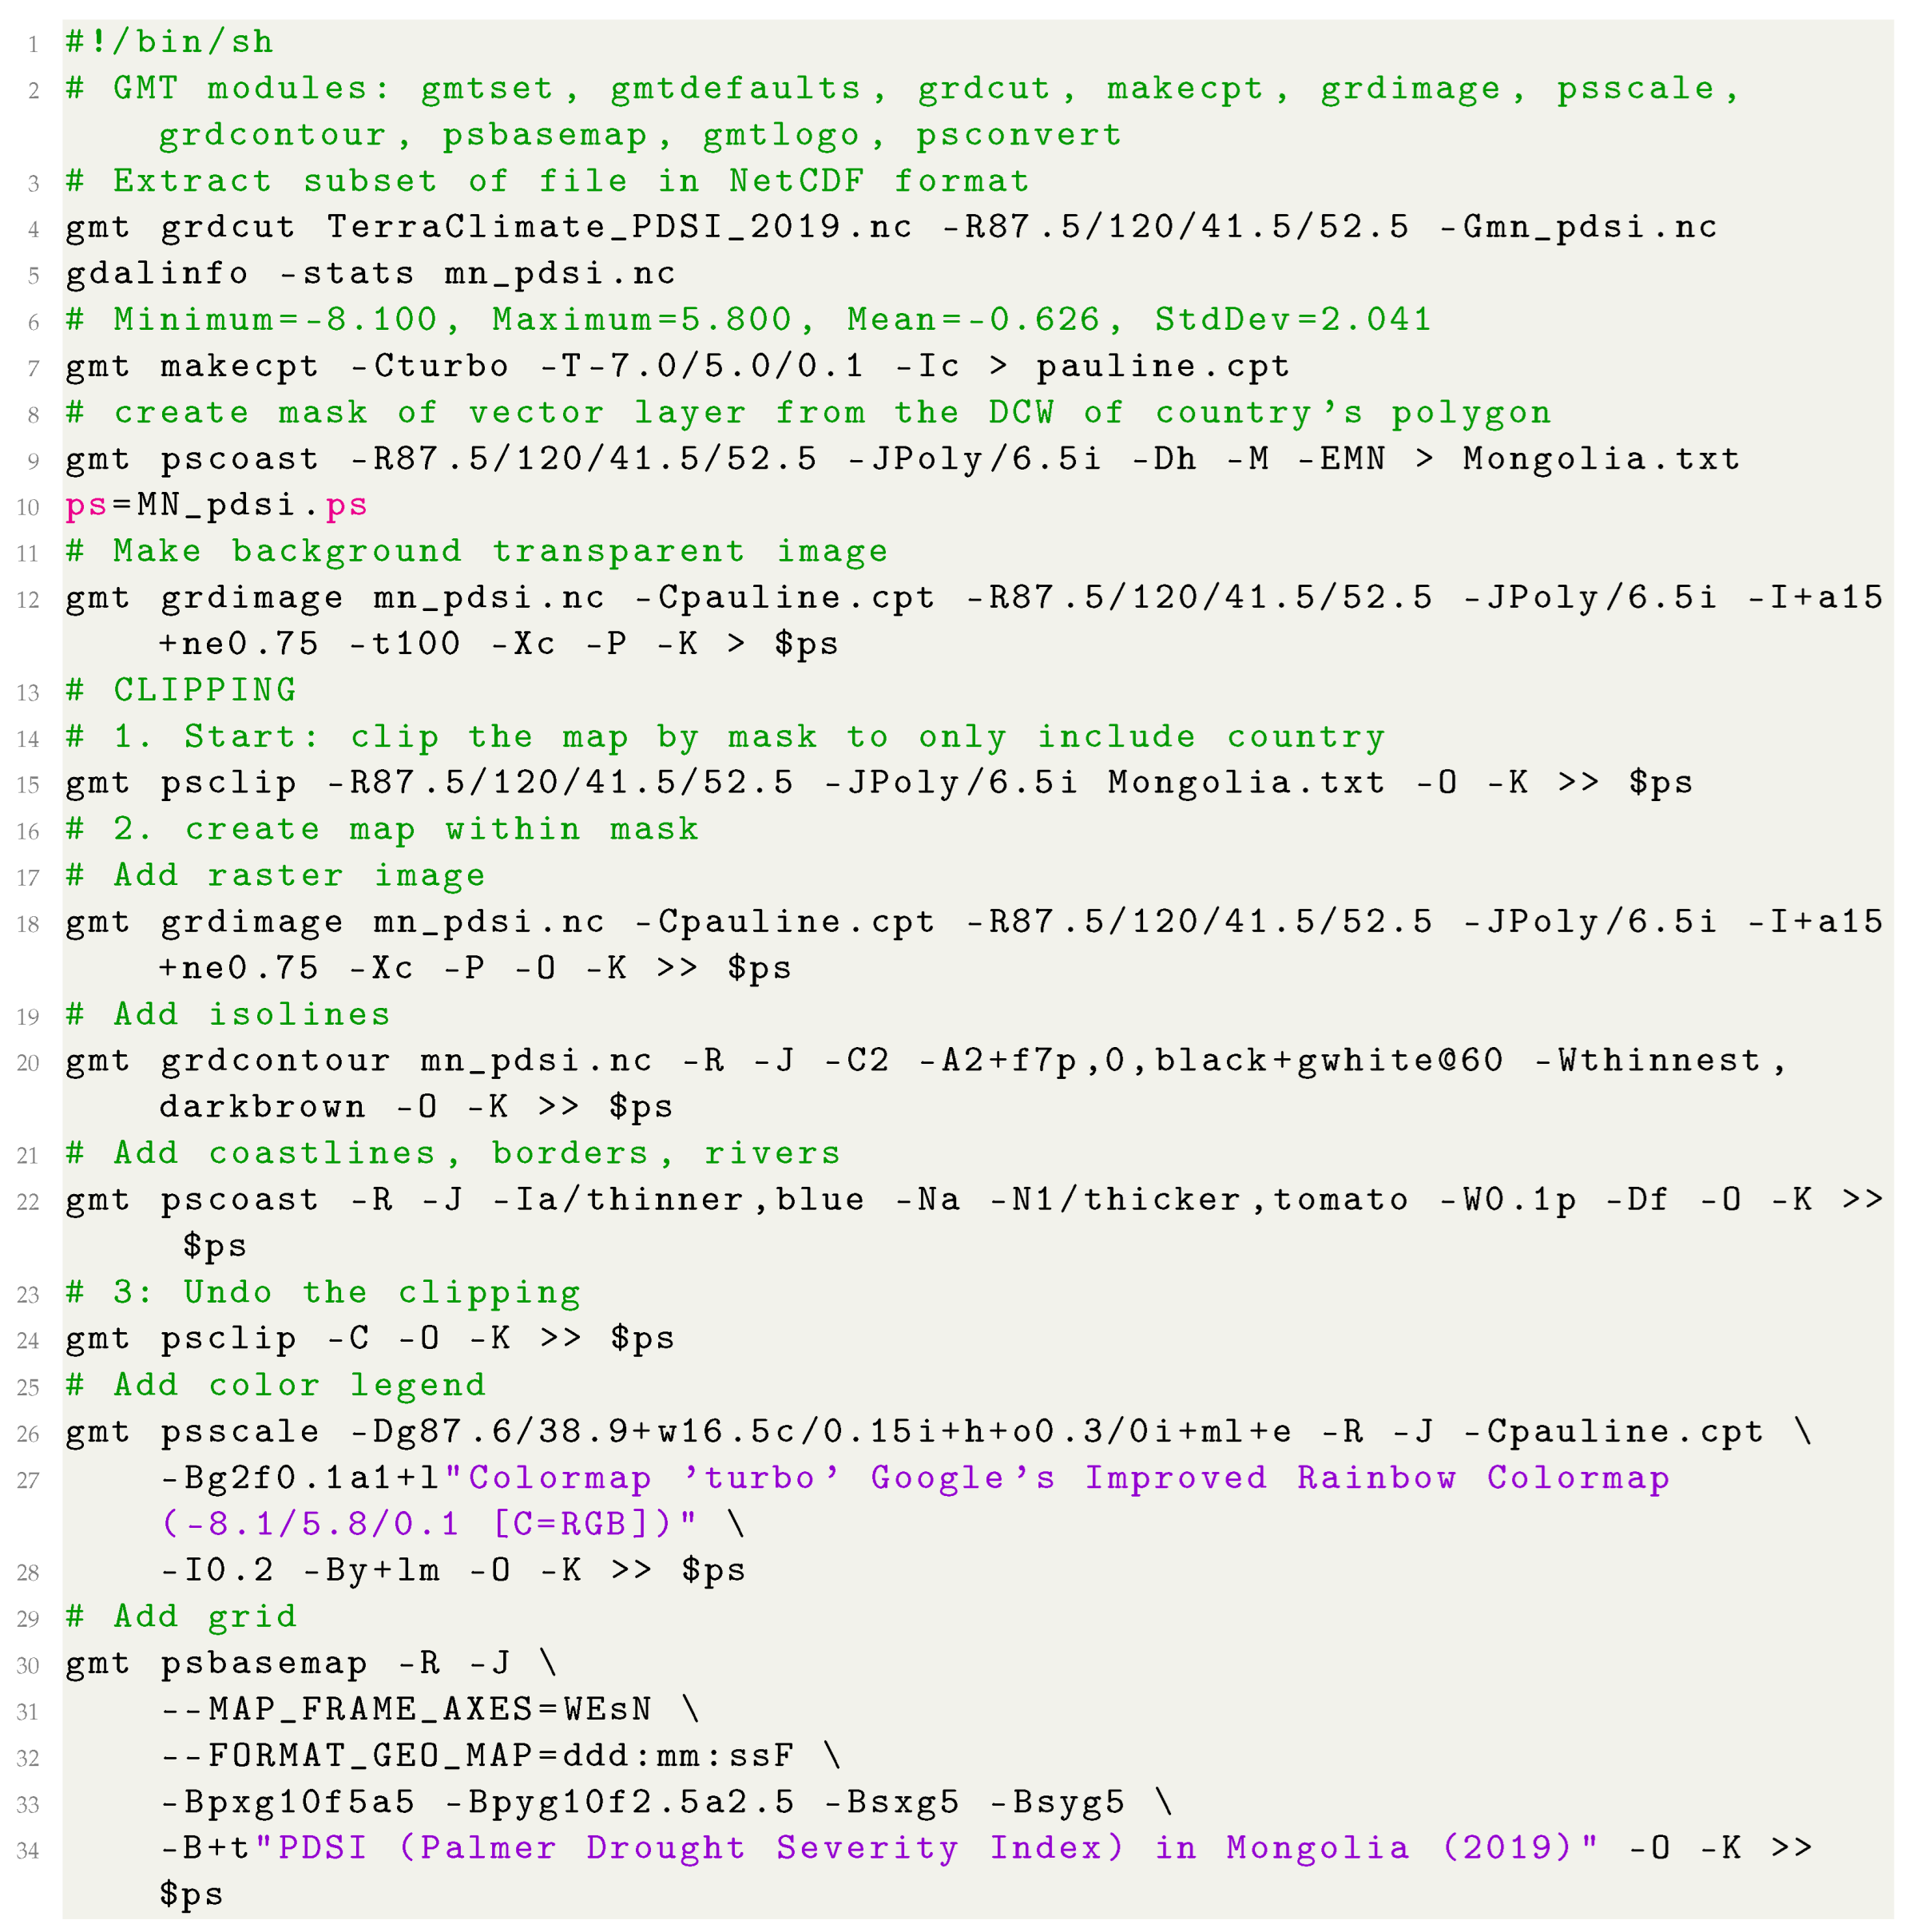
The precipitation map (Figure 10) accounts for a monthly data from the TerraClimate as of 2019 tabulated in NetCDF format and plotted using similar GMT techniques. The grid annotations were defined using the flag ‘FORMAT_GEO_MAP=ddd:mm:ssF’ which controls general map formatting in the ‘psbasemap’ module of GMT. The Palmer Drought Severity Index (PDSI) is visualised in Figure 11 as a function of temperature and precipitation. The PDSI is nowadays a widely accepted in climatology index originally developed by the American meteorologist Wayne Palmer [108]. It demonstrates a simplified soil water balance estimating relative soil moisture conditions. Although normally it differs from −10 (very dry) to +10 (extreme wet), the actual data may vary regionally. Thus, for the case of Mongolia in 2019, the PDSI data ranged from minimum = −8.100 to maximum = 5.800, with mean = −0.626 and SD = 2.041, according to the data inspection by GDAL (gdlainfo).
3. Results
Climate input datasets from the TerraClimate have been visualised using the methodology described in previous section. All the maps were plotted using the identical cartographic setting for comparability reasons: American Polyconic projection. This implies, for instance, that the observed variations of temperatures, soils moisture, PDSI, wind force and climate water deficit showing soils quality were compared within the area of Mongolia suitable for overlay. The visualised grids were compared to observe the specific ranges of climate variables by analysing the respective values using relevant maps.
The topographic map of Mongolia (sourced from [109]) was visualised for the clipped region of the country using ‘wiki-schwarzwald-d050 cpt’. The GEBCO is widely used due to the unprecedentedly high resolution, reliability and precision [110,111,112,113]. The inspected data range shows the highest point at Khüiten Peak (4374 m) in the SW of the country on the border with China in the Altai Range, the topographic mean is 1319.129 m, SD is 571.535 m, according to GDAL.
The minimal temperatures in Mongolia for the April 2019 (Figure 2) were identified as minimum = −43.0 °C, maximum = −16.1 °C, mean = −27.088 °C, StdDev = 4.858 °C based on the TerraClimate data. The coldest region is noted as the surroundings of the Uus Nuur and Tes River in the NW of the country. The maximal temperatures for April 2019 (Figure 3) demonstrated the following results: minimum = −32.1 °C, maximum = 1.0 °C, mean = −15.443 °C, StdDev = 4.977 °C. The data range for the wind speed (Figure 4) show the following results: minimum = 0.0 m/s, maximum = 4.6 m/s, Mean = 2.019 m/s, StdDev = 1.031 m/s.
The wind demonstrates the highest values in the Gobi Desert region in the south-eastern and the eastern regions of the country (Choibalsan region), which well corresponds with the levelled topography of these regions. In contrast, the lowest values of the wind speed are notable in the north-west of the country around the cities Khovd, Ölgii and Ulaangom, as well as in the Altai Mountains.
Regarding the soil moisture (Figure 5), the volumetric water content in the soils of Mongolia have the following data range: from 0 to the maximum values at , with mean at and SD at . The highest values are notable in the northern regions of the country around the cities Mörön, Erdenet, Ulaanbaatar, as well as in central regions around Bayankhongor and Arvaikheer. The notably high values of the soil moisture clearly correspond to the river valleys and lakes (Selenge, Khövsgöl, Kherlen, Onon) while the lowest values close to zero are visible in the south of Gobi Desert.
The inspection of the results on downward surface shortwave radiation (DSRAD) in Mongolia in 2019 (Figure 6) shows the following outputs: the statistical data range is from minimum = to a maximum = , mean = , StdDev = . The general trend in the data distribution demonstrates a clearly NS direction with highest values corresponding the southern regions (Gobi Desert and surroundings) while the lowest values are in the north of the country (Khövsgöl, Selenga River valley and its tributaries, Onon River, Uvs Nuur).
The Snow Water Equivalent (SWE) shown in Figure 7 demonstrated the statistical analysis as follows: data varies from the minimum = 0 to the maximum = 491.0 mm, mean = 16.552 mm, SD = 21.985 mm. Variation of the data shows a correlation with the topography of the region with increased values in the regions of the Khangai Mts, Altai Mts and in the north. In contrast, the lowest values are notable in the southern and SE regions of Mongolia. The Vapor Pressure Deficit (VPD) in the country is shown in Figure 8. For the VPD, the southern regions of the country ranked as a ‘very high’ level of deficit with values of 0.16 to 0.18 (coloured cyan to blue in Figure 9), while northern and selected central regions (Uvs Nuur, Ulaangom) are identified as the ‘low’ level (values −0.02 to 0.02, coloured red in Figure 9).
The rest of the country has values varied according to the topography and local climate settings. For example, the Vapor Pressure (VAP) anomaly over Mongolia shows a clearly visible negative values in the northernmost areas of the country around the Tsetserleg city (Figure 9). General data range shows the following values: Minimum = 0.020 hPa, Maximum = 0.190 hPa, Mean = 0.085 hPa, StdDev = 0.027 hPa, where variations in values demonstrate a general trend of increase towards the southern regions of Mongolia.
Monthly precipitation in Mongolia in 2019 (Figure 10) was identified as at high levels in central regions with a general data range from minimum = 0.0 to a maximum of 28.0 mm, a mean at 3.182 mm, and a standard deviation (StdDev) at 2.744 mm. The map was visualised using ‘saga-22’ cpt adopted from the SAGA open source GIS.
Finally, the Palmer Drought Severity Index (PDSI) in Mongolia (Figure 11) calculated and visualised for 2019 shows the following data range: in general, data varies from −7 to +5 from very dry levels to the extreme wet values showing very dry values in the Gobi Desert while more wet and moist regions in the mountain ranges of the Altai and forests.
4. Discussion
4.1. Perspectives of the Script-Based Techniques in Cartography
The use of open source data mapped using advanced script-based methods enables to further assess the links between the topography, environment and climate parameters. For example, analysis of maps enables to detect correlations and impact factors, to assess the performance of environmental variables with regard to the topographic effects. Such an in-depth analysis requires an extra evaluation of environmental and topographic variables, which is possible using high-quality maps. Traditional GIS methods are less effective: labor-intensive, time-consuming and not precise. In contrast, GMT provides a new way of data processing through increased automation, rapid plotting, enhanced functionality and refined solutions of cartographic design. Besides this, its benefits include rapid and seamless data conversion, very high speed of raw data processing and accuracy of mapping.
This study presented a script-based mapping of the climate and environmental data covering Mongolia. The cartographic technical approach of this study is based on scripting processing supported by the advanced GMT techniques by presented scripts. The study applied the existing datasets available from GEBCO and TerraClimate for climate and environmental monitoring using data for 2019. In this way, the presented series of maps contributed to the general goals on maintaining analysis of the sustainable development, environmental and biodiversity protection and climate mitigation in Mongolia. At present, applications of scripts in cartography in climate and environmental mapping of central Asian countries with sensitive climate conditions are still being developed.
This research contributed to the increase of such applications by presenting an integration of the environmental and climate data from climate monitoring survey and automated cartographic data processing by scripting algorithms of GMT for high-quality mapping. Specific tasks in cartographic workflow using GMT scripting included accurate techniques of map plotting and visualising various elements on the map by lines of the code, as demonstrated in the presented codes. The computer-based semi-automated data processing in cartography using algorithms of GMT scripting significantly facilitated and improved technical workflow of such tasks compared to the traditional GIS which remains a tedious handmade routine.
The advantages of using open geospatial data, such as TerraClimate and GEBCO, for climate and environmental monitoring consist in the effectiveness of data analysis. Visualising open datasets enables a contactless approach to the remotely located, hardly reachable regions, such as Altai Mountains or Mongolia Gobi Desert [114]. Using open source data processed by automated methods of scripting may further improve developing a system of detecting droughts and monitoring environmental setting visualised as a series of thematic maps. Such activities can prevent climate and environmental hazards by preventive risk assessment achieved through accurate data visualising and prognosis. In such a way, environmental and climate monitoring reduces the need for fieldwork in the remotely located and data-scarce areas with restricted access.
4.2. Cartographic Perspectives in the Environmental Analysis
The development of the advanced climate monitoring of Mongolia is possible based on regular visualisation of the high-resolution data created as a series of maps. Discrimination of variations of climate variables using maps visualising climate data which enables to detect and separate regions with lower and higher temperatures. The maps contributed to the risk assessment of droughts through visualising data on DSRAD, VAP and VPD and soil water balance. Estimating relative soil moisture in Gobi Desert and other arid regions of the country was compared to the plains and mountainous regions.
Moreover, topographic and climate mapping using scripting GMT methods and open geospatial data for environmental analysis and monitoring fits to the increase of digitalisation and visualisation of data for sustainable agriculture, since it strongly depends on regional climate and topographic setting of the country. In principle, the strategy of regular cartographic mapping of any country and region, including Mongolia, aims at the increase of knowledge. This consists in smart environmental and climate monitoring system based on the available datasets for sustainable ecosystems, identification of climate hazards, analysis of biodiversity and vegetation mapping in Mongolia. The integration of various datasets into the inter-disciplinary projects on environmental and climate monitoring of Mongolia ensures the dissemination of results of climate change in various regions of the country. This study presented a contribution to such projects and tasks through the presented geospatial analysis of climate and environmental setting of Mongolia.
Actual and regular updates of mapping help to increase the control on possible drought distribution and climate characteristics, such as temperature, vapour, snow water equivalent, and the like. The study aimed to the development and maintaining of agricultural monitoring system in Mongolia or Inner Mongolia (China), following the existing studies [115,116,117]. In such a way, the extended study can reach the goal to increase environmental monitoring of Mongolia using maps made by GMT.
To contribute to these goals, this research presented 11 new maps made using linking technical cartographic approach of robust data visualisation using GMT. The outcomes aimed to support the implementation of the precise climate and environmental monitoring of Mongolia. Thus, it contributed to the development of actual non-destructive environmental monitoring systems based on the cartographic analysis in previous studies of Mongolia and neighbouring regions [118,119,120,121].
4.3. Outlook and Future Developments
As a recommendation for future studies, the analysis of multi-temporal changes in climate and environmental setting of the country would be beneficial using datasets taken for various periods of years. Spatio-temporal multi-source data analysis supports comprehensive environmental and climate analysis of Mongolia in real-time regime, which can be applied for agriculture and crop management support systems. Besides this, overlapping historical archive climate and environmental data with actual data using computer vision techniques and algorithms of script-based mapping, can enable to perform a retrospective times-series analysis for predictive mapping and agricultural prognosis of Mongolia. Thus, the semi-automated mapping by GMT can be applied in a real-time regime for environmental and climate monitoring using time series analysis, aimed to perform comparative spatial analysis of the environmental factors in Mongolia.
Furthermore, the presented map series contribute to the data analysis in agricultural sector of Mongolia and international community of the Central Asian studies. For example, environmental variables mapped in this study, such as soil moisture, temperature variability, PDSI, can be considered for agricultural analysis: to estimate crop responses and sensitivity to climate changes in Mongolia. Moreover, regional climate variability can be studied by analysis of maps covering regions where the extremes in climate variables are the most notable due to the contrasting topography: major mountain ranges of the Altai, Khangai and Khentii, Central Mongolia, northern riverine network (Selenga River with tributaries) as well as the Gobi Desert region.
The thematic maps plotted in identical projection and spatial extent enabled to demonstrate topographic and climate data from the multi-disciplinary sources. This contributes to the development of the data-based solutions for agricultural monitoring of Mongolia through the visualisation of regional climate and topographic setting and support of the adaptive crop management. These maps can be beneficial to build up more complex projects and deepen experience in the advanced spatial data processing for agricultural mapping and sustainable development of Mongolia using integration of GMT and open source data. Besides this, the use of other open source geospatial software for extending the project, for example, GRASS GIS and QGIS, could benefit from the datasets and increase research scope.
Additional data may also include very detailed high-resolution weather data on precipitation, wind, air temperature and soil moisture maps on a weekly basis. Supported by such data, an extended research may also include using satellite images to allow deeper insights into the crop identification and plant health monitoring for smart agriculture in Mongolia. This would contribute to the strategy on environment, biodiversity and agricultural protection and climate mitigation on a national scale in Mongolia. Acquiring new knowledge on sustainable development and environmental monitoring of Mongolia is largely based on using high-quality maps.
5. Conclusions
To address the problem of modern cartographic data processing in physical geography, this study demonstrated the use of the GMT scripting toolset for script-based mapping. The GMT-based scripting approach of climate mapping, presented in this study with a case of Mongolia, provides both a qualitative and a quantitative basis for visualising areas of notable climate variations to target for high-resolution environmental and climate mapping. The application of script-based mapping in cartography presented by a case of GMT, was specifically used to process several raster data of TerraClimate having global coverage.
The visualised datasets illustrated the impact of local and regional topography in Mongolia on a national scale. Specifically, this study analysed variables such as wind speed and radiation, min/max temperatures, wind speed, soil moisture dynamics, distribution of DSRAD, SWE, VPD and VAP, monthly precipitation and PDSI. The comparative analysis for climate data based on the eleven new maps plotted in identical cartographic projection (American polyconic) provided a cartographic approach for visualisation of the spatiotemporal climate and environmental data for Mongolia. Climate variables were mapped within special areas: Gobi, Altai, Khentii, Khangai, basins of major rivers (Selenga, Onon, Kherlen, and Tes), Central Mongolia with the Ulaanbaatar, and the eastern region of Choibalsan.
The study revealed a variation of the continuous fields in climate variables which well corresponds to the complex topographic and hydrologic setting of the country. In such a way, this paper determined geospatial variability of climate and topographic factors that influenced regional environmental diversity for Mongolia. The results distinguished variations in climate parameters caused by the distribution of the landmasses in mountain ranges of Altai, Khangai and Khentii, distinct from the regions of northern Mongolia with dense hydrologic network, central Mongolia around Ulaanbaatar, eastern region, steppes, semi-deserts and Gobi Desert, which continues existing studies [122,123].
Technical implementation of the thematic maps consists in scripting algorithms of GMT by various modules and consecutive iteration of codes, as explained in Methodology. The script-based data processing applied in various geoscience application [124,125] demonstrated effectiveness and automation of data analysis, modelling and visualisation. In this study the script-based mapping by GMT was applied to reduce the workload of visualisation through the increased automation in the cartographic workflow. Scripts used for cartographic tasks were tested by GMT for processing of raster TerraClimate dataset aimed at detailed geographical analysis of Mongolia. Spatial environmental and climate analysis determined relative distribution of the PDSI and temperature extremes, precipitation and soil moisture, wind speed and DSRAD, SWE, VAP and VPD compared with landmass parameters. It represented a powerful cartographic tools to address complex regional climate and environmental issues in Mongolia, a country with contrasting topography, extreme climate conditions and unique environmental setting.
Future applications of this study include detailed analysis of the presented maps for understanding the reasons of climate and environmental variations in Mongolia. Besides this, they can show correlations of the environmental factors with the contrasting topography of the country. Presented series of maps can assist in developing regional environmental studies of Mongolia and broadens understanding of the environmental and climate spatial diversity in various regions of the country [126,127] by continuing existing studies [128,129,130].
Funding
The APC was funded by the MDPI Geosciences Editorial Board by invitation for this article.
Institutional Review Board Statement
Not applicable.
Informed Consent Statement
Not applicable.
Data Availability Statement
Not applicable.
Acknowledgments
I am thankful to the three anonymous reviewers for careful reading of this paper and providing useful suggestions, remarks and critical comments that improved the earlier draft of this manuscript.
Conflicts of Interest
The author declares no conflict of interest.
Abbreviations
| CPT | Colour Palette Table |
| DCW | Digital Chart of the World |
| DSRAD | Downward Surface Shortwave Radiation |
| EOF | End of File |
| GEBCO | General Bathymetric Chart of the Oceans |
| GDAL | Geospatial Data Abstraction Library |
| GIS | Geographic Information System |
| GMT | Generic Mapping Tools |
| GRASS GIS | Geographic Resources Analysis Support System GIS |
| GUI | Graphical User Interface |
| IDL | Interactive Data Language |
| NetCDF | Network Common Data Form |
| PDSI | Palmer Drought Severity Index |
| QGIS | Quantum GIS |
| SAGA GIS | System for Automated Geoscientific Analyses GIS |
| SD | Standard Deviation |
| SWE | Snow Water Equivalent |
| VPD | Vapor Pressure Deficit |
| VAP | Vapor Pressure |
Appendix A. GMT Scripts for Topographic Map
Appendix A.1. GMT Script for Topographic Map, Figure 1

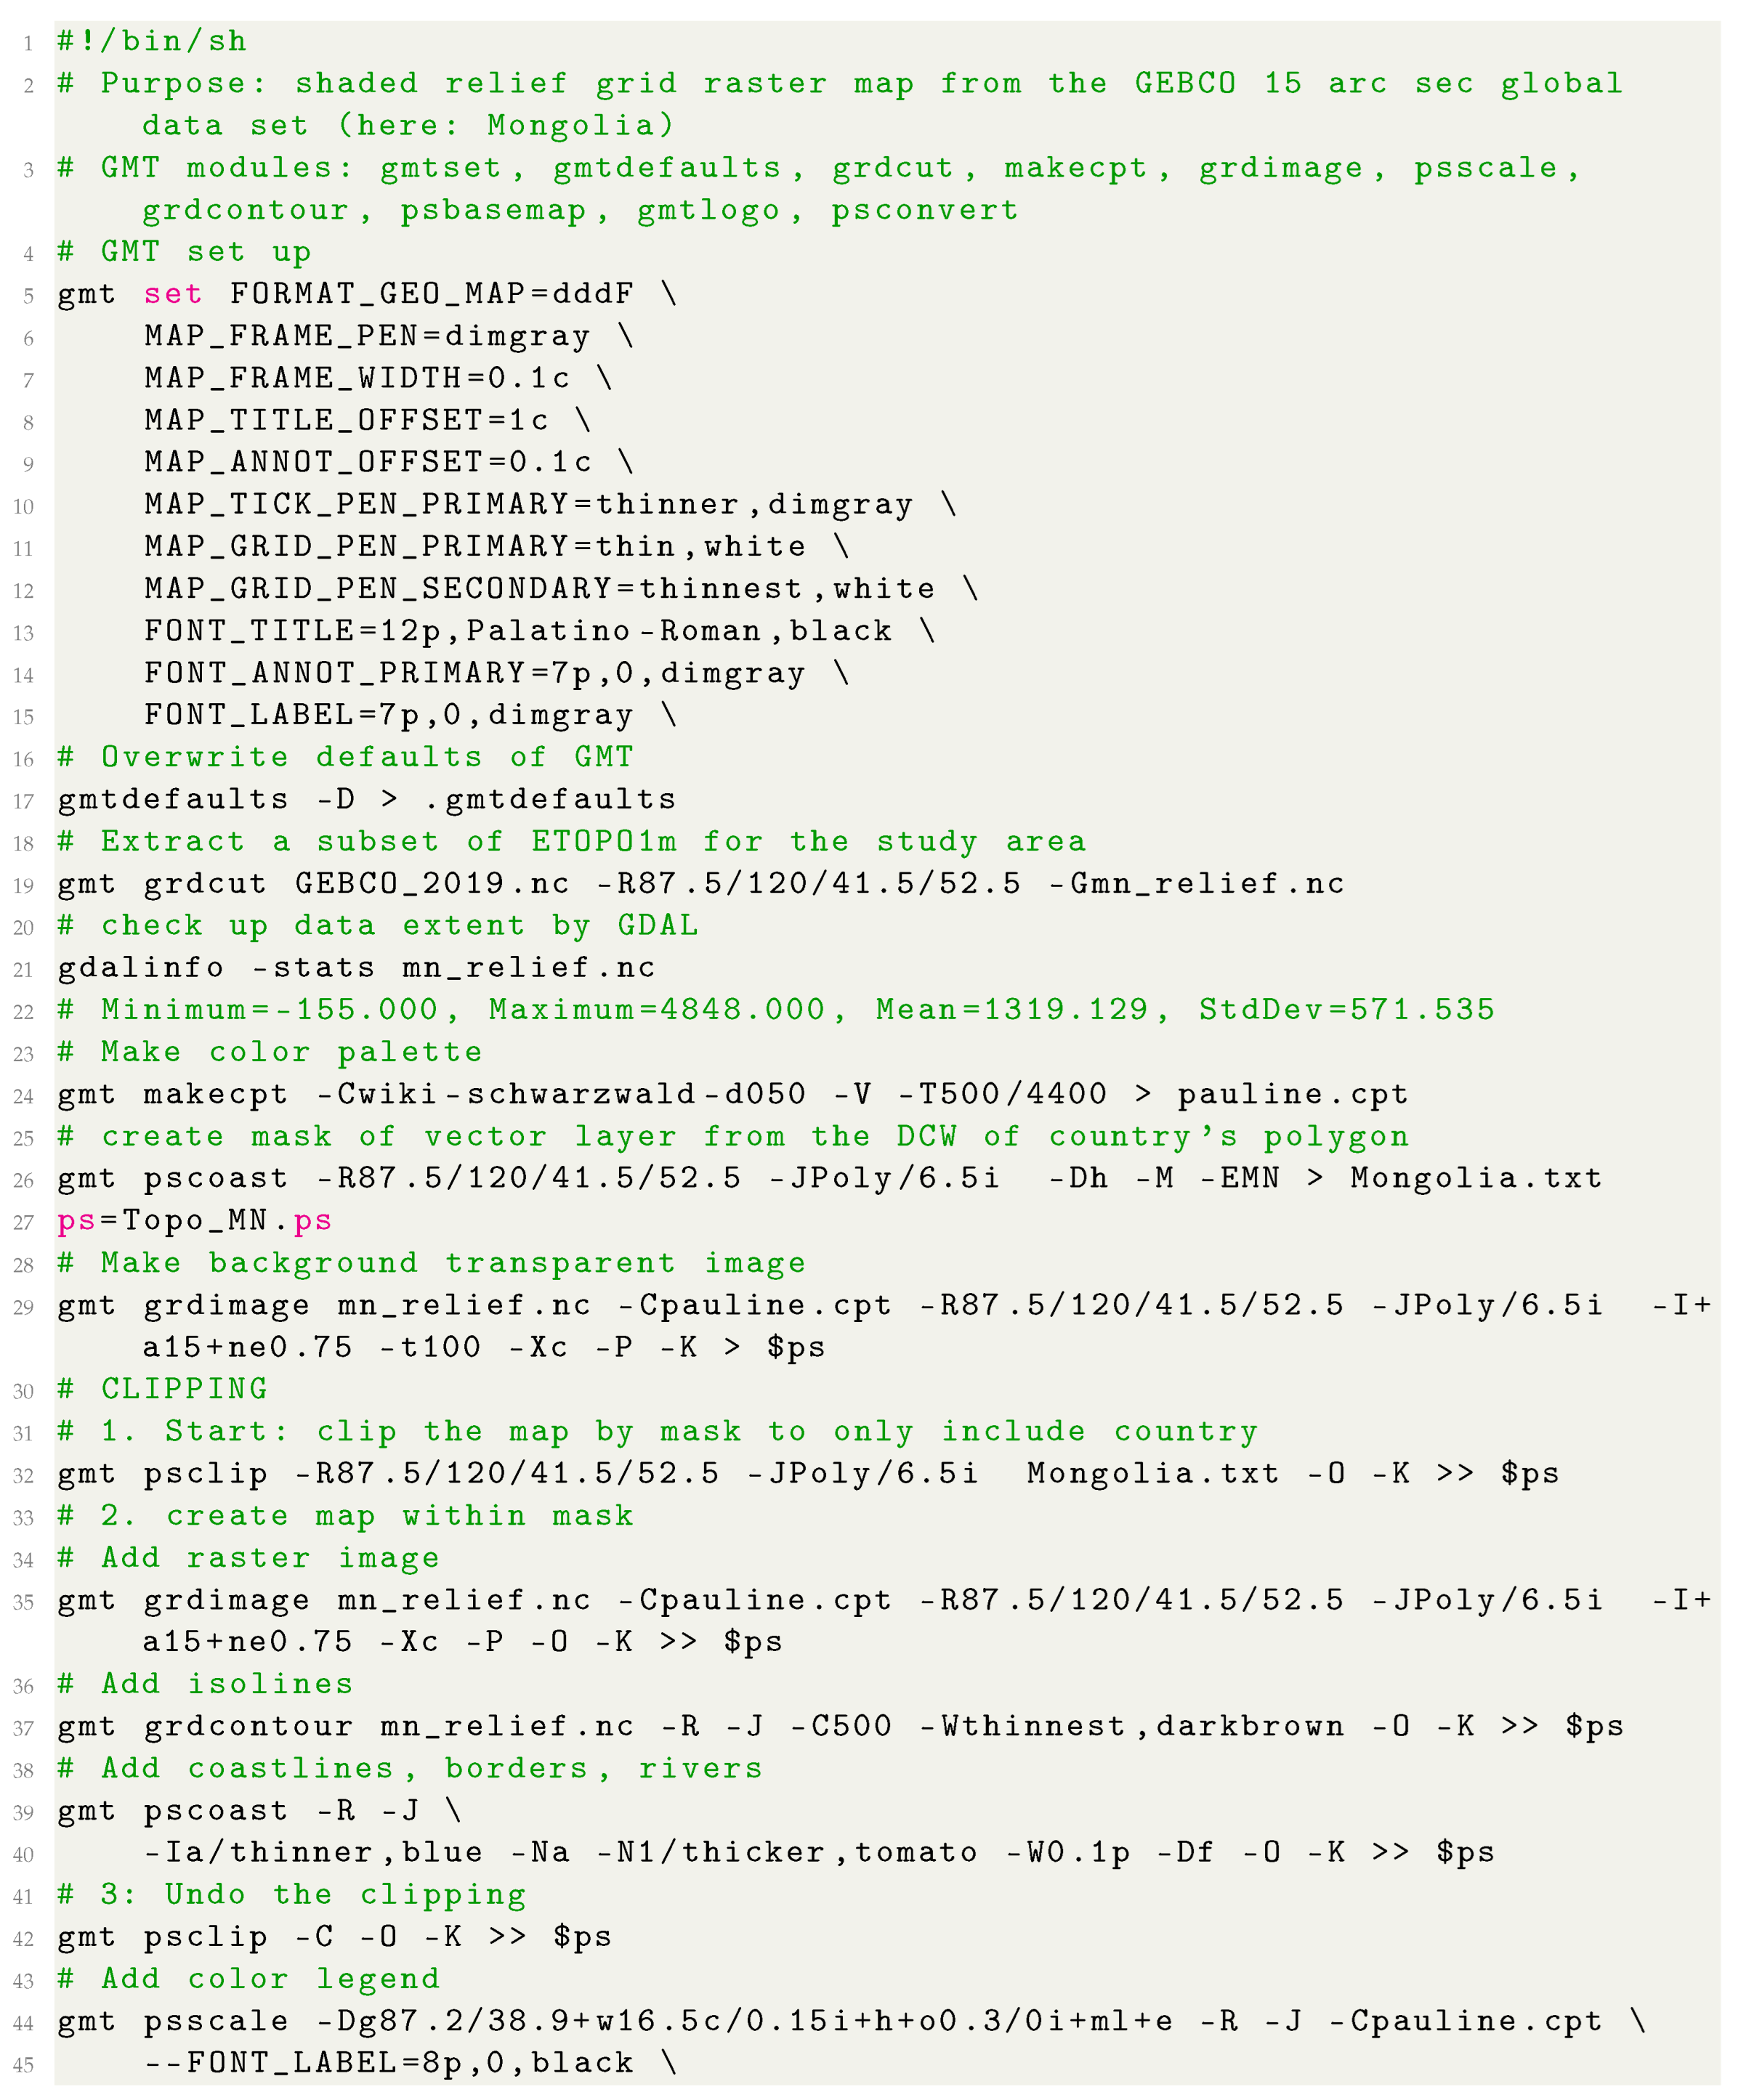
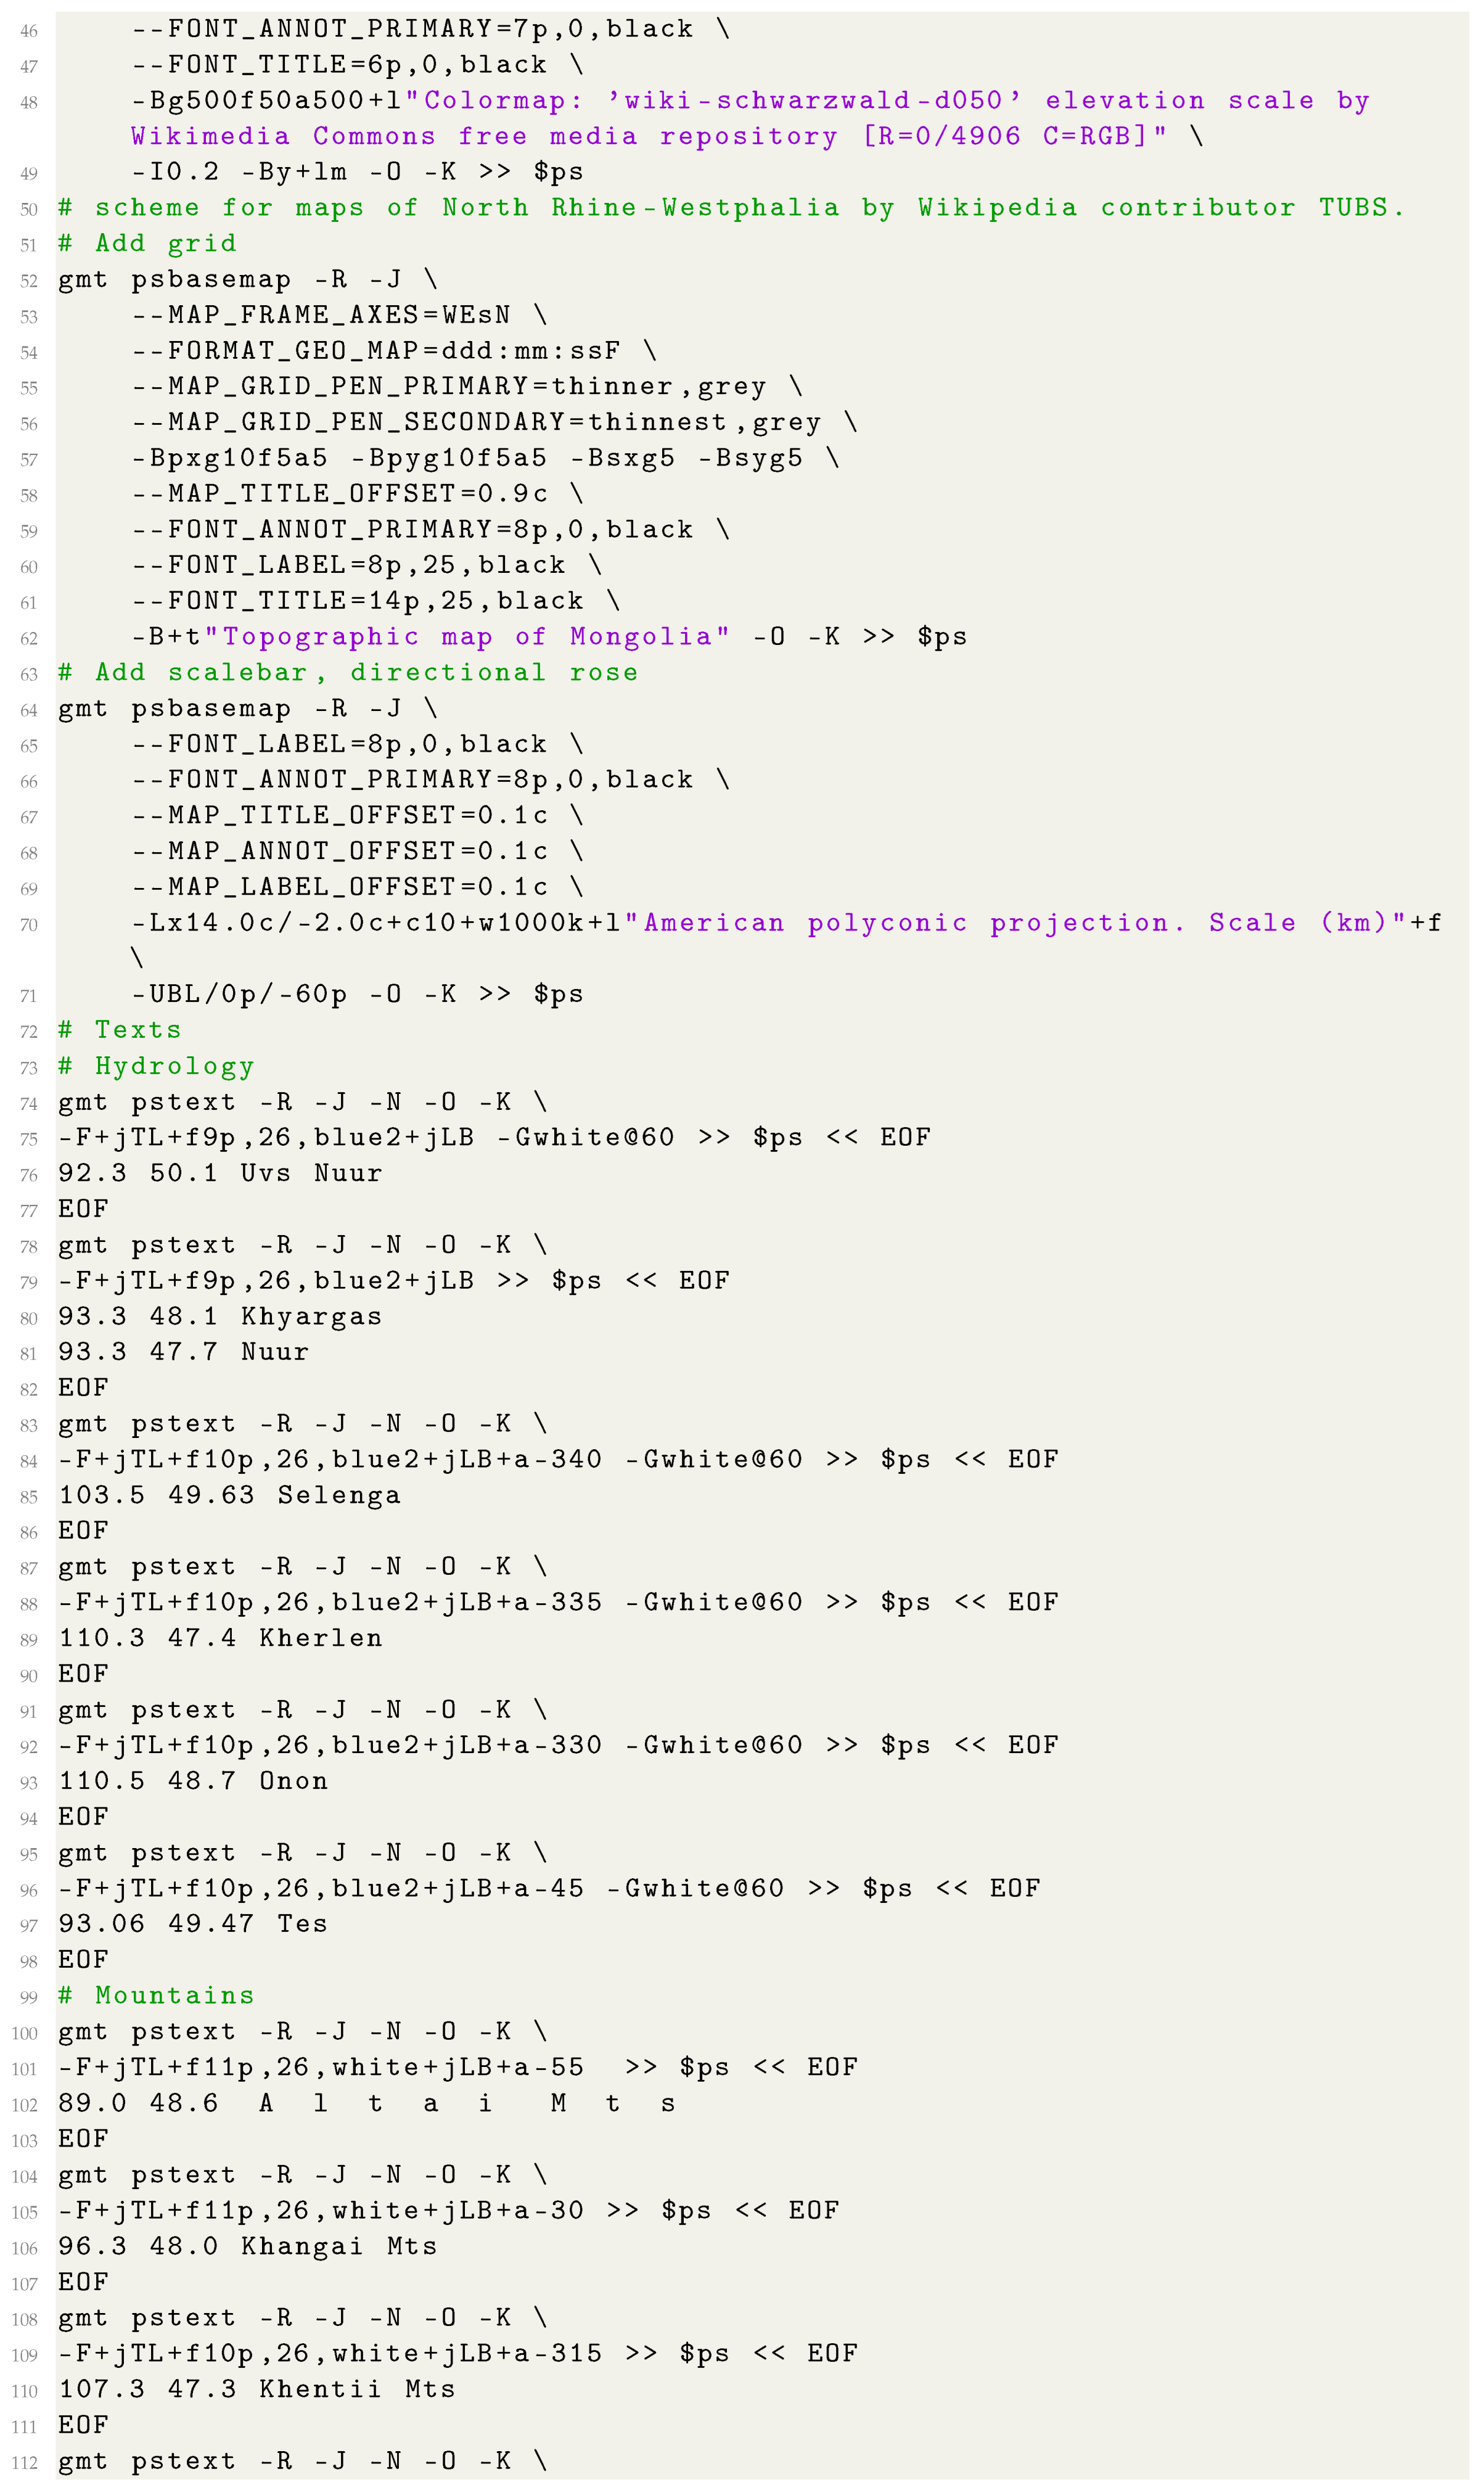
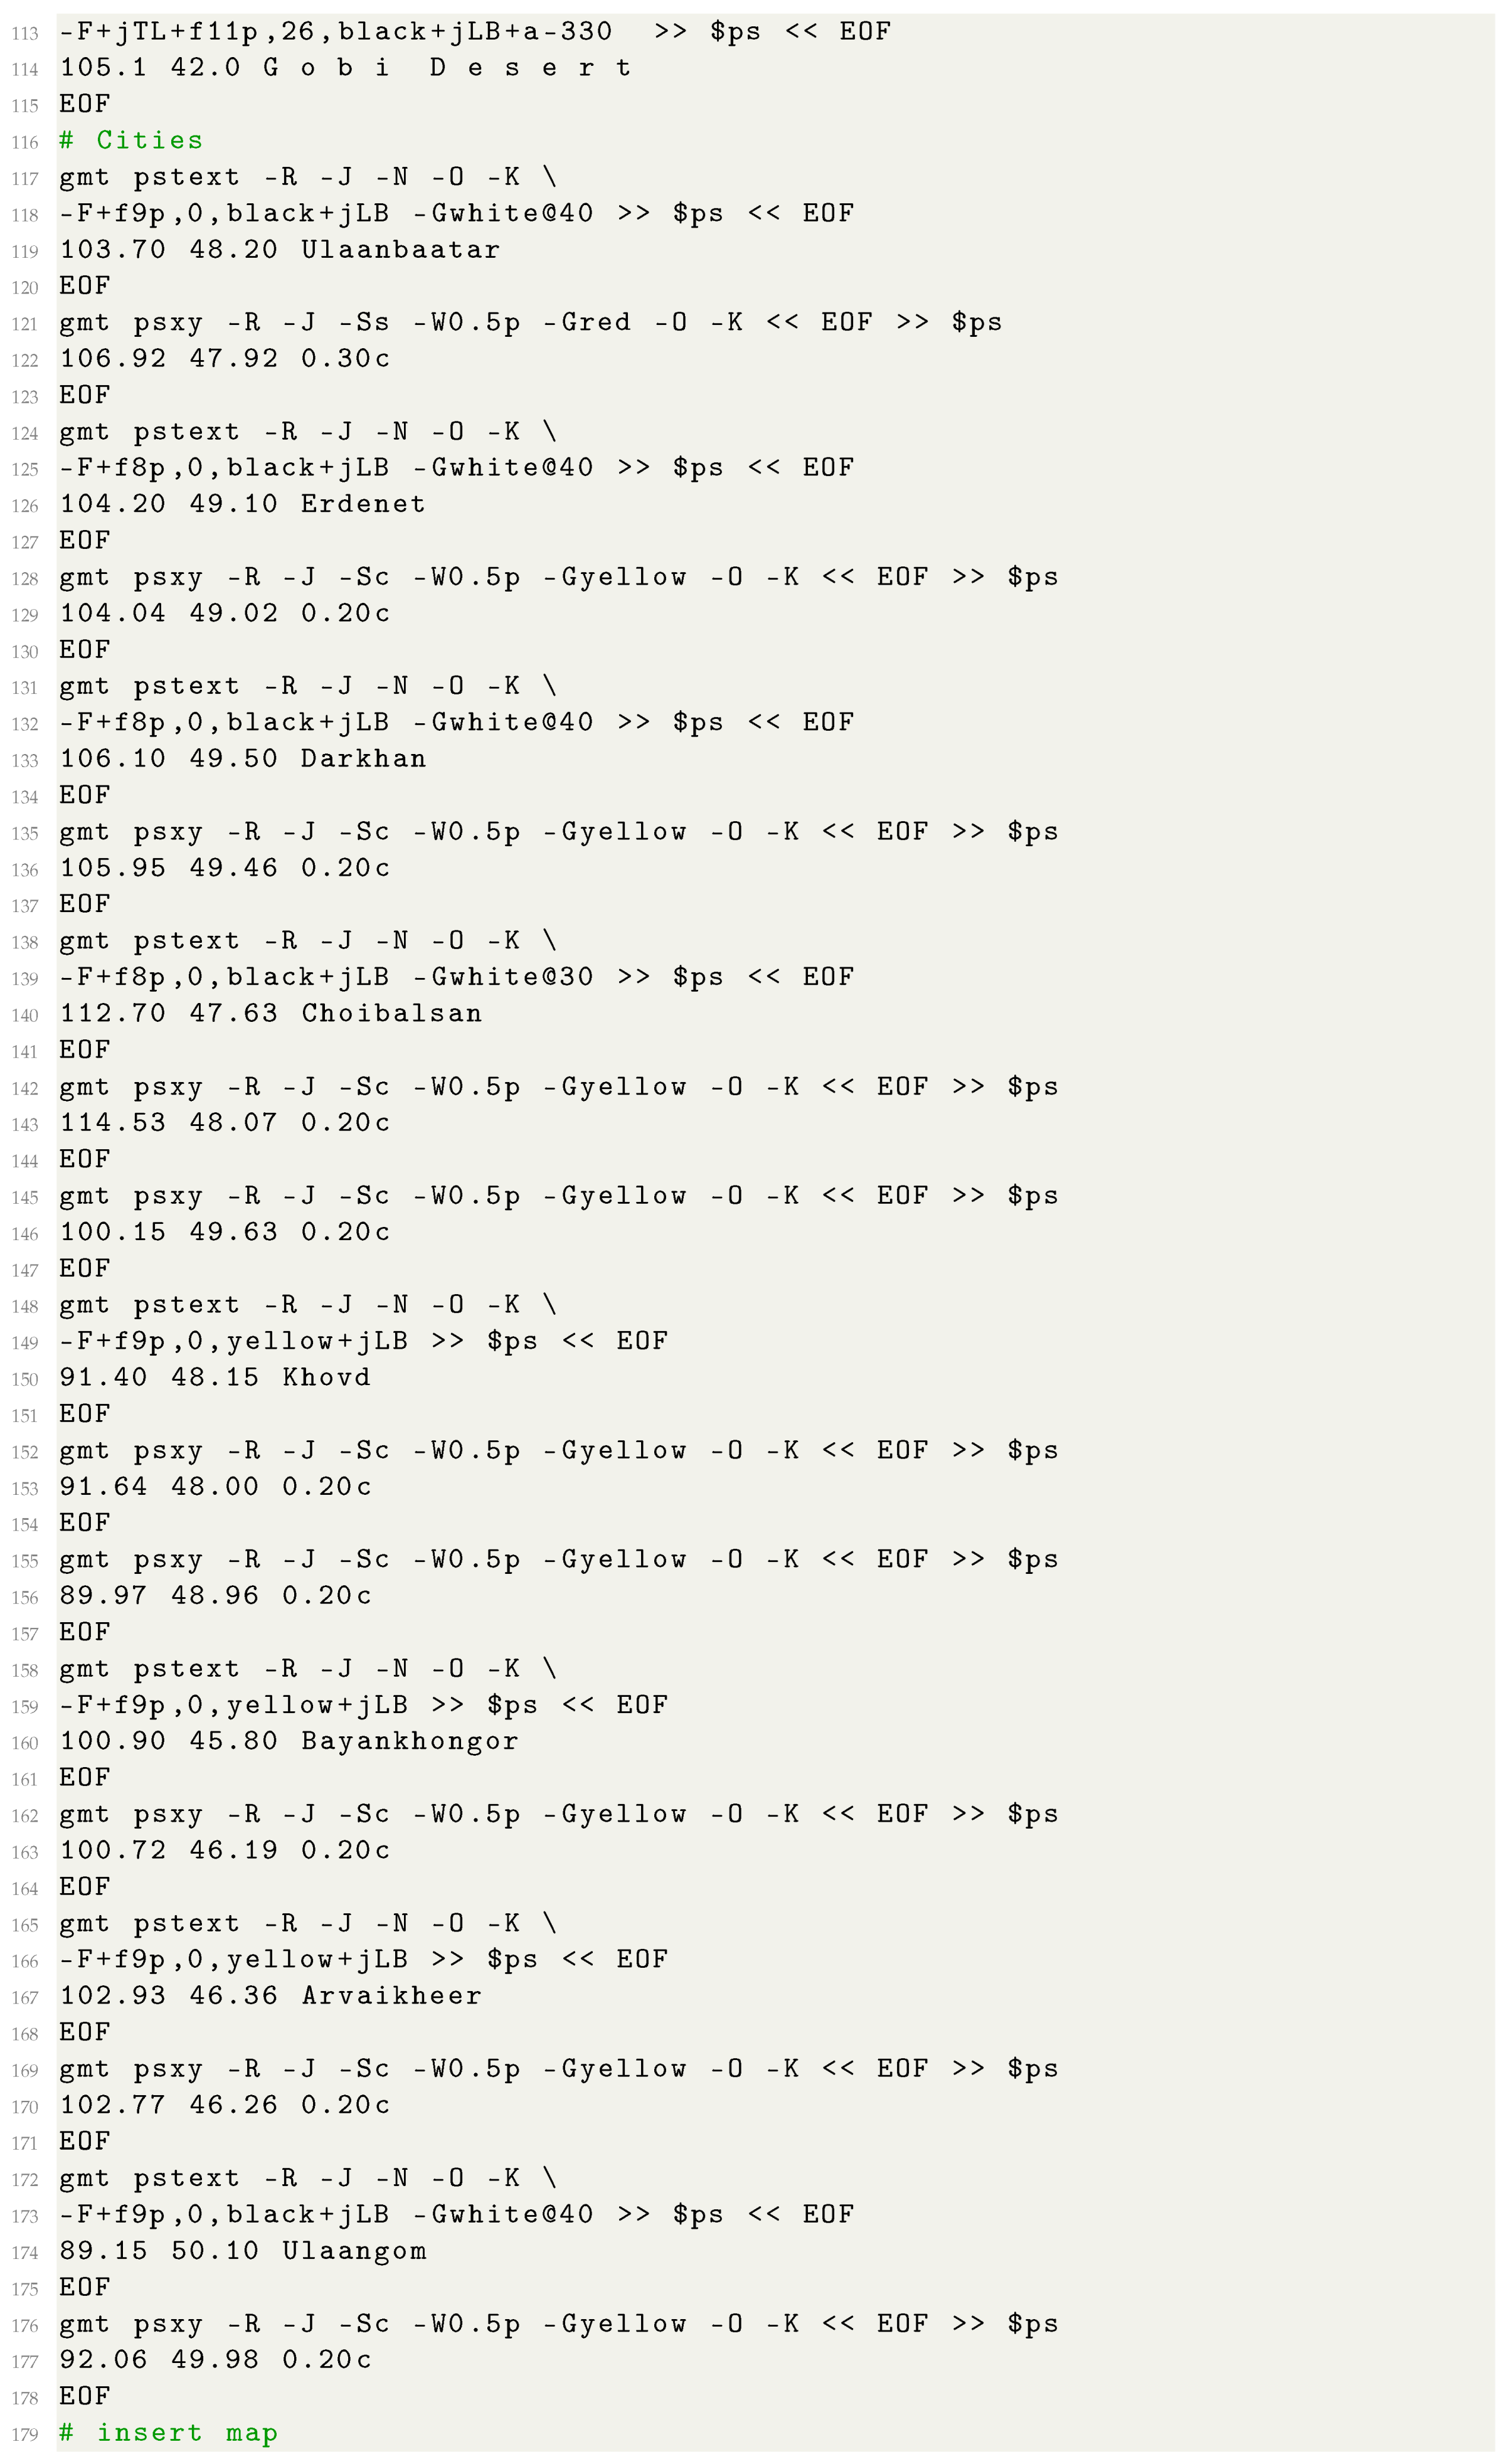
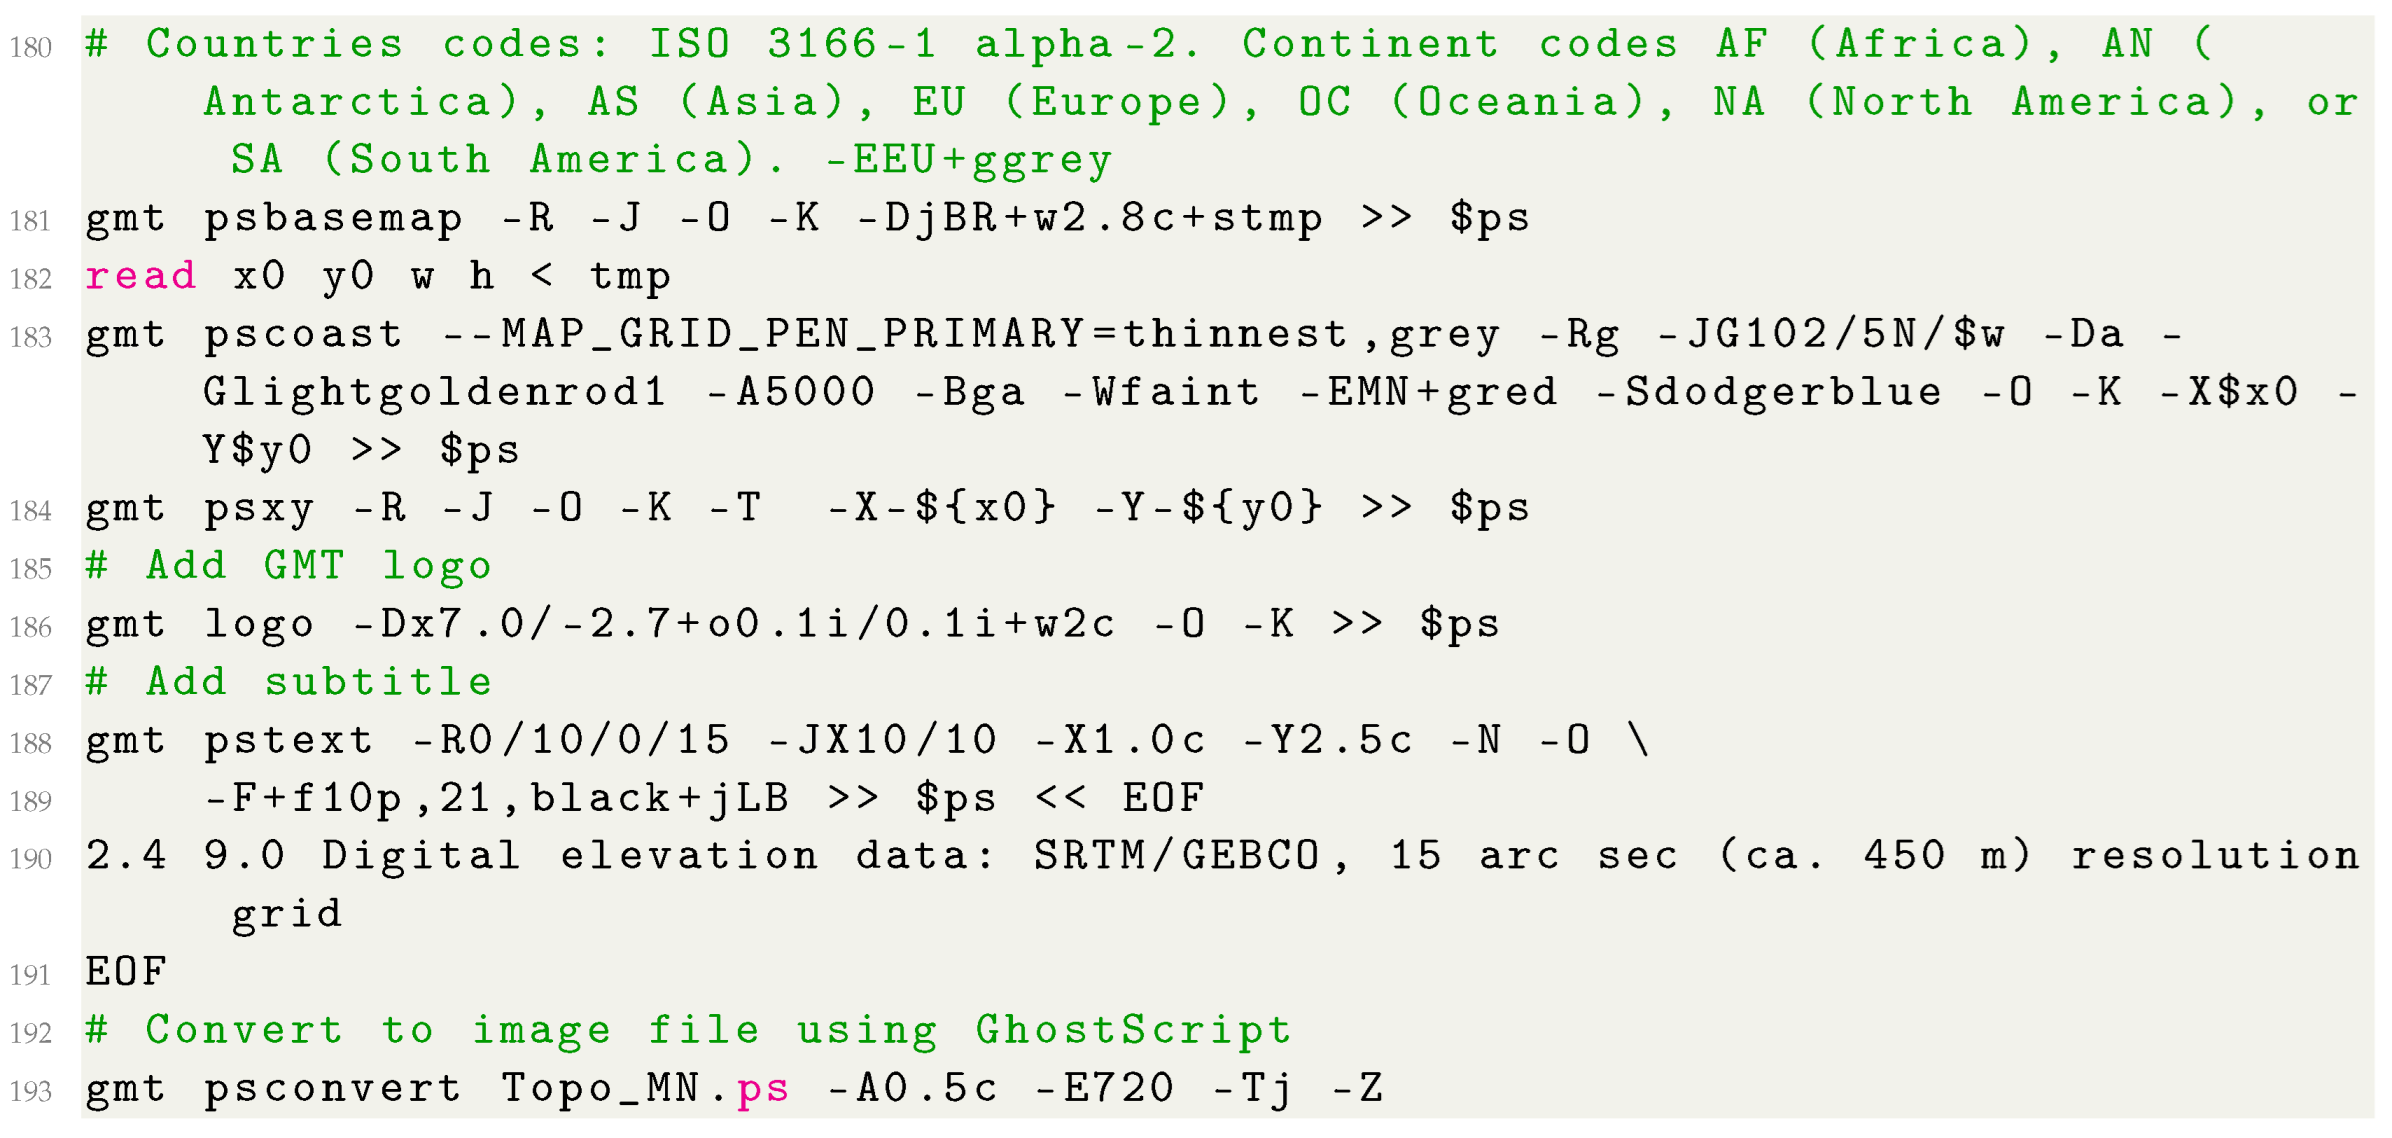
Listing A1: GMT code used for plotting Figure 1.
Listing A1: GMT code used for plotting Figure 1.
 |
 |
 |
 |
Appendix B. GMT Scripts for Climate Maps
Appendix B.1. GMT Script for Map in Figure 2: Average Minimal Temperature in Mongolia in 2019
Purpose: mapping TerraClimate datasets (here: Mongolia).
Listing A2: GMT code used for plotting Figure 2.
Listing A2: GMT code used for plotting Figure 2.
 |
 |
Appendix B.2. GMT Script for Map in Figure 3: Average Maximal Temperature in Mongolia in 04.2019
Listing A3: GMT code used for plotting Figure 3.
Listing A3: GMT code used for plotting Figure 3.
 |
 |
 |
Appendix B.3. GMT Script for Map in Figure 4: Wind Speed in Mongolia in 2019
Listing A4: GMT code used for plotting Figure 4.
Listing A4: GMT code used for plotting Figure 4.
 |
 |
Appendix B.4. GMT Script for Map in Figure 5: Soil Moisture in Mongolia in 2019
Listing A5: GMT code used for plotting Figure 5.
Listing A5: GMT code used for plotting Figure 5.
 |
 |
Appendix B.5. GMT Script for Map in Figure 6: Downward Surface Shortwave Radiation in Mongolia in 2019
Listing A6: GMT code used for plotting Figure 6.
Listing A6: GMT code used for plotting Figure 6.
 |
 |
Appendix B.6. GMT Script for Map in Figure 7: Snow Water Equivalent in Mongolia in 2019
Listing A7: GMT code used for plotting Figure 7.
Listing A7: GMT code used for plotting Figure 7.
 |
 |
Appendix B.7. GMT Script for Map in Figure 8: Vapor Pressure Deficit in Mongolia in 2019
Listing A8: GMT code used for plotting Figure 8.
Listing A8: GMT code used for plotting Figure 8.
 |
 |
Appendix B.8. GMT Script for Map in Figure 9: Vapor Pressure Anomaly in Mongolia in 2019
Listing A9: GMT code used for plotting Figure 9.
Listing A9: GMT code used for plotting Figure 9.
 |
 |
Appendix B.9. GMT Script for Map in Figure 10: Monthly Precipitation in Mongolia in 2019
Listing A10: GMT code used for plotting Figure 10.
Listing A10: GMT code used for plotting Figure 10.
 |
 |
Appendix B.10. GMT Script for Map in Figure 11: Palmer Drought Severity Index (PDSI) in Mongolia in 2019
Listing A11: GMT code used for plotting Figure 11.
Listing A11: GMT code used for plotting Figure 11.
 |
 |
References
- Dashkhuu, D.; Kim, J.P.; Chun, J.A.; Lee, W.S. Long-term trends in daily temperature extremes over Mongolia. Weather Clim. Extrem. 2015, 8, 26–33. [Google Scholar] [CrossRef] [Green Version]
- Natsagdorj, L.; Munkhbat, B.; Purevjav, G. Climate biocapacity of Mongolia and its change. Proc. Mong. Acad. Sci. 2019, 59, 54–70. [Google Scholar] [CrossRef]
- An, Q.; He, H.; Nie, Q.; Cui, Y.; Gao, J.; Wei, C.; Xie, X.; You, J. Spatial and Temporal Variations of Drought in Inner Mongolia, China. Water 2020, 12, 1715. [Google Scholar] [CrossRef]
- Sattler, D.N.; Bishkhorloo, B.; Graham, J.M. Climate change threatens nomadic herding in Mongolia: A model of climate change risk perception and behavioral adaptation. J. Environ. Psychol. 2021, 75, 101620. [Google Scholar] [CrossRef]
- Jiang, P.; Ding, W.; Yuan, Y.; Ye, W.; Mu, Y. Interannual variability of vegetation sensitivity to climate in China. J. Environ. Manag. 2022, 301, 113768. [Google Scholar] [CrossRef]
- Lemenkova, P. Dataset compilation by GRASS GIS for thematic mapping of Antarctica: Topographic surface, ice thickness, subglacial bed elevation and sediment thickness. Czech Polar Rep. 2021, 11, 67–85. [Google Scholar] [CrossRef]
- Dugerdil, L.; Ménot, G.; Peyron, O.; Jouffroy-Bapicot, I.; Ansanay-Alex, S.; Antheaume, I.; Behling, H.; Boldgiv, B.; Develle, A.L.; Grossi, V.; et al. Late Holocene Mongolian climate and environment reconstructions from brGDGTs, NPPs and pollen transfer functions for Lake Ayrag: Paleoclimate implications for Arid Central Asia. Quat. Sci. Rev. 2021, 273, 107235. [Google Scholar] [CrossRef]
- Dashtseren, A. Permafrost in Mongolia. In The Physical Geography of Mongolia; Springer International Publishing: Cham, Switzerland, 2021; pp. 119–133. [Google Scholar] [CrossRef]
- Tsedevdorj, S.O. Glaciers of Mongolia. In The Physical Geography of Mongolia; Springer International Publishing: Cham, Switzerland, 2021; pp. 101–117. [Google Scholar] [CrossRef]
- Blomdin, R.; Heyman, J.; Stroeven, A.P.; Hättestrand, C.; Harbor, J.M.; Gribenski, N.; Jansson, K.N.; Petrakov, D.A.; Ivanov, M.N.; Alexander, O.; et al. Glacial geomorphology of the Altai and Western Sayan Mountains, Central Asia. J. Maps 2016, 12, 123–136. [Google Scholar] [CrossRef]
- Otgonbayar, M.; Atzberger, C.; Chambers, J.; Amarsaikhan, D.; Böck, S.; Tsogtbayar, J. Land Suitability Evaluation for Agricultural Cropland in Mongolia Using the Spatial MCDM Method and AHP Based GIS. J. Geosci. Environ. Prot. 2017, 5, 238–263. [Google Scholar] [CrossRef] [Green Version]
- Lemenkova, P. SAGA GIS for Computing Multispectral Vegetation Indices by Landsat TM for Mapping Vegetation Greenness. Contemp. Agric. 2021, 70, 67–75. [Google Scholar] [CrossRef]
- Munkhtur, P.; Erdenedalai, A. Assessment of Natural Resource Potential of the Landscape of Mongolia (Based on Agricultural Production Resource). Proc. Mong. Acad. Sci. 2020, 60, 28–42. [Google Scholar] [CrossRef]
- Erdenebaatar, N.; Damdinsuren, A. Geographical analysis of forest types based on a digital elevation model generated from synthetic aperture radar. Proc. Mong. Acad. Sci. 2020, 60, 43–54. [Google Scholar] [CrossRef]
- Wang, S.; Li, R.; Wu, Y.; Zhao, S. Vegetation dynamics and their response to hydrothermal conditions in Inner Mongolia, China. Glob. Ecol. Conserv. 2022, 34, e02034. [Google Scholar] [CrossRef]
- O’Gorman, K.; Thompson, K. Tourism and culture in Mongolia: The case of the Ulaanbaatar Nadaam. In Tourism and Indigenous Peoples; Butler, R., Hinch, T., Eds.; Butterworth-Heinemann: Oxford, UK, 2007; Chapter 12; pp. 161–175. [Google Scholar] [CrossRef]
- Buckley, R.; Ollenburg, C.; Zhong, L. Cultural landscape in mongolian tourism. Ann. Tour. Res. 2008, 35, 47–61. [Google Scholar] [CrossRef] [Green Version]
- Gantemur, D. Nomadic tourism: Stakeholder collaboration management for tourism development in Mongolia. Proc. Mong. Acad. Sci. 2020, 60, 59–72. [Google Scholar] [CrossRef]
- Klaučo, M.; Gregorová, B.; Koleda, P.; Stankov, U.; Marković, V.; Lemenkova, P. Land planning as a support for sustainable development based on tourism: A case study of Slovak Rural Region. Environ. Eng. Manag. J. 2017, 2, 449–458. [Google Scholar] [CrossRef]
- Fan, P.; Chen, J.; John, R. Urbanization and environmental change during the economic transition on the Mongolian Plateau: Hohhot and Ulaanbaatar. Environ. Res. 2016, 144, 96–112. [Google Scholar] [CrossRef] [Green Version]
- Khishigdorj, D.; Tseyenkhand, P. Implications of rural settlement patterns for development. Proc. Mong. Acad. Sci. 2019, 59, 14–20. [Google Scholar] [CrossRef]
- Oyunjargal, D.; Byambatseren, C. The effects of environmental issues on residential house price (in the case of Ulaanbaatar city). Proc. Mong. Acad. Sci. 2018, 58, 117–130. [Google Scholar] [CrossRef]
- Samdandorj, M.; Ts, P. Geospatial modeling approaches for mapping topsoil organic carbon stock in northern part of Mongolia. Proc. Mong. Acad. Sci. 2019, 59, 4–17. [Google Scholar] [CrossRef]
- Kolář, T.; Kusbach, A.; Čermák, P.; Štěrba, T.; Batkhuu, E.; Rybníček, M. Climate and wildfire effects on radial growth of Pinus sylvestris in the Khan Khentii Mountains, north-central Mongolia. J. Arid Environ. 2020, 182, 1–10. [Google Scholar] [CrossRef]
- Lemenkova, P. Sentinel-2 for High Resolution Mapping of Slope-Based Vegetation Indices Using Machine Learning by SAGA GIS. Transylv. Rev. Syst. Ecol. Res. 2020, 22, 17–34. [Google Scholar] [CrossRef]
- Meng, F.; Luo, M.; Sa, C.; Wang, M.; Bao, Y. Quantitative assessment of the effects of climate, vegetation, soil and groundwater on soil moisture spatiotemporal variability in the Mongolian Plateau. Sci. Total Environ. 2022, 809, 152198. [Google Scholar] [CrossRef] [PubMed]
- Guo, D.; Song, X.; Hu, R.; Cai, S.; Zhu, X.; Hao, Y. Grassland type-dependent spatiotemporal characteristics of productivity in Inner Mongolia and its response to climate factors. Sci. Total Environ. 2021, 775, 145644. [Google Scholar] [CrossRef]
- Lemenkova, P. SAGA GIS for information extraction on presence and conditions of vegetation of northern coast of Iceland based on the Landsat TM. Acta Biol. Marisiensis 2020, 3, 10–21. [Google Scholar] [CrossRef]
- Lehmkuhl, F.; Nottebaum, V.; Hülle, D. Aspects of late Quaternary geomorphological development in the Khangai Mountains and the Gobi Altai Mountains (Mongolia). Geomorphology 2018, 312, 24–39. [Google Scholar] [CrossRef]
- Lehmkuhl, F. Holocene glaciers in the Mongolian Altai: An example from the Turgen–Kharkhiraa Mountains. J. Asian Earth Sci. 2012, 52, 12–20. [Google Scholar] [CrossRef]
- Luo, M.; Meng, F.; Sa, C.; Duan, Y.; Bao, Y.; Liu, T.; De Maeyer, P. Response of vegetation phenology to soil moisture dynamics in the Mongolian Plateau. Catena 2021, 206, 105505. [Google Scholar] [CrossRef]
- Bao, G.; Liu, Y.; Liu, N.; Linderholm, H.W. Drought variability in eastern Mongolian Plateau and its linkages to the large-scale climate forcing. Clim. Dyn. 2015, 44, 717–733. [Google Scholar] [CrossRef]
- Chen, J.; Dong, G.; Chen, J.; Jiang, S.; Qu, L.; Legesse, T.G.; Zhao, F.; Tong, Q.; Shao, C.; Han, X. Energy balance and partitioning over grasslands on the Mongolian Plateau. Ecol. Indic. 2022, 135, 108560. [Google Scholar] [CrossRef]
- Zemmrich, A. The classification of Mongolias steppes from the view of Russian and Mongolian geobotany. Arch. Nat. Conserv. Landsc. Res. 2005, 44, 17–35. [Google Scholar]
- Li, G.; Yu, Z.; Wang, W.; Ju, Q.; Chen, X. Analysis of the spatial Distribution of precipitation and topography with GPM data in the Tibetan Plateau. Atmos. Res. 2021, 247, 105259. [Google Scholar] [CrossRef]
- Luo, D.; Jin, H.; Bense, V.F. Ground surface temperature and the detection of permafrost in the rugged topography on NE Qinghai-Tibet Plateau. Geoderma 2019, 333, 57–68. [Google Scholar] [CrossRef]
- Rahman, K.U.; Shang, S. Performance assessment of merged multisatellite precipitation datasets over diverse climate and complex topography. In Precipitation Science; Michaelides, S., Ed.; Elsevier: Amsterdam, The Netherlands, 2022; Chapter 14; pp. 391–420. [Google Scholar] [CrossRef]
- Saavedra, M.; Junquas, C.; Espinoza, J.C.; Silva, Y. Impacts of topography and land use changes on the air surface temperature and precipitation over the central Peruvian Andes. Atmos. Res. 2020, 234, 104711. [Google Scholar] [CrossRef]
- Lei, H.; Li, H.; Zhao, H.; Ao, T.; Li, X. Comprehensive evaluation of satellite and reanalysis precipitation products over the eastern Tibetan plateau characterized by a high diversity of topographies. Atmos. Res. 2021, 259, 105661. [Google Scholar] [CrossRef]
- Dai, Y.; Tian, L.; Zhu, P.; Dong, Z.; Zhang, R. Dynamic aeolian erosion evaluation and ecological service assessment in Inner Mongolia, northern China. Geoderma 2022, 406, 115518. [Google Scholar] [CrossRef]
- Xu, J.; Xiao, Y.; Xie, G.; Wang, Y.; Zhen, L.; Zhang, C.; Jiang, Y. Interregional ecosystem services benefits transfer from wind erosion control measures in Inner Mongolia. Environ. Dev. 2020, 34, 100496. [Google Scholar] [CrossRef]
- Lyu, X.; Li, X.; Wang, H.; Gong, J.; Li, S.; Dou, H.; Dang, D. Soil wind erosion evaluation and sustainable management of typical steppe in Inner Mongolia, China. J. Environ. Manag. 2021, 277, 111488. [Google Scholar] [CrossRef]
- Otgontuya, L.; Elmarsdottir, A.; Lkhagvajav, N.; Munkhbat, C. Influence of different grazing intensity on above-ground biomass in Mongolian rangeland. Proc. Mong. Acad. Sci. 2019, 59, 29–38. [Google Scholar] [CrossRef]
- Addison, J.; Davies, J.; Friedel, M.; Brown, C. Do pasture user groups lead to improved rangeland condition in the Mongolian Gobi Desert? J. Arid Environ. 2013, 94, 37–46. [Google Scholar] [CrossRef]
- Klaučo, M.; Gregorová, B.; Stankov, U.; Marković, V.; Lemenkova, P. Determination of ecological significance based on geostatistical assessment: A case study from the Slovak Natura 2000 protected area. Open Geosci. 2013, 5, 28–42. [Google Scholar] [CrossRef]
- Lemenkova, P. The visualization of geophysical and geomorphologic data from the area of Weddell Sea by the Generic Mapping Tools. Stud. Quat. 2021, 38, 19–32. [Google Scholar] [CrossRef]
- Bumtsend, B.; Munkhtur, P.; Erdenedalai, A. Assessment of Eco-geomorphological potential of Mongolia. Proc. Mong. Acad. Sci. 2020, 60, 1–16. [Google Scholar] [CrossRef]
- Yu, K.; Lehmkuhl, F.; Schlütz, F.; Diekmann, B.; Mischke, S.; Grunert, J.; Murad, W.; Nottebaum, V.; Stauch, G.; Zeeden, C. Late Quaternary environments in the Gobi Desert of Mongolia: Vegetation, hydrological, and palaeoclimate evolution. Palaeogeogr. Palaeoclimatol. Palaeoecol. 2019, 514, 77–91. [Google Scholar] [CrossRef]
- Xu, Y.; Zhang, Y.; Chen, J. Migration under economic transition and changing climate in Mongolia. J. Arid Environ. 2021, 185, 104333. [Google Scholar] [CrossRef]
- Tugjamba, N.; Walkerden, G. Traditional and modern ecosystem services thinking in nomadic Mongolia: Framing differences, common concerns, and ways forward. Ecosyst. Serv. 2021, 51, 101360. [Google Scholar] [CrossRef]
- Feng, A.; Chao, Q. An overview of assessment methods and analysis for climate change risk in China. Phys. Chem. Earth Parts A/B/C 2020, 117, 102861. [Google Scholar] [CrossRef]
- Wang, J.; Nathan, R.; Horne, A.; Peel, M.C.; Wei, Y.; Langford, J. Evaluating four downscaling methods for assessment of climate change impact on ecological indicators. Environ. Model. Softw. 2017, 96, 68–82. [Google Scholar] [CrossRef]
- Guo, H.; Wang, R.; Garfin, G.M.; Zhang, A.; Lin, D.; Liang, Q.; Wang, J. Rice drought risk assessment under climate change: Based on physical vulnerability a quantitative assessment method. Sci. Total Environ. 2021, 751, 141481. [Google Scholar] [CrossRef]
- Bolortsetseg, B.; Tuvaansuren, G. The potential impacts of climate change on pasture and cattle production in Mongolia. Water Air Soil Pollut. 1996, 92, 95–105. [Google Scholar] [CrossRef]
- Sasaki, T.; Nambu, M.; Iwachido, Y.; Yoshihara, Y.; Batdelger, G.; Kinugasa, T. Responses of plant productivity and carbon fluxes to short-term experimental manipulations of climate change and species loss in a Mongolian grassland. J. Arid Environ. 2022, 198, 104690. [Google Scholar] [CrossRef]
- Tugjamba, N.; Walkerden, G.; Miller, F. Climate change impacts on nomadic herders’ livelihoods and pastureland ecosystems: A case study from Northeast Mongolia. Reg. Environ. Chang. 2021, 21, 105. [Google Scholar] [CrossRef]
- Chuluun, T.; Altanbagana, M.; Ojima, D.; Tsolmon, R.; Suvdantsetseg, B. Vulnerability of Pastoral Social-Ecological Systems in Mongolia. In Rethinking Resilience, Adaptation and Transformation in a Time of Change; Springer: Cham, Switzerland, 2017; pp. 73–88. [Google Scholar] [CrossRef]
- Maasri, A.; Gelhaus, J. Stream invertebrate communities of Mongolia: Current structure and expected changes due to climate change. Aquat. Biosyst. 2012, 8, 18. [Google Scholar] [CrossRef] [PubMed] [Green Version]
- Han, J.; Dai, H.; Gu, Z. Sandstorms and desertification in Mongolia, an example of future climate events: A review. Environ. Chem. Lett. 2021, 19, 4063–4073. [Google Scholar] [CrossRef]
- Nyamtseren, M.; Feng, Q.; Deo, R. A Comparative Study of Temperature and Precipitation-Based Aridity Indices and Their Trends in Mongolia. Int. J. Environ. Res. 2018, 12, 887–899. [Google Scholar] [CrossRef]
- Jie, W.; Xiao, C.; Zhang, C.; Zhang, E.; Li, J.; Wang, B.; Niu, H.; Dong, S. Remote sensing-based dynamic monitoring and environmental change of wetlands in southern Mongolian Plateau in 2000–2018. China Geol. 2021, 4, 353–363. [Google Scholar] [CrossRef]
- Luo, R.; Zhang, B.; Gao, J.; Wang, Z. Impacts of Climate Change on Corn Production in Inner Mongolia, China. In Proceedings of the 2010 International Conference on Multimedia Technology, Ningbo, China, 29–31 October 2010; pp. 1–4. [Google Scholar] [CrossRef]
- Bao, H.; Wang, X.; Zhang, W. Relationship between the vegetation types and topographical factors from Wula mountain, Inner Mongolia: Based on ALOS data. In Proceedings of the 2011 International Conference on Remote Sensing, Environment and Transportation Engineering, Nanjing, China, 24–26 June 2011; pp. 2358–2362. [Google Scholar] [CrossRef]
- Unkelbach, J.; Dulamsuren, C.; Behling, H. Late Holocene climate and land-use history in the Mongolian Altai Mountains: Combined evidence from palynological, macro-charcoal and tree-ring analyses. Trees For. People 2021, 4, 100073. [Google Scholar] [CrossRef]
- Unkelbach, J.; Dulamsuren, C.; Klinge, M.; Behling, H. Holocene high-resolution forest-steppe and environmental dynamics in the Tarvagatai Mountains, north-central Mongolia, over the last 9570 cal yr BP. Quat. Sci. Rev. 2021, 266, 107076. [Google Scholar] [CrossRef]
- Minderlein, S.; Menzel, L. Evapotranspiration and energy balance dynamics of a semi-arid mountainous steppe and shrubland site in Northern Mongolia. Environ. Earth Sci. 2015, 73, 593–609. [Google Scholar] [CrossRef]
- Wang, G.; Luo, Z.; Huang, Y.; Xia, X.; Wei, Y.; Lin, X.; Sun, W. Preseason heat requirement and days of precipitation jointly regulate plant phenological variations in Inner Mongolian grassland. Agric. For. Meteorol. 2022, 314, 108783. [Google Scholar] [CrossRef]
- Liu, Y.; You, C.; Zhang, Y.; Chen, S.; Zhang, Z.; Li, J.; Wu, Y. Resistance and resilience of grasslands to drought detected by SIF in inner Mongolia, China. Agric. For. Meteorol. 2021, 308–309, 108567. [Google Scholar] [CrossRef]
- Gradel, A.; Haensch, C.; Ganbaatar, B.; Dovdondemberel, B.; Nadaldorj, O.; Günther, B. Response of white birch (Betula platyphylla Sukaczev) to temperature and precipitation in the mountain forest steppe and taiga of northern Mongolia. Dendrochronologia 2017, 41, 24–33. [Google Scholar] [CrossRef]
- Dulamsuren, C.; Welk, E.; Jäger, E.J.; Hauck, M.; Mühlenberg, M. Range-habitat relationships of vascular plant species at the taiga forest-steppe borderline in the western Khentey Mountains, northern Mongolia. Flora Morphol. Distrib. Funct. Ecol. Plants 2005, 200, 376–397. [Google Scholar] [CrossRef]
- Klinge, M.; Schneider, F.; Li, Y.; Frechen, M.; Sauer, D. Variations in geomorphological dynamics in the northern Khangai Mountains, Mongolia, since the Late Glacial period. Geomorphology 2022, 401, 108113. [Google Scholar] [CrossRef]
- Wessel, P.; Luis, J.F.; Uieda, L.; Scharroo, R.; Wobbe, F.; Smith, W.H.F.; Tian, D. The Generic Mapping Tools version 6. Geochem. Geophys. Geosyst. 2019, 20, 5556–5564. [Google Scholar] [CrossRef] [Green Version]
- Lemenkova, P. GMT Based Comparative Analysis and Geomorphological Mapping of the Kermadec and Tonga Trenches, Southwest Pacific Ocean. Geogr. Tech. 2019, 14, 39–48. [Google Scholar] [CrossRef] [Green Version]
- Kasalica, V.; Lamprecht, A.L. Automated composition of scientific workflows: A case study on geographic data manipulation. In Proceedings of the 2018 IEEE 14th International Conference on e-Science (e-Science), Amsterdam, The Netherlands, 29 October–1 November 2018; pp. 362–363. [Google Scholar] [CrossRef]
- Lemenkova, P. Mapping topographic, geophysical and gravimetry data of Pakistan—A contribution to geological understanding of Sulaiman Fold Belt and Muslim Bagh Ophiolite Complex. Geophysica 2021, 56, 3–26. [Google Scholar] [CrossRef]
- Spinellis, D. Drawing Tools. IEEE Softw. 2009, 26, 12–13. [Google Scholar] [CrossRef]
- Lemenkova, P. Geodynamic setting of Scotia Sea and its effects on geomorphology of South Sandwich Trench, Southern Ocean. Pol. Polar Res. 2021, 42, 1–23. [Google Scholar] [CrossRef]
- Virden, W.; Habermann, T.; Glover, G.; Divins, D.; Sharman, G.; Fox, C. Multibeam bathymetric data at NOAA/NGDC. In Proceedings of the Oceans ’04 MTS/IEEE Techno-Ocean ’04 (IEEE Cat. No. 04CH37600), Kobe, Japan, 9–12 November 2004; Volume 2, pp. 1159–1162. [Google Scholar] [CrossRef]
- Tsutsumida, N.; Saizen, I.; Matsuoka, M.; Ishii, R. Addressing urban expansion using feature-oriented spatial data in a peripheral area of Ulaanbaatar, Mongolia. Habitat Int. 2015, 47, 196–204. [Google Scholar] [CrossRef] [Green Version]
- Lemenkova, P. NOAA Marine Geophysical Data and a GEBCO Grid for the Topographical Analysis of Japanese Archipelago by Means of GRASS GIS and GDAL Library. Geomat. Environ. Eng. 2020, 14, 25–45. [Google Scholar] [CrossRef]
- Amarsaikhan, D.; Blotevogel, H.H.; Ganzorig, M.; Moon, T.H. Applications of remote sensing and geographic information systems for urban land-cover change studies in Mongolia. Geocarto Int. 2009, 24, 257–271. [Google Scholar] [CrossRef]
- Nakayama, T.; Wang, Q.; Okadera, T. Evaluation of spatio-temporal variations in water availability using a process-based eco-hydrology model in arid and semi-arid regions of Mongolia. Ecol. Model. 2021, 440, 109404. [Google Scholar] [CrossRef]
- Lemenkova, P. GRASS GIS for topographic and geophysical mapping of the Peru-Chile Trench. Forum Geogr. 2020, 19, 143–157. [Google Scholar] [CrossRef]
- Park, H.; Fan, P.; John, R.; Ouyang, Z.; Chen, J. Spatiotemporal changes of informal settlements: Ger districts in Ulaanbaatar, Mongolia. Landsc. Urban Plan. 2019, 191, 103630. [Google Scholar] [CrossRef]
- O’Sullivan, R. Movement across a ‘mountain barrier’: Mapping accessibility with rock-art and GIS in the Altai Mountains, Eastern Eurasia. J. Archaeol. Sci. Rep. 2019, 27, 101979. [Google Scholar] [CrossRef]
- Tuvshin, G.; Khosbayar, T.; Davaadorj, D. The methodology of studying changes in the Gobi region’s lake area. Proc. Mong. Acad. Sci. 2018, 58, 28–39. [Google Scholar] [CrossRef]
- Lemenkova, P. Fractal surfaces of synthetical DEM generated by GRASS GIS module r.surf.fractal from ETOPO1 raster grid. J. Geod. Geoinf. 2020, 7, 86–102. [Google Scholar] [CrossRef]
- Lemenkova, P. Evaluating land cover types from Landsat TM using SAGA GIS for vegetation mapping based on ISODATA and K-means clustering. Acta Agric. Serbica 2021, 26, 159–165. [Google Scholar] [CrossRef]
- Holguín, L.R.; Sternberg, T. A GIS based approach to Holocene hydrology and social connectivity in the Gobi Desert, Mongolia. Archaeol. Res. Asia 2018, 15, 137–145. [Google Scholar] [CrossRef]
- Frigeri, A.; Hare, T.; Neteler, M.; Coradini, A.; Federico, C.; Orosei, R. A working environment for digital planetary data processing and mapping using ISIS and GRASS GIS. Planet. Space Sci. 2011, 59, 1265–1272. [Google Scholar] [CrossRef]
- Lemenkova, P. GRASS GIS Modules for Topographic and Geophysical Analysis of the ETOPO1 DEM and Raster Data: North Fiji Basin, Pacific Ocean. Geogr. Napoc. 2020, 14, 27–38. [Google Scholar] [CrossRef]
- Shi, H.; Du, Z.; Lu, Y.; Hu, X.; Ke, X. Amery Ice Shelf Digital Elevation Model from GLAS and GMT. In Proceedings of the 2009 Third International Symposium on Intelligent Information Technology Application, Nanchang, China, 21–22 November 2009; Volume 2, pp. 129–133. [Google Scholar] [CrossRef]
- Lemenkova, P. Topography of the Aleutian Trench south-east off Bowers Ridge, Bering Sea, in the context of the geological development of North Pacific Ocean. Baltica 2021, 34, 27–46. [Google Scholar] [CrossRef]
- Becker, N.C. Painting by numbers: A GMT primer for merging swath-mapping sonar data of different types and resolutions. Comput. Geosci. 2005, 31, 1075–1077. [Google Scholar] [CrossRef]
- Lemenkova, P. Submarine tectonic geomorphology of the Pliny and Hellenic Trenches reflecting geologic evolution of the southern Greece. Rud.-Geološko Zb. 2021, 36, 33–48. [Google Scholar] [CrossRef]
- Okubo, C.H.; Schultz, R.A.; Stefanelli, G.S. Gridding Mars Orbiter Laser Altimeter data with GMT: Effects of pixel size and interpolation methods on DEM integrity. Comput. Geosci. 2004, 30, 59–72. [Google Scholar] [CrossRef]
- Bat-Oyun, T.; Shinoda, M.; Cheng, Y.; Purevdorj, Y. Effects of grazing and precipitation variability on vegetation dynamics in a Mongolian dry steppe. J. Plant Ecol. 2016, 9, 508–519. [Google Scholar] [CrossRef] [Green Version]
- Lemenkova, P. Statistical Analysis of the Mariana Trench Geomorphology Using R Programming Language. Geod. Cartogr. 2019, 45, 57–84. [Google Scholar] [CrossRef] [Green Version]
- Fang, Z.; Jiang, G.; Xu, C.; Wang, S. A tectonic geodesy mapping software based on QGIS. Geod. Geodyn. 2020, 11, 31–39. [Google Scholar] [CrossRef]
- Lemenkova, P. Hyperspectral Vegetation Indices Calculated by Qgis Using Landsat Tm Image: A Case Study of Northern Iceland. Adv. Res. Life Sci. 2020, 4, 70–78. [Google Scholar] [CrossRef]
- Abatzoglou, J.; Dobrowski, S.; Parks, S.; Hegewisch, K.C. TerraClimate, a high-resolution global dataset of monthly climate and climatic water balance from 1958–2015. Sci. Data 2018, 5, 170191. [Google Scholar] [CrossRef] [PubMed] [Green Version]
- Schenke, H. General Bathymetric Chart of the Oceans (GEBCO). In Encyclopedia of Marine Geosciences, 1st ed.; Encyclopedia of Earth Sciences; Springer: Dordrecht, The Netherlands, 2016; pp. 268–269. [Google Scholar] [CrossRef]
- Lemenkova, P. Using GMT for 2D and 3D Modeling of the Ryukyu Trench Topography, Pacific Ocean. Misc. Geogr. 2020, 25, 1–13. [Google Scholar] [CrossRef]
- Lemenkova, P. Geomorphology of the Puerto Rico Trench and Cayman Trough in the Context of the Geological Evolution of the Caribbean Sea. Ann. Univ. Mar. Curie-Sklodowska Sect. B Geogr. Geol. Mineral. Petrogr. 2020, 75, 115–141. [Google Scholar] [CrossRef]
- Ghanem, M.E.; Kehel, Z.; Marrou, H.; Sinclair, T.R. Seasonal and climatic variation of weighted VPD for transpiration estimation. Eur. J. Agron. 2020, 113, 125966. [Google Scholar] [CrossRef]
- Li, M.; Yao, J.; Guan, J.; Zheng, J. Observed changes in vapor pressure deficit suggest a systematic drying of the atmosphere in Xinjiang of China. Atmos. Res. 2021, 248, 105199. [Google Scholar] [CrossRef]
- Song, X.; Bai, P.; Ding, J.; Li, J. Effect of vapor pressure deficit on growth and water status in muskmelon and cucumber. Plant Sci. 2021, 303, 110755. [Google Scholar] [CrossRef]
- Palmer, W. Meteorological Drought; Research Paper No. 45; NOAA National Climatic Data Center: Asheville, NC, USA, 1965. [Google Scholar]
- GEBCO Compilation Group. GEBCO 2020 Grid; British Oceanographic Data Centre (BODC): Liverpool, UK, 2020. [Google Scholar]
- Liu, Y.; Wu, Z.; Zhao, D.; Zhou, J.; Shang, J.; Wang, M.; Zhu, C.; Luo, X. Construction of High-Resolution Bathymetric Dataset for the Mariana Trench. IEEE Access 2019, 7, 142441–142450. [Google Scholar] [CrossRef]
- Nock, K.; Bonanno, D.; Elmore, P.; Smith, L.; Ferrini, V.; Petry, F. Applying single-image super-resolution for the enhancement of deep-water bathymetry. Heliyon 2019, 5, e02570. [Google Scholar] [CrossRef]
- Lemenkova, P. GEBCO Gridded Bathymetric Datasets for Mapping Japan Trench Geomorphology by Means of GMT Scripting Toolset. Geod. Cartogr. 2020, 46, 98–112. [Google Scholar] [CrossRef]
- Saito, K.; Nagata, Y.; Nakada, T.; Taketomi, C. High-Resolution Bathymetry Mapping for the Bering Continental Shelf. In Proceedings of the 2018 OCEANS—MTS/IEEE Kobe Techno-Oceans (OTO), Kobe, Japan, 28–31 May 2018; pp. 1–4. [Google Scholar] [CrossRef]
- Heiner, M.; Galbadrakh, D.; Kiesecker, J. Shifting Winds in the Mongolian Gobi Desert: Nature and Traditions Face the Modern Era. In Encyclopedia of the World’s Biomes; Goldstein, M.I., DellaSala, D.A., Eds.; Elsevier: Oxford, UK, 2020; pp. 78–84. [Google Scholar] [CrossRef]
- Rina, W.; Bao, G.; Tong, S.; Bao, Y.; Shan, Y.; Huang, X.; Ying, H.; Du, L. Multi-Climate Factors and the Preceding Growth Stage of Vegetation Co-Regulated the Variation of the End of Growing Season in Northeast Inner Mongolia, China. IEEE Access 2020, 8, 221525–221538. [Google Scholar] [CrossRef]
- Long, H.; Li, X.; Bao, Y.; Huang, L.; Li, Z. Time lag analysis between vegetation and climate change in Inner Mongolia. In Proceedings of the 2010 IEEE International Geoscience and Remote Sensing Symposium, Honolulu, HI, USA, 25–30 July 2010; pp. 1513–1516. [Google Scholar] [CrossRef]
- Zheng, L.; Zhu, L.; Yu, J.; Wang, W.; Li, X.; Ke, Y.; Li, J. Land Surface Ecosystem Change Due to Natural and Anthropology Effects-The Ordos Case, Inner Mongolia. In Proceedings of the IGARSS 2019—2019 IEEE International Geoscience and Remote Sensing Symposium, Yokohama, Japan, 28 July–2 August 2019; pp. 6479–6482. [Google Scholar] [CrossRef]
- Meng, X.; Gao, X.; Li, S.; Li, S.; Lei, J. Monitoring desertification in Mongolia based on Landsat images and Google Earth Engine from 1990 to 2020. Ecol. Indic. 2021, 129, 107908. [Google Scholar] [CrossRef]
- Dashpurev, B.; Wesche, K.; Jäschke, Y.; Oyundelger, K.; Phan, T.N.; Bendix, J.; Lehnert, L.W. A cost-effective method to monitor vegetation changes in steppes ecosystems: A case study on remote sensing of fire and infrastructure effects in eastern Mongolia. Ecol. Indic. 2021, 132, 108331. [Google Scholar] [CrossRef]
- Sainnemekh, S.; Barrio, I.C.; Densambuu, B.; Bestelmeyer, B.; Ása, L. Aradóttir. Rangeland degradation in Mongolia: A systematic review of the evidence. J. Arid Environ. 2022, 196, 104654. [Google Scholar] [CrossRef]
- Batunacun; Nendel, C.; Hu, Y.; Lakes, T. Land-use change and land degradation on the Mongolian Plateau from 1975 to 2015—A case study from Xilingol, China. Land Degrad. Dev. 2018, 29, 1595–1606. [Google Scholar] [CrossRef]
- Cook, B.I.; Mankin, J.S.; Anchukaitis, K.J. Climate Change and Drought: From Past to Future. Curr. Clim. Chang. Rep. 2018, 4, 164–179. [Google Scholar] [CrossRef]
- Ulaankhuu, K. The evaluation of environmental and socio-cultural impacts of tourism on the Khorgo-Terkhyn Tsagaan Nuur National Park. Proc. Mong. Acad. Sci. 2020, 60, 5–51. [Google Scholar] [CrossRef]
- Lemenkova, P. AWK and GNU Octave Programming Languages Integrated with Generic Mapping Tools for Geomorphological Analysis. Geosci. Eng. 2019, 65, 1–22. [Google Scholar] [CrossRef] [Green Version]
- Lemenkov, V.; Lemenkova, P. Using TeX Markup Language for 3D and 2D Geological Plotting. Found. Comput. Decis. Sci. 2021, 46, 43–69. [Google Scholar] [CrossRef]
- Mongolian Academy of Sciences. National Atlas of Mongolia; Mongolian Academy of Sciences: Ulaanbaatar, Mongolia, 2009. [Google Scholar]
- Pfeiffer, M.; Dulamsuren, C.; Wesche, K. Grasslands and Shrublands of Mongolia. In Encyclopedia of the World’s Biomes; Elsevier: Dordrecht, The Netherlands, 2020; pp. 759–772. [Google Scholar] [CrossRef]
- Altanbold, E.; Ulambadrakh, K.; Davaadorj, D.; Ganbold, B. To study origin and morphologic assessment of Bayan lake, western Mongolia. Proc. Mong. Acad. Sci. 2018, 58, 15–27. [Google Scholar] [CrossRef] [Green Version]
- Jamyansuren, S.; Udval, B.; Batkhuu, N.; Bat-Erdene, J.; Fischer, M. Result of study on developing forest seed region in Mongolia. Proc. Mong. Acad. Sci. 2019, 59, 18–31. [Google Scholar] [CrossRef]
- Jugder, D. Estimation of vertical dust emission flux at a site in the Mongolian Gobi during a dust storm period. Proc. Mong. Acad. Sci. 2018, 58, 25–40. [Google Scholar] [CrossRef]
Figure 1.
Topographic map of Mongolia. Mapping: GMT by script available in Appendix A.1. Source: author.
Figure 1.
Topographic map of Mongolia. Mapping: GMT by script available in Appendix A.1. Source: author.

Figure 2.
Average minimal temperature in Mongolia in April 2019. Mapping: GMT by script available in Appendix B.1. Source: author.
Figure 2.
Average minimal temperature in Mongolia in April 2019. Mapping: GMT by script available in Appendix B.1. Source: author.

Figure 3.
Average maximal temperature in Mongolia in April 2019. Mapping: GMT by script available in Appendix B.2. Source: author.
Figure 3.
Average maximal temperature in Mongolia in April 2019. Mapping: GMT by script available in Appendix B.2. Source: author.

Figure 4.
Wind speed in Mongolia in 2019. Mapping: GMT by script available in Appendix B.3. Source: author.
Figure 4.
Wind speed in Mongolia in 2019. Mapping: GMT by script available in Appendix B.3. Source: author.

Figure 5.
Soil moisture in Mongolia in 2019. Mapping: GMT by script available in Appendix B.4. Source: author.
Figure 5.
Soil moisture in Mongolia in 2019. Mapping: GMT by script available in Appendix B.4. Source: author.
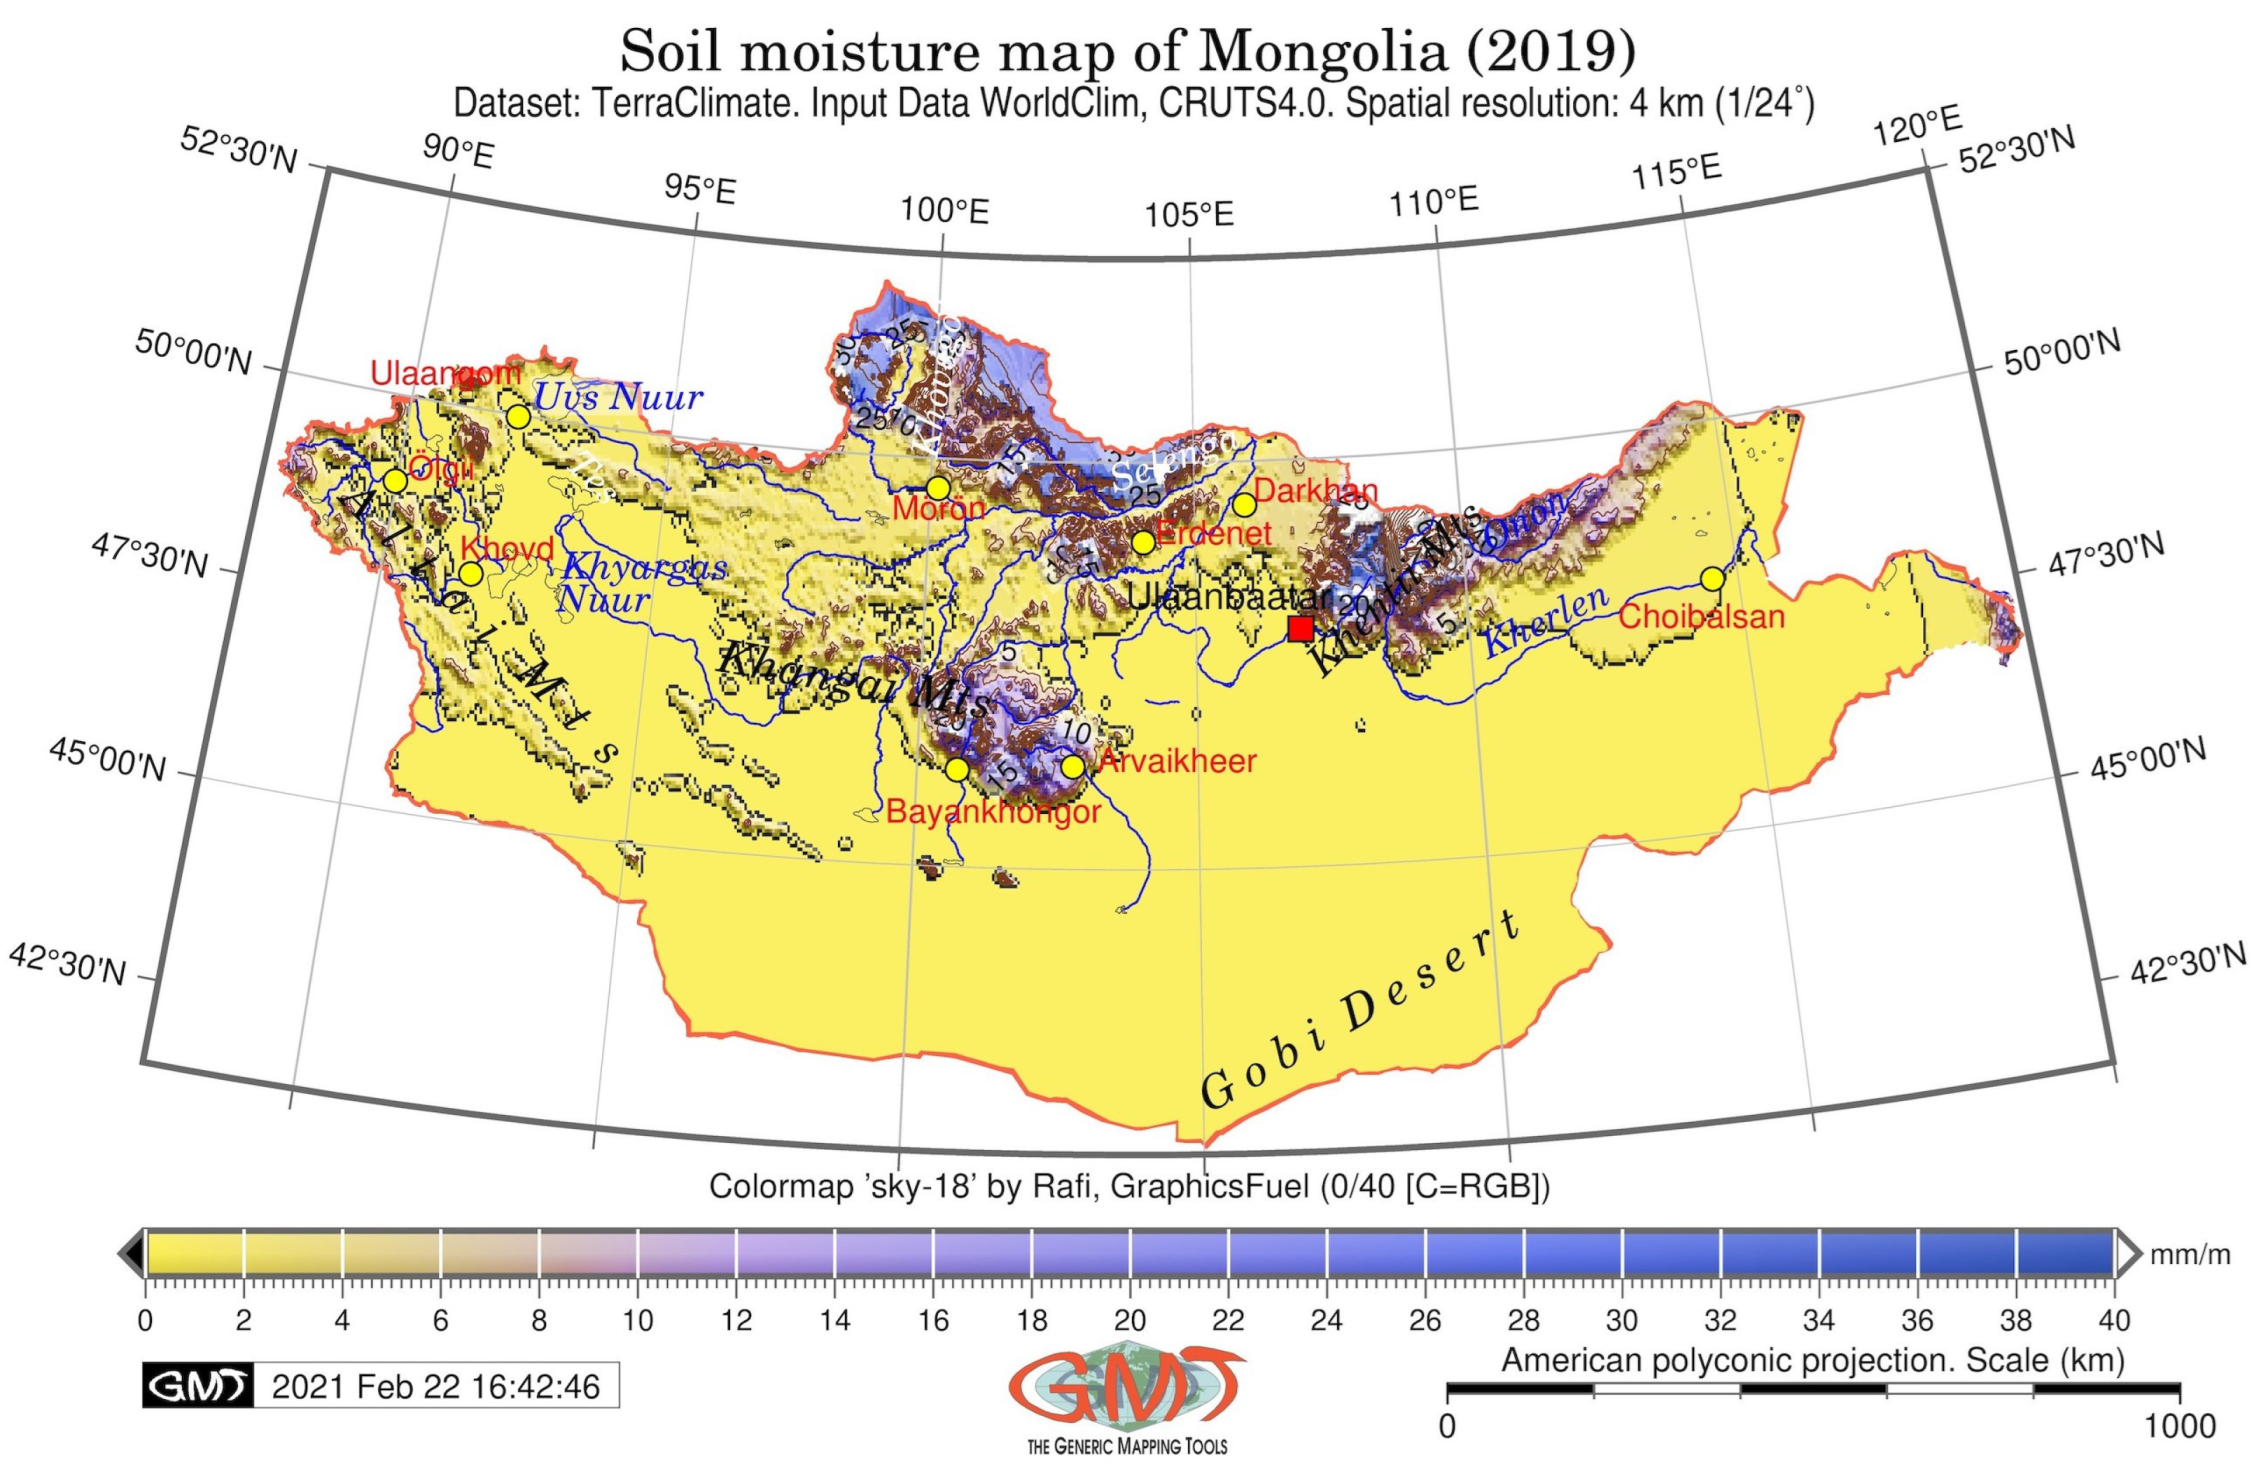
Figure 6.
Downward surface shortwave radiation in Mongolia in 2019. Mapping: GMT by script available in Appendix B.5. Source: author.
Figure 6.
Downward surface shortwave radiation in Mongolia in 2019. Mapping: GMT by script available in Appendix B.5. Source: author.

Figure 7.
Snow water equivalent in Mongolia in 2019. Mapping: GMT by script available in Appendix B.6. Source: author.
Figure 7.
Snow water equivalent in Mongolia in 2019. Mapping: GMT by script available in Appendix B.6. Source: author.
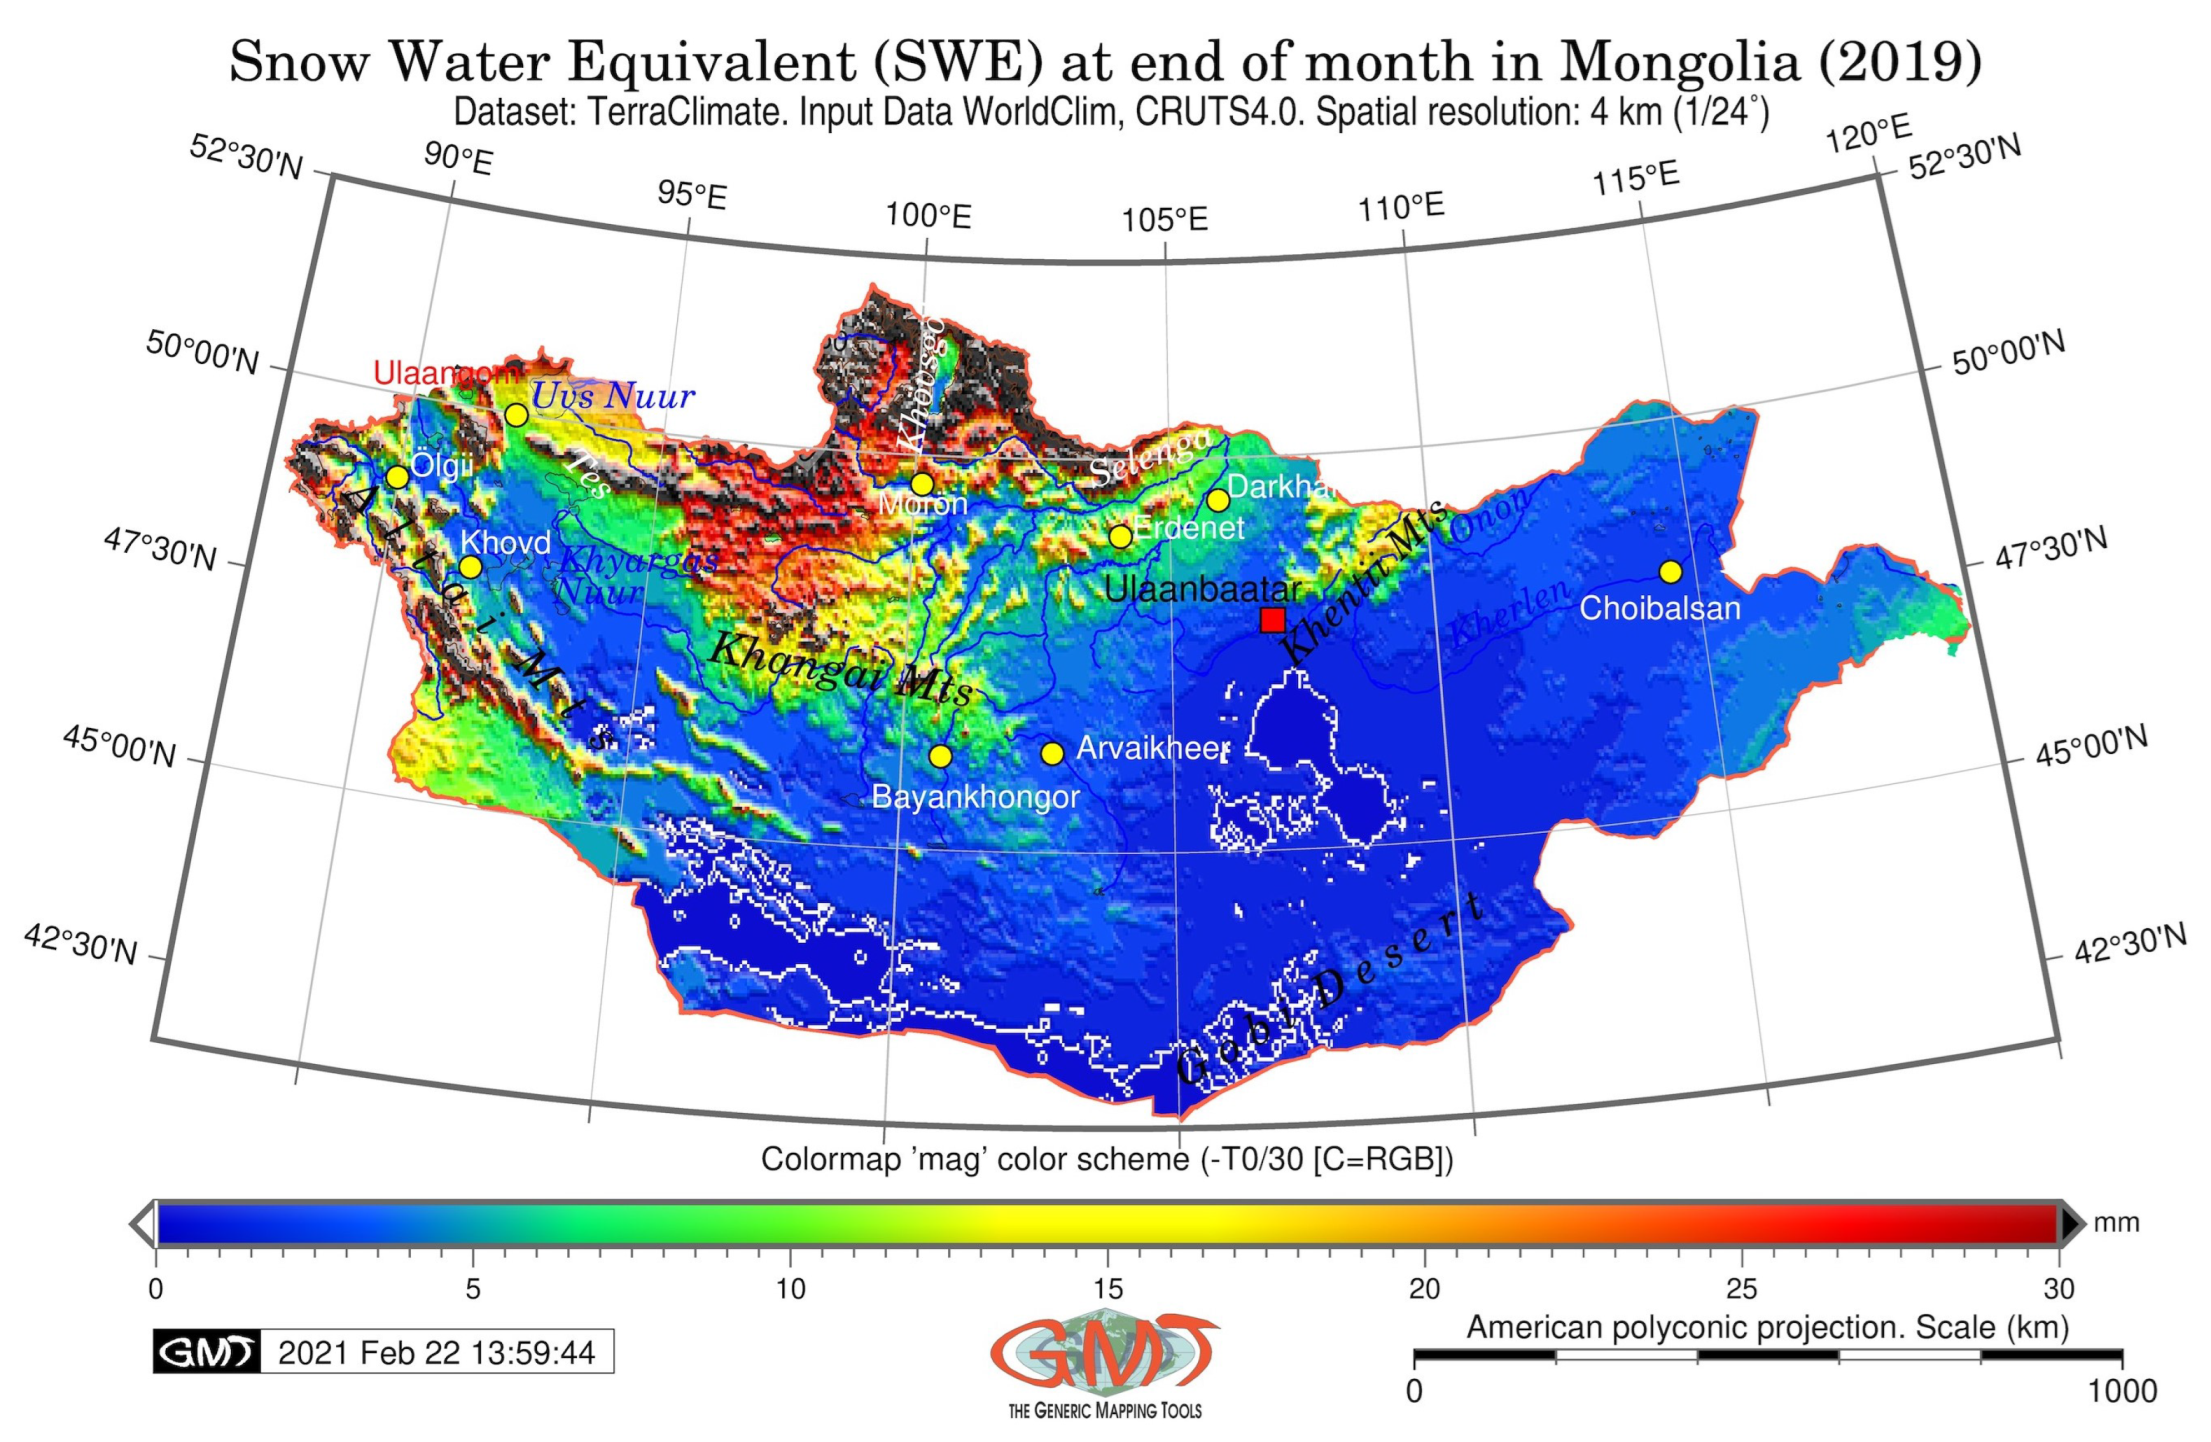
Figure 8.
Vapor pressure deficit in Mongolia in 2019. Mapping: GMT by script available in Appendix B.7. Source: author.
Figure 8.
Vapor pressure deficit in Mongolia in 2019. Mapping: GMT by script available in Appendix B.7. Source: author.

Figure 9.
Vapor pressure anomaly in Mongolia in 2019. Mapping: GMT by script available in Appendix B.8. Source: author.
Figure 9.
Vapor pressure anomaly in Mongolia in 2019. Mapping: GMT by script available in Appendix B.8. Source: author.

Figure 10.
Monthly precipitation in Mongolia in 2019. Mapping: GMT by script available in Appendix B.9. Source: author.
Figure 10.
Monthly precipitation in Mongolia in 2019. Mapping: GMT by script available in Appendix B.9. Source: author.
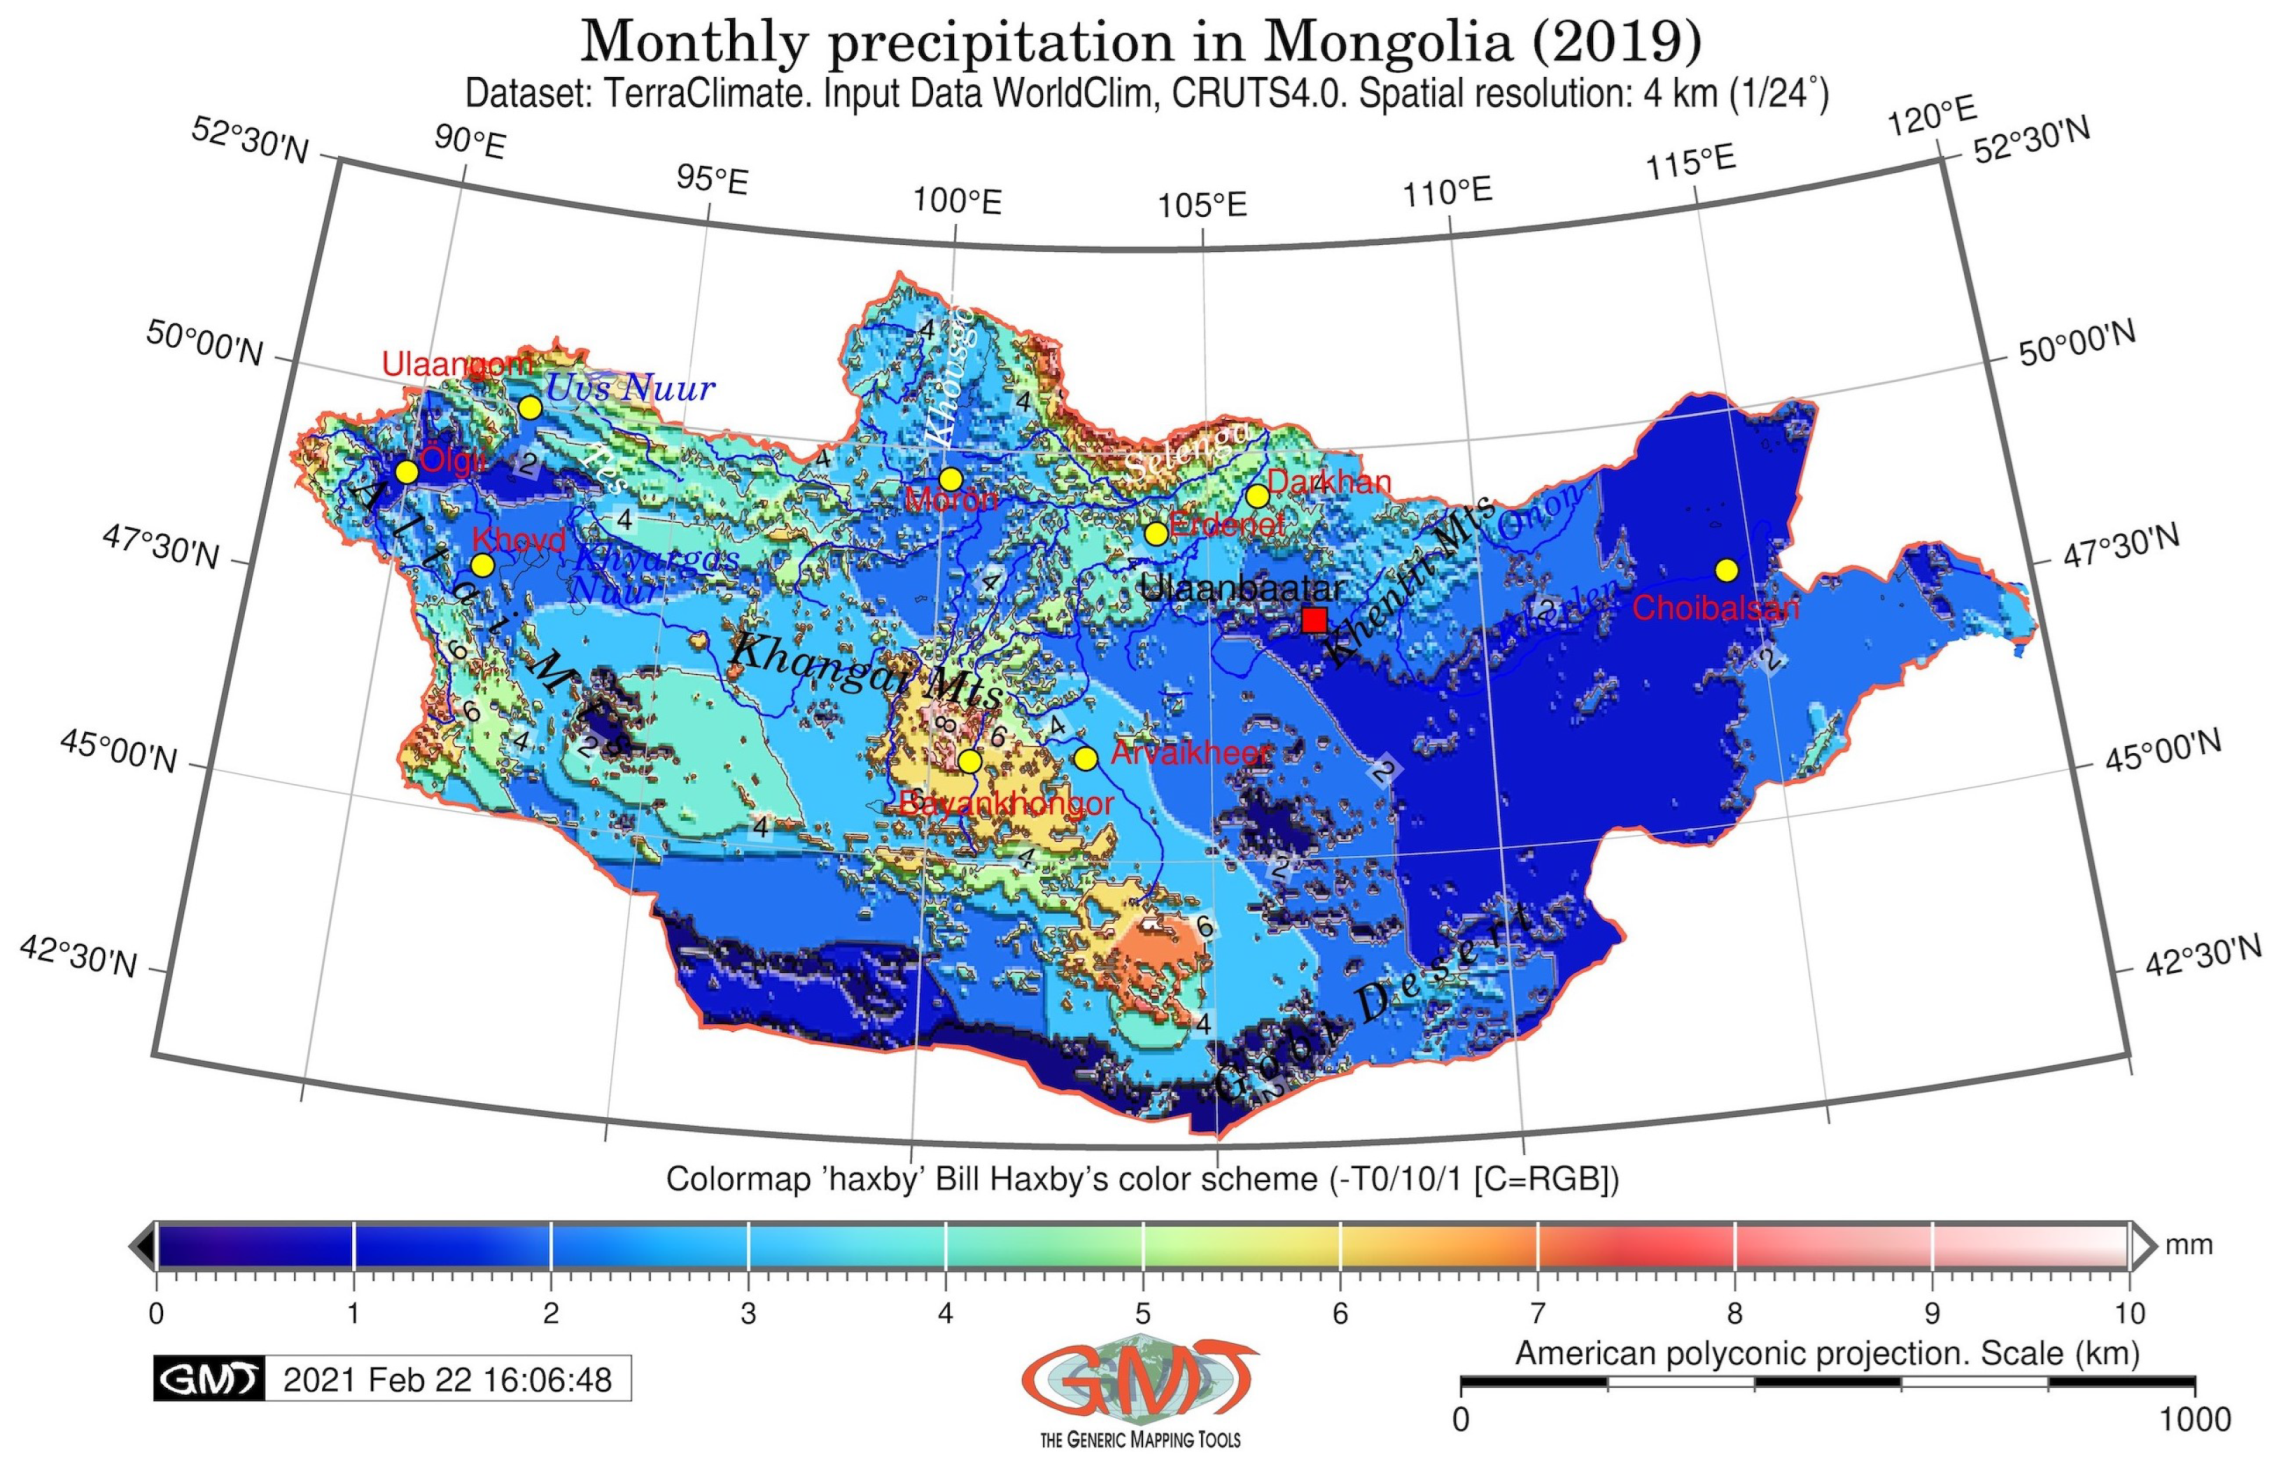
Figure 11.
Palmer Drought Severity Index (PDSI) in Mongolia in 2019. Mapping: GMT by script available in Appendix B.10. Source: author.
Figure 11.
Palmer Drought Severity Index (PDSI) in Mongolia in 2019. Mapping: GMT by script available in Appendix B.10. Source: author.

Publisher’s Note: MDPI stays neutral with regard to jurisdictional claims in published maps and institutional affiliations. |
© 2022 by the author. Licensee MDPI, Basel, Switzerland. This article is an open access article distributed under the terms and conditions of the Creative Commons Attribution (CC BY) license (https://creativecommons.org/licenses/by/4.0/).
Share and Cite
MDPI and ACS Style
Lemenkova, P. Console-Based Mapping of Mongolia Using GMT Cartographic Scripting Toolset for Processing TerraClimate Data. Geosciences 2022, 12, 140. https://doi.org/10.3390/geosciences12030140
AMA Style
Lemenkova P. Console-Based Mapping of Mongolia Using GMT Cartographic Scripting Toolset for Processing TerraClimate Data. Geosciences. 2022; 12(3):140. https://doi.org/10.3390/geosciences12030140
Chicago/Turabian StyleLemenkova, Polina. 2022. "Console-Based Mapping of Mongolia Using GMT Cartographic Scripting Toolset for Processing TerraClimate Data" Geosciences 12, no. 3: 140. https://doi.org/10.3390/geosciences12030140
Note that from the first issue of 2016, this journal uses article numbers instead of page numbers. See further details here.