Abstract
Characterizing the top seal integrity of organic-rich caprock shale is critical in hydrocarbon exploration and fluid storage sites assessment because the caprock acts as a barrier to the low-density upward migrating fluids. This study investigated the geomechanical properties of the Upper Jurassic caprock shales of various basins from the Norwegian Continental Shelf. Usually, paleo-deposition and diagenesis vary from basin to basin, which influences the geomechanical properties of caprock shale; hence, the seal integrity. Fourteen (14) wells from four (4) different basins within the Norwegian Continental Shelf were analyzed to evaluate the effects of various processes acting on caprock properties. Comparative mineralogy-based caprock properties were also investigated. We include a thorough review of the distribution of organic and inorganic components utilizing SEM and 3D microtomography as they relate to the development and propagation of microfractures. Five (5) wells from three (3) basins contain measured shear sonic logs. These wells were used for petrophysics and rock physics analysis. Three elastic properties-based brittleness indices were estimated and compared. The percentage of different mineral fractions of the studied wells varied significantly between the studied basins, which is also reflected in the mineralogical brittleness indices evaluation. Irrespective of the studied basins, relative changes in caprock properties between wells have been observed. The Young’s Modulus–Poisson’s ratio-based empirical equation underestimated the brittleness indices compared with mineralogy- and acoustic properties-based brittleness estimation. A better match has been observed between the mineralogy- and acoustic properties-based brittleness indices. However, as both methods have limitations, an integrated approach is recommended to evaluate the brittleness indices. Brittleness indices are a qualitative assessment of the top seal; hence, further investigation is required to quantify sealing integrity.
1. Introduction
Caprock in the Norwegian Continental Shelf (NCS) is mostly made up of clastic shales (or mudrock). Shale rocks mainly consist of clay and silt size particles (i.e., particles size <62.5 µm) and differ from other clastic rocks by their composition, porosity, heterogeneity, etc. [1,2,3,4,5]. They are deposited in a wide range of environments, have a diverse origin, and have a multitude of post-depositional processes. Various processes lead to a wide range of caprock properties with complex nature, which add difficulty during characterization. However, top seal caprock shale characterization is crucial in any hydrocarbon exploration and fluid injection, especially CO2 capture and storage (CCS) projects. CCS injection projects in a saline aquifer add further uncertainties because no information about top seal integrity is available beforehand.
CCS is one of the quickest and cheapest solutions for reducing human-generated atmospheric CO2. Partnering with industries, the Norwegian Government has developed a large-scale CCS strategy (Longship CCS) in the northern North Sea region. However, to meet the carbon neutral target by 2050, the process needs to be expedited. Therefore, more injection sites are required; hence, this study focused on characterizing top seal caprock from the Norwegian Continental Shelf (NCS). In the CCS project, injection-induced pressure perturbation might trigger caprock shear or tensile failure [6,7,8,9,10]. For reliable and permanent subsurface storage, caprock failure risks must be investigated. Therefore, it is essential to evaluate caprock properties (i.e., brittleness) for successful geological storage of CO2.
Caprock brittleness property is a complex function of many factors (rock strength, lithology, texture, effective stress, temperature, fluid type, diagenesis, TOC, etc.). It has been proposed that these parameters correlate to rock mineral composition and rock geomechanical properties [11]. However, no consistent definition for brittleness indices exists; instead, different methods are demonstrated [12,13,14]. Arthur [15] and Hetenyi [16] defined brittleness as the loss of material plasticity, while Ramsay [17] believed that a material’s brittle failure might occur when the cohesion in the rock was lost. Obert and Duvall [18] assumed that the rock brittleness property was similar to that of cast iron and reached or slightly exceeded the yield strength to break. Some authors believe that brittleness is the degree of rock instability after peak failure [19,20]. There are several methods (~50) available to date to evaluate the brittleness indices of materials using different parameters; stress–strain relations [21], geomechanical properties [22], strength [23], mineral composition [24], hardness and ruggedness [25], energy relation [19,20], etc. In this research, we considered two approaches to estimate the Upper Jurassic organic-rich shales’ brittleness indices. Although brittleness indices (BI) values define the rock failure behavior, in this study, we used the caprock BI property as a qualitative assessment of caprock failure chances (the higher the BI, the higher the chances of shear and tensile failure during stress change).
The first method is the use of mineral composition-based brittleness indices (BI), which estimate the ratio between brittle minerals content and the total mineral assemblages. Mineral components in any rock build the whole rock framework and internally affect the geomechanical properties. Therefore, there might be a correlation between rock mineral composition and mineral-based brittleness indices. Considering this relation, Jarvie et al. [24] proposed a BI equation considering quartz as a brittle mineral, while carbonate and clay were considered less brittle and non-brittle, respectively. Wang and Gale [26] modified the correlation and, apart from quartz, added dolomite as a brittle mineral, while Total Organic Carbon (TOC) was anticipated as a ductile mineral. Instead of dolomite, the entire carbonate weight fraction was considered to be brittle, and the equation by Glorioso and Rattia [27] was modified. Later, Jin et al. [28] added feldspar, mica, quartz, and carbonate as brittle minerals. Moreover, Rybacki et al. [28] added pyrite as a brittle mineral, while carbonate was considered a less brittle mineral. Furthermore, they excluded TOC from the equation and added total porosity as a ductile mineral. The proposed equations are based on various shale formations with different mineral assemblages, and the BI values vary significantly. However, the mineral weight fraction is only an approximation and is not the only parameter that impacts BI [29].
The second method is the elastic properties-based calculation of BI by normalizing static Young’s modulus (Es) and Poisson’s ratio (ν). Es indicates any material’s stiffness (ratio of stress and strain), while ν measures geometric changes of shape under stress (ratio between transverse to longitudinal strains). This method assumes that BI increases by increasing Es and decreasing ν [22]. Rickman et al. [30] modified the relation between BI and elastic properties to evaluate the relative brittleness of the Barnett shales in North America. Elastic property ranges can be determined by various methods; hence, the consistency of rock brittleness in different studies cannot be achieved [11,31]. Moreover, geomechanical properties of rocks may vary significantly at different in situ stress conditions. Rocks with high Es have strong compression resistance and high critical fracturing pressure; hence, scientists have reservations about this method. However, site-specific ranges of elastic properties might resolve a few concerns and become a useful tool for quantifying caprock properties. On the contrary, the composition-based method is more practical, but the definition of brittle and ductile minerals remains ambiguous [11]. Moreover, mineral fractions are significantly influenced by specific basin setups, leading to a significant difference in bulk mineralogy. The elastic properties-based method can effectively be linked to the well logs and seismic properties irrespective of stress conditions, hence complicating the characterization in an exhumed basin. Considering the advantage and limitation of the various methods, an integrated estimation approach might be more practical and effective.
An effective caprock shale has very low matrix porosity and permeability [3,11,32,33]; hence, very high capillary entry pressure prevents fluid from escaping. However, leakage may occur if the permeability is sufficiently high or injection-induced pressure-driven caprock fracturing occurs [34,35,36]. Shear failure or the fracturing of seal rock occurs when shear stress exceeds shear strength and is controlled by the brittleness of that rock [37]. In this research, we evaluated the geomechanical properties of the Upper Jurassic caprock shales from the Norwegian Continental Shelf (NCS). The uplift and subsequent erosion significantly influenced these areas; hence, the caprock elastic properties vary considerably. The aim was to identify and separate the effects of mineralogy, TOC maturation, and exhumation on the caprock geomechanical properties of the North Sea and Barents Sea basins using rock physics templates. Moreover, a comparative brittleness indices analysis between various methods has been analyzed to identify the differences and necessity for an integrated approach to characterize caprock shales.
2. Structural Settings and Lithostratigraphy
The Norwegian Continental Shelf (NCS) is unique in the amount of data available and comprising three main provinces: the North Sea, the Norwegian Sea, and the Barents Sea. A series of post-Caledonian rift episodes shape the structural configuration of the sedimentary basins in NCS. which are illustrated in Figure 1a [38,39]. The studied areas, i.e., the Barents Sea and the North Sea, share similar depositional and structural setups. Yet, there are substantial differences, mainly in the Cretaceous–Cenozoic burial history and exhumation [35,40,41]. All the provinces in NCS are dominated by NW–SE-oriented rifting, followed by rapid subsidence, siliciclastic deposition, infill, and the draping of rift topography in the Early Cretaceous. However, in the Late Cretaceous, regional transgression and deposition of thick carbonate sequence characterized the North Sea, while time-equivalent marine deposits are highly condensed because of uplift, erosion, and non-deposition within the Barents Shelf deposits. Rock properties are affected by Cenozoic uplift and erosion in the entire NCS region; however, the Barents Sea area has experienced multiple episodes and maximum net erosion, estimated to be around 1–1.2 km in the Goliat Field area and approximately 2 km in the Hoop area [35,41,42,43]. Net uplift in the central North Sea is estimated to be from zero to 0.7 km, while 0 to 1.3 km uplift is assessed in the northern North Sea area [44,45,46].
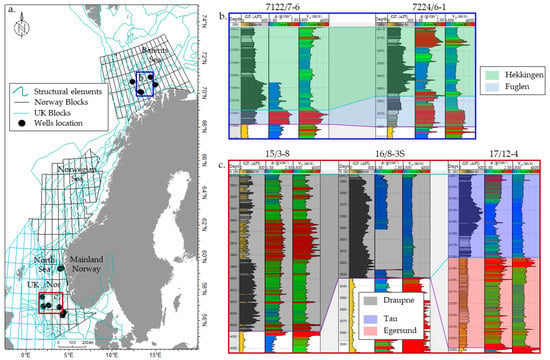
Figure 1.
Map represents the structural elements (green), blocks (black and blue lines) and studied wells (black dots) location on the Norwegian Continental Shelf (NCS) (a). Two well correlations with wireline logs (i.e., GR, density and p-velocity) of primary caprocks are presented where (b) represents the Barents Sea wells, and (c) indicated wells from the North Sea. The wireline logs illustrated significant variation of vertical caprock properties as well as difference between wells. Please note that well sections are flattened using the top of the caprocks (i.e., top Hekkingen, Draupne, and Tau formations).
The primary caprocks (i.e., Draupne, Tau, and Hekkingen formations) in the NCS were deposited in the Upper Jurassic–Lower Cretaceous time, equivalent to the UK Kimmeridge Clay Formation, and predominantly consisted of organic and clay-rich black particles. The Middle to Upper Jurassic sandy facies deposited in the fluvial, coastal plains, and deltaic to shallow marine environments were the primary reservoir rocks in several hydrocarbon fields and discoveries in the NCS [47,48,49]. A thin shaly unit (i.e., Heather, Egersund, and Fuglen formations) was also deposited in between the caprock–reservoir pairs, which are characterized by the dark to light grey shales with more variable and overall lower organic content compared with the upper units [35,47,49,50]. For simplification, from here onward, the Draupne, Tau, and Hekkingen shale formations are denoted as the upper unit, while the Heather, Egersund, and Fuglen formations are presented as the lower unit.
Irrespective of the deposition time, characteristics of caprock formations (i.e., timing, distribution, properties, etc.) greatly vary between sub-basins (Figure 1b,c). Depending on the well’s location, gamma-ray trends, representing the proxy of paleo-depositional environments, change dramatically. For instance, an intra-Draupne sand layer was deposited in well 15/3-8, while other wells did not have such a unit. Influences of such variation significantly affected the elastic properties (i.e., density, velocity, etc.) of caprocks, which are illustrated in Figure 1b,c. Upper and lower units also varied vertically within the same wells and laterally between the wells in NCS. Generally, the highly radioactive blackish upper unit was deposited in restricted marine environments with high organic matter, low circulation, and anoxic conditions when compared to open marine deposition for the lower grey unit [35,41,48]. Elastic properties also greatly varied between these two units, where the upper unit has lower density and velocity than the lower unit, except for a few exceptions (Figure 1b,c).
3. Materials and Methods
Caprock properties were evaluated using 14 exploration wells from the different sub-area in NCS, where 32/2-1 and 32/4-1 are from the northern North Sea, 15/12-21, 15/3-8, and 16/8-3 S are from South Viking Graben, 9/2-1, 9/4-3, 9/4-5 and 17/12-4 are from the Norwegian–Danish Basin, and 7122/7-3, 7220/10-1, 7122/7-6, 7224/6-1 and 7125/1-1 are from SW Barents Sea as shown in Table 1. Net uplift significantly varies between the studied wells and between the structural sub-units. Overall, there is no exhumation in the South Viking Graben basin, while the SW Barents Sea experiences significant uplift (~1.4 km). A considerable uplift was also observed in the northern North Sea, mainly in the Horda Platform area. Bulk X-Ray Diffraction (XRD) mineralogy databases have been scouted from the published literature [35,40,51,52,53], which were used for composition-based brittleness analysis. Five wells (i.e., 15/3-8, 16/8-3 S, 17/12-4, 7122/7-6, and 7224/6-1) out of fourteen have measured shear sonic velocity (Vs) logs; hence, these wells have been used for the rock physics diagnostic. These wells’ wireline logs (i.e., density, compressional and shear sonic, GR, spectral GR, and deep resistivity) were used for detailed petrophysical and rock physical analysis. The geomechanical properties, such as Young’s modulus (E) and Poisson’s ratio (ν), were calculated and used extensively as these properties represent the caprock stiffness and expansion or contraction, respectively [54].

Table 1.
An overview of the studied wells shows the maximum exhumation differences within different basins. The source of XRD mineralogy for different primary caprocks is also illustrated. Please note that two wells out of 14 do not have XRD mineralogy data (follow the ‘x’ sign in the table) available.
3.1. Geochemical Data
Organic matter fractions and types significantly influence the paleo-depositional setup and played vital roles in caprock properties. Maturation history also considerably changes the geomechanical properties of caprocks; therefore, geochemical reports consisting of total organic carbon (TOC) data were scouted from the public domain database [48]. The studied wells in each sub-basin were selected based on the available rock-eval analysis, where the wells with petrophysical analysis were given priority. Overall, TOC quality ranged from poor to excellent within the NCS (Figure 2a). The South Viking Graben and SW Barents Sea have higher TOC weight percentages than the northern North Sea, while the data from the Norwegian–Danish basin are distributed within a broader range. There is no overall separation between upper and lower units; however, compared within the basin, lower units showed comparatively low values when compared to the upper units. Overall, TOC ranges between Type II to Type III and is within the oil window maturation zone, except for SW Barents Sea data points, for which the values fall to within the immature temperature zone (Figure 2b).
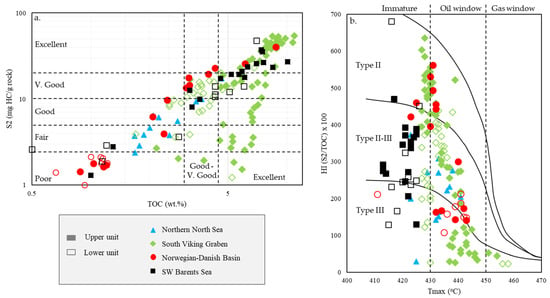
Figure 2.
Geochemical illustration of the database from the studied area: (a) Cross-plot of TOC (total organic carbon) versus S2 (quantity of hydrocarbons generation potential the rock has during maturation) of upper and lower units comparing the quality of the organic matter within different sub-basins. The background template is modified from [55]. (b) Pyrolysis Tmax (the temperature at which the maximum rate of hydrocarbon generation occurs during pyrolysis analysis) versus HI (Hydrogen Index = [S2/TOC] × 100) of the same data points, showing the kerogen type and thermal maturity, according to [56].
To analyze the studied wells, the TOC log was estimated using the empirical relations proposed by Passey et al. [57]. This method was validated by calibrating with laboratory-measured TOC [40,50]. The relation is based on density and states that:
where,
is the kerogen density that has a range of 1.1–1.6 g/cm3 [50], and it depends on the maturation of organic matter [58,59,60,61];
is the matrix density which depends on the mineralogy, grain fabric, and diagenesis, i.e., clay mineral transformation [2,62];
is the bulk density log; ‘a’ is the constant which is related to the fraction of carbon in organic matter and can vary according to the maturation level. For example, Vernik and Landis [60] assume a = 67, while a = 70–85 is suggested by Vernik and Milovac [61]. This study used 72 for ‘a’, 1.3 g/cm3 for kerogen density, and 2.6 as matrix density for all the petrophysical analyzed wells. Due to different uncertainties, this empirical equation presented a moderate correlation coefficient [41,51]. However, compared with other methods (i.e., ΔlogR), this relation indicated better TOC estimation.
In addition to TOC, there is an indirect relation between uranium proportion and the depositional environment of marine shale, which leads to different mineralogical variations [63,64]. Uranium content in spectral gamma-rays was analyzed to identify the possible depositional variation within the studied wells. The average uranium content in wells 15/3-8 and 17/12-4 was compared with the XRD clay and TOC percentages that are illustrated in Figure 3. A moderate positive correlation of average uranium content was observed with TOC, while clay content data were sparsely distributed. Uranium enrichment indicated a possible distal environment with an anoxic condition that preserved organic matter; hence, robust relations are expected. On the contrary, clay minerals can deposit in a wide range of environments (i.e., floodplains, lakes, shorefaces, prodelta areas, abyssal plains, etc.); therefore, no direct relation might exist.
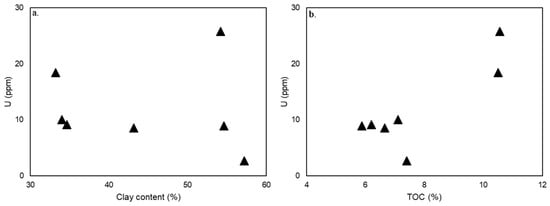
Figure 3.
Point datasets from wells 15/3-8 and 17/12-4 are represented the relation between uranium versus total clay percentage (a) and total organic carbon (b).
3.2. Rock Physics Model
P-wave velocity (Vp) versus density (ρ) template is a tool for acoustic property characterization where the background curves (i.e., friable sand model, 20%, 50%, 80%, and 100% clay volume curves) are adapted from Avseth et al. [65]. This background model is called the Dvorkin–Gutierrez silty shale model, where the saturated elastic moduli of shale are estimated using the Hashin–Shtrikman lower bound as a function of clay content, assuming the silt grains consist of 100% quartz [65]. This template is used to evaluate compositional-related elastic property variation using gamma-rays and uranium as a proxy. Elastic properties such as Young’s Modulus (E) and Poisson’s Ratio (ν) are characterized using the template where the background curves are adapted from Perez and Marfurt [66]. These properties represent the caprock’s geomechanical properties under stress.
3.3. Brittleness Indices
The brittleness index (BI) was estimated using both mineral composition and elastic properties of the studied caprock shales. Composition-based BI assumes that the fraction of stiff minerals (i.e., quartz, feldspar, pyrite, etc.) increases the caprock brittleness while the ductile components (i.e., clay, TOC, etc.) decrease it. Based on mineral assemblage assumption, Jarvie et al. [24] proposed the concept that the BI of any rock was the ratio of quartz fractions (brittle mineral) to the total mineral fractions (i.e., quartz, carbonate, and clay), which was later updated by several authors [26,27,28,67,68]. Considering the bulk mineralogy of the studied caprock shales and the published empirical relations, the modified equation we tested is as follows:
where Qtz is quartz, Carb is carbonate, Fsp is Feldspar, Py is Pyrite, Cly is total clay, and TOC is total organic carbon. MBI ranges between 0 (ductile) to 1 (brittle) and increases with increasing brittleness. This equation implies a similar contribution of each mineral to rock brittleness, which added uncertainties considering the different mechanical behavior among minerals [69]. In addition, the influence of porosity was not considered here. However, this empirical relation can be useful for comparative analysis with elastic brittleness indices’ estimation, which was the main objective of this research.
Like MBI, many elastic property-based brittleness indices (EBI) empirical relations are also available [22,30,68,69,70,71]. In this study, we estimated the EBI using two elastic property-based empirical equations proposed by Grieser and Bray [22] and Fawad and Mondol [72]. The Grieser and Bray [22] empirical equation is:
where Es is static Young’s modulus, Emax is 69 GPa, Emin is 0 GPa, ν is static Poisson’s ratio, νmax is 0.5, and νmin is 0. Additionally, the higher the EBI1 value is, the more brittle the caprock is. However, the minimum and maximum ranges used in this equation are basin-specific; hence, a new range is proposed for the Upper Jurassic caprock in NCS, which is displayed in Table 2. To avoid underestimation or overestimation, p10 and p90 values are used for lower and higher ends. The difference between the upper and lower units property is minimal; hence, the combined range has been used as the minimum and maximum value during estimating EBI2. Es and ν are calculated using P-wave velocity (Vp), S-wave velocity (Vs), and the density (ρ) from 5 wells with acquired logs. Static Es is directly estimated from P-wave velocity (Vp) using the empirical equation proposed by Horsrud [73]:
where Vp is in km/s. The dynamic = static ν has been calculated using the equation below:

Table 2.
Upper and lower limits of Young’s modulus and Poisson’s ratio of Upper Jurassic caprocks in NCS.
The other EBI equation proposed by Fawad and Mondol [72] was based on acoustic impedance (AI) and deep resistivity (Rt) and defined as:
where AI is the acoustic impedance (gm/cm3 × m/s), RD is true formation resistivity (ohm-m), and RW is the resistivity of pore water (ohm-m). Here, we define brittleness as an increase in rock stiffness because of compaction and stiff mineral content (quartz, carbonate, or dolomite). Equation (6) is based on the physical and elastic properties of the organic matter (kerogen), quartz, and clay/water as end-members of a ternary model.
4. Results
4.1. Mineralogy and Brittleness
Ductile (i.e., clay & TOC) and brittle (i.e., quartz, feldspar, carbonate and pyrite) minerals of the representative wells from different sub-basins are shown in Figure 4. The percentage varies significantly within the structural setup, where a higher ductile mineral fraction is found in the Norwegian–Danish basin (Figure 4f) and a lower fraction is observed in the South Viking Graben (Figure 4b) and SW Barents Sea (Figure 4d). The ratios of the ductile and brittle minerals in the upper unit are 78:22 and 53:47, respectively. Data from the northern North Sea region also represent a considerably high number of ductile minerals (Figure 4a). Overall, the percentage of the ductile minerals is higher than the brittle minerals except for the Heather Formation samples from 15/12-21, where the ductile mineral percentage is lower than the brittle minerals (Figure 4b). There is no direct relation between the upper and lower units mineral assemblages; instead, the percentage varies from basin to basin.
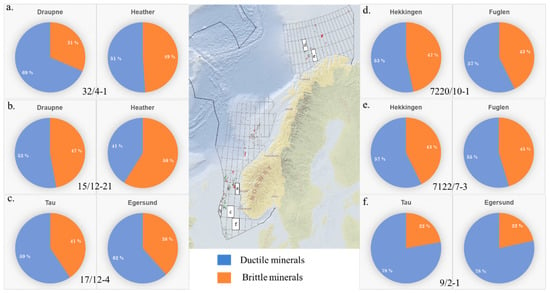
Figure 4.
The ductile (i.e., clay and TOC) and brittle (i.e., quartz, feldspar, carbonate and pyrite) mineral percentages of Upper Jurassic caprock in different sub-basins in Norwegian Continental Shelf: (a) Draupne and Heather formations from the northern North Sea, (b) Draupne and Heather formations from South Vikings Graben, (c,f) Tau and Egersund formations from Norwegian–Danish Basin, and (d,e) Hekkingen and Fuglen formations from SW Barents Sea. The map in the middle represents the block location of the wells studied here.
The variation of mineral assemblages is also demonstrated in mineral-based brittleness indices (MBI), where the South Viking Graben represents the highest BI values (Figure 5). The MBI value is divided into two halves (cut-off at 0.3) to assess the qualitative comparison between different sub-basins. Based on this division, the Norwegian–Danish Basin and the upper unit of the northern North Sea show more ductile caprock shales compared with the rest of the wells. Moreover, the data from the SW Barents Sea and lower units from the northern North Sea basins show higher MBI values. Conversely, considering the total range (i.e., zero is equivalent to ductile and one is equal to brittle), most of the wells are in between ductile and less brittle zones (equivalent to <0.5). However, it is worth remembering that the mineralogical brittleness does not consider many parameters (i.e., grain orientation, grain size, degree of cementation, effective stresses, temperature, etc.) that influence the brittle behavior of the caprock shale during failure.
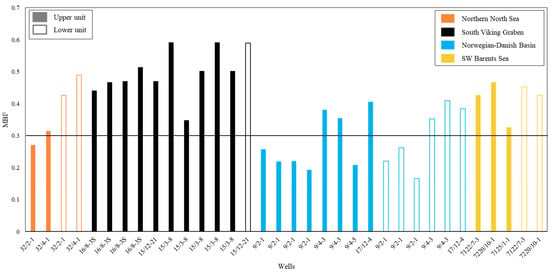
Figure 5.
Mineralogical brittleness indices of upper and lower units of various wells from different sub-basins in the North Sea and SW Barents Sea.
4.2. Caprock Property
Elastic properties significantly vary due to depositional environment variation and post-depositional changes (i.e., diagenesis processes). Gamma-rays (GR) were used as a proxy for paleo-depositional variation, while the spectral uranium (U) content log represents the anoxic environment, which is also indicative of the presence of higher organic contents (Figure 3). The studied wells from different sub-basins show variation between gamma-ray values as well as diagenetic trends (Figure 6). The Draupne Formation in well 15/3-8 shows increasing trends of compositional properties with decreasing gamma-ray values, which follows the trends explained by Hansen et al. [36]. However, the low velocity and density data points from the well 16/8-3 S indicate low uranium content, though few data points from the same well show high GR and U values and follow the TOC trend [35]. High GR and U data points from the well 17/12-4 have a low density and Vp; however, instead of following the compositional trend with decreasing GR, the data point followed a different trend, where density increased faster than Vp (Figure 6c,d). The well 7224/6-1 also shows a very different trend with decreasing GR values. Density increased with decreasing GR and U up to a certain point, while Vp remained constant; then, a significant increase in Vp was observed with very gentle changes in density (Figure 6e,f). On the contrary, the other well from the same area followed a compositional trend with data points clustered into two zones based on the mineral compositions.
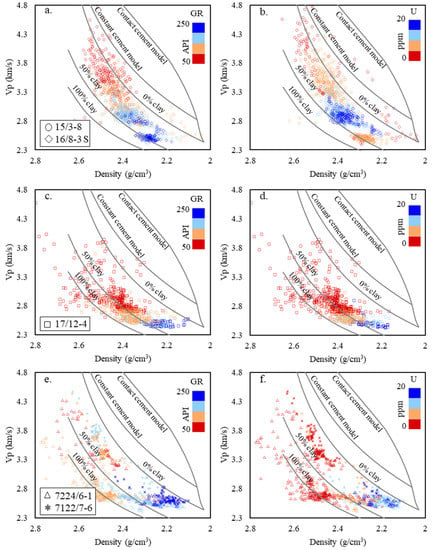
Figure 6.
Velocity versus density cross-plots of Draupne Formation from 15/3-8 and 16/8-3 S color-coded with GR (a) and uranium content (b), Tau and Egersund formations from 17/12-4 color-coded with GR (c) and Uranium content (d), and Hekkingen and Fuglen formations from 7224/6-1 and 7122/7-6 wells color-coded with GR (e) and Uranium content (f). The reference curves (RPTs) are adapted from Avseth et al. [65].
Young’s modulus (Es) and Poisson’s ratio (ν) cross-plots, which are the proxy of caprock stiffness and expansion or contraction, show variation between wells illustrated in Figure 7. Properties of different sub-basins are described below, where similar vertical and horizontal scales have been used for comparison.
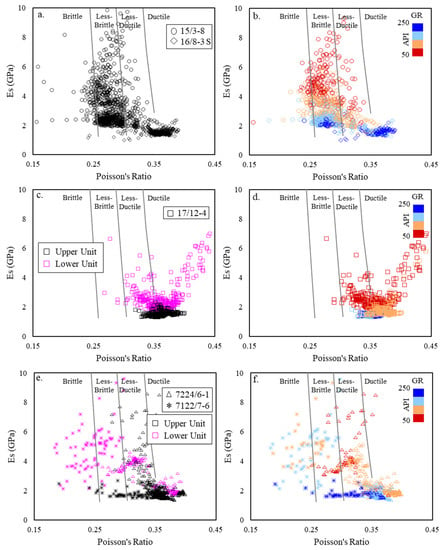
Figure 7.
Es versus ν cross-plots of upper (Draupne, Hekkingen & Tau formations) and lower (Fuglen & Egersund formations) units from different Basins color coded with formations (a,c,e), GR (b,d,f). The reference BI zone boundaries (RPT) are adapted from Perez and Marfurt [67].
Wells from the South Viking Graben are presented in Figure 7a,b. Lower velocity and density in well 16/8-3 S (Figure 6a) represent less stiffness with very low Es and high ν. Changes in GR change the stiffness of the caprock. On the contrary, the well 15/3-8 shows a significant increase in stiffness with variation in gamma-ray (Figure 7a,b). According to the background curves, the well 16/8-3 S data points fall within the ductile to less-ductile zone, while 15/3-8 is mainly within the less-ductile to less-brittle region.
Though there is a significant difference in composition (GR range between 50 to 250 API), the data from 17/12-4 well from the Norwegian–Danish basin are clustered in a lower stiffness zone (Figure 7c). Although the elastic properties (Vp and density) and organic matters have a broader range, their impact on caprock stiffness is insignificant. The data points mostly cluster within low Es and high ν zones (Figure 7d). All the data points are plotted within the ductile to less-ductile zone irrespective of significant elastic properties’ variation.
SW Barents Sea (SWBS) well 7224/6-1, which shows a chaotic distribution in the Vp-Density plot (Figure 6e,f), represents a gradual increase in stiffness following compositional changes irrespective of upper and lower units (Figure 7e). However, the well 7122/7-6, which follows a compaction trend in the Vp-Density plot (Figure 6e,f), is distributed chaotically on the Es-ν plane. Upper Hekkingen Formation shows a sharp ν decrease with a very gentle change in Es, while the lower Fuglen Formation has a broad range of Es and ν. Comparatively, both formations have higher GR values indicating the presence of higher organic matters. Both wells show variation when compared with the Perez and Marfurt [66] BI zone boundaries. The well with few GR data points (7224/6-1) clustered within the ductile to less-brittle zone, while the significantly high-GR well 7122/7-6 shows that the data ranges from the ductile to brittle region (Figure 7f).
4.3. Comparative Analysis of Brittleness Indices
The brittleness indices value is the quantification technique of the caprock properties but varies significantly within different estimation methods. Various techniques used in this study have been compared in this section (Table 3). There are considerable differences observed between the mineralogical- and elastic properties-based brittleness indices estimations. Moreover, the EBIs also showed differences in comparison between them. Irrespective of wells and formations, MBI illustrated the highest brittleness indices value, except EBI2 in well 15/3-8 and 15/12-21. However, the overall EBI3 value was higher within EBIs and close to MBI, even higher in the Norwegian–Danish Basin area (i.e., Tau and Egersund formations).

Table 3.
Comparison of the brittleness indices of the Upper Jurassic caprock. (SVG = South Viking Graben; NNS = Northern North Sea; NDB = Norwegian Danish Basin and SWBS = South West Barents Sea).
Brittleness property increasing trends and the BI value significantly differ between EBI1 and acoustic property-based EBI3. When all the data points in EBI1 fall below 0.5 (ductile to less-ductile in range), most of the EBI2 data points fall between 0.25 to 0.75 (less-ductile to less-brittle) (Figure 8). The formation average value, however, indicated that a reasonable match is observed between EBI3 and MBI (Table 3). When comparing the database with the BI boundaries proposed by Perez and Marfurt [67], a significant deviation was also observed (Figure 8). Although BI values are significantly low based on the EBI1 method, the data fall within ductile to brittle zones.
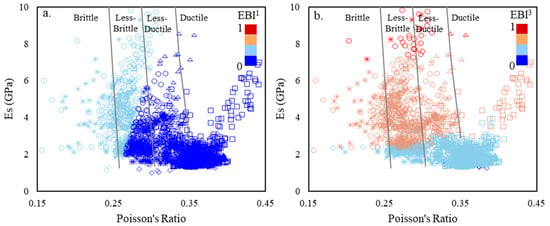
Figure 8.
Es versus ν cross-plots of the Upper Jurassic caprock from the North Sea and the Barents Sea color-coded with: (a) EBI1 and (b) EBI3. The BI boundaries are adapted from Perez and Marfurt [67].
5. Discussion
The paleo structural setting of each studied basin has unique characteristics. For instance, the SW Barents Sea has experienced significant exhumation (~1.4 km) with high TOC content (>20%), while the Viking Graben from the North Sea has zero net uplift with a high mature TOC fraction. On the contrary, the Norwegian–Danish Basin from the central North Sea has an intermediate stage of net uplift with a considerably high percentage of clay minerals and a comparatively low percentage of TOC (overall high ductile minerals assemblages). These differences indicate various diagenetic influences; hence, they have unique caprock geomechanical properties. The type of clay minerals dictates the mechanical compaction of caprock shale; whereas chemical compaction is temperature-dependent, the reactivation temperature varies significantly between clay mineralogy (i.e., ~60–70 °C for smectite and ~120 °C for kaolinite clay). Therefore, the type of clay is critical during caprock shale evaluation, which strongly depends on the sediment provenance, tectonic setting, and erosion and particle transportation rate from source to deposition. For instance, unstable minerals (i.e., chlorite and feldspar) indicate short transport with rapid erosion and differ from the distal mature fine particles [74]. Moreover, kaolinite clay represents a paleo-humid climate condition in the source area, while the smectite indicates dry conditions [75].
Properties of individual clay minerals (i.e., smectite, illite, kaolinite, chlorite, etc.) are also complex, though often treated indifferently while interpreting seismic and wireline logs [76]. The fractions of the silt and sand-sized particles within the shaly units also influence the compaction processes. Mechanical compaction-related grain reorientation significantly varies with the clay mineralogy and the fraction of coarser particles [77,78]. Temperature-dependent chemical compaction alters the clay particles to a stiffer clay mineral (illite) and micro-quartz and strengthens the grain framework [79,80]; however, this process is much more complicated than sandstone chemical compaction [81,82,83]. The optimal temperature needed to start chemical alteration varies between the type of clays as well. For instance, smectite clay reacts with a potassium source (normally K-feldspar) at around 60–70 °C, while the same reaction needs 120 °C for kaolinite clay. Horizontal thin laminations also make the caprock shale significantly anisotropic [1,41,84,85].
Although clay mineralogical analysis is out of the scope of this study, the bulk mineral variations within the different studied wells (located in various basins) indicated a considerable difference in the depositional environment. The studied rock from the Horda Platform possesses a strong correlation between mineralogical fractions and elastic properties [40]; hence, it might also influence the compaction processes of the studied wells. The temperature experienced by the studied rocks also varied considerably (Table 4). The study samples’ temperature had been estimated from the bottom hole temperature (BHT), where the seawater temperature was considered to be 5 °C. During the estimation of paleo/maximum temperature, the net uplift (Table 1) was considered. Paleo temperature of all the wells except 7122/7-6 indicated chemical initiation for smectite clay (>70 °C). Only well 15/3-8 from the SVG exceeded 120 °C, indicating a possible kaolinitic clay alteration. Due to these depositional and diagenetic variations, the studied rocks were altered differently; hence, the geomechanical properties are expected to vary considerably.

Table 4.
The present and paleo temperatures of the studied wells on top of the upper units.
5.1. Brittleness Indices Template
The brittleness template for the Es-ν cross-plot adapted from Perez and Marfurt [67] deviates significantly from the estimated elastic property-based brittleness indices (Figure 8). There are no similarities in the brittleness trends between the template and the methods used in this study. The Barnett shale, which was used to build the template, might have different depositional and diagenetic conditions compared with the studied shales. Rahman et al. [86] found similar deviations while working on Drake shale from the Horda Platform area and suggested a new template (Figure 9a). The elastic properties-based brittleness indices (i.e., EBI3) data points of Drake formation shale (0 to 1) were equally divided, where <0.25 indicated ductile and >0.75 was defined as brittle. From 0.25 to 0.5 and 0.5 to 0.75 were defined as less-ductile and less-brittle, respectively [87]. In this study, brittle shale data points follow the new template; however, the template boundary between less-ductile to less-brittle is within the less-brittle data points and away from the EBI3-defined division (Figure 9b). These observations signify the practicality and importance of a Norwegian Continental Shelf (NCS) basin-specific template. Deviation of the less-ductile to a less-brittle boundary between Lower Jurassic (proposed template database) and Upper Jurassic (this study) shales indicated a need for a formation-specific template as well. One should be aware that this proposed template is confined to static Young’s modulus estimation; therefore, before using it, one should employ Horsrud’s [72] empirical equation (Equation (4)) for Es estimation.
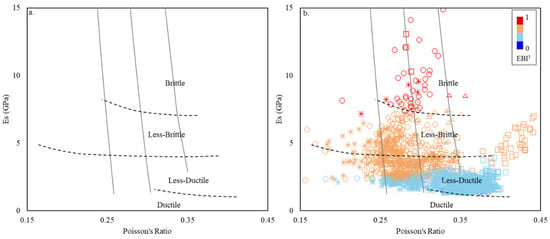
Figure 9.
(a) Brittleness template (black dotted lines) based on the Drake caprock shale data points (adapted from Rahman et al. [87]). The studied well data points show a better match with the new template (b). The Perez and Marfurt [67]) brittleness curves (solid lines) are also displayed for comparison.
The proposed brittleness template is defined based on the EBI3 values, which depend on the rocks’ acoustic impedance and deep resistivity. The relationship between the EBI3 and mineralogy within the studied wells also has been evaluated (Figure 10). Most of the data points follow a strong negative correlation comparing between EBI3 and ductile mineral assemblages, except for two outliers (Figure 10a). Comparing EBI3 and MBI the data points also follow a moderate trend with a linear correlation coefficient of ~65%, excluding the outlier data (Figure 10b). These relations indicated the effectiveness of the EBI3 empirical equation (i.e., Equation (6)) when there no mineralogical information is available. However, the moderate coefficient indicates the variability and complexity of brittleness indices estimations. Noteworthily, confidence in the practicality of the proposed brittleness template has been increased. However, the outlier two data points from Norwegian–Danish Basin indicated the complexities of the brittleness indices property within caprock shales.
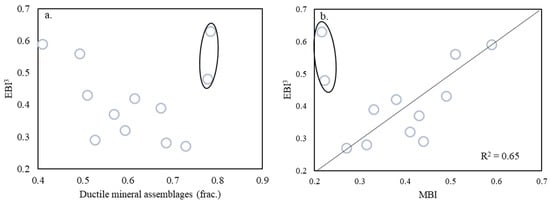
Figure 10.
Correlation between the elastic properties-based brittleness indices (EBI3) versus ductile mineral assemblages (a) and mineralogy-based brittleness indices (b). A strong correlation is observed between elastic properties and mineralogy within the studied wells.
5.2. Seal Integrity
Caprock assessment is critical in CO2 storage projects and in petroleum exploration evaluation because it prevents the vertical migration of fluids out of traps. Generally, top seal shale consists of fine-grained particles with significantly small pore throat radii and acts as an impermeable layer due to exceptionally high capillary entry pressure. However, leakage may occur when the fluid buoyancy pressure exceeds the capillary entry pressure, which is very unlikely in fine-grained shales. There might also be a possibility of the mechanical failure (shear failure and tensile fracture) of caprock shale when the reservoir’s pore pressure approaches the formation fracture strength [36]. The formation fracture strength depends on the rock geomechanical properties, such as brittleness/ductility [37], which is complex and influenced by many factors (i.e., mineral composition, pressure-temperature regime, compaction state, TOC amount, TOC type, and maturation, etc.). Processes such as variations in mineral composition, uplift, diagenesis, etc., have varied between the studied basins; hence, the effect of each process on seal integrity is discussed below.
5.2.1. Effect of Mineral Composition
Mineral components in any rock build the whole rock framework and are one of the internal factors affecting the geomechanical properties of caprock shales. The relation between mineral composition and brittleness indices in NCS caprock shale is already recognized [40]. Mineral composition indeed influences the top seal integrity. However, shale mineral composition fractions differ significantly depending on the paleo-depositional environments, with different origins and many post-depositional processes [2]. Shales mainly consist of clay and silt-size particles and are characterized by a dominant assembly of clay minerals with variable portion of quartz, feldspar, pyrite, and carbonates (i.e., calcite, dolomite, and siderite). Geomechanical properties of caprock (brittleness) mainly depend on the ductile (clay and TOC) and brittle (quartz, feldspar, pyrite, carbonates, etc.) mineral assemblages [24,26,27,28,68]. While TOC is considered to be a ductile component of MBI, it is important to understand that its behavior materially changes as a result of maturation [41,58,88,89]. Furthermore, this alteration significantly impacts the elastic properties of shale [41,58]. Before conversion, kerogen lenses behave as brittle, matrix-supporting elements [89,90,91]. However, maturation results in the creation of internal porosity [58], followed by the extrusion of bitumen into the created pore-space (i.e., microfractures), controlled by lithostatic load [88,92].
The difference in mineral-based brittleness indices within the study samples (Figure 5; Table 3) indicated the variation in mineral assemblages (ductile and brittle). The higher percentage of clay minerals in most of the wells from the Norwegian Danish Basin (NDB) significantly reduced the mineralogical brittleness indices. However, well 17/12-4 from NDB shows relatively higher MBI, although it has a very low Young’s modulus (Es) and Poisson’s ratio (ν)-based elastic brittleness indices value (Figure 7). On the contrary, the wells which have comparatively high acoustic properties (i.e., Vp and density) lead to a high EBI3 and have similar values to the MBI (Table 3). These results indicate a better correlation between mineralogy and acoustic properties-based brittleness compared to normalized Es and ν empirical relations (Figure 10).
5.2.2. Effect of Exhumation
Rock is subjected to relaxation during uplift and erosion, and extensional fractures might be created [34]. Top seal integrity might be reduced due to caprock shale fracture during unloading. Generally, while normally compacted, uncemented shales are expected to be ductile over the whole depth ranges (usually < 2 km); however, rocks with a high brittleness are found at shallow depths where a very significant uplift occurred [36]. Therefore, the percentage of ductile and brittle mineral assemblages plays a vital role during unloading.
The SW Barents Sea (SWBS) wells are significantly uplifted, where the caprock in 7224/6-1 is siltier (with high gamma-ray) than 7122/7-6 (Figure 6 and Figure 7). Moreover, the paleo-temperature of the later well remained within the mechanical compaction zone. The silty quartz-rich caprock might generate micro-fractures during uplift and has only the gas show compared with clay-rich oil discovery well 7122/7-6 [35].
An in-depth comparison of kerogen lenses from well 16/8-3 S (i.e., SVG, North Sea) and well 7125/1-1 (i.e., SW Barents Sea) revealed that exhumation has no visible impact on the shape, size, orientation, or distribution of kerogen lenses before conversion [92]. Despite similar bulk mineralogy, kerogen composition, and total burial depth [35,41,52], the two formations behave in a different manner elastically [93]. The zone in well 7125/1-1 acts markedly more brittle, utilizing more EBI than 16/8-3 S [92,93]. Geochemical markers and smectite–llite ratios reflect similar levels of maturation [52,92,93]; therefore, exhumation may account for this difference. In this study, considerable differences in caprock properties were also observed between wells from SVG (16/8-3 S) and SW Barents Sea (7224/6-1 and 7122/7-6) (Figure 6, Figure 7 and Figure 8; Table 3). The caprock in well 16/8-3 S behaves more ductile, with its properties clustered in a narrow range compared to SWBS wells, which indicated a broader, chaotically distributed property range. These might be the effect of significant unloading experienced by SWBS wells. There are possibilities of extensional fractures within caprock shale generated due to relaxation while uplift, which might significantly reduce the caprock integrity as a top seal.
5.2.3. Effect of Microfracture
Microfracture nucleation, growth, and internal interactions will determine the permeability of shale and, by extension, its suitability as a seal. Even if it is apparently a suitable seal, there are certain applications (e.g., nuclear waste, CO2 sequestration) that warrant an understanding of how the shale would alter with time (Figure 11 and Figure 12). Microfractures generated within shale have different categories based on intensity (i.e., moderate, strong, and intense) and can both be normal and parallel to the bedding [51,92,94,95]. Microfracture nucleation, growth, and interaction are controlled by a number of processes, each of which can be influenced by different factors. Within organic-rich shale, the common causes of microfracturing can be broken down into internal causes and external causes. Internal causes include the conversion of kerogen to hydrocarbons and the transition of hydrous to anhydrous minerals (e.g., smectite/illite transition) [3,92,94,95,96]. External causes include significant alterations in pressure–temperature (PT) regimes (e.g., uplift, tectonic activity) over relatively short geological timelines [44,97,98].
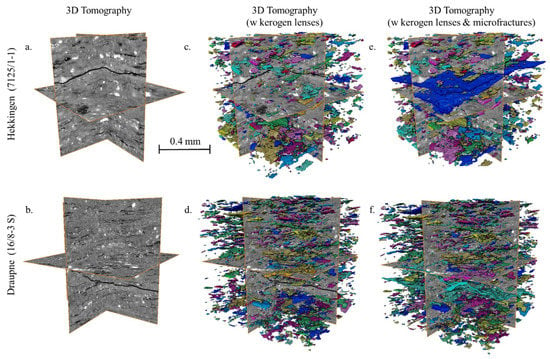
Figure 11.
3D tomographical images at 0.7 μm/voxel from both the Draupne (16/8-3 S) and Hekkingen Formations (7125/1-1). (a,b) Grayscale orthoslices highlighting fractures and kerogen lenses in black, (c,d) with 3D realization of just kerogen lenses, and (e,f) 3D realizations of kerogen lenses and branching microfractures.
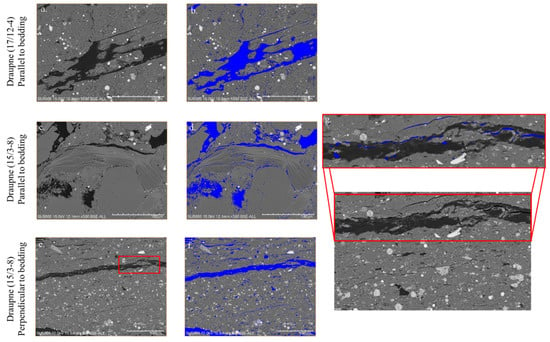
Figure 12.
SEM images showing the Draupne Formation from (a) 17/12-4, a comparatively immature sample showing solely kerogen lenses in black, and (b) again with the kerogen lenses highlighted in blue. (c) Draupne Formation from well 15/3-8, a comparatively mature sample, also shown parallel to bedding, and (d) again with the kerogen lenses and microfractures in blue. (e) Samples from 15/3-8 perpendicular to bedding showing partially extruded kerogen and the resulting microfractures, and (f) again with the extruded kerogen and microfractures highlighted in blue. (g) A magnified section of the Draupne Formation (marked with a red rectangle in image (e) highlighting the microfractures in blue compared to the extruded kerogen in black. Note that the SEM images have scale differences.
The most important internal control on microfracture nucleation is kerogen lens size (Figure 11 and Figure 12), where a larger kerogen lens will contribute to faster and larger microfracture creation [92,99,100]. The orientation and distribution of kerogen lenses (Figure 11 and Figure 12) within the fabric will determine the angle of microfracture growth, which for Type II kerogen ranges dominantly from 0–30° to bedding [92]. Note that the connectivity of microfractures will also depend on the ratio of horizontal to vertical stress, where lower horizontal stress results in lower permeability due to microfractures [101]. Fluid viscosity also impacts microfracture growth, where a lower viscosity of fluid results in the creation of more complex fractures with high permeability [101]. This indicates that shale dominated by Type III (i.e., gas prone) kerogen lenses is more likely to create complex networks than that dominated by Type II (i.e., oil and gas prone). Therefore, Barents Sea shales would not have the ability to develop networks at the same level of complexity based on kerogen type (Figure 2). It also implies that shale seals that may become overpressured due to CO2 sequestration are more prone to leakage than if other fluids are injected (e.g., CH4, H2O).
Since the Hekkingen Formation (Barents Sea) has experienced significant uplift compared to the Draupne Formation (North Sea), one could expect a greater degree of fracturing. However, Johnson et al. [92] noted otherwise when comparing 3D tomographical scans of core from wells within the study area. Therefore, we assume that either (1) the uplift continued over enough geological time to prevent microfracturing associated with it, or (2) mineralogy inherent to the Hekkingen assisted in fracture healing. The caprock zones in the studied wells have a significant amount of clay, including smectite, which is known to swell with increased fluid content [102,103,104].
Microfracture networks influence caprock properties, the impact of which is observable utilizing EBI [41]. Bedding parallel and normal fractures were observed in SEM images of the Draupne Formation when sufficiently mature (Figure 11a–f). Some of the bedding normal fractures were generated due to organic carbon maturation, as seen through the association with the layer of organic carbon observed. Moreover, deep resistivity and TOC data from this well confirmed the TOC abundance and maturation (Figure 7). On the contrary, fracturing parallel to the bedding is associated with secondary carbonate and the clay mineral layer. The TOC layering is not involved, which suggests this fracturing occurred due to the diagenesis processes and clay mineral alteration.
6. Conclusions
Depositional and diagenetic variations within the different basins in the Norwegian Continental Shelf significantly influence the caprock geomechanical properties, hence, the top seal integrity. The key outcomes of this study are as follows:
- There is no trend between the studied upper and lower units; rather, the geomechanical property of each unit depends on its composition and processes. However, compared to the basin, the lower unit is comparatively stiffer except for in the Norwegian–Danish basin.
- Ductile and brittle mineral assemblages varied between the studied basins, influencing the value of mineralogy-based brittleness. The highly ductile minerals significantly increase the ductile behavior of caprock shale.
- The normalized Young’s modulus and Poisson’s ratio-based empirical equation underestimated the brittleness indices compared with mineralogy and acoustic properties-based brittleness values.
- The clay volume decreasing trend has a considerable match with the acoustic properties-based brittleness increasing trend. A similar trend is also observed in the proposed NCS brittleness template.
- Mineralogy of the caprock shale significantly influences the exhumation processes. Clay-rich shale reduces the possibility of shear failure during uplift than quartz-rich shale.
- Understanding the major drivers (e.g., kerogen conversion, mineral conversion) for microfracturing may indicate the likelihood of seal failure. Clay mineralogy composition and kerogen type may define the extent of microfracturing, connectivity, and the ability to heal.
- The moderate correlation between mineralogy and acoustic property-based brittleness indices indicated the complexities of brittleness indices estimation. However, an integrated approach during caprock integrity assessment is suggested due to the specific limitations of different BI estimation methods. In addition, additional lab measurements with petrographic analysis might improve the mechanical behavior of caprock shales.
Author Contributions
Conceptualization, M.J.R.; methodology, M.J.R. and J.R.J.; software, M.J.R.; validation, M.J.R., J.R.J., M.F. and N.H.M.; formal analysis, M.J.R.; investigation, M.J.R. and J.R.J.; resources, M.J.R. and J.R.J.; data curation, M.J.R.; writing—original draft preparation, M.J.R.; writing—review and editing, M.J.R., J.R.J., M.F. and N.H.M.; visualization, M.J.R.; supervision, M.F. and N.H.M.; project administration, N.H.M.; funding acquisition, N.H.M. All authors have read and agreed to the published version of the manuscript.
Funding
This research was funded by the Research Council of Norway, grant numbers #280472 and #267775.
Institutional Review Board Statement
Not applicable.
Informed Consent Statement
Not applicable.
Data Availability Statement
Not applicable.
Acknowledgments
We are grateful for the financial support provided by the Research Council of Norway for the OASIS (Overburden Analysis and Seal Integrity Study for CO2 Sequestration in the North Sea) project (#280472) and the Prometheus project (#267775). We thank Equinor and the license partners for obtaining the cores and permission to use them. Further to this we acknowledge the European Synchrotron Radiation Facility (ESRF) for use of the facility. Also we thank Francois Renard, Maya Kobchenko, Elodie Boller, and Benoit Cordonnier for assistance in providing access to and using beamline ID19 at the ESRF. We are indebted to the additional funding and data provided by Norwegian Petroleum Directorate (NPD), Gassnova, Equinor, and TotalEnergies. Academic software license has been provided by Lloyd’s Register for Interactive Petrophysics.
Conflicts of Interest
The authors declare no conflict of interest.
References
- Johnson, J.R. Applications of Geostatistical Seismic Inversion to the Vaca Muerta, Neuquen Basin, Argentina; Colorado School of Mines: Golden, CO, USA, 2017. [Google Scholar]
- Hart, B.S.; Macquaker, J.H.S.; Taylor, K.G. Mudstone (“shale”) depositional and diagenetic processes: Implications for seismic analyses of source-rock reservoirs. Interpretation 2013, 1, B7–B26. [Google Scholar] [CrossRef]
- Mondol, N.H.; Bjørlykke, K.; Jahren, J. Experimental compaction of clays: Relationship between permeability and petrophysical properties in mudstones. Pet. Geosci. 2008, 14, 319–337. [Google Scholar] [CrossRef]
- Mondol, N.H.; Jahren, J.; Berre, T.; Grande, L.; Bjørlykke, K. Permeability Anisotropy in Synthetic Mudstones—An Experimental Study. In Proceedings of the 73rd EAGE Conference and Exhibition incorporating SPE EUROPEC 2011. European Association of Geoscientists & Engineers, Vienna, Austria, 23–27 May 2011. [Google Scholar] [CrossRef]
- Storvoll, V.; Bjørlykke, K.; Mondol, N.H. Velocity-depth trends in Mesozoic and Cenozoic sediments from the Norwegian Shelf. AAPG Bull. 2005, 89, 359–381. [Google Scholar] [CrossRef]
- Hawkes, C.; McLellan, P.; Bachu, S. Geomechanical Factors Affecting Geological Storage of CO2 in Depleted Oil and Gas Reservoirs. J. Can. Pet. Technol. 2005, 44. [Google Scholar] [CrossRef]
- Rutqvist, J.; Birkholzer, J.; Tsang, C.-F. Coupled reservoir–geomechanical analysis of the potential for tensile and shear failure associated with CO2 injection in multilayered reservoir–caprock systems. Int. J. Rock Mech. Min. Sci. 2008, 45, 132–143. [Google Scholar] [CrossRef]
- Rutqvist, J.; Birkholzer, J.; Cappa, F.; Tsang, C.-F. Estimating maximum sustainable injection pressure during geological sequestration of CO2 using coupled fluid flow and geomechanical fault-slip analysis. Energy Convers. Manag. 2007, 48, 1798–1807. [Google Scholar] [CrossRef]
- Soltanzadeh, H.; Hawkes, C.D. Semi-analytical models for stress change and fault reactivation induced by reservoir production and injection. J. Pet. Sci. Eng. 2008, 60, 71–85. [Google Scholar] [CrossRef]
- E Streit, J.; Hillis, R.R. Estimating fault stability and sustainable fluid pressures for underground storage of CO2 in porous rock. Energy 2004, 29, 1445–1456. [Google Scholar] [CrossRef]
- Liu, B.; Yang, Y.; Li, J.; Chi, Y.; Li, J.; Fu, X. Stress sensitivity of tight reservoirs and its effect on oil saturation: A case study of Lower Cretaceous tight clastic reservoirs in the Hailar Basin, Northeast China. J. Pet. Sci. Eng. 2019, 184, 106484. [Google Scholar] [CrossRef]
- Guo, Z.; Chapman, M.; Li, X. Exploring the effect of fractures and microstructure on brittleness index in the Barnett Shale. In SEG Technical Program Expanded Abstracts 2012; Society of Exploration Geophysicists: Houston, TX, USA, 2012. [Google Scholar] [CrossRef]
- Josh, M.; Esteban, L.; Piane, C.D.; Sarout, J.; Dewhurst, D.; Clennell, M. Laboratory characterisation of shale properties. J. Pet. Sci. Eng. 2012, 88-89, 107–124. [Google Scholar] [CrossRef]
- Kivi, I.R.; Ameri, M.; Molladavoodi, H. Shale brittleness evaluation based on energy balance analysis of stress-strain curves. J. Pet. Sci. Eng. 2018, 167, 1–19. [Google Scholar] [CrossRef]
- Arthur, M. Strength of Materials; Longmans, Green, Co.: New York, NY, USA, 1913; p. 497. [Google Scholar]
- Hetenyi, M. Handbook of Experimental Stress Analysis; John Wiley & Sons: New York, NY, USA, 1950; p. 773. [Google Scholar]
- Ramsay, J.G. Folding and Fracturing of Rocks; Mc Graw Hill B Co.: San Francisco, CA, USA, 1967; p. 568. [Google Scholar]
- Obert, L.; Duvall, W.I. Rock Mechanics and the Design of Structures in Rock; J. Wiley: New York, NY, USA, 1967. [Google Scholar]
- Tarasov, B.; Potvin, Y. Universal criteria for rock brittleness estimation under triaxial compression. Int. J. Rock Mech. Min. Sci. 2013, 59, 57–69. [Google Scholar] [CrossRef]
- Tarasov, B.; Randolph, M. Superbrittleness of rocks and earthquake activity. Int. J. Rock Mech. Min. Sci. 2011, 48, 888–898. [Google Scholar] [CrossRef]
- Andreev, G.E. Brittle Failure of Rock Materials; CRC Press: Boca Raton, FL, USA, 1995. [Google Scholar]
- Grieser, W.V.; Bray, J.M. Identification of production potential in unconventional reservoirs. In Proceedings of the Production and Operation Symposium, Oklahoma City, OK, USA, 31 March 2007. [Google Scholar]
- Hucka, V.; Das, B. Brittleness determination of rocks by different methods. Int. J. Rock Mech. Min. Sci. Géoméch. Abstr. 1974, 11, 389–392. [Google Scholar] [CrossRef]
- Jarvie, D.M.; Hill, R.J.; Ruble, T.E.; Pollastro, R.M. Unconventional shale-gas systems: The Mississippian Barnett Shale of north-central Texas as one model for thermogenic shale-gas assessment. AAPG Bull. 2007, 91, 475–499. [Google Scholar] [CrossRef]
- Quinn, J.B.; Quinn, G.D. Indentation brittleness of ceramics: A fresh approach. J. Mater. Sci. 1997, 32, 4331–4346. [Google Scholar] [CrossRef]
- Wang, F.P.; Gale, J.F.W. Screening criteria for shale-gas systems. Gulf Coast Assoc. Geol. Soc. Trans. 2009, 59, 779–793. [Google Scholar]
- Glorioso, J.C.; Rattia, A. Unconventional Reservoirs: Basic Petrophysical Concepts for Shale Gas. In Proceedings of the SPE/EAGE European Unconventional Resources Conference and Exhibition from Potential to Production, Vienna, Austria, 20–22 March 2012. [Google Scholar] [CrossRef]
- Rybacki, E.; Meier, T.; Dresen, G. What controls the mechanical properties of shale rocks?–Part II: Brittleness. J. Pet. Sci. Eng. 2016, 144, 39–58. [Google Scholar] [CrossRef]
- Mews, K.S.; Alhubail, M.M.; Barati, R.G. A Review of Brittleness Index Correlations for Unconventional Tight and Ultra-Tight Reservoirs. Geosciences 2019, 9, 319. [Google Scholar] [CrossRef]
- Rickman, R.; Mullen, M.J.; Petre, J.E.; Grieser, W.V.; Kundert, D. A Practical Use of Shale Petrophysics for Stimulation Design Optimization: All Shale Plays Are Not Clones of the Barnett Shale. In Proceedings of the SPE Annual Technical Conference and Exhibition, Denver, CO, USA, 21–24 September 2008. [Google Scholar] [CrossRef]
- Zhang, D.; Ranjith, P.; Perera, M. The brittleness indices used in rock mechanics and their application in shale hydraulic fracturing: A review. J. Pet. Sci. Eng. 2016, 143, 158–170. [Google Scholar] [CrossRef]
- Chen, T.; Feng, X.-T.; Cui, G.; Tan, Y.; Pan, Z. Experimental study of permeability change of organic-rich gas shales under high effective stress. J. Nat. Gas Sci. Eng. 2019, 64, 1–14. [Google Scholar] [CrossRef]
- Tan, Y.; Pan, Z.; Feng, X.-T.; Zhang, D.; Connell, L.D.; Li, S. Laboratory characterisation of fracture compressibility for coal and shale gas reservoir rocks: A review. Int. J. Coal Geol. 2019, 204, 1–17. [Google Scholar] [CrossRef]
- Bjørlykke, K. Petroleum Migration; Petroeum Geosciences: From Sedimentary Environments to Rock Physics Book; Springer: Berlin/Heidelberg, Germany, 2015; pp. 373–384. [Google Scholar]
- Hansen, J.A.; Mondol, N.H.; Tsikalas, F.; Faleide, J.I. Caprock characterization of Upper Jurassic organic-rich shales using acoustic properties, Norwegian Continental Shelf. Mar. Pet. Geol. 2020, 121, 104603. [Google Scholar] [CrossRef]
- Ingram, G.; Urai, J.; Naylor, M. Sealing processes and top seal assessment. In Norwegian Petroleum Society Special Publications; Elsevier: Amsterdam, The Netherlands, 1997; Volume 7, pp. 165–174. [Google Scholar] [CrossRef]
- Nygård, R.; Gutierrez, M.; Bratli, R.K.; Høeg, K. Brittle–ductile transition, shear failure and leakage in shales and mudrocks. Mar. Pet. Geol. 2006, 23, 201–212. [Google Scholar] [CrossRef]
- Faleide, J.I.; Tsikalas, F.; Breivik, A.J.; Mjelde, R.; Ritzmann, O.; Engen, O.; Wilson, J.; Eldholm, A.O. Structure and evolution of the continental margin off Norway and the Barents Sea. Episodes 2008, 31, 82–91. [Google Scholar] [CrossRef]
- Faleide, J.I.; Bjørlykke, K.; Gabrielsen, R.H. Geology of the Norwegian Continental Shelf; Petroeum Geosciences: From Sedimentary Environments to Rock Physics book; Springer: Berlin/Heidelberg, Germany, 2015; pp. 603–637. [Google Scholar]
- Rahman, J.; Fawad, M.; Mondol, N.H. Organic-rich shale caprock properties of potential CO2 storage sites in the northern North Sea, offshore Norway. Mar. Pet. Geol. 2020, 122, 104665. [Google Scholar] [CrossRef]
- Johnson, J.R.; Hansen, J.A.; Rahman, M.D.J.; Renard, F.; Mondol, N.H. Mapping the maturity of organic-rich shale with combined geochemical and geophysical data, Draupne Formation, Norwegian Continental Shelf. Mar. Pet. Geol. 2022, 138, 105525. [Google Scholar] [CrossRef]
- Baig, I.; Faleide, J.I.; Jahren, J.; Mondol, N.H. Cenozoic exhumation on the southwestern Barents Shelf: Estimates and uncertainties constrained from compaction and thermal maturity analyses. Mar. Pet. Geol. 2016, 73, 105–130. [Google Scholar] [CrossRef]
- Henriksen, E.; Bjørnseth, H.M.; Hals, T.K.; Heide, T.; Kiryukhina, T.; Kløvjan, O.S.; Larssen, G.B.; Ryseth, A.E.; Rønning, K.; Sollid, K.; et al. Chapter 17 Uplift and erosion of the greater Barents Sea: Impact on perspectivity and petroleum systems. Geol. Soc. Lond. Mem. 2011, 35, 271–281. [Google Scholar] [CrossRef]
- Baig, I.; Faleide, J.I.; Mondol, N.H.; Jahren, J. Burial and exhumation history controls on shale compaction and thermal maturity along the Norwegian North Sea basin margin areas. Mar. Pet. Geol. 2019, 104, 61–85. [Google Scholar] [CrossRef]
- Hansen, J.A.; Yenwongfai, H.; Fawad, M.; Mondol, N. Estimating exhumation using experimental compaction trends and rock physics relations, with continuation into analysis of source and reservoir rocks: Central North Sea, offshore Norway. In Proceedings of the 2017 SEG International Exposition and Annual Meeting, Houston, TX, USA, 24–27 September 2017. [Google Scholar] [CrossRef]
- Fawad, M.; Rahman, J.; Mondol, N.H. Seismic reservoir characterization of potential CO2 storage reservoir sandstones in Smeaheia area, Northern North Sea. J. Pet. Sci. Eng. 2021, 205, 108812. [Google Scholar] [CrossRef]
- Dalland, A.; Worsley, D.; Ofstad, K. A Lithostratigraphic Scheme for the Mesozoic and Cenozoic and Succession Offshore Mid-and Northern Norway; Oljedirektoratet: Stavanger, Norway, 1988. [Google Scholar]
- NPD. NPD FactPages 2022. Available online: https://npdfactpages.npd.no/factpages/Default.aspx?culture=en (accessed on 15 July 2022).
- Vollset, J.; Doré, A.G. A revised Triassic and Jurassic Lithostratigraphic Nomenclature for the Norwegian North Sea; Oljedirektoratet: Stavanger, Norway, 1984. [Google Scholar]
- Hansen, J.A.; Mondol, N.H.; Fawad, M. Organic content and maturation effects on elastic properties of source rock shales in the Central North Sea. Interpretation 2019, 7, T477–T497. [Google Scholar] [CrossRef]
- Kalani, M.; Jahren, J.; Mondol, N.H.; Faleide, J.I. Petrophysical implications of source rock microfracturing. Int. J. Coal Geol. 2015, 143, 43–67. [Google Scholar] [CrossRef]
- Koochak Zadeh, M.; Haque Mondol, N.; Jahren, J. Velocity anisotropy of Upper Jurassic organic-rich shales, Norwegian continental shelf. Geophysics 2017, 82, C61–C75. [Google Scholar] [CrossRef]
- Nooraiepour, M.; Mondol, N.H.; Hellevang, H.; Bjørlykke, K. Experimental mechanical compaction of reconstituted shale and mudstone aggregates: Investigation of petrophysical and acoustic properties of SW Barents Sea cap rock sequences. Mar. Pet. Geol. 2017, 80, 265–292. [Google Scholar] [CrossRef]
- Fjar, E.; Holt, R.M.; Raaen, A.M.; Horsrud, P. Petroleum Related Rock Mechanics; Elsevier: Amsterdam, The Netherlands, 2008. [Google Scholar]
- Peters, K.E. Guidelines for Evaluating Petroleum Source Rock Using Programmed Pyrolysis. AAPG Bull. 1986, 70, 318–329. [Google Scholar] [CrossRef]
- Hunt, J.M. Petroleum geology and geochemistry. EmanandCompanyt San Fr. 1996, 273, 197. [Google Scholar]
- Passey, Q.R.; Creaney, S.; Kulla, J.B.; Moretti, F.J.; Stroud, J.D. A practical model for organic richness from porosity and resistivity logs. Am. Assoc. Pet. Geol. Bull. 1990, 74, 1777–1794. [Google Scholar]
- Alfred, D.; Vernik, L. A new petrophysical model for organic shales. Petrophysics 2013, 54, 240–247. [Google Scholar]
- Dang, S.T.; Sondergeld, C.H.; Rai, C.S. A new approach to measuring organic density. Petrophysics 2016, 57, 112–120. [Google Scholar]
- Vernik, L.; Landis, C. Elastic Anisotropy of Source Rocks: Implications for Hydrocarbon Generation and Primary Migration. Am. Assoc. Pet. Geol. Bull. 1996, 80, 531–544. [Google Scholar]
- Vernik, L.; Milovac, J. Rock physics of organic shales. Lead Edge 2011, 30, 318–323. [Google Scholar] [CrossRef]
- Carcione, J.M.; Avseth, P. Rock-physics templates for clay-rich source rocksRPTs for clay-rich source rocks. Geophysics 2015, 80, D481–D500. [Google Scholar] [CrossRef]
- Isaksen, G.H.; Bohacs, K.M. Geological Controls of Source Rock Geochemistry through Relative Sea Level. Triassic, Barents Sea. In Petroleum Source Rocks Book; Springer: Berlin, Germany, 1995; pp. 25–50. [Google Scholar] [CrossRef]
- Peters, K.E.; Walters, C.C.; Moldowan, J.M. Geochemical Screening; Cambridge University Press: Cambridge, UK, 2004; pp. 72–118. [Google Scholar] [CrossRef]
- Avseth, P.; Mukerji, T.; Mavko, G. Quantitative Seismic Interpretation: Applying Rock Physics Tools to Reduce Interpretation Risk; Cambridge University Press: Cambridge, UK, 2005. [Google Scholar]
- Perez Altamar, R.; Marfurt, K. Mineralogy-based brittleness prediction from surface seismic data: Application to the Barnett Shale. Interpretation 2014, 2, T1–T17. [Google Scholar] [CrossRef]
- Alzahabi, A.; AlQahtani, G.; Soliman, M.Y.; Bateman, R.M.; Asquith, G.; Vadapalli, R. Fracturability Index is a Mineralogical Index: A New Approach for Fracturing Decision. In Proceedings of the SPE Saudi Arabia Section Annual Technical Symposium and Exhibition, Al-Khobar, Saudi Arabia, 21–23 April 2015. [Google Scholar] [CrossRef]
- Jin, X.; Shah, S.N.; Roegiers, J.-C.; Zhang, B. Fracability Evaluation in Shale Reservoirs—An Integrated Petrophysics and Geomechanics Approach. In Proceeding of the SPE Hydraulic Fracturing Technology Conference, The Woodlands, TX, USA, 4–6 February 2014. [Google Scholar] [CrossRef]
- Gholami, R.; Rasouli, V.; Sarmadivaleh, M.; Minaeian, V.; Fakhari, N. Brittleness of gas shale reservoirs: A case study from the north Perth basin, Australia. J. Nat. Gas Sci. Eng. 2016, 33, 1244–1259. [Google Scholar] [CrossRef]
- Chen, J.; Zhang, G.; Chen, H.; Yin, X. The construction of shale rock physics effective model and prediction of rock brittleness. In SEG Technical Program Expanded Abstracts; Society of Exploration Geophysicists: Tulsa, OK, USA, 2014; pp. 2861–2865. [Google Scholar] [CrossRef]
- Sharma, R.K.; Chopra, S. New attribute for determination of lithology and brittleness. In SEG Technical Program Expanded Abstracts 2012; Society of Exploration Geophysicists: Tulsa, OK, USA, 2012; pp. 1–5. [Google Scholar] [CrossRef]
- Fawad, M.; Mondol, N.H. Method for Estimating Rock Brittleness from Well-Log Data. U.S. Patent US20210255359A1, 19 August 2021. [Google Scholar]
- Horsrud, P. Estimating Mechanical Properties of Shale From Empirical Correlations. SPE Drill. Complet. 2001, 16, 68–73. [Google Scholar] [CrossRef]
- Bjørlykke, K. Sedimentary Geochemistry; Springer: Berlin/Heidelberg, Germany, 2015; pp. 91–117. [Google Scholar] [CrossRef]
- Bjørlykke, K. Mudrocks, Shales, Silica Deposits and Evaporites; Springer: Berlin/Heidelberg, Germany, 2015; pp. 217–229. [Google Scholar]
- Bjørlykke, K. Compaction of Sedimentary Rocks: Shales, Sandstones and Carbonates; Springer: Berlin/Heidelberg, Germany, 2015; pp. 351–360. [Google Scholar] [CrossRef]
- Fawad, M.; Mondol, N.H.; Jahren, J.; Bjørlykke, K. Microfabric and rock properties of experimentally compressed silt-clay mixtures. Mar. Pet. Geol. 2010, 27, 1698–1712. [Google Scholar] [CrossRef]
- Voltolini, M.; Wenk, H.-R.; Mondol, N.H.; Bjørlykke, K.; Jahren, J. Anisotropy of experimentally compressed kaolinite-illite-quartz mixtures. Geophysics 2009, 74, D13–D23. [Google Scholar] [CrossRef]
- Bjørlykke, K. Clay mineral diagenesis in sedimentary basins—A key to the prediction of rock properties. Examples from the North Sea Basin. Clay Miner 1998, 33, 15–34. [Google Scholar]
- Zadeh, M.K.; Mondol, N.H.; Jahren, J. Compaction and rock properties of Mesozoic and Cenozoic mudstones and shales, northern North Sea. Mar. Pet. Geol. 2016, 76, 344–361. [Google Scholar] [CrossRef]
- Baldwin, B.; Butler, C.O. Compaction curves. Am. Assoc. Pet. Geol. Bull. 1985, 69, 622–626. [Google Scholar]
- Magara, K. Comparison of porosity-depth relationships of shale and sandstone. J. Pet. Geol. 1980, 3, 175–185. [Google Scholar] [CrossRef]
- Mondol, N.H.; Bjørlykke, K.; Jahren, J.; Høeg, K. Experimental mechanical compaction of clay mineral aggregates—Changes in physical properties of mudstones during burial. Mar. Pet. Geol. 2007, 24, 289–311. [Google Scholar] [CrossRef]
- Mondol, N.H.; Grande, L.; Aker, E.; Berre, T.; Ørbech, T.; Duffaut, K.; Jahren, J.; Bjørlykke, K. Velocity anisotropy of a shallow mudstone core. In Second EAGE Work. Shales; European Association of Geoscientists & Engineers: Houten, The Netherlands, 2010; p. cp-158. [Google Scholar]
- Mondol, N.H. Velocity anisotropy in experimentally compacted clay-silt and clay-clay mixtures. In SEG Technical Program Expanded Abstracts 2012; Society of Exploration Geophysicists: Tulsa, OK, USA, 2012. [Google Scholar] [CrossRef]
- Rahman, M.J.; Fawad, M.; Jahren, J.; Mondol, N.H. Influence of depositional and diagenetic processes on caprock properties of CO2 storage sites in the northern North Sea, offshore Norway. Geoscience 2022, 12, 181. [Google Scholar] [CrossRef]
- Rahman, J.; Fawad, M.; Jahren, J.; Mondol, N.H. Top seal assessment of Drake Formation shales for CO2 storage in the Horda Platform area, offshore Norway. Int. J. Greenh. Gas Control. 2022, 119, 103700. [Google Scholar] [CrossRef]
- Pepper, A.S.; Corvi, P.J. Simple kinetic models of petroleum formation. Part I: Oil and gas generation from kerogen. Mar. Pet. Geol. 1995, 12, 291–319. [Google Scholar] [CrossRef]
- Prasad, M.; Mba, K.C.; McEvoy, T.E.; Batzle, M.L. Maturity and Impedance Analysis of Organic-Rich Shales. SPE Reserv. Eval. Eng. 2011, 14, 533–543. [Google Scholar] [CrossRef]
- Brochard, L.; Hantal, G.; Laubie, H.; Ulm, F.J.; Pellenq, R.J.-M. Fracture Mechanisms in Organic-Rich Shales: Role of Kerogen. In Proceedings of the Fifth Biot Conference on Poromechanics, Vienna, Austria, 10–12 July 2013. [Google Scholar] [CrossRef]
- Allan, A.; Vanorio, T.; Dahl, J.E.P. Pyrolysis-induced P-wave velocity anisotropy in organic-rich shales. Geophysics 2014, 79, D41–D53. [Google Scholar] [CrossRef]
- Johnson, J.R.; Kobchenko, M.; Mondol, N.H.; Renard, F. Multiscale synchrotron microtomography imaging of kerogen lenses in organic-rich shales from the Norwegian Continental Shelf. Int. J. Coal Geol. 2022, 253, 103954. [Google Scholar] [CrossRef]
- Johnson, J.R.; Renard, F.; Mondol, N.H. Salt remobilization timing and its impact on two Norwegian Continental Shelf organic-rich shale formations. In Proceedings of the GeoConvention, Virtual, 13–15 September 2021. [Google Scholar]
- Anders, M.H.; Laubach, S.E.; Scholz, C.H. Microfractures: A review. J. Struct. Geol. 2014, 69, 377–394. [Google Scholar] [CrossRef]
- Teixeira, M.G.; Donzé, F.; Renard, F.; Panahi, H.; Papachristos, E.; Scholtès, L. Microfracturing during primary migration in shales. Tectonophysics 2017, 694, 268–279. [Google Scholar] [CrossRef]
- Vidal, O.; Dubacq, B. Thermodynamic modelling of clay dehydration, stability and compositional evolution with temperature, pressure and H2O activity. Geochim. Cosmochim. Acta 2009, 73, 6544–6564. [Google Scholar] [CrossRef]
- Rabbel, O.; Mair, K.; Galland, O.; Grühser, C.; Meier, T. Numerical Modeling of Fracture Network Evolution in Organic-Rich Shale With Rapid Internal Fluid Generation. J. Geophys. Res. Solid Earth 2020, 125, e2020JB019445. [Google Scholar] [CrossRef]
- Rummel, L.; Kaus, B.J.P.; Baumann, T.S.; White, R.; Riel, N. Insights into the Compositional Evolution of Crustal Magmatic Systems from Coupled Petrological-Geodynamical Models. J. Pet. 2020, 61, egaa029. [Google Scholar] [CrossRef]
- Fan, Z.Q.; Jin, Z.-H.; Johnson, S.E. Subcritical propagation of an oil-filled penny-shaped crack during kerogen-oil conversion. Geophys. J. Int. 2010, 182, 1141–1147. [Google Scholar] [CrossRef]
- Jin, Z.-H.; Johnson, S.E.; Fan, Z.Q. Subcritical propagation and coalescence of oil-filled cracks: Getting the oil out of low-permeability source rocks. Geophys. Res. Lett. 2010, 37. [Google Scholar] [CrossRef]
- He, Q.; He, B.; Li, F.; Shi, A.; Chen, J.; Xie, L.; Ning, W. Fractal Characterization of Complex Hydraulic Fractures in Oil Shale via Topology. Energies 2021, 14, 1123. [Google Scholar] [CrossRef]
- Ougier-Simonin, A.; Renard, F.; Boehm, C.; Vidal-Gilbert, S. Microfracturing and microporosity in shales. Earth-Sci. Rev. 2016, 162, 198–226. [Google Scholar] [CrossRef]
- Voltolini, M.; Ajo-Franklin, J.B. The Sealing Mechanisms of a Fracture in Opalinus Clay as Revealed by in situ Synchrotron X-ray Micro-Tomography. Front. Earth Sci. 2020, 8, 207. [Google Scholar] [CrossRef]
- Montes, H.G.; Duplay, J.; Martinez, L.; Escoffier, S.; Rousset, D. Structural modifications of Callovo-Oxfordian argillite under hydration/dehydration conditions. Appl. Clay Sci. 2004, 25, 187–194. [Google Scholar] [CrossRef]
Publisher’s Note: MDPI stays neutral with regard to jurisdictional claims in published maps and institutional affiliations. |
© 2022 by the authors. Licensee MDPI, Basel, Switzerland. This article is an open access article distributed under the terms and conditions of the Creative Commons Attribution (CC BY) license (https://creativecommons.org/licenses/by/4.0/).