Abstract
Serious deficiencies in ground characterization, analysis and design at engineering works can occur when working with bimrocks (block-in-matrix rocks) and bimsoils (block-in-matrix soils). Since the 1990s, serious technical problems at engineering works performed in bimrocks/bimsoils spurred practical research, which revealed that the behavior of these geomaterials is directly related to the volumetric block proportions (VBPs). However, the way that VBPs can be confidently and correctly estimated remains an ongoing critical issue that still frustrates designers, contractors and owners. Stereological techniques can be applied to overcome this challenge by inferring 3D block contents from in situ 1D and 2D measurements, but the estimates have often been demonstrated to be erroneous. This paper presents findings from a computer-aided reinvestigation, revalidation and extension of Medley’s work of 1997 and subsequent researchers to provide approachable yet statistically robust methods to limit the uncertainty associated with estimates of 3D VBPs generated from 1D boring/scanline measurements. To this aim, a specialized Matlab code was created and virtual drilling programs were performed through 3D computer-generated bimrock models. Supported by extensive statistical-based investigations, a design chart is provided that updates and extends Medley’s 1999 chart relating uncertainty in estimates of VBP as a function of total boring/scanline lengths.
1. Introduction
The characterization of block-in-matrix formations (i.e., bimrocks and bimsoils) is recognized as a key challenge by all geopractitioners and researchers working in the broad field of heterogeneous geotechnically complex formations [1,2,3,4,5,6,7].
Simplified approaches to characterization, such as ignoring the presence of rock blocks, have often been adopted by geopractitioners to design engineering works in/on bimrocks and bimsoils. However, as widely demonstrated in the literature, the presence of blocks cannot be ignored since the strength, deformability and failure mode of these complex geomaterials are directly related to their volumetric block proportion (VBP), when it falls between about 20% and 75% [8,9,10,11,12,13,14,15]. Higher VBPs result in strength increases, lower deformability and more tortuous failure surfaces [10,16,17,18,19,20,21,22,23,24,25,26,27,28].
Moreover, when excavating and tunneling in complex geomaterials, the presence of rock blocks can cause damage to cutters and/or linings, face instabilities and obstructions among several others consequences [29,30,31,32].
Information about bimrock/bimsoil block proportions is, therefore, extremely important in order to (i) make reliable predictions of their geomechanical behavior, (ii) choose appropriate earthwork equipment and underground excavation and support methods [12,31,33] and (iii) reduce safety risks and extra costs caused by unexpected technical problems that can occur during excavation/construction works.
Site-scale VBP values are of paramount importance to geopractitioners and it is the goal of this paper to provide geopractitioners with accessible means to estimate site-scale VBPs and to understand the uncertainty (error) in those estimates.
According to stereological principles [34,35], the real block content of a block-in-matrix formation can be approximated by means of:
- 2D measurements (areal block proportions, ABPs), which can be obtained by examining geological maps, mapping outcrops or photographs and/or by using digital image analyses. Specifically, the ABP can be determined as the ratio between the area of all blocks measured in a sample area and the sample area analyzed [1,3,27,36,37,38,39];
- 1D measurements (linear block proportions, LBPs), which can be obtained by analyzing exploration drilling or linear sampling traverses (scanlines) on outcrops/photographs. Specifically, the LBP can be determined from the proportion of total intercept lengths of blocks penetrated by drill cores (or scanlines) to the total length of drilling [1,2,40,41,42,43,44,45];
- 0D measurements (node or point block proportions, PBPs), which consists of the node (or point) counting technique. This is a common method in several research fields (including geology, biology and materials science) to allow the proportion of an area covered by some objects of interest to be easily determined. Specifically, a grid is i {\displaystyle i} superimposed over an image, the intersection points are counted and then divided by the total number of the points of the grid (Medley, 1994).
A fundamental law of stereology is that PBP = LBP = ABP = VBP [34,46,47], but the law holds only when there are many data, which would be extraordinary for conventional geotechnical exploration programs. Indeed, VBPs estimated by assuming the stereological equivalence between LBP and ABP measurements and actual 3D values have been demonstrated to be fraught with potentially high magnitudes of error [2,3,4,43]. The errors depend on the quantity and quality of the measurements as well as on the actual VBP and block characteristics (i.e., shape, orientation). Hence, it is of the utmost importance to adjust the measured estimates to accommodate this uncertainty.
Although a correct estimation of the VBP is of paramount importance, only a few researchers have attempted to tackle this problem [4,6,43,45,48], by focusing on means to apply adjustments to measured block proportions to more accurately estimate VBPs. However, almost all of these approaches have significant limitations.
The aim of this paper is to investigate and quantify the potential errors produced when inferring the VBP of an in situ bimrock/bimsoil mass from field measurements. A statistically robust approach is used in order to overcome the limitations of the previous studies as much as possible and to propose easy-to-use design charts to obtain appropriate estimates of the actual block contents.
Uncertainties in VBP Estimates: An Overview
Part of our work was to validate and extend the pioneering research of Medley (1997), who investigated uncertainty in the determination of VBPs from 1D measurements (LBP). Because Medley’s work is over 25 years old, it is summarized below in more detail than would be normal for a research paper.
Medley performed his research for use at the Scott Dam project in Northern California [40]: the method and findings were published by Medley [43,49,50]. The underlying justification for the research was that many bimrocks (particularly mélanges) have scale-independent block-size distributions over several orders of magnitude. In this regard, information collected from physical bimrock models (or laboratory specimens) is more often applicable to site scales than is usual in geopractice when working with rock masses. Therefore, working on centimeter-scale physical models relative to the smaller site scale (100s of meters) of the Franciscan Complex mélange underlying the dam site was valid. The same assumption underlies the research reported in this paper.
Four physical bimrock models were fabricated with known block-size distributions having fractal dimension of 2.3 (typical of Franciscan Complex mélanges [43,51]). The models had VBPs of 13%, 32%, 42% and 55%. Blocks were fabricated of clay and plasticene (Playdoh) and were mixed with Plaster of Paris (Figure 1).
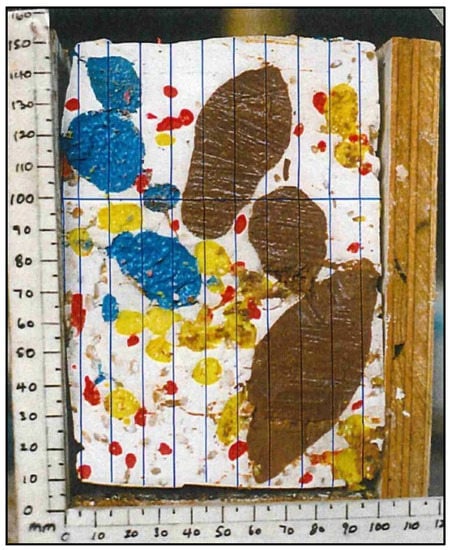
Figure 1.
Scanlines (blue) traced on 42% physical bimrock model (original of monochrome image of Figure 3 of Medley’s [43] work).
Fundamental to the fabrication was the use of the characteristic (engineering) dimension, Lc (the ced of Medley, [1]). Lc is a length that signifies the scale of the problem at hand: the height of a landslide; the width of a foundation; the square root of the area of a site; the diameter of a laboratory triaxial specimen; the diameter of a tunnel, etc. Each model had an Lc of about 130 mm, which was the square root of the measured plan area of the models. As per convention when studying bimrocks [1,12], the smallest blocks were about 0.05Lc (6 mm) and the largest blocks (dmax) in each model were selected to be about 0.75Lc.
The models were sawn manually into ten slices, each of which was photographed, and ten scanlines (representing model boreholes) were drawn on each image (Figure 1). Figure 1 shows a typically messy example of a slice through a model, with many poorly discriminated blocks. The lengths of the intercepts between the model borings and all blocks greater than about 6 mm (the block/matrix threshold) were measured. The LBP of each scanline was calculated as the percent proportion of the total of the block/boring intercepts and the total length of the boring.
As expected, the 100 LBPs obtained for each bimrock model showed much variability, especially for bimrock models with lower VBPs. Therefore, the 1D data were statistically analyzed to investigate if a good estimation of the VBP could be obtained from the 1D measurements. Specifically: sub-sets of 2, 4, 6, 8, 10, 15 and 20 scanlines were randomly selected (by means of a Monte-Carlo procedure) 40 times from the dataset of 100 LBPs and combined for an overall LBP for each sub-set. This procedure is akin to drilling 40 independent exploration campaigns at a site using 2, 4, 6, 8, 10, 15 or 20 borings each time, where the site is assumed to be previously unexplored for each campaign.
Sampling length was characterized by dividing the total length of scanlines/boreholes (L) by the length of the largest block, dmax, to provide the parameter Ndmax (in retrospect Ndmax was poorly defined: it should have simply been L/dmax = N).
The data scattering reduced as the sampling length, Ndmax, increased (i.e., with the increase in number of borings and consequent total lengths of exploration). For a sufficient linear sampling, at least equal to 10-times the length of the largest expected block (10dmax), there was a tendency for the LBPs to converge to the actual 3D VBP.
The results are summarized in Figure 2a, which could be used to estimate uncertainty, although most of the scatter points are not organized into neat trends. To ease interpretation of the data, Medley [49] produced a simplified version of Figure 2a. He selected points in the most populated portion of the graph (red box in Figure 2a) and by “eye-balling”, assigned approximate contours through the data and then extrapolated the trend lines to the Ndmax axis—as shown in Figure 2b. The charts allow geopractitioners to answer the question: “If LBP is assumed to be the same as the VBP, how wrong is the assumption?”. For a given value of Ndmax and total LBP, Figure 2b provides values of uncertainty as SD/VBP (standard deviation, SD, divided by VBP—essentially the Coefficient of Variation, CV). In fact, for sufficient sampling, the mean of LBPs is very close to the value of the VBP. The uncertainty provides a +/− number, which is used to adjust the LBP to VBP using the relation: VBP = LBP +/− (Uncertainty × LBP). In practice, to err on the side of safety, the uncertainty should be subtracted from the LBP for purposes of estimating the block content for use in VBP vs. strength/deformability relationships or graphs [9,14,33]. On the other hand, the uncertainty should be added to the LBP to provide a prudent (high) VBP estimate when planning engineering works in bimrocks (to avoid the economic repercussions of underestimating undesirable block contents in tunneling and excavations) [2,12,43].
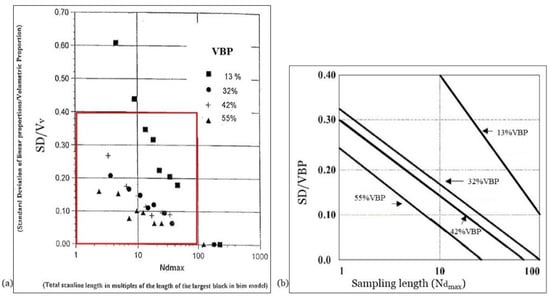
Figure 2.
(a) Uncertainty (CV) in estimates of the VBP from 1D measurements as a function of the total sampling length (expressed as Ndmax or the multiple N of the length of the largest block, dmax) and the measured LBP (modified from [49]); (b) portion of Figure 2a (red box), drafted as a design aid, in which trend lines were very approximately mapped through the data points in Figure 2a (modified from [49]).
The chart in Figure 2b has been used by geopractitioners for about 25 years, despite being based on limited data generated from very simple, crudely fabricated physical models with inevitable inherent experimental errors.
Since Medley’s [43,49] contribution, few other studies have been published that provide a means for assessing the uncertainty error in VBP estimates. Tien et al. [48] developed an analytical solution to quantify the uncertainty in estimates of VBPs of a bimrock/bimsoil using scanline measurements in samples with monodisperse circular blocks and validated it by means of 2D numerical models. More recently, Lu et al. [45] extended the work of Tien et al. [48]. The authors analyzed 2D bimrock/bimsoil models with polydisperse circular inclusions and used CT scan images from artificial bimrocks/bimsoils to validate the analytical solution of Tien et al. [48]. The results obtained by the authors (Figure 3) were similar to those obtained by Medley [43], despite that Lu et al. [45] made simplifying assumptions about Medley’s block sizes, block size distributions and other experimental quantities.
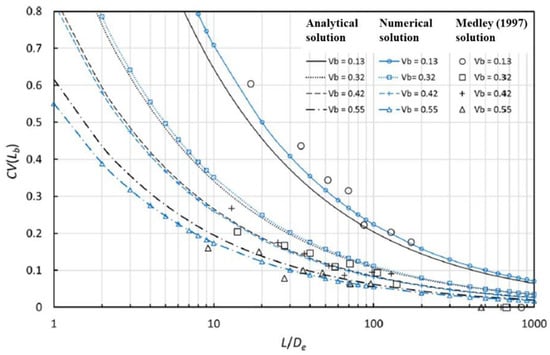
Figure 3.
Uncertainty, expressed with a coefficient of variation (CV) vs. relative lengths of scanlines, L/De, obtained with the analytical and numerical solutions by Lu et al. [45] and compared to Medley’s [43] findings. In this graph, Lb indicates the linear fraction of blocks, L is the total length of the scanline and De indicates the equivalent diameter of the block (modified from [45]).
However, the findings of Lu et al.’s [45] study seem of limited use for geopractitioners because, in practice, it is very difficult to accurately define the equivalent diameter, De, of in situ blocks necessary to use the chart the authors proposed. Another relevant and useful work was performed by Ramos-Cañón and co-workers in 2020 [6]. The authors implemented a computational algorithm to analyze the influence of the block sizes, shapes and orientations, the perforation length (block/boring intercept) and the number of boreholes on the uncertainty in VBP estimates. Specifically, 3D cubic bimrock/bimsoil samples with different dimensions and VBPs in a range 4–19% were created, using both spherical and ellipsoidal blocks. The sampling was carried out for each model, through a variable number of equidistant penetrations. The results of this study indicate that the most influential parameters are the total length of drilling and the number of boreholes, while the block characteristics and the dimension of the 3D bimrock/bimsoil domain were not found to be statistically significant. Nevertheless, the very low VBPs investigated by Ramos-Cañón et al. [6] limit the geopractice applicability of their findings.
Napoli et al. [4] developed a 3D statistical approach to determine the uncertainties associated with VBP estimates from 2D measurements; similarly to Medley [43] and Lu et al. [45], a graph was developed to determine the uncertainty factor to adjust the initial ABP measured as a function of the size of the outcrop area investigated (Figure 4).
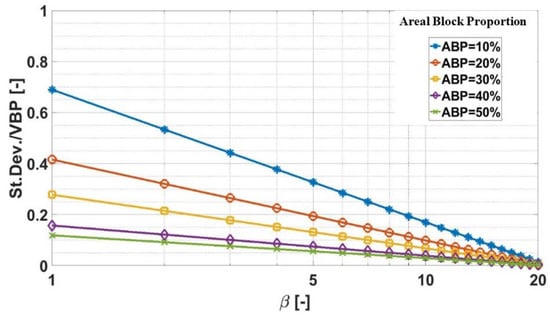
Figure 4.
Uncertainty in the VBP estimate from 2D measurements, as a function of the total investigation surface (expressed as multiples, β, of the area of engineering interest, Ac = Lc2) and block contents measured (ABP) (modified from [4]).
The potential of this approach is that 2D mapping surveys are cheaper to perform than geotechnical exploration drilling programs. However, despite its utility, it may not be possible to determine the ABP if the heterogeneous ground is not accessible or visible. In that case, other field measurements must be used, of which the most popular and necessary are 1D borings.
Given the limitations of the studies highlighted above, this paper complements the statistical approach of Napoli et al. [4] to take into account the uncertainty in estimates of VBPs yielded by 1D measurements.
After its validation, an update and extension of Medley’s 1999 work was undertaken in order to provide a new “design-aid” chart, improving that introduced by Medley to determine the uncertainty in LPB measurements for mélanges and similar block-in-matrix formations.
2. Uncertainty in VBP Estimates from LBPs
2.1. Validation of Medley’s 1997 Findings
In this study, the statistically rigorous approach proposed by Napoli et al. [4] was used to review the validity of Medley’s [43] work and address shortcomings in his research findings, related to mélanges and similar block-in-matrix formations.
A Matlab code was created to reproduce Medley’s work as much as possible and so compare the uncertainties in VBP estimates obtained with those found in 1997. Four virtual bimrock models were computer generated, having the same dimensions (H × B × L = 150 × 100 × 170 mm), block size distribution and VBPs (13%, 32%, 42% and 55%) of Medley’s models. The minimum and maximum block dimensions were determined, according to the literature, as a function of the characteristic (engineering) dimension, Lc (the ced of Medley, 1994): the smallest blocks were equal to 0.05√A = 0.05Lc = 6.5 mm and the largest blocks (dmax) were equal to 0.75√A = 0.75Lc = 98 mm.
Spherical blocks were distributed randomly within the 3D domains according to the procedure presented in Napoli et al. [4]. The blocks were assumed to have the same (fractal) block-size distribution adopted by Medley [43,50], with a 3D fractal dimension D = 2.3 (i.e., for log–log plots of frequency of blocks vs. sizes of blocks, the slope of the line is 2.3 [51]. In practice, this means that given one large block, there will be about 5-times as many blocks of half the size; 25 blocks at a quarter the size of the largest block, 125 at one-eighth the size of the largest blocks, and so on).
The 32% VBP virtual (computer-generated) bimrock model is shown in Figure 5 by way of example, penetrated by virtual borings. The virtual borings were located on a grid like that of Medley’s [43]. As in Medley, block/boring intercept lengths were measured and LBPs calculated for each boring.
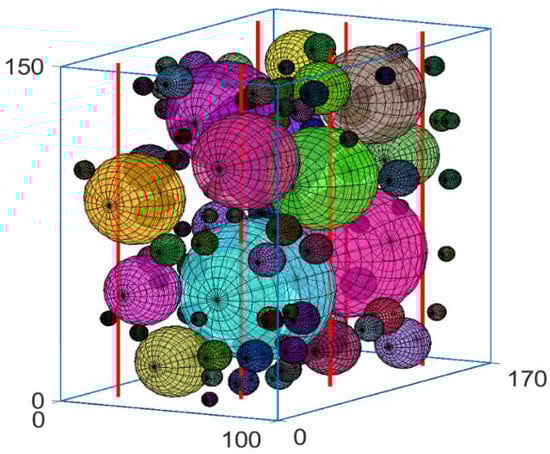
Figure 5.
32%VBP virtual bimrock model with example virtual borings (dimensions in millimeters).
Statistical analyses were performed in the same fashion as Medley [43] to assess the error in estimates of VBPs, based on the assumption that they are equivalent to the measured LBPs, that is: the full dataset of 100 LBPs per model (ϑ = 100); the same subsets of randomly selected and combined scanlines (β = 2, 4, 6, 8, 10, 15 and 20); and the same number of randomizations (λ = 40).
The results of these analyses are presented in Figure 6, where the uncertainty factors (UFs) found by Medley are also shown by way of comparison.
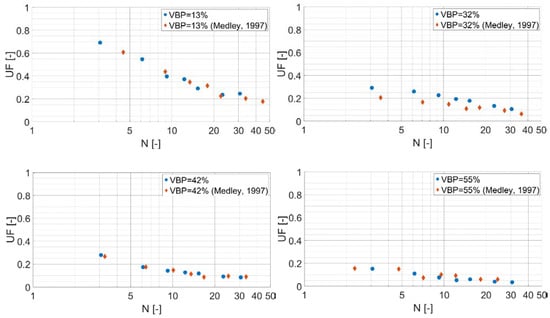
Figure 6.
Uncertainty in the VBP estimate from LBPs as a function of the total sampling length, N, obtained in this research. Medley’s (1997) [43] results are also shown by way of comparison.
The UF values are uncertainty factors defined as standard deviation/mean (or CV, Coefficient of Variation, since for sufficient sampling, the VBP is very close to the mean value). In Figure 6, the UFs are associated with the corresponding values of N, which is equal to the Ndmax parameter used by Medley [2,43,49], and expresses the cumulative length of simulated drilling as a multiple of the maximum size of the largest expected block (dmax).
It is apparent from the graphs in Figure 6 that the UFs obtained from this research are consistent with Medley’s 1997 findings, although a slight difference can be observed. A deviation between Medley’s and new findings was expected and is not surprising because of the unavoidable differences between the virtual and physical bimrock models (e.g., location of the combined scanlines; block distributions; ellipsoid/spherical shapes of the blocks; etc.). That there was a difference between Medley’s [43] ellipsoidal blocks and our spherical blocks may not have greatly influenced our findings, which is fortuitous given the difficulties involved in modelling populations of oriented ellipsoids or irregular-shaped blocks in virtual bimrocks [52,53]. Further, Lu et al. [45] and Ramos-Cañón et al. [6] discovered that the influence on VBPs of block shapes is apparently minor.
Furthermore, the points on the N-UF plane obtained by the numerical analyses are not aligned vertically with those of Medley (1997). The reasons for this slight dislocation are that the Medley physical (hand-made) models had four different dmax values (i.e., 70 mm, 84 mm, 85 mm, and 95 mm, respectively, for the physical models 13%, 32%, 42% and 55% VBP) as well as slightly different heights and, therefore, different scanline lengths and resultant N values. However, as indicated above, virtual bimrock models with constant heights, scanline lengths and dmax were considered in the present study.
Despite the differences between the results obtained from analyzing the physical and virtual models, the virtual exploration campaign yielded additional data that “infilled” between Medley’s 1997 data.
It is also apparent in Figure 6 that there is good correlation between the trends of our data and Medley’s 1997 [43] results and, thus, the approach taken of using virtual bimrocks was clearly justified. Additionally, at this point of the research, it was evident that geopractitioners who used Medley’s 1997 “design charts” in Figure 2 could be assured that any estimates of VBP they have made were reasonable.
2.2. Extension of Medley’s 1997 Findings
To extend the statistical validity of Medley’s limited approach, the computer-derived bimrock models were further explored by using the same scanlines and scanline subsets and a greatly increased maximum number of randomizations (λ) to 1000 instead of the 40 measured by Medley [43]. The maximum number of randomizations was set so as to fall within the calculation and storage capacity of the workstation used.
Figure 7 compares the trend lines of the results of this expanded set of analyses for λ = 1000, with those obtained using λ = 40 (based on Medley’s 1997 approach). The trend lines shown in this graph were obtained using the fitting equations found on an N interval between N = 2 and N = 30 and were then extrapolated into the region of N > ~30.
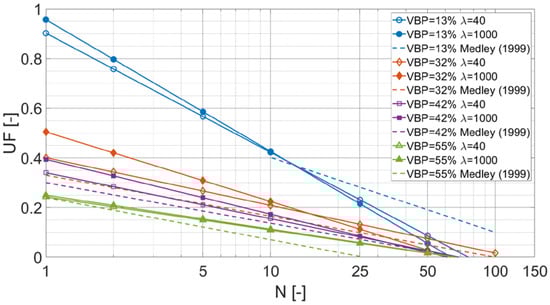
Figure 7.
Influence of λ (maximum number of randomizations) on the uncertainty in the VBP estimate from LBPs, as a function of the total sampling length, N. Dashed trend lines from Medley [49] chart (Figure 2b) shown for comparison with λ = 40 trend lines from this study. (Note: symbols on trend lines are line markers and not data points).
Figure 7 shows that the increase in the maximum number of randomizations λ, from 40 to 1000, generated marked variations in outcomes, as evident by the separation between the “λ = 40” and “λ = 1000” continuous lines, for each VBP model. The differences are ascribed to the increase in the total quantity of LBPs generated for the higher number of scanline combinations analyzed for each β value (numbers of sub-sets of scanlines). This resulted in statistically more representative datasets and in a consequent increase in the standard deviations, i.e., in the UFs, particularly for low N values.
Further, it was observed that for VBPs equal to 13%, 32% and 42%, there were slight “rotations” of the paired “λ = 40” and “λ = 1000” straight lines about intersection points for the pairs that occur between N of 10 and 25. We interpret these “rotations” as revealing that a small number of realizations (e.g., λ = 40) entails a relatively minor underestimation of the UF for small values of N (say 5) compared to an overestimation of the UF for large values of N (say 25). Further, N~10 seems to be an optimum value of sampling, for which there is little over- or under-estimation. In other words, as pointed out by Medley [7,49], drilling or performing scanlines with total lengths of about 10-times the length of the largest block (dmax = 0.75Lc) provides a statistically viable total length of sampling and resulting LBP. That our work supported this useful “10 times rule-of-thumb” is one of the satisfying outcomes of this research.
For VBP = 55%, the results of the analyses with different values of λ were almost identical, indicating that the influence of the increase in sampling due to the much higher λ parameter is negligible.
Bimrocks tend to be problematic at VBPs greater than 10% to 15% (for excavations) or 25% (for strength). Hence, it is apparent that Figure 7 needs to be infilled with findings from investigations covering LBP ranges between 13% and 70% (when blocks start to touching and the materials are no longer considered bimrocks but blocky rock masses with weak infillings). Such expansion of LBP ranges is considered further in the paper.
Medley’s (1999) chart in Figure 2b is compared with our data in Figure 7 by means of the dashed lines. Observation reveals significant differences in the trends of the UF lines between our data and Medley’s, for almost all the VBP values. This is not surprising, considering that the linearization of Medley’s data was achieved by best-estimate manual sketching of trend lines through and beyond the data shown in Figure 2a. Despite the slight mismatches in plots, the general patterns are similar between our findings and those of Medley [7,49]. Our predicted uncertainties are slightly more conservative than Medley’s but not enough to cause discomfort for geopractitioners who have used Medley’s original 1997 and 1999 charts.
2.3. Effects of Increasing the 3D Domain Size
The virtual modelling validates Medley’s simple [43] results and proves the great value of virtual investigations of computer-generated bimrocks, as suggested by Medley for several years. Indeed, it is the experience of many workers in the bimrock/bimsoil field that fabrication of physical models is tedious and often inaccurate compared to the construction of virtual bimrock/bimsoil models. Given the relative ease of constructing virtual models, the research sought to extend beyond the geometry of physical and computer models considered so far.
The Matlab routine was modified to investigate if the small domain size (volume) of the bimrock models Medley [43] analyzed affected the results obtained. Larger 3D domains were created, which included blocks with the same shape and characteristics used previously (i.e., spherical, smallest and largest block dimensions, VBPs and block-size distribution). Compared to the bimrock models analyzed previously, the new 3D models could correspond to site scales for an equivalent longer underground excavation with the same diameter or a larger landslide area with the same failure surface depth. Indeed, correspondence between small and large domains is valid when working with many bimrocks (particularly mélanges) because of the scale independence of block-size distributions over many orders of magnitude.
The choice of investigating the effects of larger three-dimensional domains on the results was driven by three main considerations:
- The use of a larger domain allowed an increased total number of simulated boreholes (ϑ) to be analyzed and avoided short boring spacings, which would have made the LBPs of two neighboring boreholes almost identical. Hence, the increased geometry allowed for larger virtual boring spacing and more variable datasets of results to be analyzed;
- With higher ϑ values (total number of scanlines analyzed), it was possible to consider more varied borehole location distributions by adopting a greater number of randomizations (λ) for each sub-set of combined scanlines (β);
- A higher ϑ allowed the values of β considered in the analyses to be increased, to obtain results for values of N higher than 45. It is emphasized that although the value of the UF can be determined from Figure 2b [49] for values of N (Ndmax) up to 100, in actuality, Medley [49] extrapolated the line trends in the interval (2, 25–45) rightwards for N of 45 (i.e., in the interval 25–45, 100). Therefore, the region of the Medley [49] graph beyond Ndmax~45 likely reports suspect uncertainty factors.
To investigate the effects of increasing N beyond about 50, computer-derived bimrock models with variable VBPs were created. The characteristic engineering dimension, Lc, was kept constant at about 130 mm to maintain the same minimum (0.05Lc) and maximum (0.75Lc) limits of the block-size distribution used by Medley [43]. Moreover, the relative frequencies of the dimensional classes used in the analyses with the smaller domains were also preserved. Rather than work with the fixed geometry of the small-domain models shown in Figure 1 and Figure 5, the geometry of the large domain models was generalized by adopting multiples of Lc. The dimensions of the large domains (LD) were H × B × L = Lc × Lc × 10Lc and were, thus, about 8-times longer and 10% less wide than the small-domain (SD) models analyzed previously. By way of example, Figure 8 illustrates the 32% VBP bimrock model created for the extended investigation.
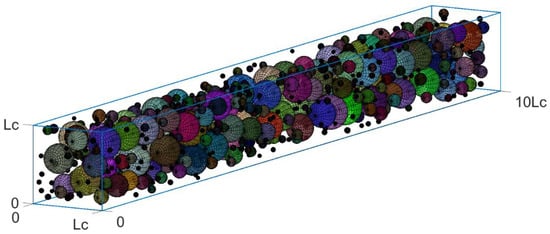
Figure 8.
32% VBP virtual bimrock model (H = 130 mm, B = 130 mm, L = 1300 mm).
LBPs were computed from 1000 equidistant simulated model boreholes, ϑ. The number of boreholes was chosen to match the same borehole density as for the SD bimrock models. The models were explored using more combined boring (scanline) sub-sets than for the SD models (i.e., β = 2, 4, 6, 8, 10, 15, 20, 30, 50, 75, 150, 300, 500, 750 and 1000) and a maximum number of randomizations (λ) equal to 10,000 (except for β = 1000, where the number of possible combinations of ϑ elements taken β at a time without duplicates is equal to 1). The sampling data were then statistically analyzed, yielding the results shown in Figure 9.
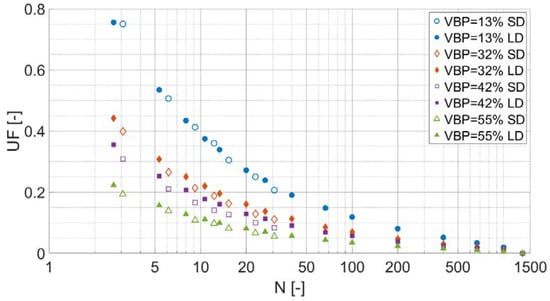
Figure 9.
Uncertainty in the VBP estimate from LBPs, when a larger 3D domain is analyzed (SD: small domain, LD: large domain).
Figure 9 shows that enlarging the three-dimensional domain (LD) did not cause significant differences in UFs associated with values of N in a range (2, 30), which is the interval investigated for the smallest domain (SD), corresponding to the physical models of Medley [43]. The concurrence of the results for this limited range of N confirmed that the sampling dataset tested for the SD (ϑ = 100 boreholes, λ = 1000 randomizations) was statistically representative.
Moreover, the analyses of the LD models that extended the N-UF data beyond the previous limit of N~45 resulted in tails of data points asymptotic to the N-axis. The additional data for the range N = 45 to N~1400 adjusted the trends of the previous plots for the smaller models (i.e., for N in a range (2–30) see Figure 6 and Figure 7). For example, if an on-site survey campaign produced an LBP of 32% for an N value of 40, the graph in Figure 2b provides a UF value of about 0.065. However, for the same N value, Figure 9 indicates a UF of 0.113 or about 1.7-times greater than the value proposed by Medley [49]. The differences in adjusted VBPs for the 32% LBP using the above values of UF are significant but small: about 28% for the 0.113 UF and about 30% for the 0.065 UF. The preferable choice is the conservative 28% VBP because it is based on a UF selected from Figure 9, which is founded on robust statistical procedures, more representative of real bimrocks than the small physical models fabricated by Medley [43].
The plots of the uncertainty factors in Figure 9 are, thus, a considerable improvement over the results obtained by Medley [43].
Finally, to extend the graph shown in Figure 9 and render it more useful, a further set of simulations was performed using the same parameters as above but with VBP values of 10%, 20%, 30%, 40%, 50% and 60%, which expands the range of VBPs of Medley’s 1997 and 1999 charts (Figure 2: 13%, 28%, 32% and 55% trends). The results obtained are set out in Table 1 and the graph is presented in Figure 10.

Table 1.
Specifications of the linear fittings shown in Figure 10. UF is the uncertainty factor, c1 and c2 are constants and R2 is the coefficient of determination.
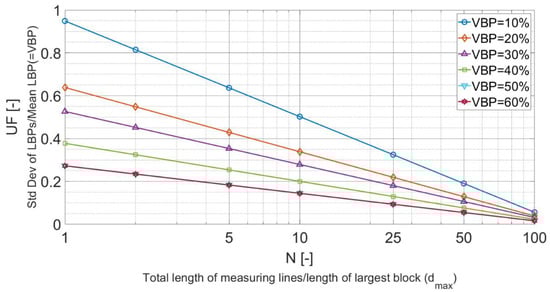
Figure 10.
Recommended chart superseding Figure 2b from Medley [49]: Uncertainty in the VBP estimate from LBPs, as a function of the total sampling length. Since the trajectories for the 50% and 60% VBPs are superimposed, the trend for VBP = 70% is assumed to be also co-incident. (Note: symbols on trend lines are line markers and not data points).
Figure 10 shows trend lines for N ≤ 100, corresponding to UFs greater than ~0.01. Despite the great range of N shown in Figure 9, there is no need to extend the N range much beyond N = 100. Since N is a measure of the extent of exploration scanlines and drilling, N > 100 represents extensive and very expensive drilling campaigns that will rarely be performed for most geotechnical ground characterizations. Further, the results related to VBP = 50% and VBP = 60% are almost identical and, by implication, so would the results for higher VBPs. However, VBPs are limited to about 60–70% because, at that point, bimrocks become blocky rock masses with weak infillings—materials well covered by conventional rock engineering schemes.
Figure 10 shows that Medley’s 1999 chart generally underestimates UF by about 0.5 to 0.1 between N, ranging from 5 to 100.
3. Application Example: VBP of the Mélange in Foundation of Scott Dam, California
Given the prior value of Medley’s [49] chart to geopractitioners, a comparison between the charts in Figure 2b, Figure 7 and Figure 10 is worthwhile, using an example cited in Medley [49] and Medley and Zekkos [12] from the Scott Dam site in Northern California. For that site, the total length of drilling was about five-times the size of the largest anticipated block (dmax) and the LBP was 40%. From Figure 2b, the uncertainty was, thus, about 0.2. Hence the VBP was 40% +/− (0.2 × 40)% or the range 32% to 48%. The 32% value would be applicable for use in assigning strength values. In the case of the dam site, 31% VBP was adopted based on other considerations (i.e., site investigations and interpreted lithologic logs, assembled by considering the lithology of the cuttings and other information from the driller’s logs) [12,40].
For comparison, using the new data in the updated graphs for N = 5: using the λ = 40 line (SD—Figure 7), the UF is about 0.21, while for λ = 1000 the UF is slightly higher than that predicted by Medley’s 1997 and 1999 charts [43,49] and equal to 0.25 (SD—Figure 7 and LD—Figure 10). Accordingly, the adjusted VBP is 40% +/− 8.4% ≈ 32% (48% high end) and 40%+/−10% = 30% (50% high end), respectively. Therefore, the original decision to adopt a VBP of 31% at Scott Dam was justified.
There is relatively little difference in the results from using Medley’s [49] chart (Figure 2b) and Figure 7 and Figure 10. The basic approach of Medley’s [43] research was sound enough that geopractitioners need not be concerned about the design decisions they made based on the 1997 findings. Nevertheless, geopractitioners can use the revised design chart in Figure 10 with far more confidence.
4. Results and Discussion
Well-established stereological principles underlie the equivalence of 1D Linear Block Proportions (LBPs), calculated from the intercept lengths between borings and blocks, to 3D VBPs, but only when there are considerable data. Since geopractice rarely allows for comprehensive drilling programs, using LBPs to estimate VBPs entails inevitable uncertainty.
Medley [43,49] performed statistical analyses on LBPs generated from physical model bimrocks with known VBPs and produced a summary chart, which, for a given length of drilling, allowed VBPs to be estimated by adjusting LBPs with an uncertainty factor (UF).
Updating and extending Medley’s [49] chart was the goal of the research summarized in this paper. Computer-generated bimrocks were created that matched Medley’s [43] physical models and LBPs were measured from arrays of model borings. Computer exploration of virtual models extended Medley’s limited approach by significantly increasing the maximum number, λ, of randomizations possible. The data were statistically processed and summary plots compared to Medley’s originals.
Overall, there was good correlation between the trends of Medley’s [43] data and the computer-generated results. Slight differences in the results between the two studies are attributable to variations in model and block geometries, as well as to experimental errors in Medley’s models and measurements. It was confirmed that drilling or performing scanlines with total lengths of about 10-times the length of the largest block (dmax, or 0.75Lc) provides enough data for dependable LBPs for use in identifying the uncertainty in estimates of VBP.
Substantially increasing the size of the virtual bimrocks allowed considerably more data to be collected. Relative to Medley’s [43] small physical models, the large computer models were explored by increasing: the total number of borings, ϑ, from 100 to 1000; the maximum number of randomly combined scanline subsets, β, from 20 to 1000; the maximum number of randomizations, λ, for each β from 40 to 10,000; the range of VBPs between 10% and 60%; and the total boring/scanline lengths, N, from about 45 to nearly 1400. The larger domain models allowed for statistically robust analyses of lots of data. Because of scale independence, the findings from this investigation are applicable to real mélanges and similar bimrocks at site scales.
A new “design-aid” chart was prepared, which improves that introduced by Medley [49]. Since the new chart shows that Medley’s [49] chart generally underestimates the uncertainty factor UF by 0.5 to 0.1 between N, ranging from 5 to 100, it is recommended that the new chart supersedes Medley’s 1997 and 1999 charts [43,49].
Further research could investigate the variations in the UF values when geomaterials with different block-size distributions and (more realistic [53]) block shapes are considered.
Author Contributions
Conceptualization, M.L.N. and E.M.; methodology, M.L.N., L.M. and M.B.; software, L.M. and M.L.N.; validation, M.B. and E.M.; formal analysis, L.M.; investigation, L.M. and M.L.N.; data curation, L.M. and M.L.N.; writing—original draft preparation, M.L.N.; writing—review and editing, M.L.N., E.M., M.B. and L.M.; supervision, E.M., M.B.; project administration, L.M. and M.L.N. All authors have read and agreed to the published version of the manuscript.
Funding
This research received no external funding.
Data Availability Statement
Not applicable.
Conflicts of Interest
The authors declare no conflict of interest.
References
- Medley, E.W. The Engineering Characterization of Melanges and Similar Block-in-Matrix Rocks (Bimrocks). Ph.D. Thesis, University of California, Berkeley, CA, USA, 1994. [Google Scholar]
- Medley, E.W. Orderly Characterization of Chaotic Franciscan Melanges. Felsbau 2001, 19, 20–33. [Google Scholar]
- Haneberg, W.C. Simulation of 3D Block Populations to Charaterize Outcrop Sampling Bias in Bimrocks. Felsbau 2004, 22, 19–26. [Google Scholar]
- Napoli, M.L.; Milan, L.; Barbero, M.; Scavia, C. Identifying Uncertainty in Estimates of Bimrocks Volumetric Proportions from 2D Measurements. Eng. Geol. 2020, 278, 105831. [Google Scholar] [CrossRef]
- Hunt, S.W.; Del Nero, D.E. Two Decades of Advances Investigating, Baselining and Tunneling in Bouldery Ground. In Proceedings of the World Tunneling Congress, Vancouver, BC, Canada, 14–20 May 2010; pp. 1–8. [Google Scholar]
- Ramos-Cañón, A.M.; Castro-Malaver, L.C.; Padilla-Bello, N.V.; Vega-Posada, C.A. Incertidumbre En La Determinación Del Porcentaje Volumétrico de Bloques de BIMrocks/BIMsoil a Partir de Información Unidimensional. Rev. Boletín Geol. 2020, 42, 69–80. [Google Scholar] [CrossRef]
- Medley, E.W.; Goodman, R.E. Estimating the Block Volumetric Proportions of Melanges and Similar Block-in-Matrix Rocks (Bimrocks). In Proceedings of the 1st North American Rock Mechanics Symposium, Austin, TX, USA, 1–3 June 1994; pp. 851–858. [Google Scholar]
- Kahraman, S.; Alber, M. Estimating Unconfined Compressive Strength and Elastic Modulus of a Fault Breccia Mixture of Weak Blocks and Strong Matrix. Int. J. Rock Mech. Min. Sci. 2006, 43, 1277–1287. [Google Scholar] [CrossRef]
- Kalender, A.; Sonmez, H.; Medley, E.; Tunusluoglu, C.; Kasapoglu, K.E. An Approach to Predicting the Overall Strengths of Unwelded Bimrocks and Bimsoils. Eng. Geol. 2014, 183, 65–79. [Google Scholar] [CrossRef]
- Khorasani, E.; Amini, M.; Hossaini, M.F.; Medley, E.W. Statistical Analysis of Bimslope Stability Using Physical and Numerical Models. Eng. Geol. 2019, 254, 13–24. [Google Scholar] [CrossRef]
- Medley, E.W.; Sanz Rehermann, P.F. Characterization of Bimrocks (Rock/Soil Mixtures) With Application to Slope Stability Problems. In Proceedings of the Eurock 2004 & 53rd Geomechanics Colloquium, Salzburg, Austria, 7–9 October 2004. [Google Scholar]
- Medley, E.W.; Zekkos, D. Geopractitioner Approaches to Working with Antisocial Mélanges. In Mélanges: Processes of Formation and Societal Significance—Geological Society of America Special Paper 480; Wakabayashi, J., Dilek, Y., Eds.; Geological Society of America: Boulder, CO, USA, 2011; Volume 42, pp. 261–277. ISBN 9780123742919. [Google Scholar]
- Napoli, M.L.; Barbero, M.; Scavia, C. Slope Stability in Heterogeneous Rock Masses with a Block-in-Matrix Fabric. In Rock Mechanics for Natural Resources and Infrastructure Development, Proceedings of the 14th International Congress on Rock Mechanics and Rock Engineering, ISRM, Foz do Iguassu, Brazil, 13–18 September 2019; CRC Press: Boca Raton, FL, USA, 2019; pp. 3482–3489. [Google Scholar]
- Sonmez, H.; Gokceoglu, C.; Tuncay, E.; Medley, E.W.; Nefeslioglu, H.A. Relationships between Volumetric Block Proportions and Overall UCS of a Volcanic Bimrock. Felsbau Rock Soil Eng. J. Eng. Geol. Geomech. Tunn. 2004, 22, 27–34. [Google Scholar]
- Napoli, M.L.; Barbero, M.; Ravera, E.; Scavia, C. A Stochastic Approach to Slope Stability Analysis in Bimrocks. Int. J. Rock Mech. Min. Sci. 2018, 101, 41–49. [Google Scholar] [CrossRef]
- Barbero, M.; Bonini, M.; Borri-Brunetto, M. Numerical Simulations of Compressive Tests on Bimrock. Electron. J. Geotech. Eng. 2012, 17X, 3397–3414. [Google Scholar]
- Napoli, M.L. 3D Slope Stability Analyses of a Complex Formation with a Block-in-Matrix Fabric. In Lecture Notes in Civil Engineering, Proceedings of the Challenges and Innovations in Geomechanics, IACMAG 2021, Turin, Italy, 5–8 May 2021; Springer: Turin, Italy, 2021; Volume 126, p. 7. [Google Scholar]
- Xu, W.; Xu, Q.; Hu, R. Study on the Shear Strength of Soil-Rock Mixture by Large Scale Direct Shear Test. Int. J. Rock Mech. Min. Sci. 2011, 48, 1235–1247. [Google Scholar] [CrossRef]
- Zhang, H.; Hu, X.; Boldini, D.; He, C.; Liu, C.; Ai, C. Evaluation of the Shear Strength Parameters of a Compacted S-RM Fill Using Improved 2-D and 3-D Limit Equilibrium Methods. Eng. Geol. 2020, 269, 105550. [Google Scholar] [CrossRef]
- Zhang, H.; Boldini, D.; Wang, L.; Deng, H.; Liu, C. Influence of Block Form on the Shear Behaviour of Soft Soil–Rock Mixtures by 3D Block Modelling Approaches. Rock Mech. Rock Eng. 2022, 55, 3279–3300. [Google Scholar] [CrossRef]
- Huang, X.; Wei, Y.; Ai, W.; Jiang, P. Stability Analysis of Soil - Rock Slope ( SRS ) with an Improved Stochastic Method and Physical Models. Environ. Earth Sci. 2021, 80, 649. [Google Scholar] [CrossRef]
- Kahraman, S.; Alber, M.; Fener, M.; Gunaydin, O. Evaluating the Geomechanical Properties of Misis Fault Breccia (Turkey). Int. J. Rock Mech. Min. Sci. 2008, 45, 1469–1479. [Google Scholar] [CrossRef]
- Li, Y.; Huang, R.; Chan, L.S.; Chen, J. Effects of Particle Shape on Shear Strength of Clay-Gravel Mixture. KSCE J. Civ. Eng. 2013, 17, 712–717. [Google Scholar] [CrossRef]
- Lindquist, E.S. The Mechanical Properties of a Physical Model Melange. In Proceedings of the 7th International IAEG Congress, Austin, TX, USA, 1–3 June 1994; pp. 819–826. [Google Scholar]
- Schmüdderich, C.; Prada-Sarmiento, L.F.; Wichtmann, T. Numerical Analyses of the 2D Bearing Capacity of Block-in-Matrix Soils (Bimsoils) under Shallow Foundations. Comput. Geotech. 2021, 136, 104232. [Google Scholar] [CrossRef]
- Wang, S.; Li, Y.; Gao, X.; Xue, Q.; Zhang, P.; Wu, Z. Influence of Volumetric Block Proportion on Mechanical Properties of Virtual Soil-Rock Mixtures. Eng. Geol. 2020, 278, 105850. [Google Scholar] [CrossRef]
- Zhang, S.; Tang, H.; Zhan, H.; Lei, G.; Cheng, H. Investigation of Scale Effect of Numerical Unconfined Compression Strengths of Virtual Colluvial-Deluvial Soil-Rock Mixture. Int. J. Rock Mech. Min. Sci. 2015, 77, 208–219. [Google Scholar] [CrossRef]
- Napoli, M.L.; Barbero, M.; Scavia, C. Geomechanical Characterization of an Italian Complex Formation with a Block-in-Matrix Fabric. In Theory to Practice (EUROCK 2021), Proceedings of the Mechanics and Rock Engineering, Torino, Italy, 20–25 September 2021; IOP Science: Bristol, UK, 2021; p. 8. [Google Scholar]
- DiPonio, M.A.; Chapman, D.; Bournes, C. EPB Tunnel Boring Machine Design for Boulder Conditions. In Proceedings of the Rapid Excavation and Tunneling Conference, Toronto, ON, Canada, 11–13 June 2007; pp. 215–228. [Google Scholar]
- Gwildis, U.; Aguilar, J.; Mosavat, K. TBM Tool Wear Analysis for Cutterhead Configuration and Resource Planning in Glacial Geology. In Proceedings of the North American Tunneling Conference, Washington, DC, USA, 24–27 June 2018. [Google Scholar]
- Hunt, S.W. Tunneling in Cobbles and Boulders. In Proceedings of the 10th Annual Breakthroughs in Tunneling Short Course, Chicago, IL, USA, 14–16 August 2017; pp. 1–46. [Google Scholar]
- Napoli, M.L.; Barbero, M.; Scavia, C. Tunneling in Heterogeneous Rock Masses with a Block-in-Matrix Fabric. Int. J. Rock Mech. Min. Sci. 2021, 138, 11. [Google Scholar] [CrossRef]
- Lindquist, E.S. The Strength and Deformation Properties of Melange. Ph.D. Thesis, University of California, Berkeley, CA, USA, 1994. [Google Scholar]
- Russ, J.C.; Dehoff, R.T. Practical Stereology; Springer: Berlin/Heidelberg, Germany, 2000; ISBN 9781461354536. [Google Scholar]
- Sahagian, D.L.; Proussevitch, A.A. 3D Particle Size Distributions from 2D Observations: Stereology for Natural Applications. J. Volcanol. Geotherm. Res. 1998, 84, 173–196. [Google Scholar] [CrossRef]
- Coli, N.; Berry, P.; Boldini, D.; Bruno, R. The Contribution of Geostatistics to the Characterisation of Some Bimrock Properties. Eng. Geol. 2012, 137–138, 53–63. [Google Scholar] [CrossRef]
- Fagereng, Å. Frequency-Size Distribution of Competent Lenses in a Block-in-Matrix Mélange: Imposed Length Scales of Brittle Deformation? J. Geophys. Res. 2011, 116, 1–12. [Google Scholar] [CrossRef]
- Kahraman, S.; Alber, M.; Fener, M.; Gunaydin, O. An Assessment on the Indirect Determination of the Volumetric Block Proportion of Misis Fault Breccia (Adana, Turkey). Bull. Eng. Geol. Environ. 2015, 74, 899–907. [Google Scholar] [CrossRef]
- Sonmez, H.; Tuncay, E.; Gokceoglu, C. Models to Predict the Uniaxial Compressive Strength and the Modulus of Elasticity for Ankara Agglomerate. Int. J. Rock Mech. Min. Sci. 2004, 41, 717–729. [Google Scholar] [CrossRef]
- Goodman, R.E.; Ahlgren, C.S. Evaluating Safety of Concrete Gravity Dam on Weak Rock: Scott Dam. J. Geotech. Geoenviron. Eng. 2000, 126, 429–442. [Google Scholar] [CrossRef]
- Medley, E.W. Bimrocks—Part 2: Case Histories and Practical Guidelines; Newsletter of the Hellenic Society of Soil Mechanics and Geotechnical Engineering 2007; Hellenic Society of Soil Mechanics and Geotechnical Engineering: Athens, Greece, 2007; pp. 26–31. [Google Scholar]
- Minuto, D.; Morandi, L. Geotechnical Characterization and Slope Stability of a Relict Landslide in Bimsoils (Blocks in Matrix Soils) in Dowtown Genoa, Italy. Eng. Geol. Soc. Territ. Landslide Process. 2015, 2, 1083–1088. [Google Scholar] [CrossRef]
- Medley, E.W. Uncertainty in Estimates of Block Volumetric Proportions in Melange Bimrocks. In Proceedings of the International Symposium on Engineering Geology and the Environmental, Athens, Greece, 23–27 June1997; pp. 267–272. [Google Scholar]
- Sonmez, H.; Altinsoy, H.; Gokceoglu, C.; Medley, E.W. Considerations in Developing an Empirical Strength Criterion for Bimrocks. In Proceedings of the 4th Asian Rock Mechanics Symposium (ARMS 2006), Singapore, 6–10 November 2006; p. 7. [Google Scholar]
- Lu, Y.C.; Tien, Y.M.; Juang, C.H.; Lin, J.S. Uncertainty of Volume Fraction in Bimrock Using the Scan-Line Method and Its Application in the Estimation of Deformability Parameters. Bull. Eng. Geol. Environ. 2020, 79, 1651–1668. [Google Scholar] [CrossRef]
- Underwood, E.E. Quantitative Stereology, 2nd ed.; Addison-Wesley Publ. Company: Reading, MA, USA, 1970; p. 272. [Google Scholar]
- Weibel, E.R. Stereological Methods: Theoretical Foundations; Academic Press: New York, NY, USA, 1980; Volume 2. [Google Scholar]
- Tien, Y.M.; Lin, J.-S.; Kou, M.C.; Lu, Y.C.; Chung, Y.J.; Wu, T.H.; Lee, D.H. Uncertainty in Estimation of Volumetric Block Proportion of Bimrocks by Using Scanline Method. In Proceedings of the 44th U.S. Rock Mechanics Symposium and 5th U.S.-Canada Rock Mechanics Symposium, Salt Lake City, UT, USA, 27–30 June 2010. [Google Scholar]
- Medley, E.W. Systematic Characterization of Melange Bimrocks and Other Chaotic Soil/Rock Mixtures. Felsbau 1999, 17, 152–162. [Google Scholar]
- Medley, E.W. Estimating Block Size Distributions of Melanges and Similar Block-in-Matrix Rocks (Bimrocks). In Proceedings of the 5th North American Rock Mechanics Symposium (NARMS), Toronto, ON, Canada, 7–10 July 2002; pp. 509–606. [Google Scholar]
- Medley, E.W.; Lindquist, E.S. The Engineering Significance of the Scale-Independence of Some Franciscan Melanges in California, USA. In Proceedings of the 35th U.S. Symposium on Rock Mechanics (USRMS), Reno, NV, USA, 5–7 June 1995; pp. 907–914. [Google Scholar]
- Khorasani, E.; Amini, M.; Hossaini, M.; Medley, E. Evaluating the Effects of the Inclinations of Rock Blocks on the Stability of Bimrock Slopes. Geomech. Eng. 2019, 17, 281–287. [Google Scholar] [CrossRef]
- Wang, X.; Yin, Z.Y.; Su, D.; Wu, X.; Zhao, J. A Novel Approach of Random Packing Generation of Complex-Shaped 3D Particles with Controllable Sizes and Shapes. Acta Geotech. 2022, 17, 355–376. [Google Scholar] [CrossRef]
Publisher’s Note: MDPI stays neutral with regard to jurisdictional claims in published maps and institutional affiliations. |
© 2022 by the authors. Licensee MDPI, Basel, Switzerland. This article is an open access article distributed under the terms and conditions of the Creative Commons Attribution (CC BY) license (https://creativecommons.org/licenses/by/4.0/).