

Using Mixed Reality for the Visualization and Dissemination of Complex 3D Models in Geosciences—Application to the Montserrat Massif (Spain)

 ,
,  , , and
Abstract
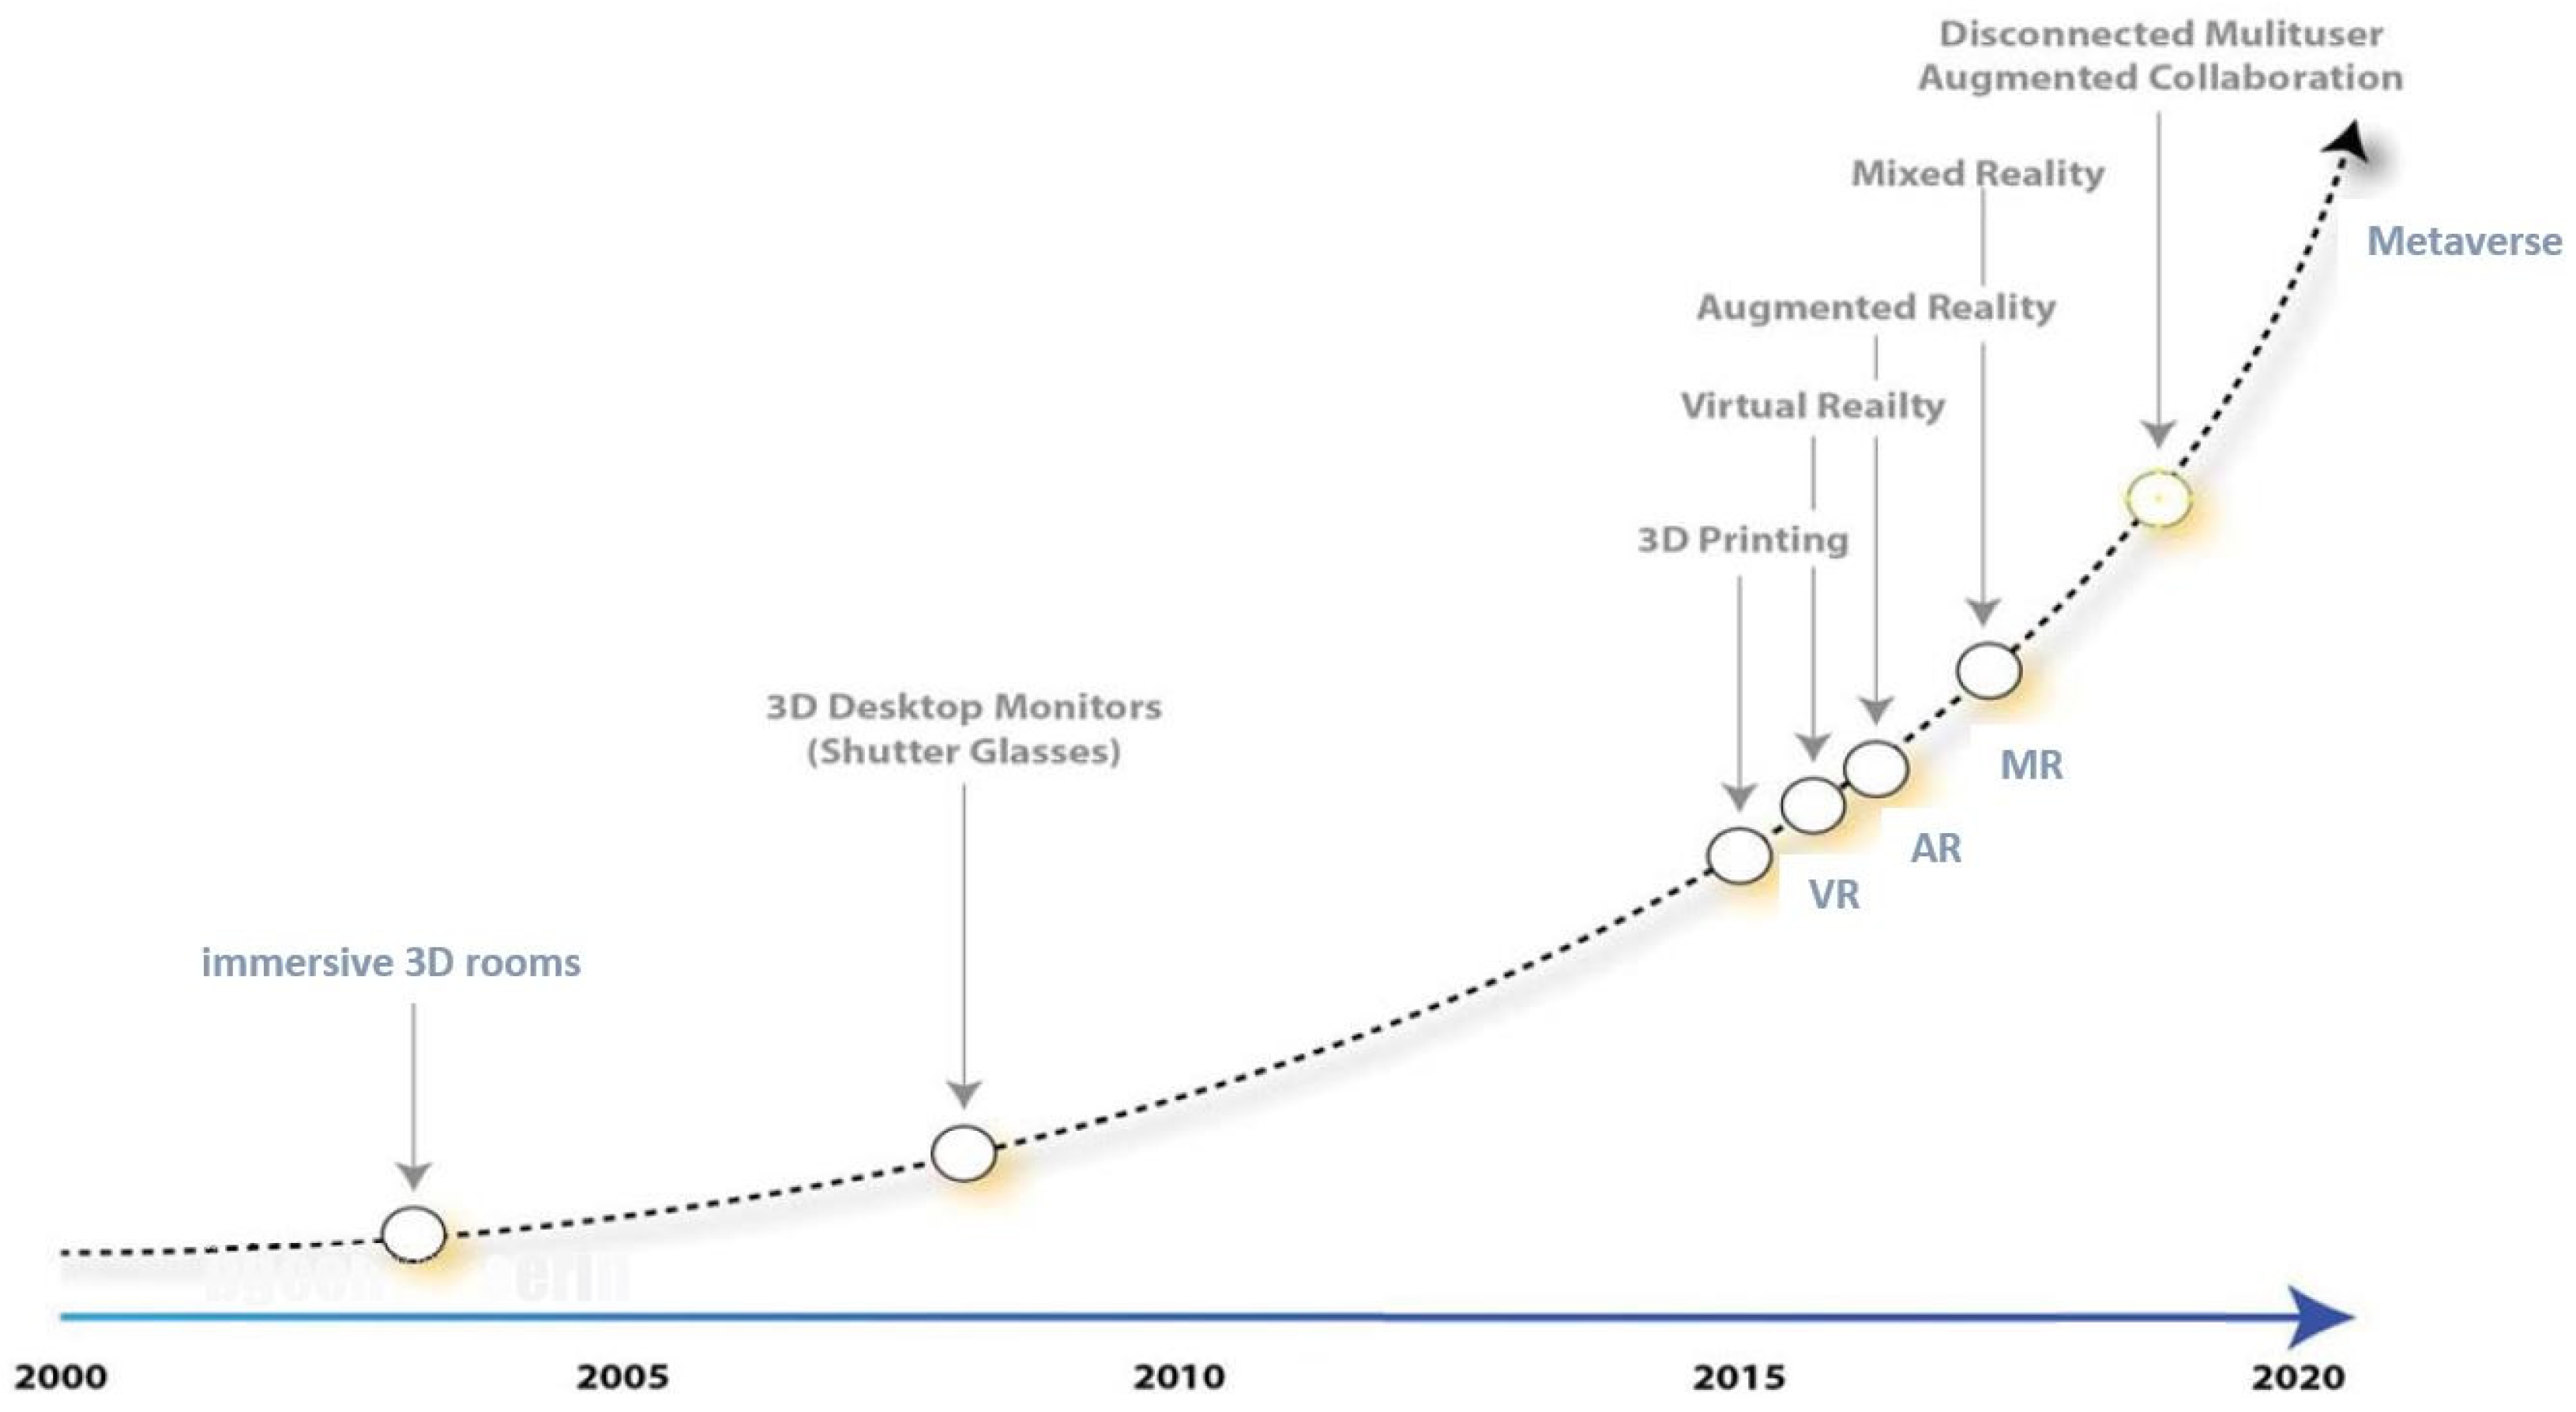
1. Introduction
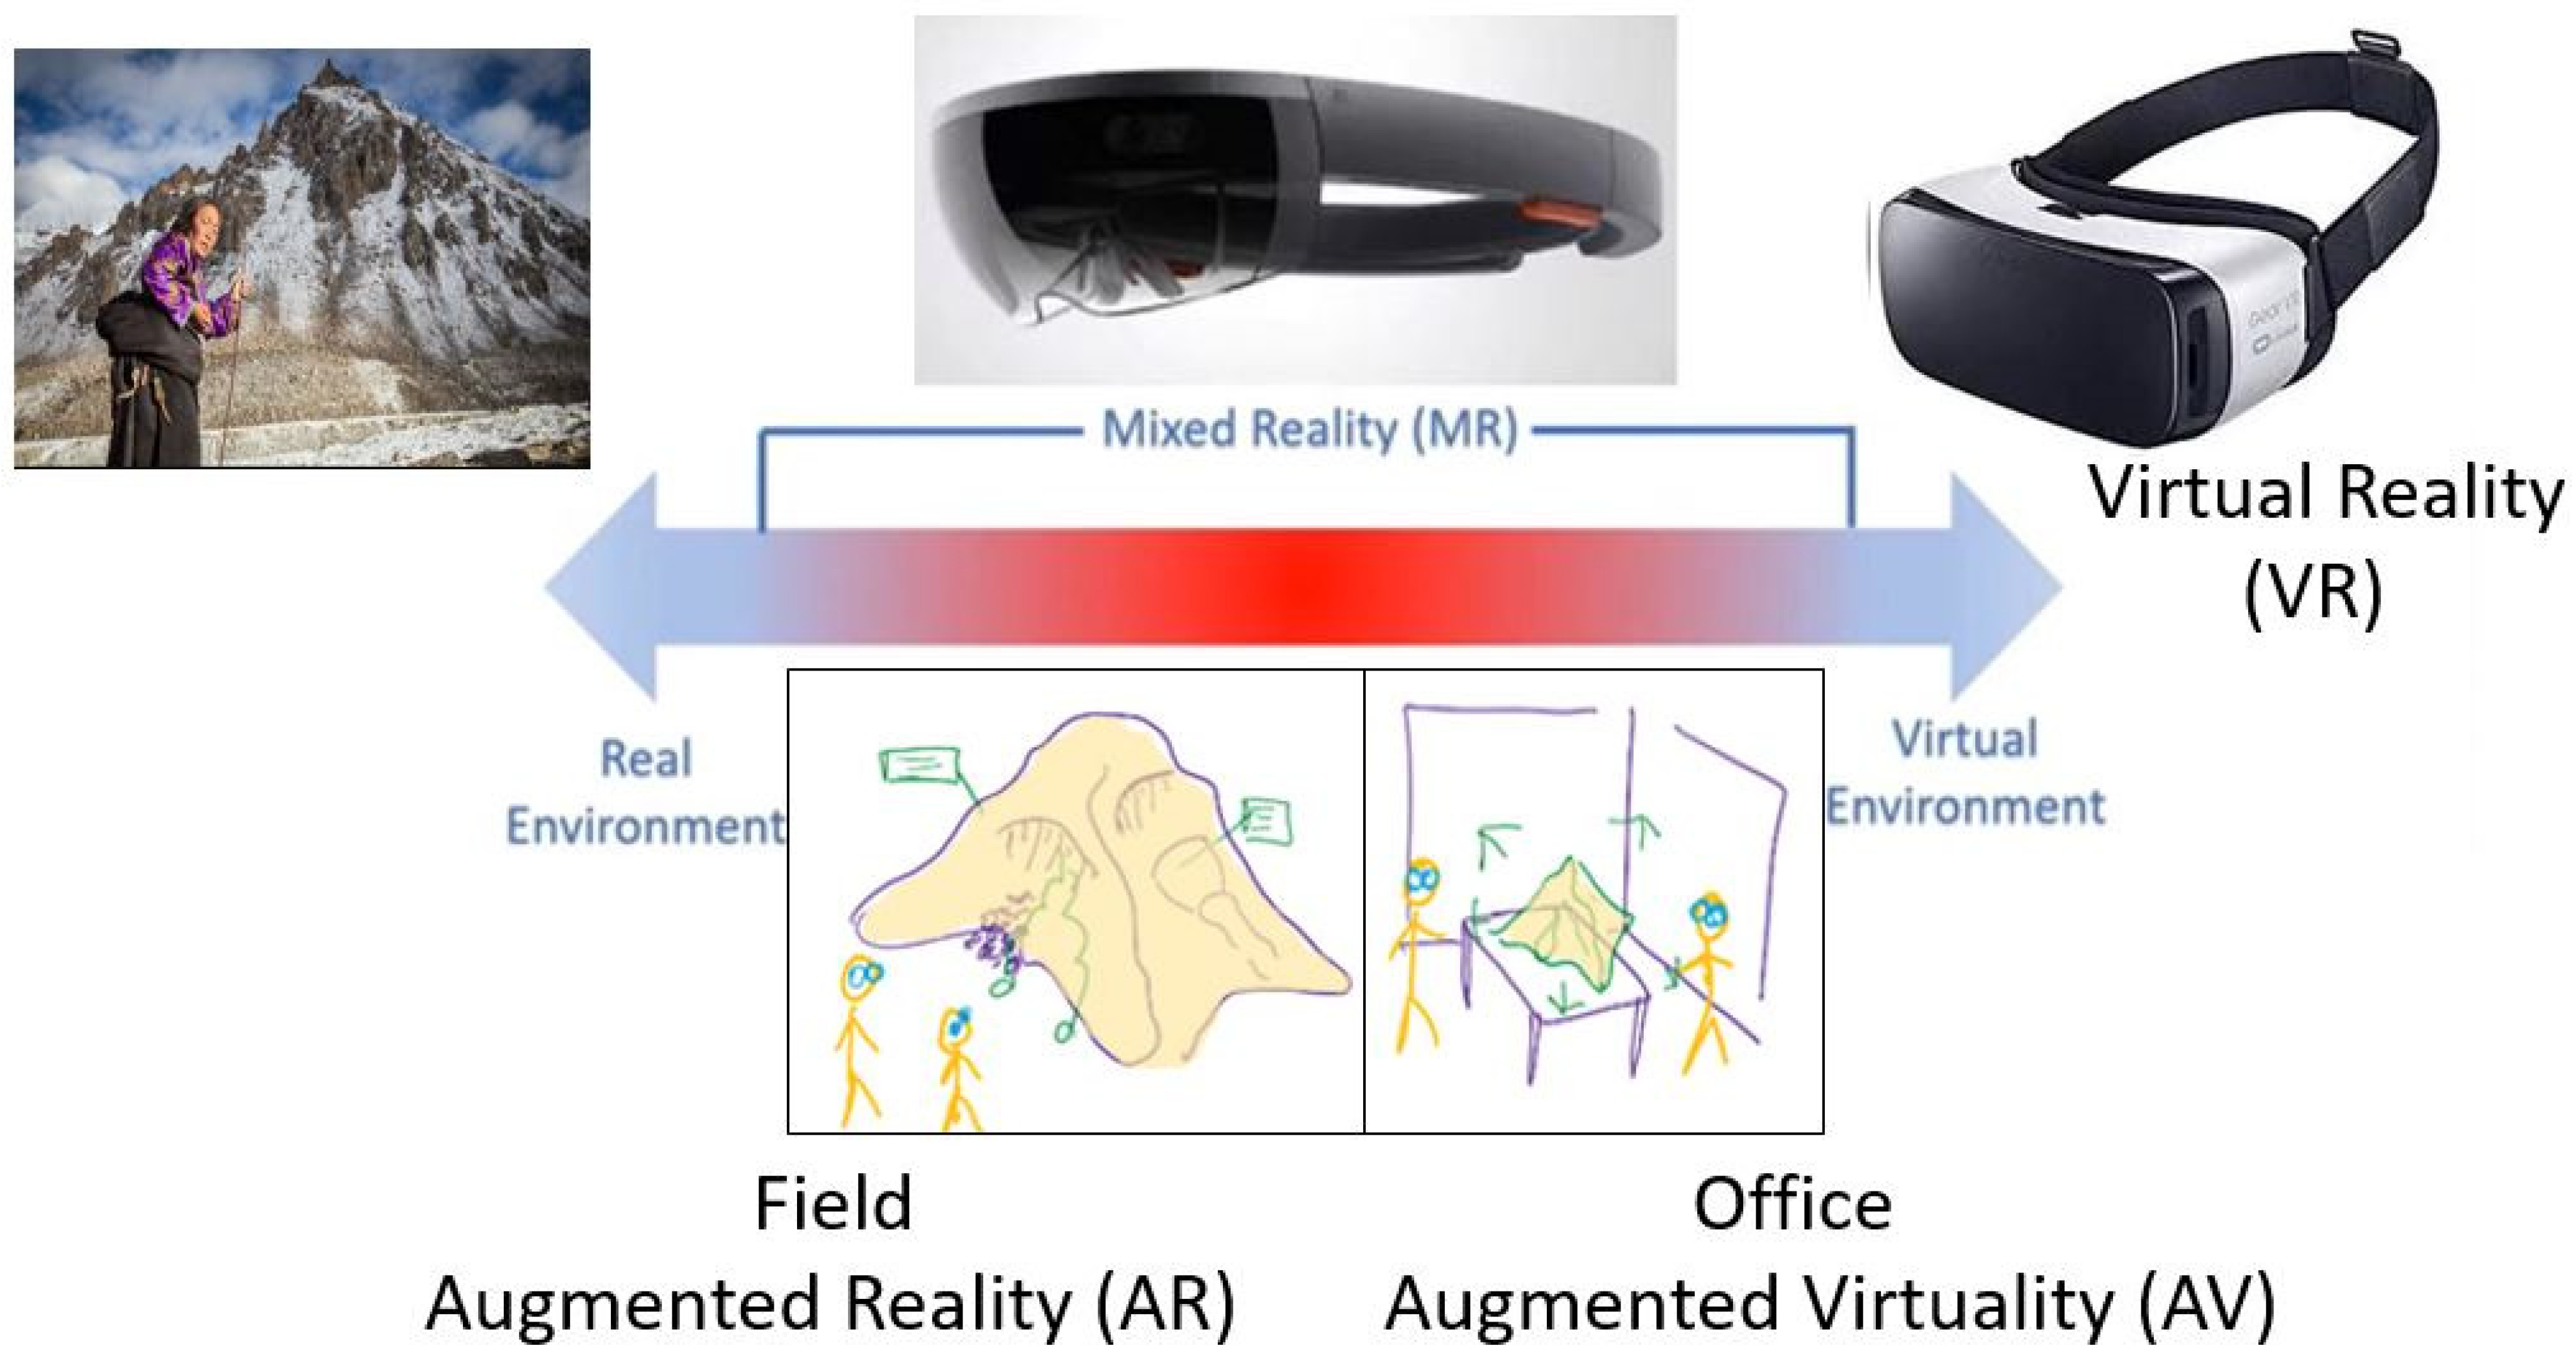
2. Materials and Methods
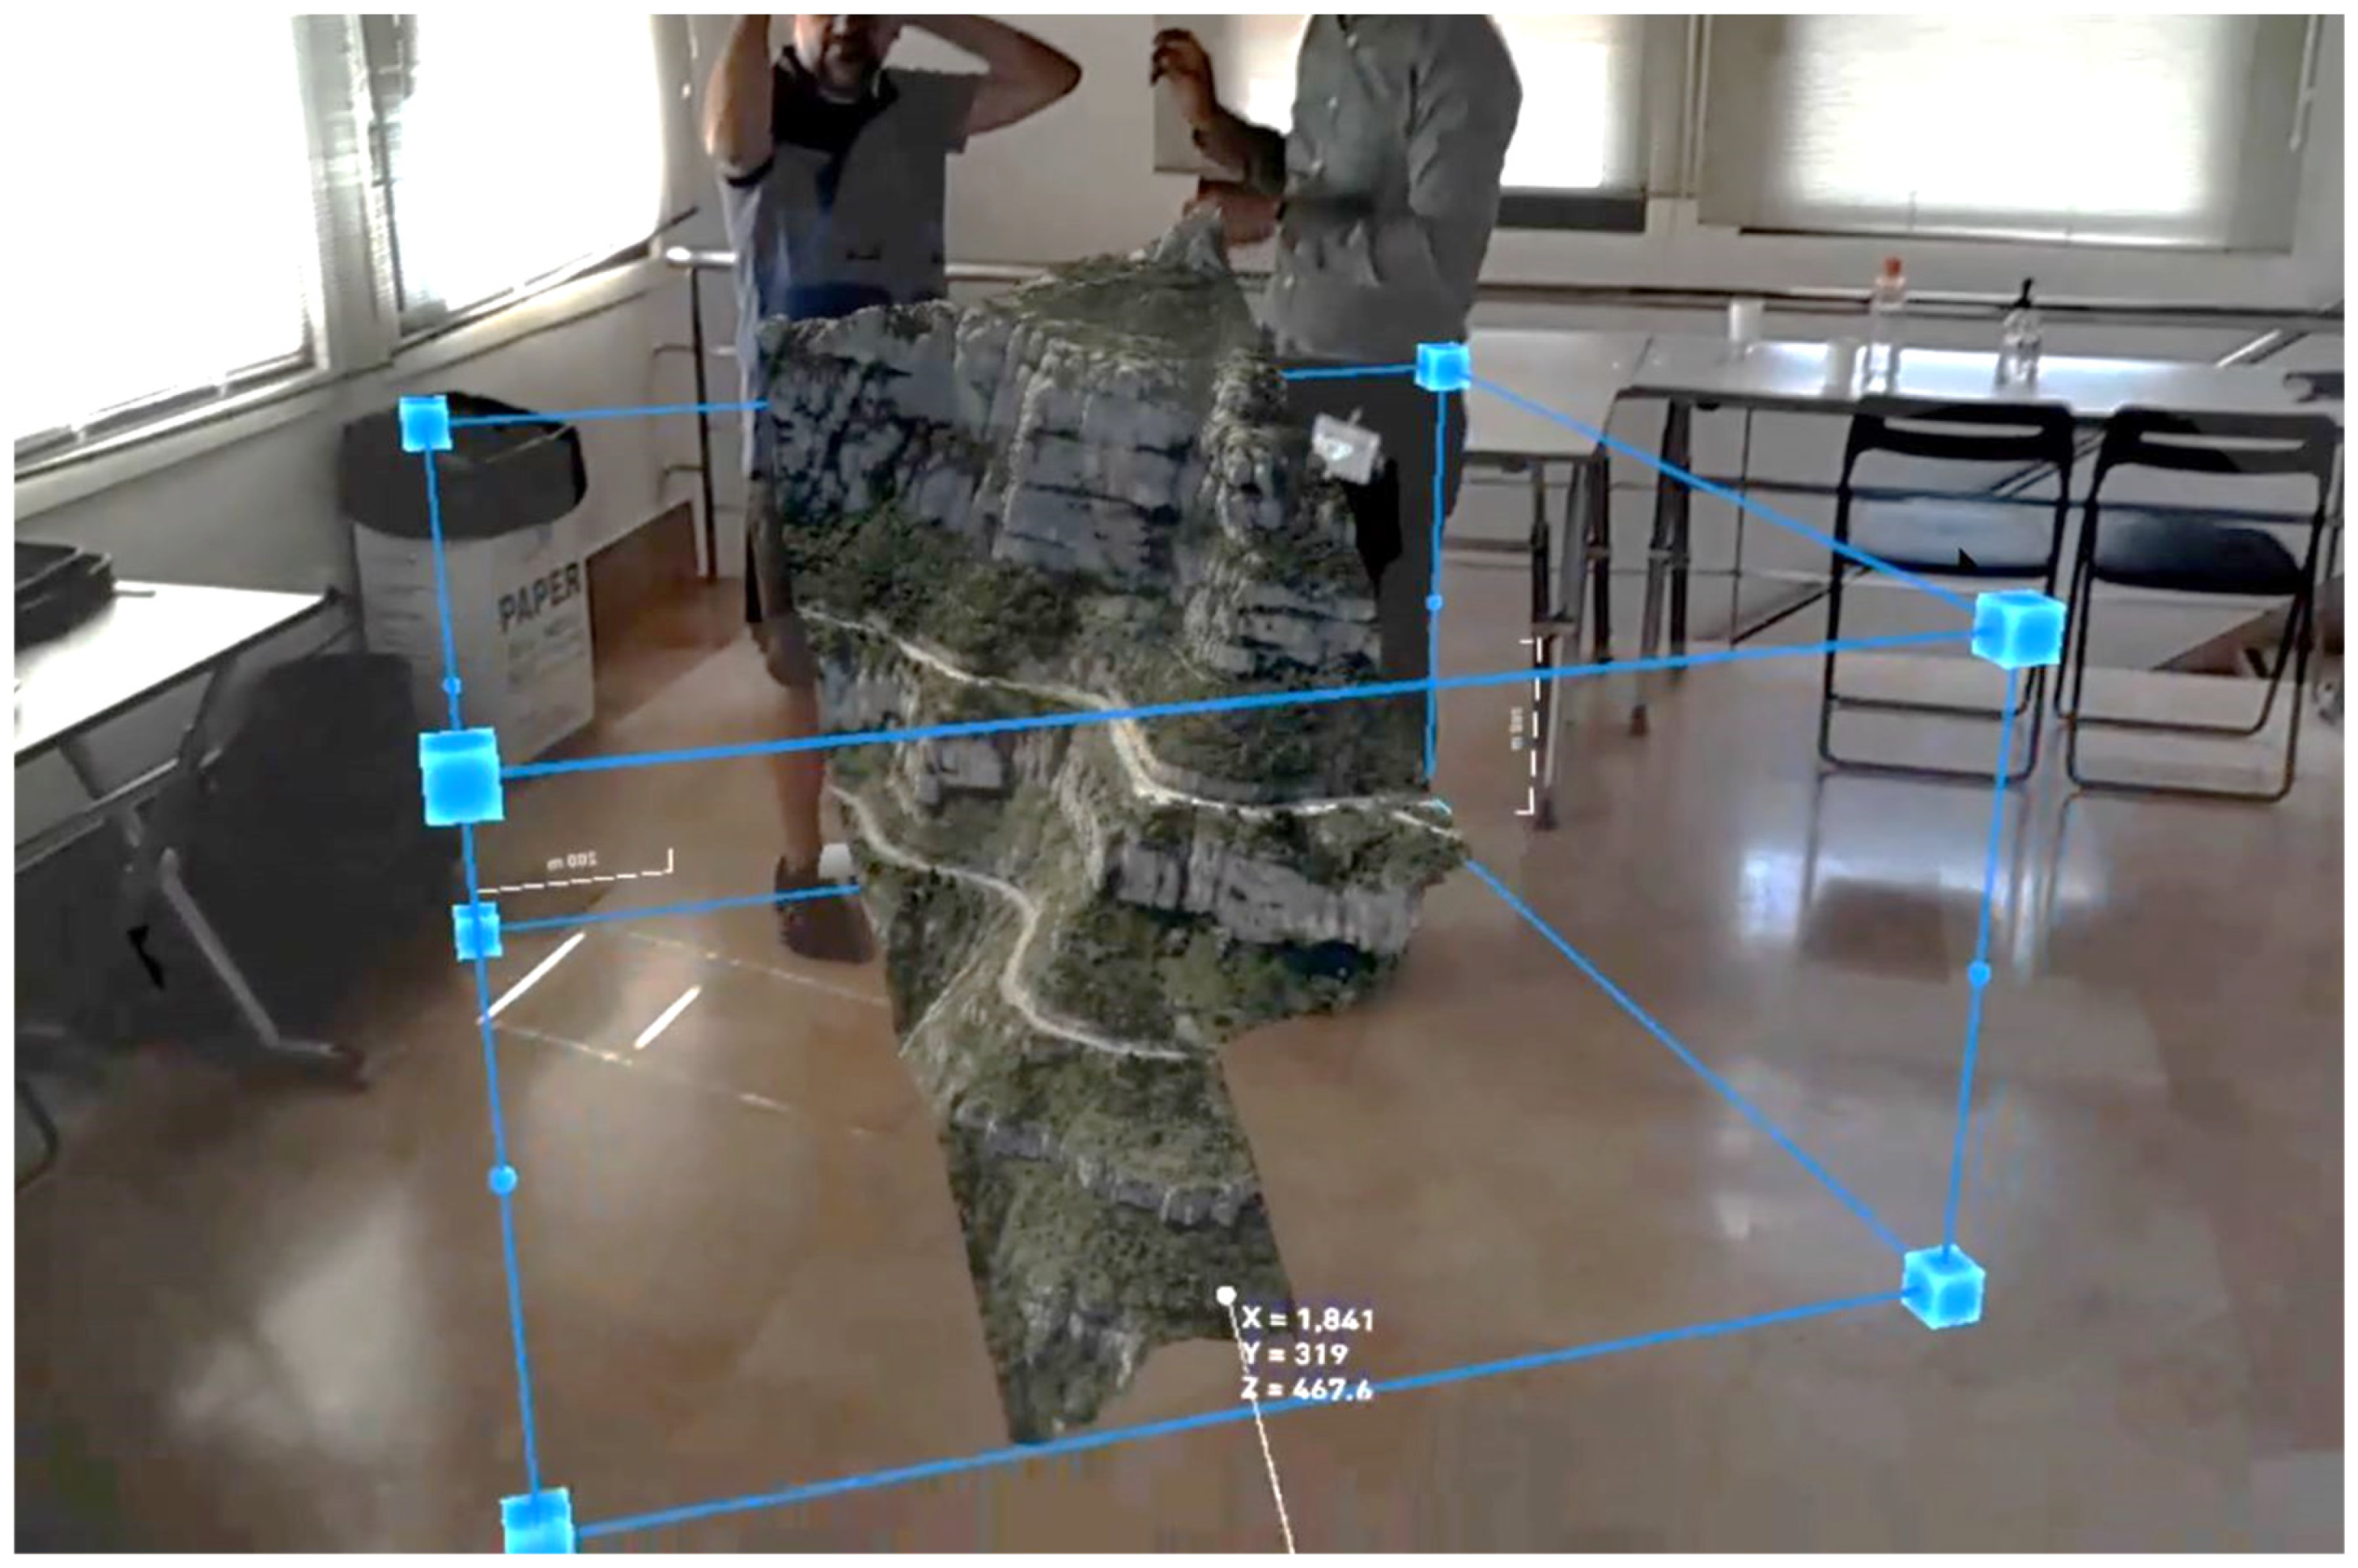
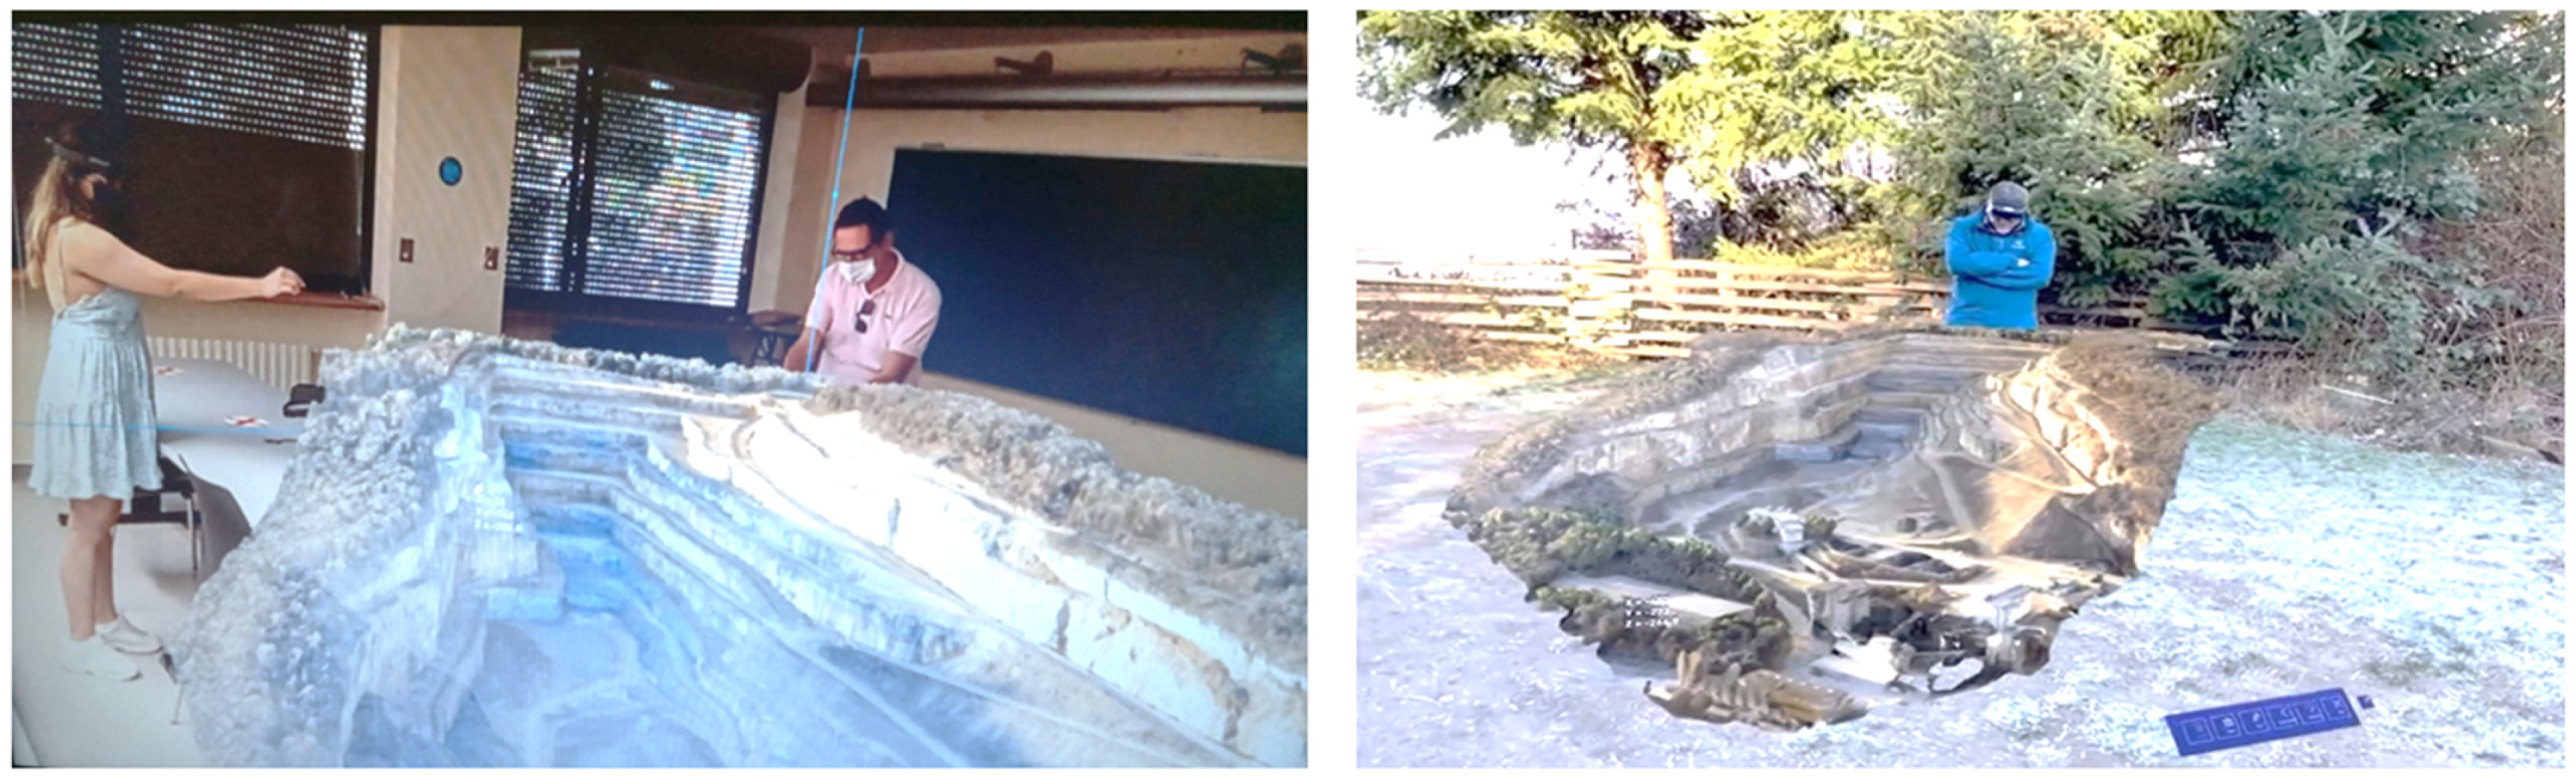
3. Results and Discussion
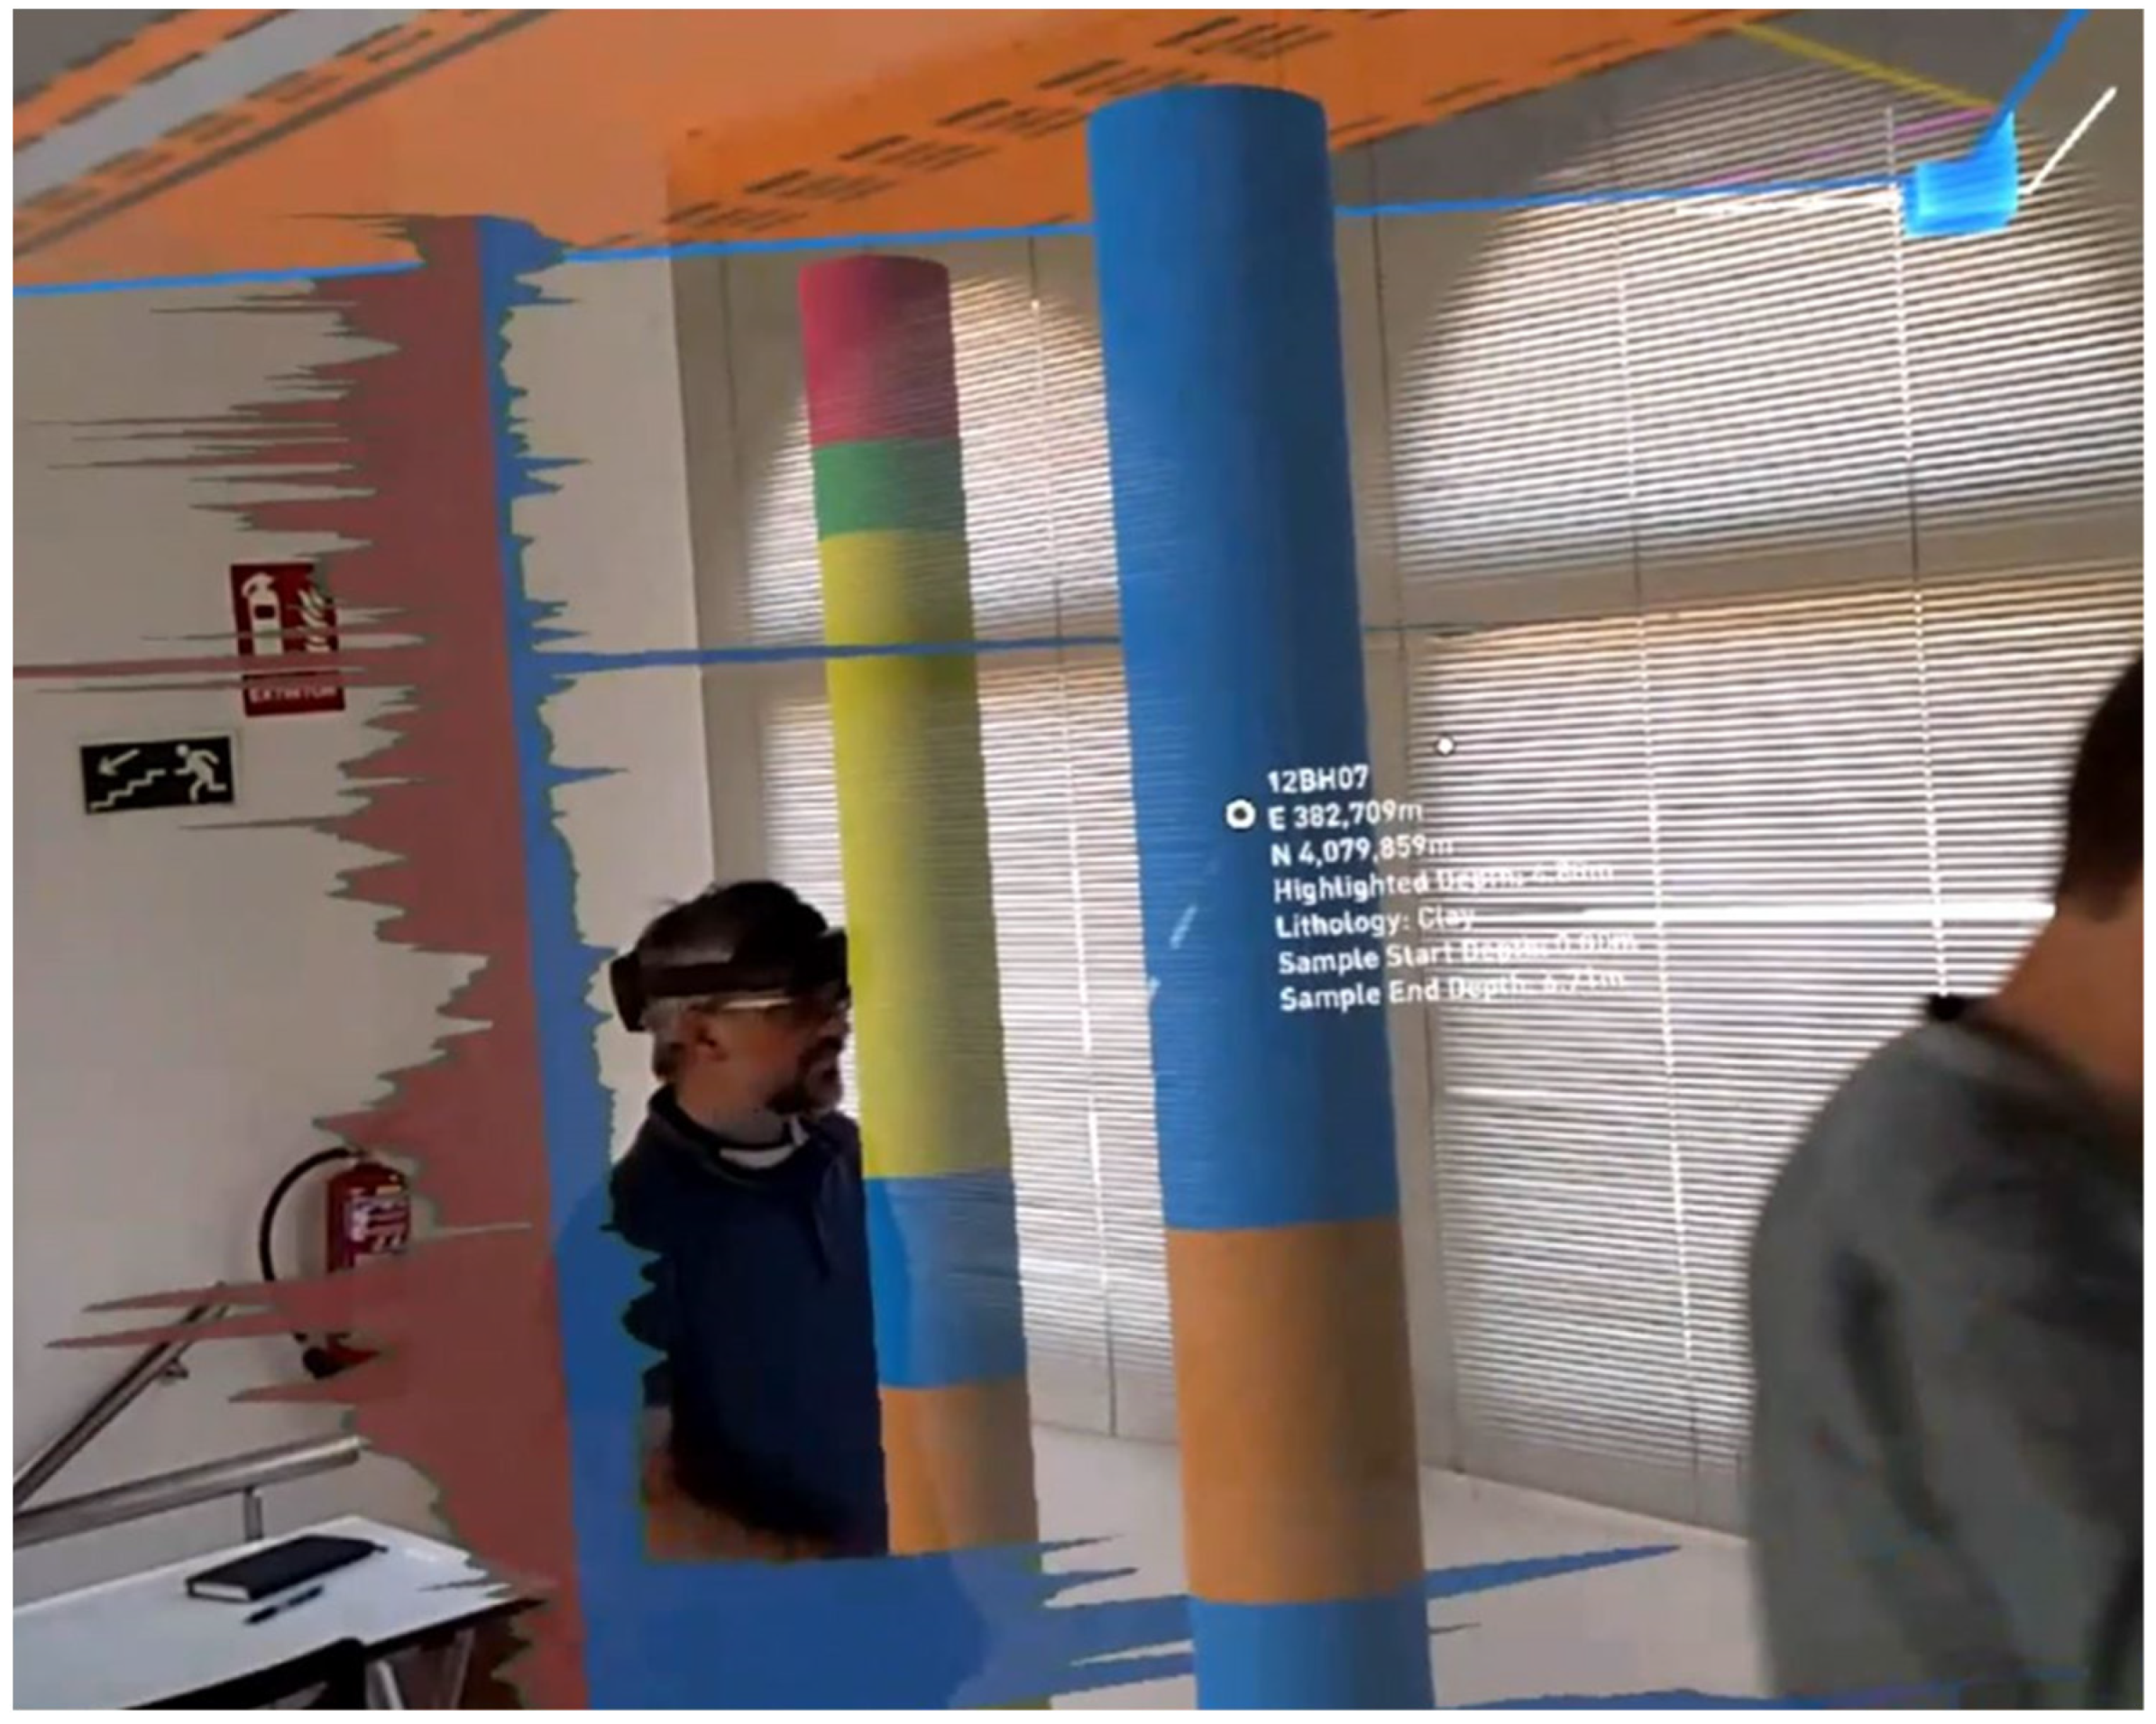
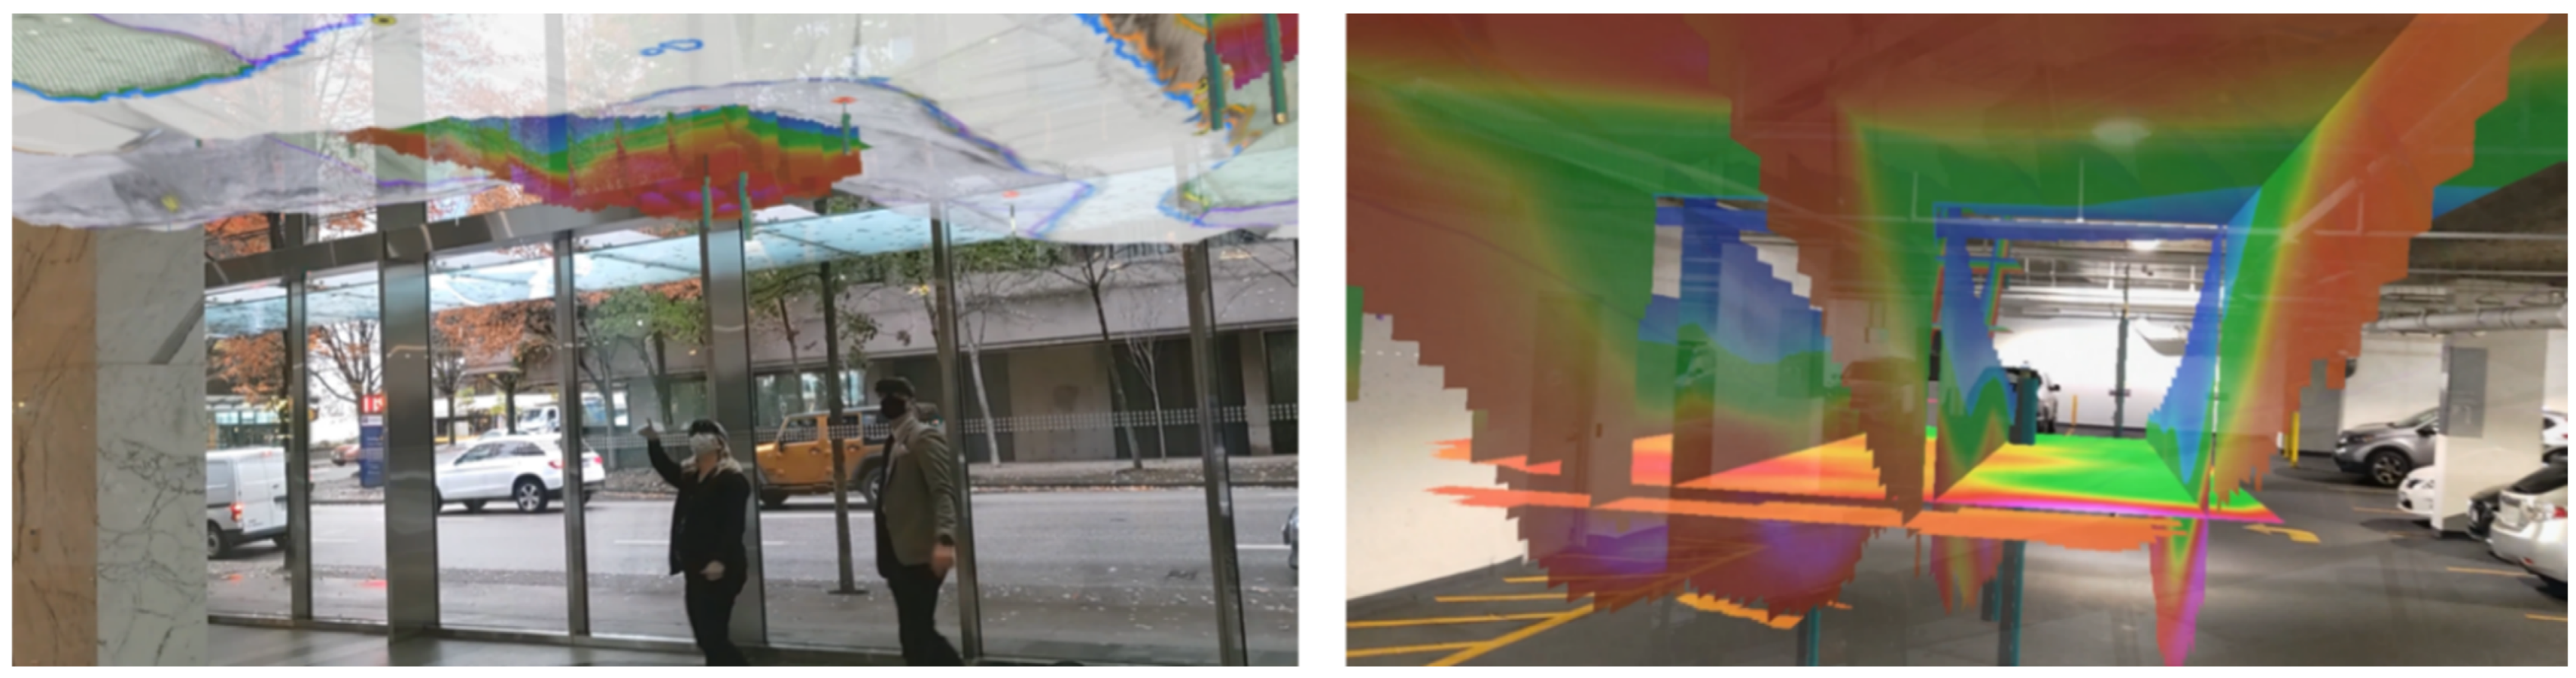
3.1. MR Applied to Mining, Geotechnical and Geological Engineering
- Case (a)
- Case (b)
- Case (c)
- Case (d)
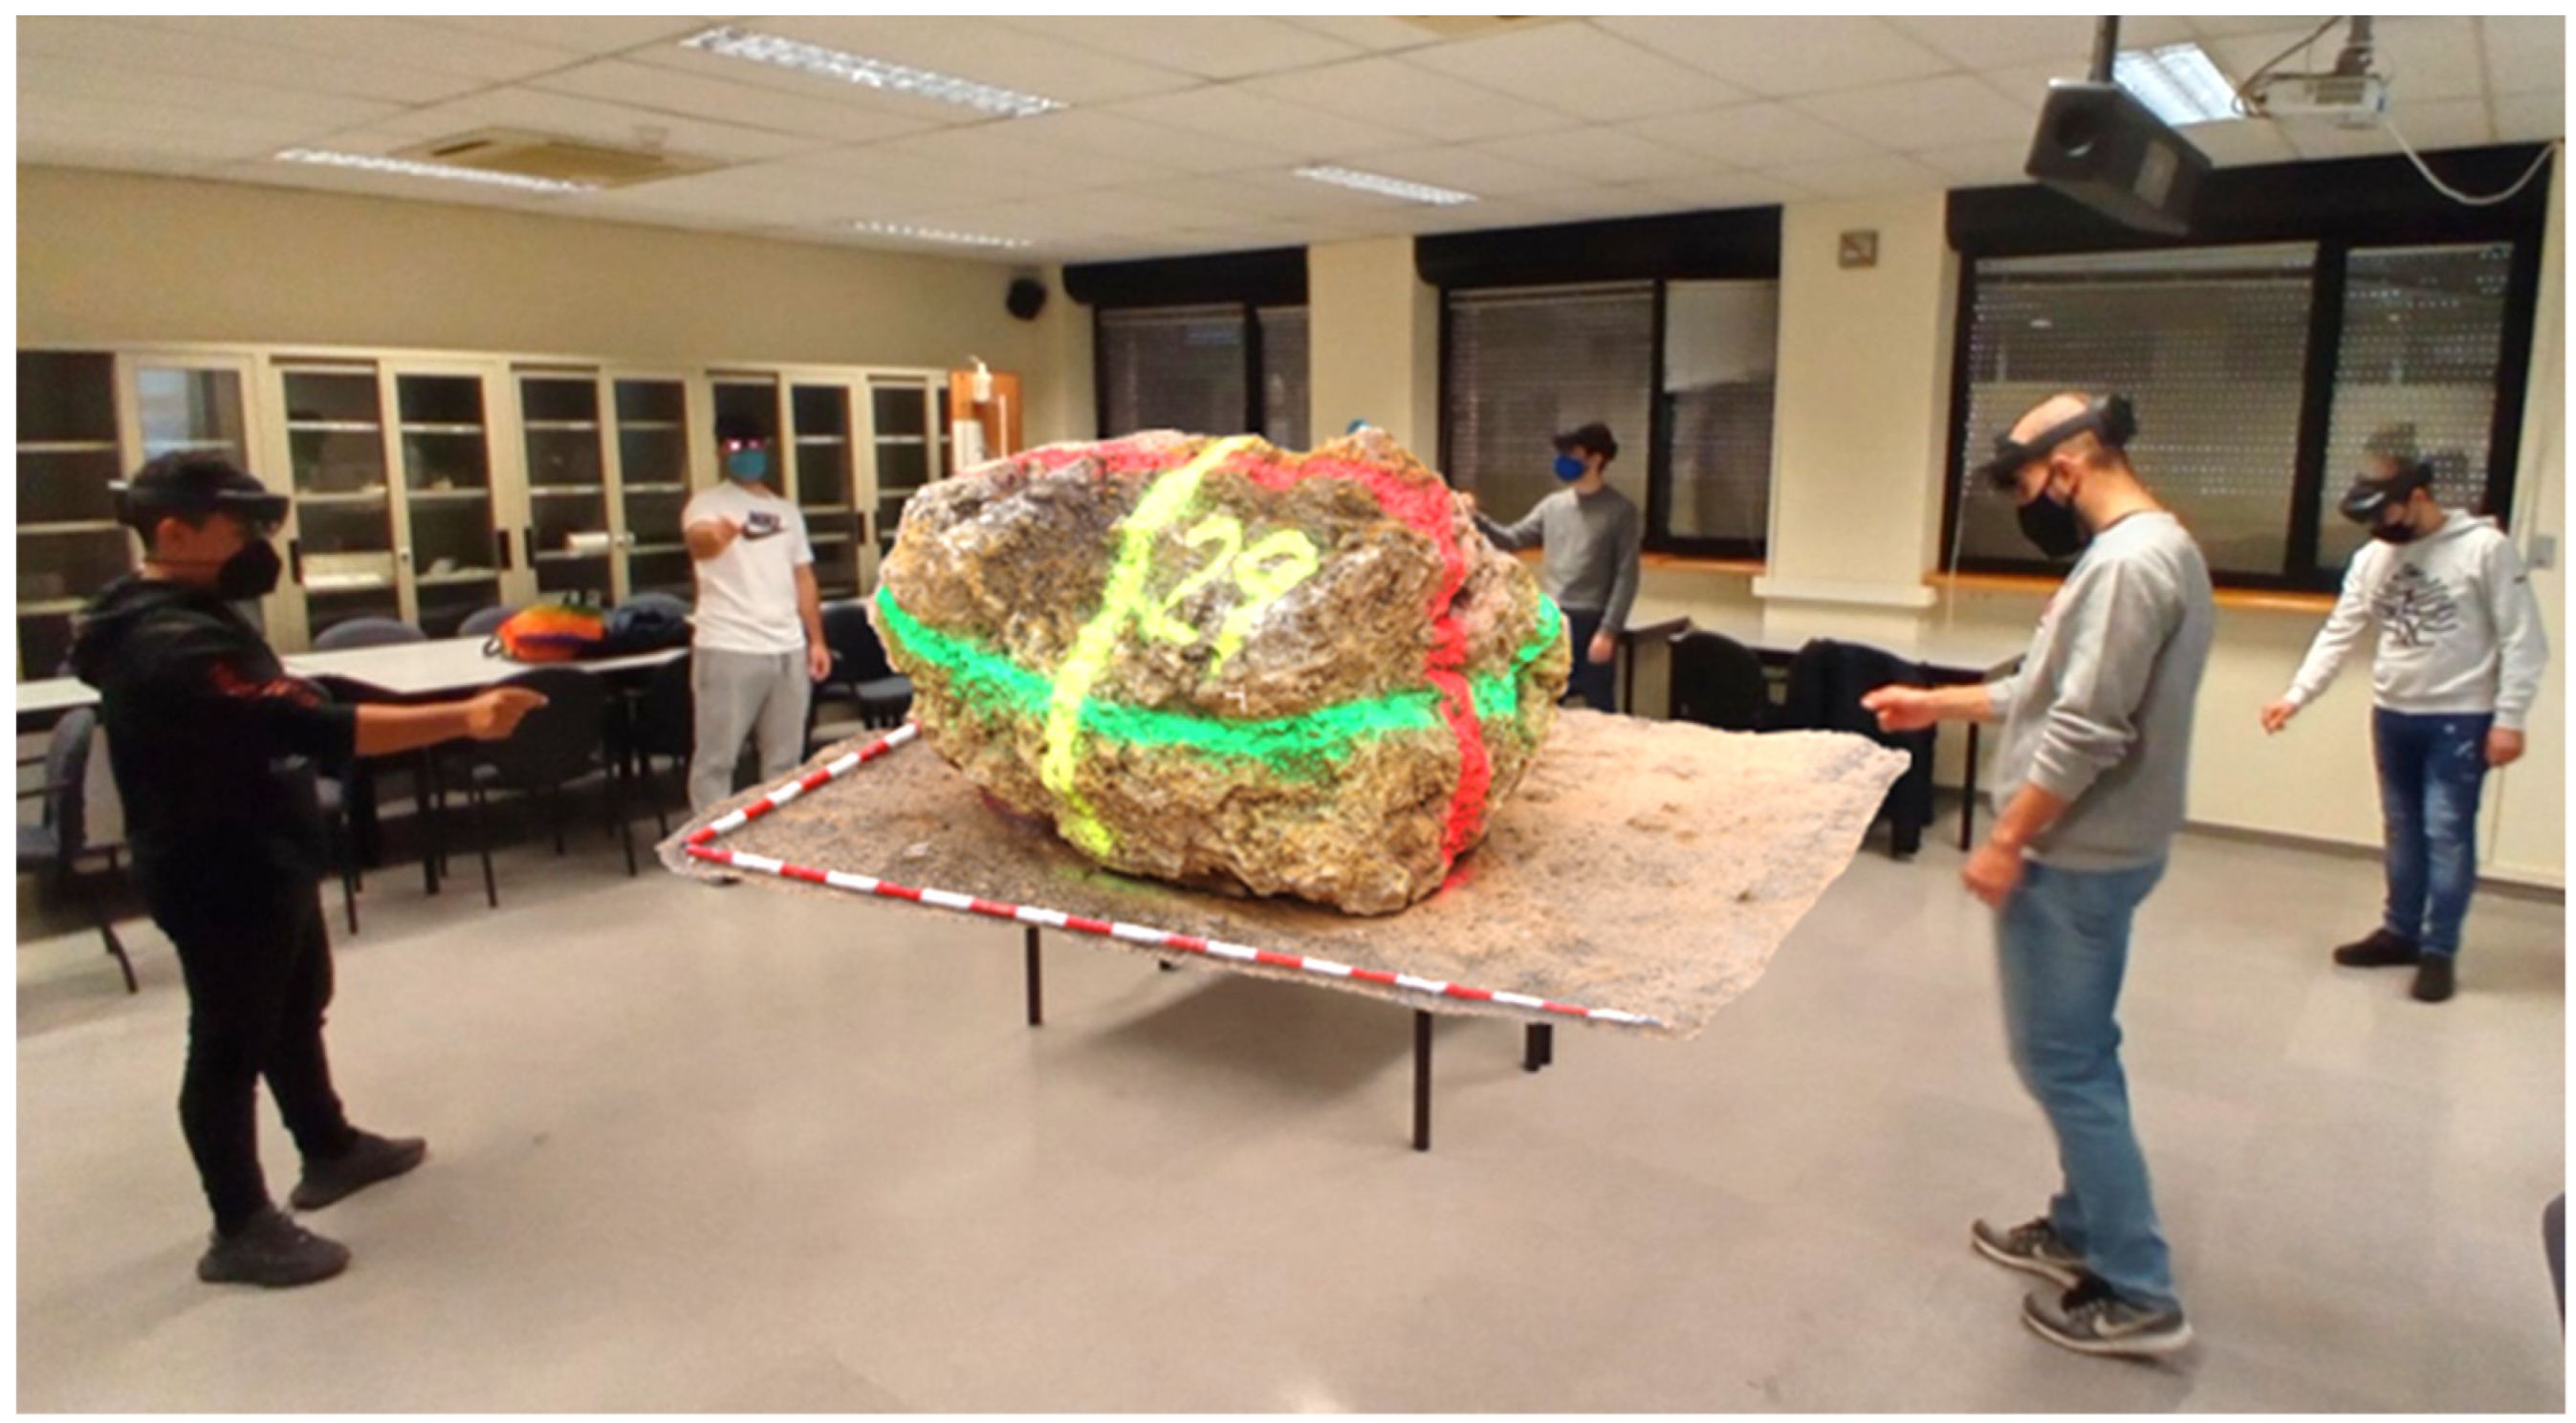
3.2. MR Geovisualization during Stability Assessment on Montserrat Rocky Slopes
4. Conclusions
Supplementary Materials
Author Contributions
Funding
Institutional Review Board Statement
Data Availability Statement
Acknowledgments
Conflicts of Interest
References
- Janeras, M.; Navarro, M.; Arnó, G.; Ruiz, A.; Kornus, W.; Talaya, J.; Barberà, M.; López, F. LiDAR applications to rock fall hazard assesment in Vall de Núria. In Proceedings of the 4th Mountain Cartography Workshop, Catalonia, Spain, 30 September–2 October 2004; International Cartographic Association, ICA: Bern, Switzerland, 2004. [Google Scholar]
- Buckley, S.J.; Howell, J.A.; Enge, H.D.; Kurz, T.H. Terrestrial laser scanning in geology: Data acquisition, processing and accuracy considerations. J. Geol. Soc. 2008, 165, 625–638. [Google Scholar] [CrossRef]
- Derron, M.H.; Jaboyedoff, M. LIDAR and DEM techniques for landslides monitoring and characterization. Nat. Hazards Earth Syst. Sci. 2010, 10, 1877–1879. [Google Scholar] [CrossRef]
- Jaboyedoff, M.; Oppikofer, T.; Abellán, A.; Derron, M.-H.; Loye, A.; Metzger, R.; Pedrazzini, A. Use of LIDAR in landslide investigations: A review. Nat. Hazards 2012, 61, 5–28. [Google Scholar] [CrossRef]
- Santana, D.; Corominas, J.; Mavrouli, O.; Garcia-Sellés, D. Magnitude-frequency relation for rockfall scars using a Terrestrial Laser Scanner. Eng. Geol. 2012, 145, 50–64. [Google Scholar] [CrossRef]
- Bemis, S.P.; Micklethwaite, S.; Turner, D.; James, M.R.; Akciz, S.; Thiele, S.T.; Bangash, H.A. Ground-based and UAV-based photogrammetry: A multi-scale, high-resolution mapping tool for structural geology and paleoseismology. J. Struct. Geol. 2014, 69, 163–178. [Google Scholar] [CrossRef]
- Riquelme, A.; Abellán, A.; Tomás, R. Discontinuity spacing analysis in rock masses using 3D point clouds. Eng. Geol. 2015, 195, 185–195. [Google Scholar] [CrossRef]
- Abellan, A.; Derron, M.H.; Jaboyedoff, M. “Use of 3D point clouds in geohazards” special issue: Current challenges and future trends. Remote Sens. 2016, 8, 130. [Google Scholar] [CrossRef]
- Williams, J.; Rosser, N.; Hardy, R.; Brain, M.; Afana, A. Optimising 4-D surface change detection: An approach for capturing rockfall magnitude-frequency. Earth Surf. Dyn. 2018, 6, 101–119. [Google Scholar] [CrossRef]
- Ruiz-Carulla, R.; Corominas, J.; Gili, J.A.; Matas, G.; Lantada, N.; Moya, J.; Prades, A.; Núñez-Andrés, M.A.; Buill, F.; Puig, C. Analysis of fragmentation of rock blocks from real-scale tests. Geosciences 2020, 10, 308. [Google Scholar] [CrossRef]
- Pugsley, J.; Howell, J.; Hartley, A.; Buckley, S.; Brackenridge, R.; Schofield, N.; Maxwell, G.; Chmielewska, M.; Ringdal, K.; Naumann, N.; et al. Virtual Fieldtrips: Construction, delivery, and implications for future geological fieldtrips. Geosci. Commun. 2021. [Google Scholar] [CrossRef]
- Westoby, M.J.; Brasington, J.; Glasser, N.F.; Hambrey, M.J.; Reynolds, J.M. “Structure-from-motion” photogrammetry: A low-cost, effective tool for geoscience applications. Geomorphology 2012, 179, 300–314. [Google Scholar] [CrossRef]
- Briones-Bitar, J.; Carrión-Mero, P.; Montalván-Burbano, N.; Morante-Carballo, F. Rockfall research: A bibliometric analysis and future trends. Geosciences 2020, 10, 403. [Google Scholar] [CrossRef]
- Onsel, E.I.; Stead, D.; Barnett, W.; Zorzi, L.; Shaban, A. Innovative mixed reality approach to rock mass mapping in underground mining. In MassMin 2020: Proceedings of the Eighth International Conference & Exhibition on Mass Mining; Castro, R., Báez, F., Suzuki, K., Eds.; University of Chile: Santiago, Chile, 2020; pp. 1375–1383. [Google Scholar] [CrossRef]
- Pedraza, O.; Janeras, M.; Gili, J.A.; Struth, L.; Buill FGuinau, M.; Ferré, A.; Roca, J. Comunicación de la Geoinformación 3D Mediante Visores Web y Entornos Inmersivos de Realidad Mixta en Problemas de Taludes Y Laderas. In X Simposio Nacional sobre Taludes y Laderas Inestables Granada; Hürlimann, M., Pinyol, N., Eds.; CIMNE: Barcelona, Spain, 2022. [Google Scholar]
- Roca, J. Webinar-Mixed Reality Tools for Visualization of Complex Spatial Data in Geomechanics. Video Material, Duration 45:14. 2022. Available online: https://www.youtube.com/channel/UC-WCRiWoes7q-J0_nMqPmUg/featured (accessed on 31 July 2022).
- Franklin, K.A.; MacInnis, C.R.; Roca, J.; Magnusson, G.R.; Burton, B.T.J.; Enos, R.N. Holographic models of closure landscapes for stakeholder engagement—When you need more than words and pictures. In Proceedings of the 15th International Conference on Mine Closure ‘Mine Closure 2022’, Brisbane, Australia, 4–6 October 2022; p. 12. [Google Scholar]
- Li, I.; Lato, M.; Magnusson, G.; Roca, J.; Reid, E. Augmented Reality and Applied Augmented Reality and Applied Earth Science: A New Tool for Site Characterization. Vancouver Geotechnical Society Symposium, 2019. Available online: http://v-g-s.ca/2019-proceedings (accessed on 31 July 2022).
- Milgram, P.; Takemura, H.; Utsumi, A.; Kishino, F. Augmented Reality: A class of displays on the reality-virtuality continuum. In Proceedings of Telemanipulator and Telepresence Technologies; International Society for Optics and Photonics: Bellingham, WA, USA, 1994; Volume 2351, pp. 282–292. [Google Scholar]
- Milgram, P.; Colquhoun, H., Jr. A Taxonomy of Real and Virtual World Display Integration. In Mixed Reality: Merging Real and Virtual Worlds; Springer: New York, NY, USA; Berlin/Heidelberg, Germany, 1999; pp. 5–30. [Google Scholar] [CrossRef]
- Carrasco, M.D.O.; Chen, P.H. Application of mixed reality for improving architectural design comprehension effectiveness. Autom. Constr. 2021, 126, 103677. [Google Scholar] [CrossRef]
- Fast-Berglund, Å.; Liang, G.; Li, D. Testing and validating Extended Reality (xR) technologies in Manufacturing. Procedia Manuf. 2018, 25, 31–38. [Google Scholar] [CrossRef]
- Stead, D. Rock Slope Engineering: A combined Remote Sensing-Numerical Modelling Approach. In Proceedings of the 34th ISRM, online Lecture, 24 June 2021; Available online: https://isrm.net/isrm/page/show/1588 (accessed on 31 July 2022).
- Li, X.; Yi, W.; Chi, H.; Wang, X.; Chan, A. A critical review of virtual and augmented reality (VR/AR) applications in construction safety. Autom. Constr. 2018, 86, 150–162. [Google Scholar] [CrossRef]
- Mora-Serrano, J.; Muñoz-La Rivera, F.; Valero, I. Factors for the Automation of the Creation of Virtual Reality Experiences to Raise Awareness of Occupational Hazards on Construction Sites. Electronics 2021, 10, 1355. [Google Scholar] [CrossRef]
- Janusz, J. Toward the New Mixed Reality Environment for Interior Design. In Proceedings of the IOP Conference Series: Materials Science and Engineering; IOP Publishing: Bristol, UK, 2019; Volume 471, p. 102065. [Google Scholar] [CrossRef]
- Zhang, Y.; Liu, H.; Kang, S.C.; Al-Hussein, M. Virtual reality applications for the built environment: Research trends and opportunities. Autom. Constr. 2020, 118, 103311. [Google Scholar] [CrossRef]
- La Rivera, F.M.; Mora-Serrano, J.; Oñate, E. Virtual reality stories for construction training scenarios: The case of social distancing at the construction site. WIT Trans. Built Environ. 2021, 205, 37–47. [Google Scholar] [CrossRef]
- Bopp, M.J.; La Rivera, F.M.; Sierra-Martí, C.; Mora-Serrano, J. Automating the Creation of VR Experiences as Learning Pills for the Construction Sector. In Proceedings of the 6th International Conference of Educational Innovation in Building, CINIE, Surabaya, Indonesia, 10 September 2022; p. 13. [Google Scholar]
- Frederiksen, J.G.; Sørensen, S.M.D.; Konge, L.; Svendsen, M.B.S.; Nobel-Jørgensen, M.; Bjerrum, F.; Andersen, S.A.W. Cognitive load and performance in immersive virtual reality versus conventional virtual reality simulation training of laparoscopic surgery: A randomized trial. Surg. Endosc. 2020, 34, 1244–1252. [Google Scholar] [CrossRef]
- Vasudevan, M.K.; Isaac, J.H.R.; Sadanand, V.; Muniyandi, M. Novel virtual reality based training system for fine motor skills: Towards developing a robotic surgery training system. Int. J. Med. Robot. 2020, 16, 1–14. [Google Scholar] [CrossRef]
- Tschirschwitz, F.; Richerzhagen, C.; Przybilla, H.J.; Kersten, T.P. Duisburg 1566: Transferring a Historic 3D City Model from Google Earth into a Virtual Reality Application. PFG J. Photogramm. Remote Sens. Geoinf. Sci. 2019, 87, 47–56. [Google Scholar] [CrossRef]
- Edler, D.; Keil, J.; Wiedenlübbert, T.; Sossna, M.; Kühne, O.; Dickmann, F. Immersive VR Experience of Redeveloped Post-industrial Sites: The Example of “Zeche Holland” in Bochum-Wattenscheid. KN J. Cartogr. Geogr. Inf. 2019, 69, 267–284. [Google Scholar] [CrossRef]
- Onsel, I.E.; Chang, O.; Mysiorek, J.; Donati, D.; Stead, D.; Barnett, W.; Zorzi, L. Applications of mixed and virtual reality techniques in site characterization. In Proceedings of the 26th Vancouver Geotechnical Society Symposium, Vancouver, BC, Canada, 31 May 2019. [Google Scholar]
- Mysiorek, J.; Onsel, I.E.; Stead, D.; Rosser, N. Engineering geological characterization of the 2014 Jure Nepal landslide: An integrated field, remote sensing-Virtual/Mixed Reality approach. In Proceedings of the 53rd US Rock Mechanics/Geomechanics Symposium, New York, NY, USA, 23–26 June 2019; OnePetro: Richardson, TX, USA, 2019. [Google Scholar]
- Lato, M. Canadian Geotechnical Colloquium: Three-dimensional remote sensing, four-dimensional analysis and visualization in geotechnical engineering—State of the art and outlook. Can. Geotech. J. 2021, 58, 1065–1076. [Google Scholar] [CrossRef]
- Anderson, S. We All Saw It the Same Way, Video Material, Duration 14:23. 2019. Available online: https://youtu.be/lkY-B_weRaA (accessed on 31 July 2022).
- BGC. BGC Engineering Inc Brings Giant Mine Project to Life in 3D with the ADA Platform. Video Material, Duration 1:35. 2018. Available online: https://youtu.be/6yNj3U105Oo (accessed on 31 July 2022).
- BGC. Bring Your Field to the Office. Video Material, Duration 2:14. 2021. Available online: https://youtu.be/hiN8mnvWl7s (accessed on 31 July 2022).
- Janiszewski, M.; Uotinen, L.; Merkel, J.; Leveinen, J.; Rinne, M. Virtual Reality learning environments for rock engineering, geology and mining education. In Proceedings of the 54th US Rock Mechanics/Geomechanics Symposium, Golden, CO, USA, 28 June–1 July 2020; OnePetro: Richardson, TX, USA, 2020. [Google Scholar]
- Pratt, M.J.; Skemer, P.A.; Arvidson, R.E. Developing an Augmented Reality Environment for Earth Science Education. In Proceedings of the 2017 AGU Fall Meeting Abstracts, New Orleans, LA, USA, 11–15 December 2017; Volume 2017, p. ED11C-0133. Available online: https://ui.adsabs.harvard.edu/abs/2017AGUFMED11C0133P/abstract (accessed on 31 July 2022).
- Rienow, A.; Lindner, C.; Dedring, T.; Hodam, H.; Ortwein, A.; Schultz, J.; Selg, F.; Staar, K.; Jürgens, C. Augmented reality and virtual reality applications based on satellite-borne and ISS-borne remote sensing data for school lessons. PFG J. Photogramm. Remote Sens. Geoinformation Sci. 2020, 88, 187–198. [Google Scholar] [CrossRef]
- Lindner, C.; Rienow, A.; Otto, K.-H.; Juergens, C. Development of an App and Teaching Concept for Implementation of Hyperspectral Remote Sensing Data into School Lessons Using Augmented Reality. Remote Sens. 2022, 14, 791. [Google Scholar] [CrossRef]
- Leonard, S.N.; Fitzgerald, R.N. Holographic learning: A mixed reality trial of Microsoft HoloLens in an Australian secondary school. Res. Learn. Technol. 2018, 26, 2160. [Google Scholar] [CrossRef]
- Bonali, F.L.; Russo, E.; Vitello, F.; Antoniou, V.; Marchese, F.; Fallati, L.; Bracchi, V.; Corti, N.; Savini, A.; Whitworth, M.; et al. How Academics and the Public Experienced Immersive Virtual Reality for Geo-Education. Geosciences 2022, 12, 9. [Google Scholar] [CrossRef]
- GeoRisk R&D Project. Available online: https://georisk.upc.edu/en (accessed on 31 July 2022).
- Pyrmove R&D Project. Available online: https://pyrmove.eu/ (accessed on 31 July 2022).
- Anderson, S.A.; Klopfer, R. Going Everywhere with Your Digital Twin. Shared Vision Through Portable, Immersive, 3D Visualizations. Geostrata Magazine. August/September 2022. Available online: www.geoinstitute.org (accessed on 24 September 2022).
- Build Wagon. What Happened to the Microsoft HoloLens? 2022. Available online: https://www.buildwagon.com/What-happened-to-the-Hololens.html (accessed on 31 July 2022).
- Microsoft. “HoloLens 2: Get to know the New Features and Technical Specs”. 6 April 2020. Available online: https://www.microsoft.com/en-us/HoloLens/hardware (accessed on 31 July 2022).
- Unity Technologies. Unity-Real-Time Development Platform |3D, 2D VR & AR. Unity Technologies, 2022. Available online: https://unity.com/ (accessed on 31 July 2022).
- ADA Platform. Available online: https://www.adaplatform.io/products/ (accessed on 31 July 2022).
- Clirio Inc. Available online: https://clir.io/product (accessed on 31 July 2022).
- Giant Mine. Available online: https://en.wikipedia.org/wiki/Giant_Mine (accessed on 31 July 2022).
- St-Pierre, S. Bringing Remediation to the Public. A New App Provides 3D Engagement for the Giant Mine Remediation Project. Can. Inst. Min. Metall. Pet. 2022, 17. Available online: https://magazine.cim.org/en/news/2022/bringing-remediation-to-the-public-en/ (accessed on 31 July 2022).
- Gili, J.A.; Ruiz-Carulla, R.; Matas, G.; Moya, J.; Prades, A.; Corominas, J.; Lantada, N.; Núñez-Andrés, M.A.; Buill, F.; Puig, C.; et al. Rockfalls: Analysis of the block fragmentation through field experiments. Landslides 2022, 19, 1009–1029. [Google Scholar] [CrossRef]
- Matas, G.; Lantada, N.; Corominas, J.; Gili, J.; Ruiz-Carulla, R.; Prades, A. Simulation of full-scale rockfall tests with a fragmentation model. Geosciences 2020, 10, 168. [Google Scholar] [CrossRef]
- Alsaker, E.; Gabrielsen, R.H.; Roca, E. The significance of the fracture patterns of Late-Eocene Montserrat fan-delta, Catalan Coastal Ranges (NE Spain). Tectonophysics 1996, 266, 465–491. [Google Scholar] [CrossRef]
- Janeras, M.; Jara, J.A.; Royán, M.J.; Vilaplana, J.M.; Aguasca, A.; Fàbregas, X.; Gili, J.A.; Buxó, P. Multitechnique approach to rockfall monitoring in the Montserrat massif (Catalonia, NE Spain). Eng. Geol. 2017, 219, 4–20. [Google Scholar] [CrossRef]
- Cloud Compare. Available online: http://www.cloudcompare.org/ (accessed on 31 July 2022).
- CODE_BRIGHT. Available online: https://deca.upc.edu/en/projects/code_bright (accessed on 31 July 2022).


Publisher’s Note: MDPI stays neutral with regard to jurisdictional claims in published maps and institutional affiliations. |
© 2022 by the authors. Licensee MDPI, Basel, Switzerland. This article is an open access article distributed under the terms and conditions of the Creative Commons Attribution (CC BY) license (https://creativecommons.org/licenses/by/4.0/).
Share and Cite
Janeras, M.; Roca, J.; Gili, J.A.; Pedraza, O.; Magnusson, G.; Núñez-Andrés, M.A.; Franklin, K. Using Mixed Reality for the Visualization and Dissemination of Complex 3D Models in Geosciences—Application to the Montserrat Massif (Spain). Geosciences 2022, 12, 370. https://doi.org/10.3390/geosciences12100370
Janeras M, Roca J, Gili JA, Pedraza O, Magnusson G, Núñez-Andrés MA, Franklin K. Using Mixed Reality for the Visualization and Dissemination of Complex 3D Models in Geosciences—Application to the Montserrat Massif (Spain). Geosciences. 2022; 12(10):370. https://doi.org/10.3390/geosciences12100370
Chicago/Turabian StyleJaneras, Marc, Joan Roca, Josep A. Gili, Oriol Pedraza, Gerald Magnusson, M. Amparo Núñez-Andrés, and Kathryn Franklin. 2022. "Using Mixed Reality for the Visualization and Dissemination of Complex 3D Models in Geosciences—Application to the Montserrat Massif (Spain)" Geosciences 12, no. 10: 370. https://doi.org/10.3390/geosciences12100370
APA StyleJaneras, M., Roca, J., Gili, J. A., Pedraza, O., Magnusson, G., Núñez-Andrés, M. A., & Franklin, K. (2022). Using Mixed Reality for the Visualization and Dissemination of Complex 3D Models in Geosciences—Application to the Montserrat Massif (Spain). Geosciences, 12(10), 370. https://doi.org/10.3390/geosciences12100370