
Characteristics of Lake Sediment from Southwestern Mongolia and Comparison with Meteorological Data

 , ,
, ,  ,
,  ,
,
Abstract
:1. Introduction
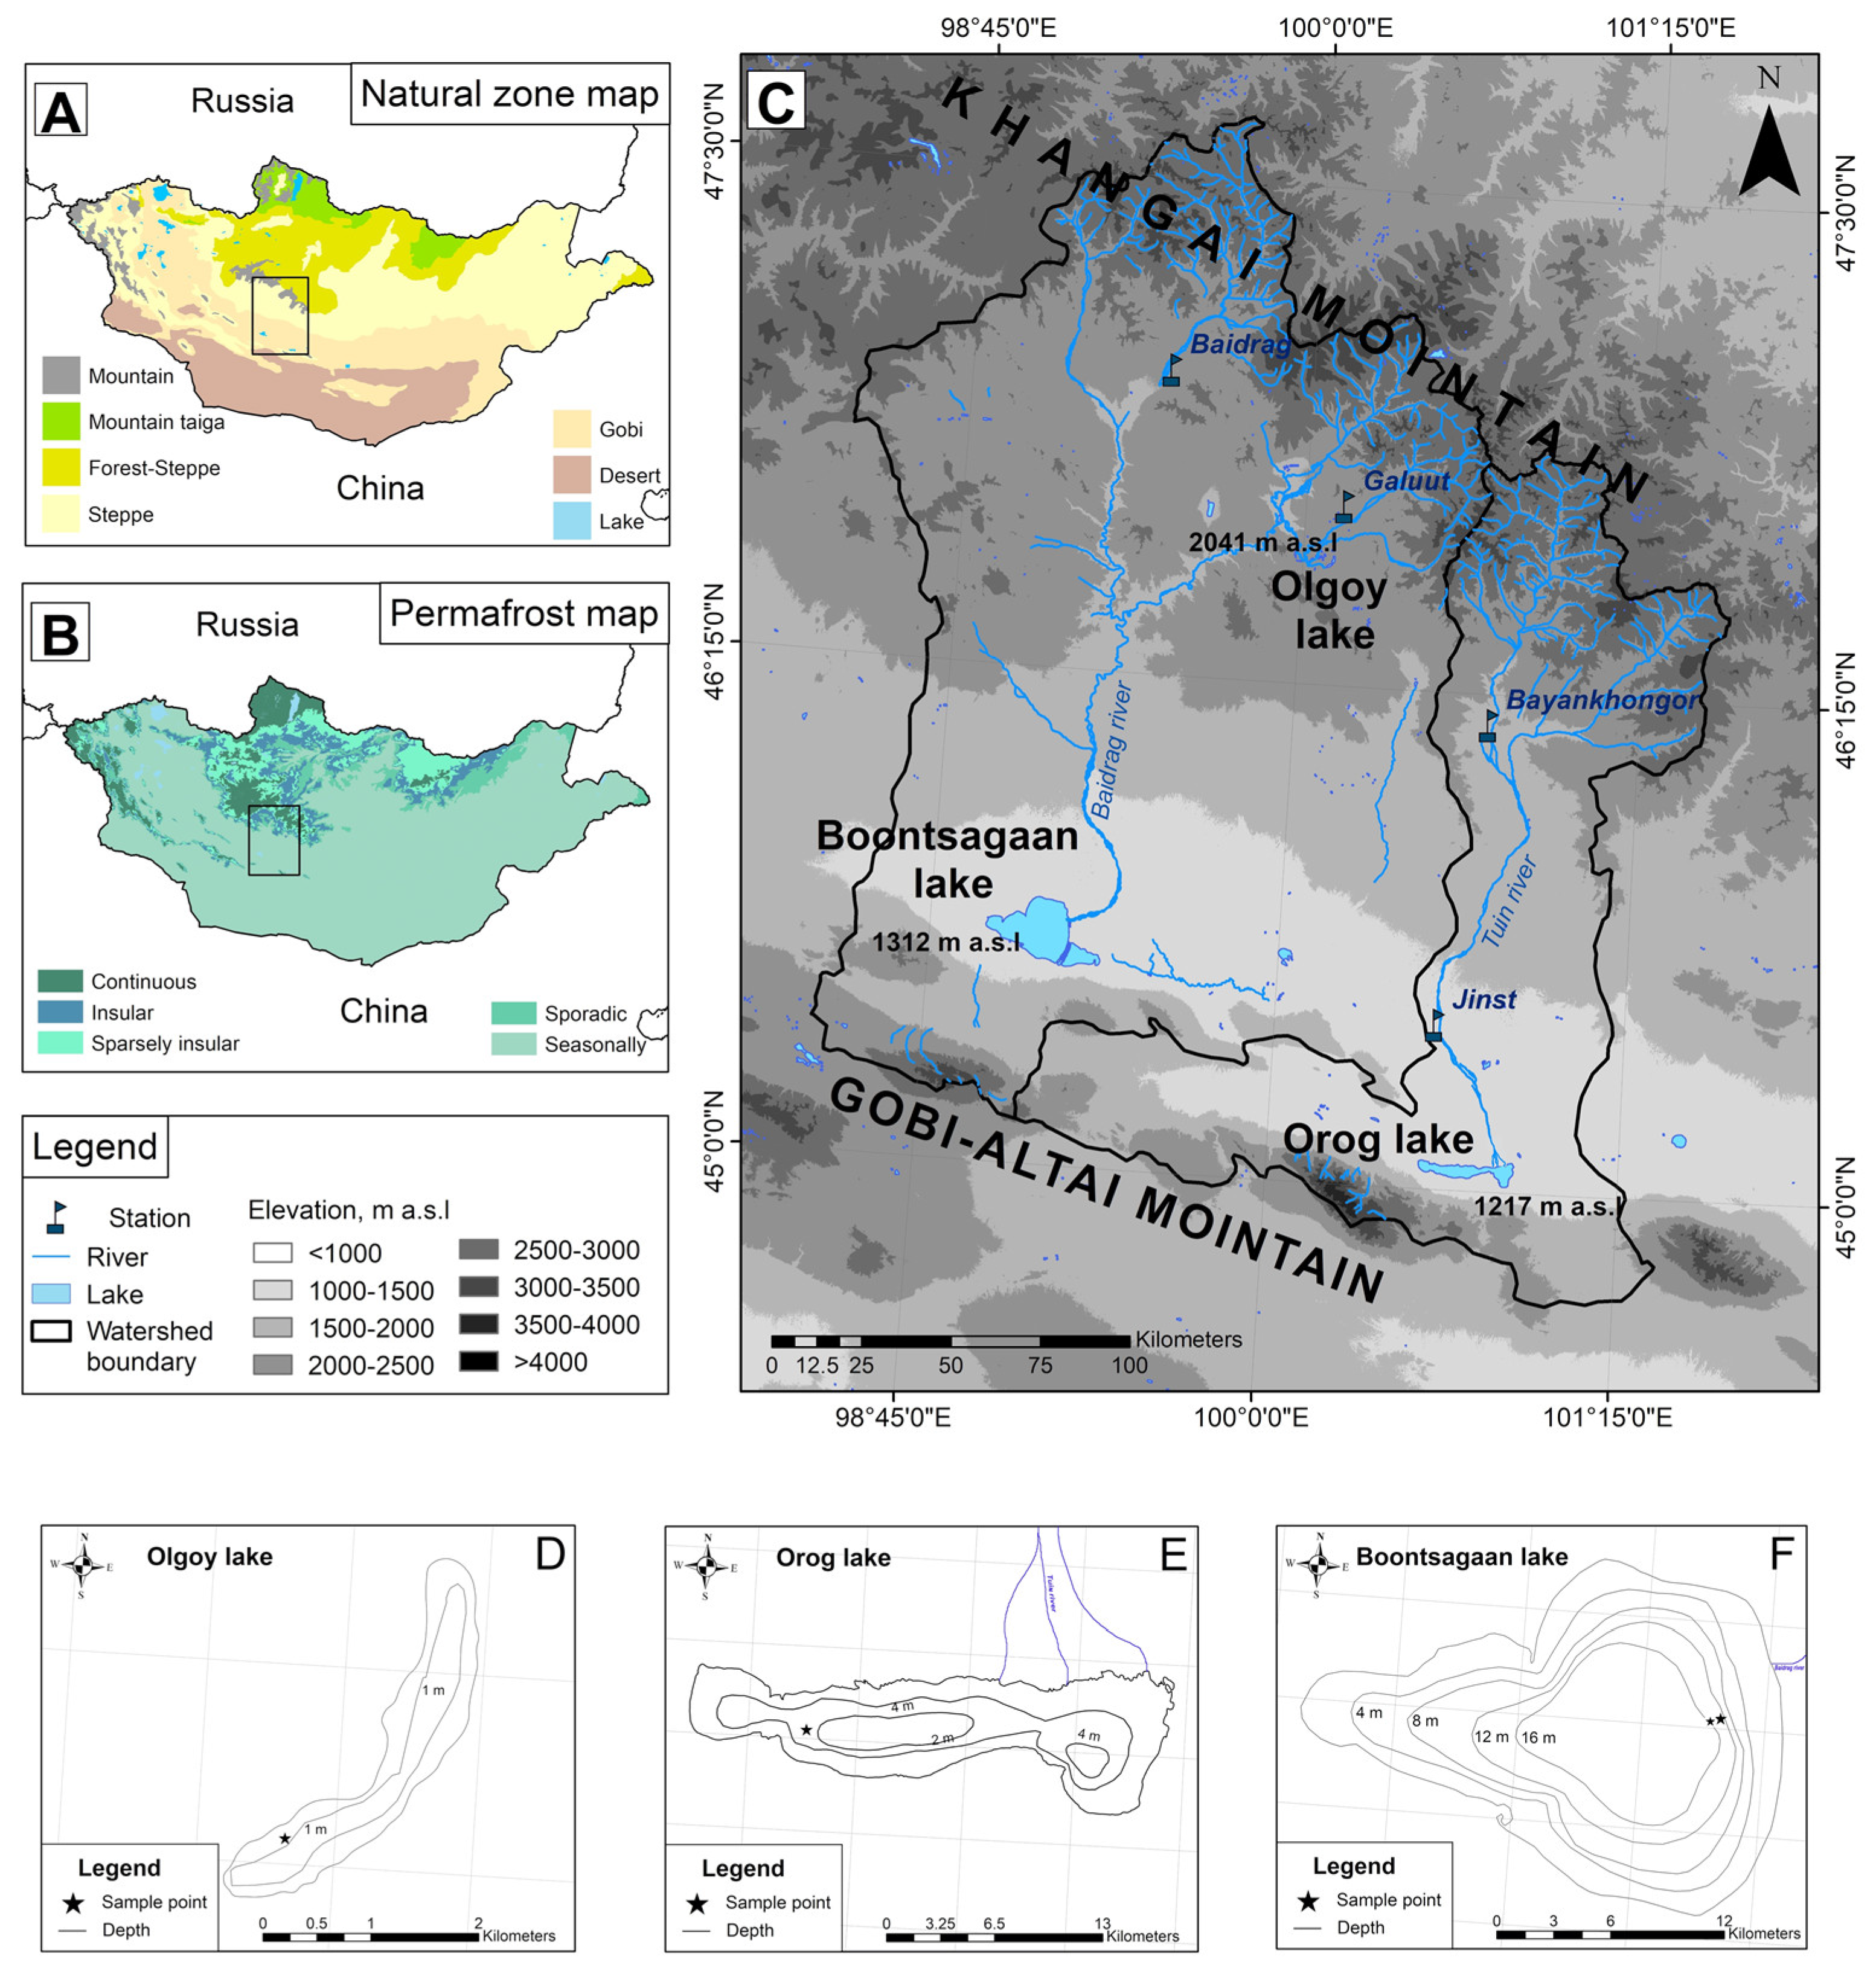
2. Site Description
3. Materials and Methods
3.1. Laboratory Analysis
3.2. Sediment Dating
3.3. Meteorological Data
3.4. Principal Component Analysis
4. Results
4.1. Meteorological Data
4.2. Radioactive Concentration and Sedimentation Rate
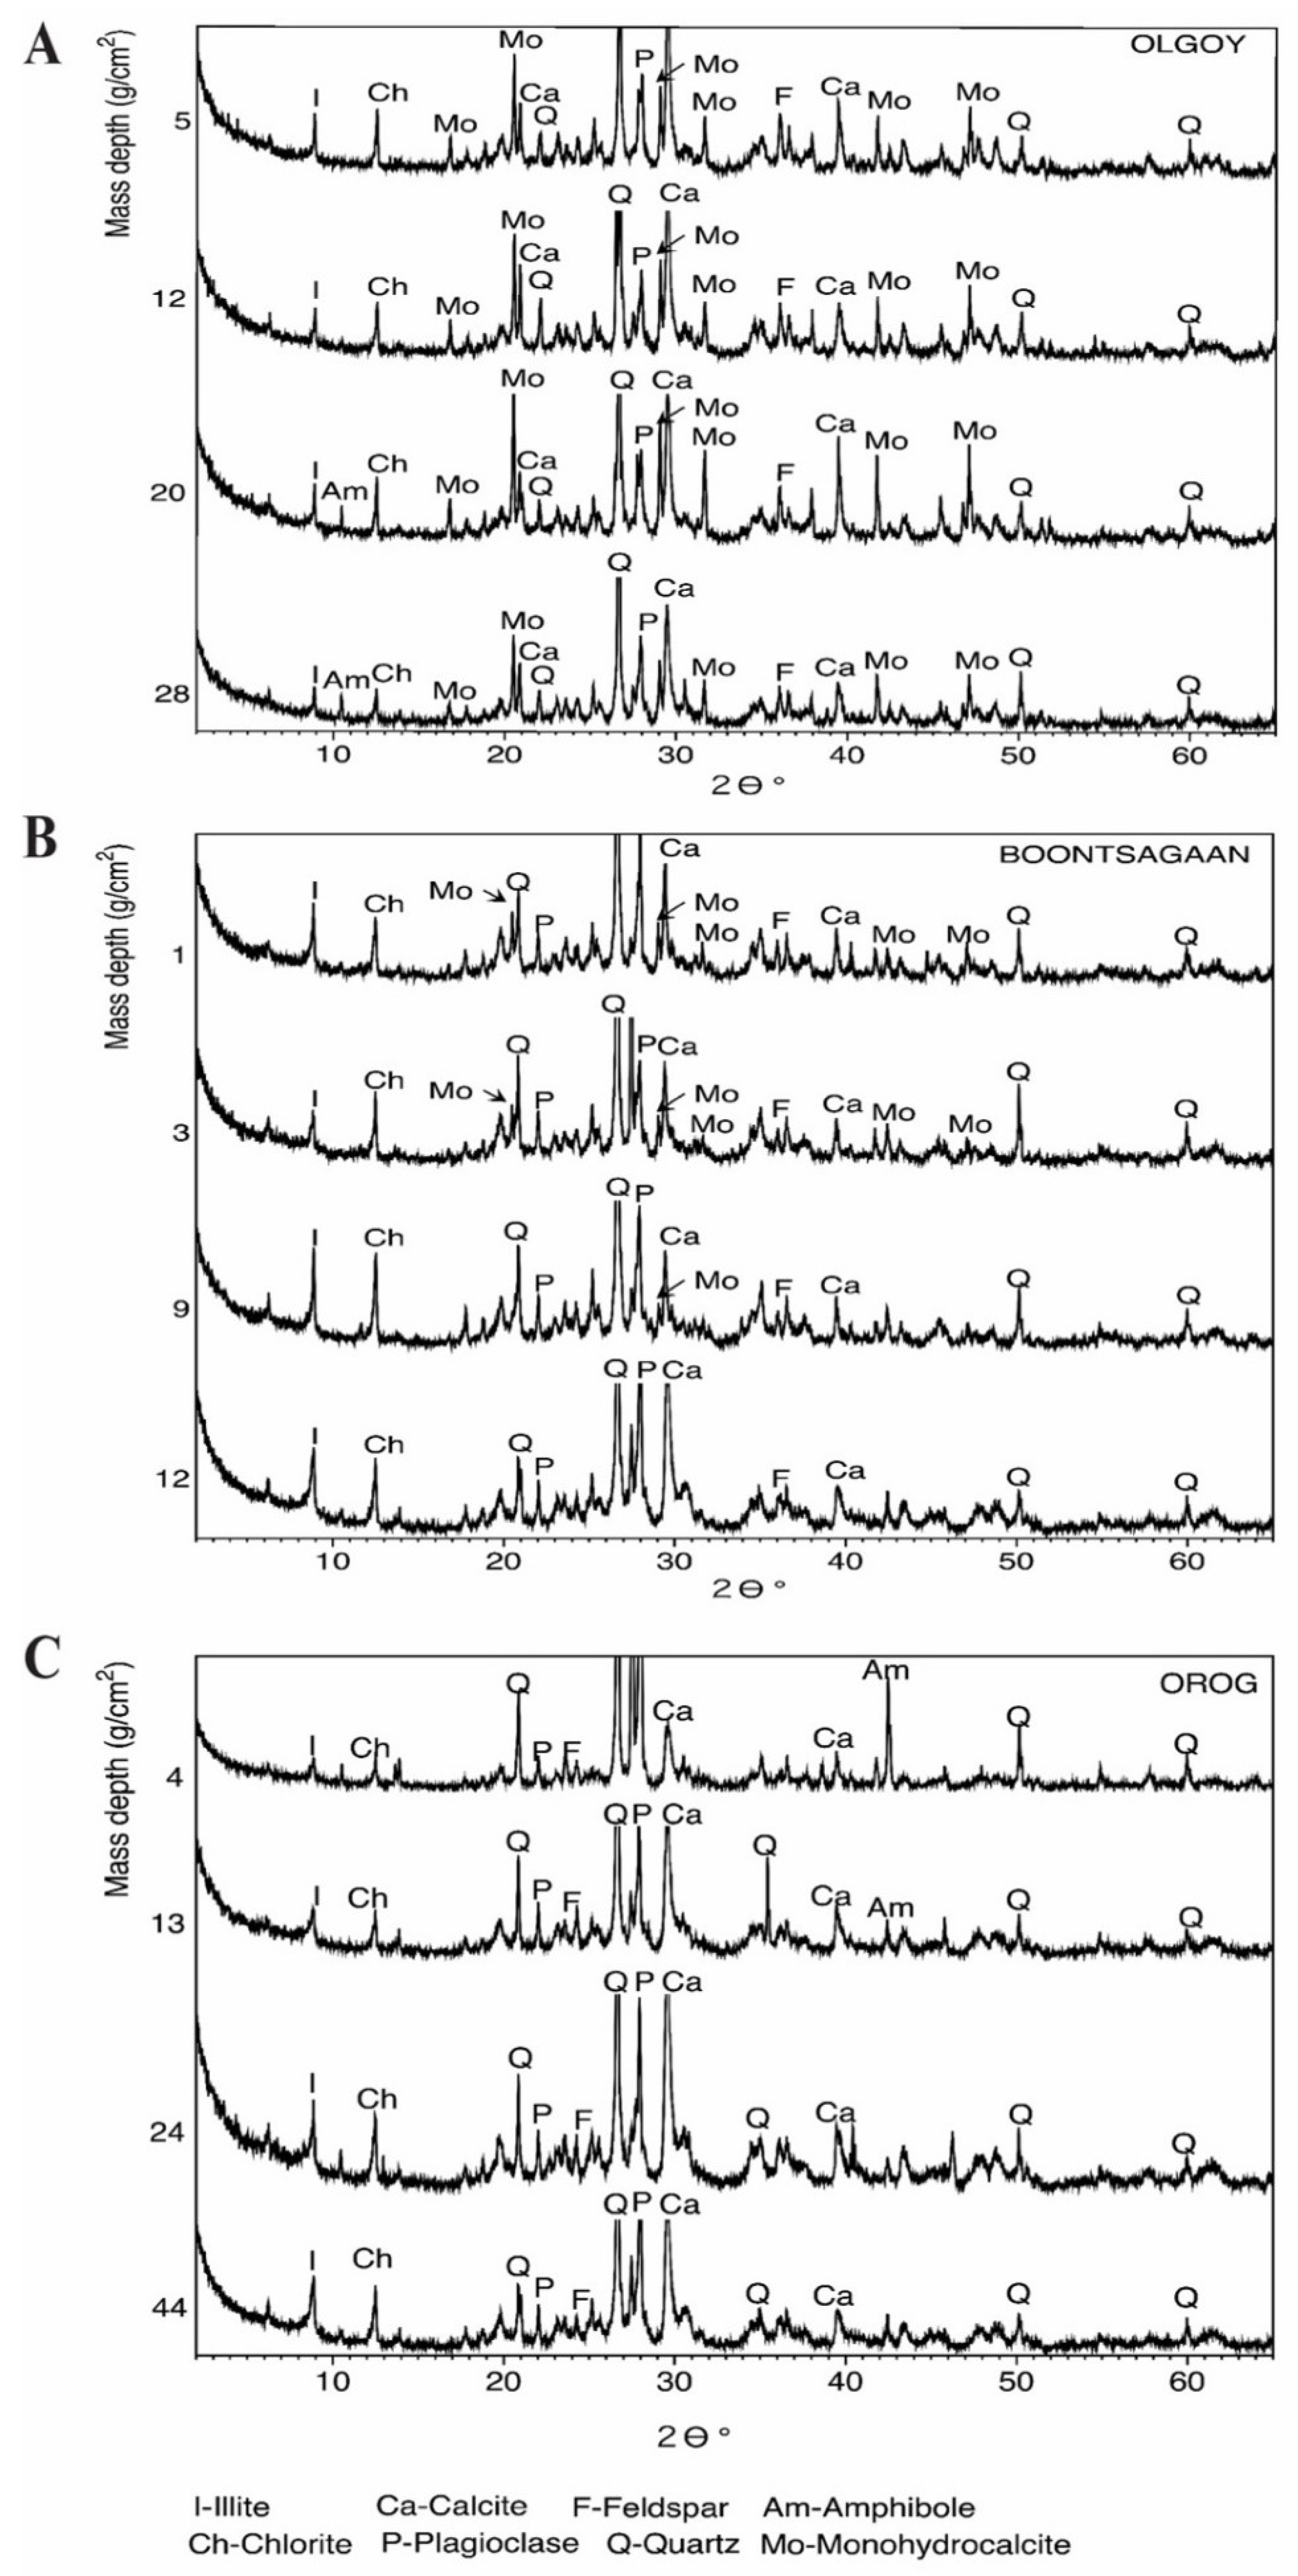
4.3. Mineral Assemblages (XRD)
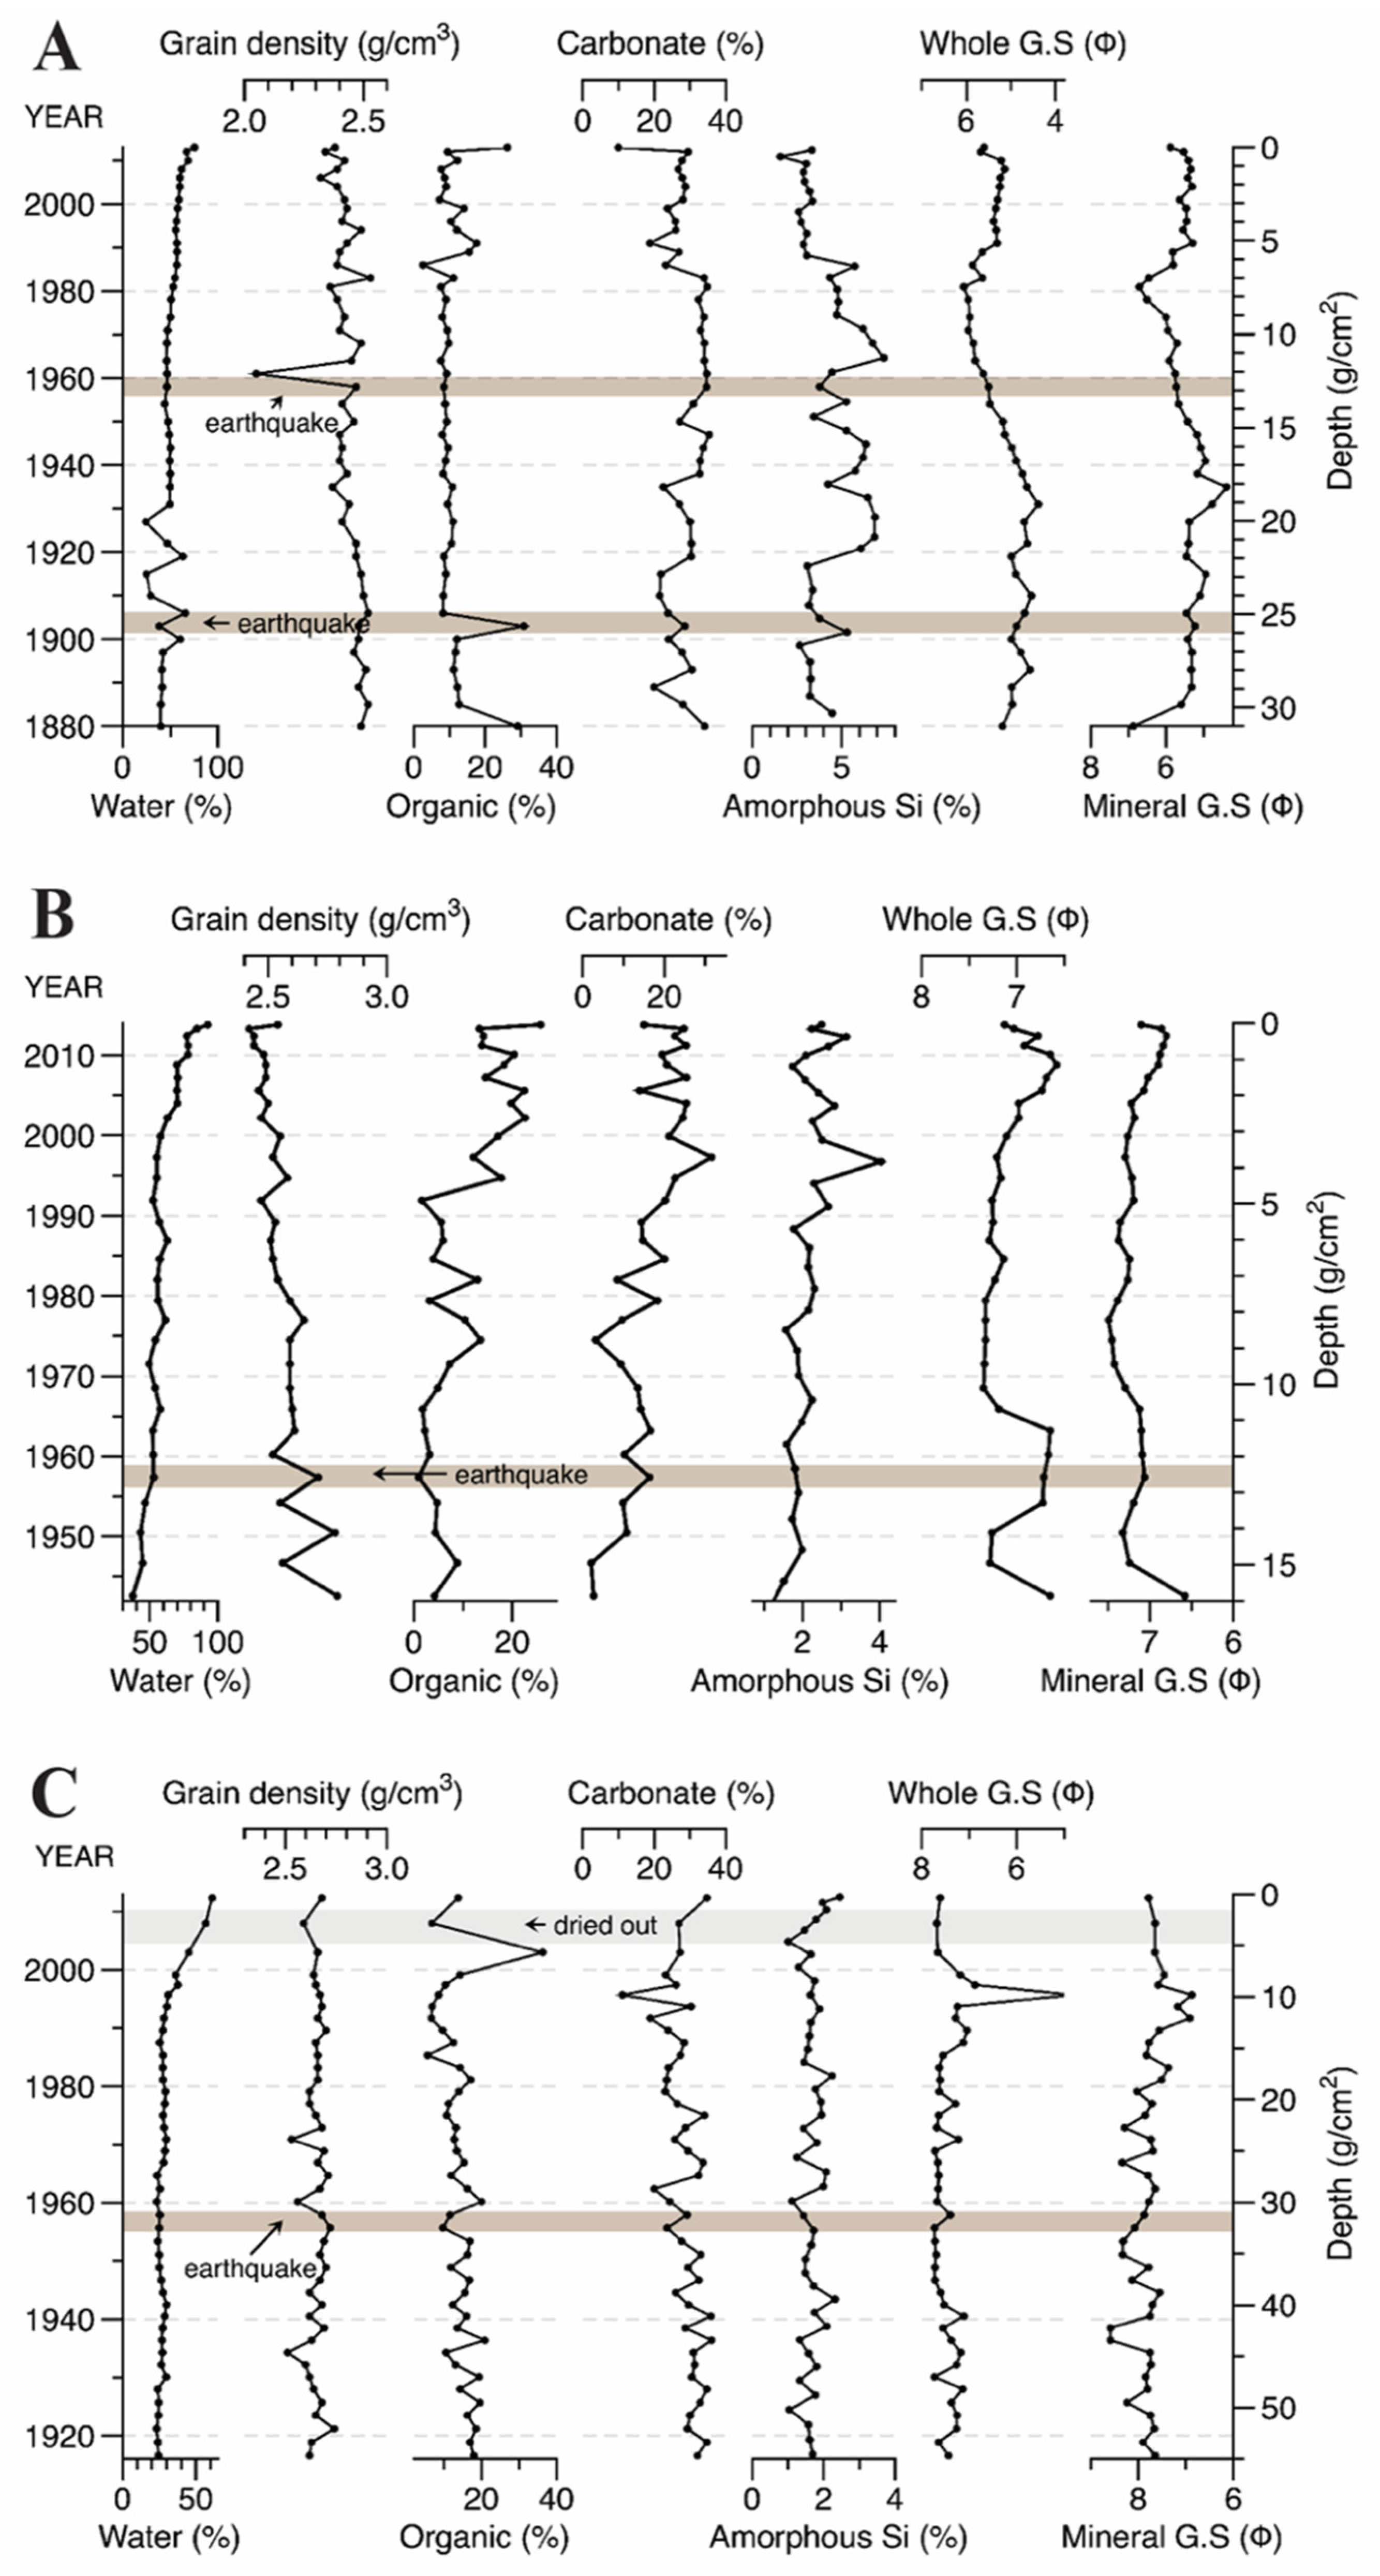
4.4. Physical and Chemical Properties of Sediment
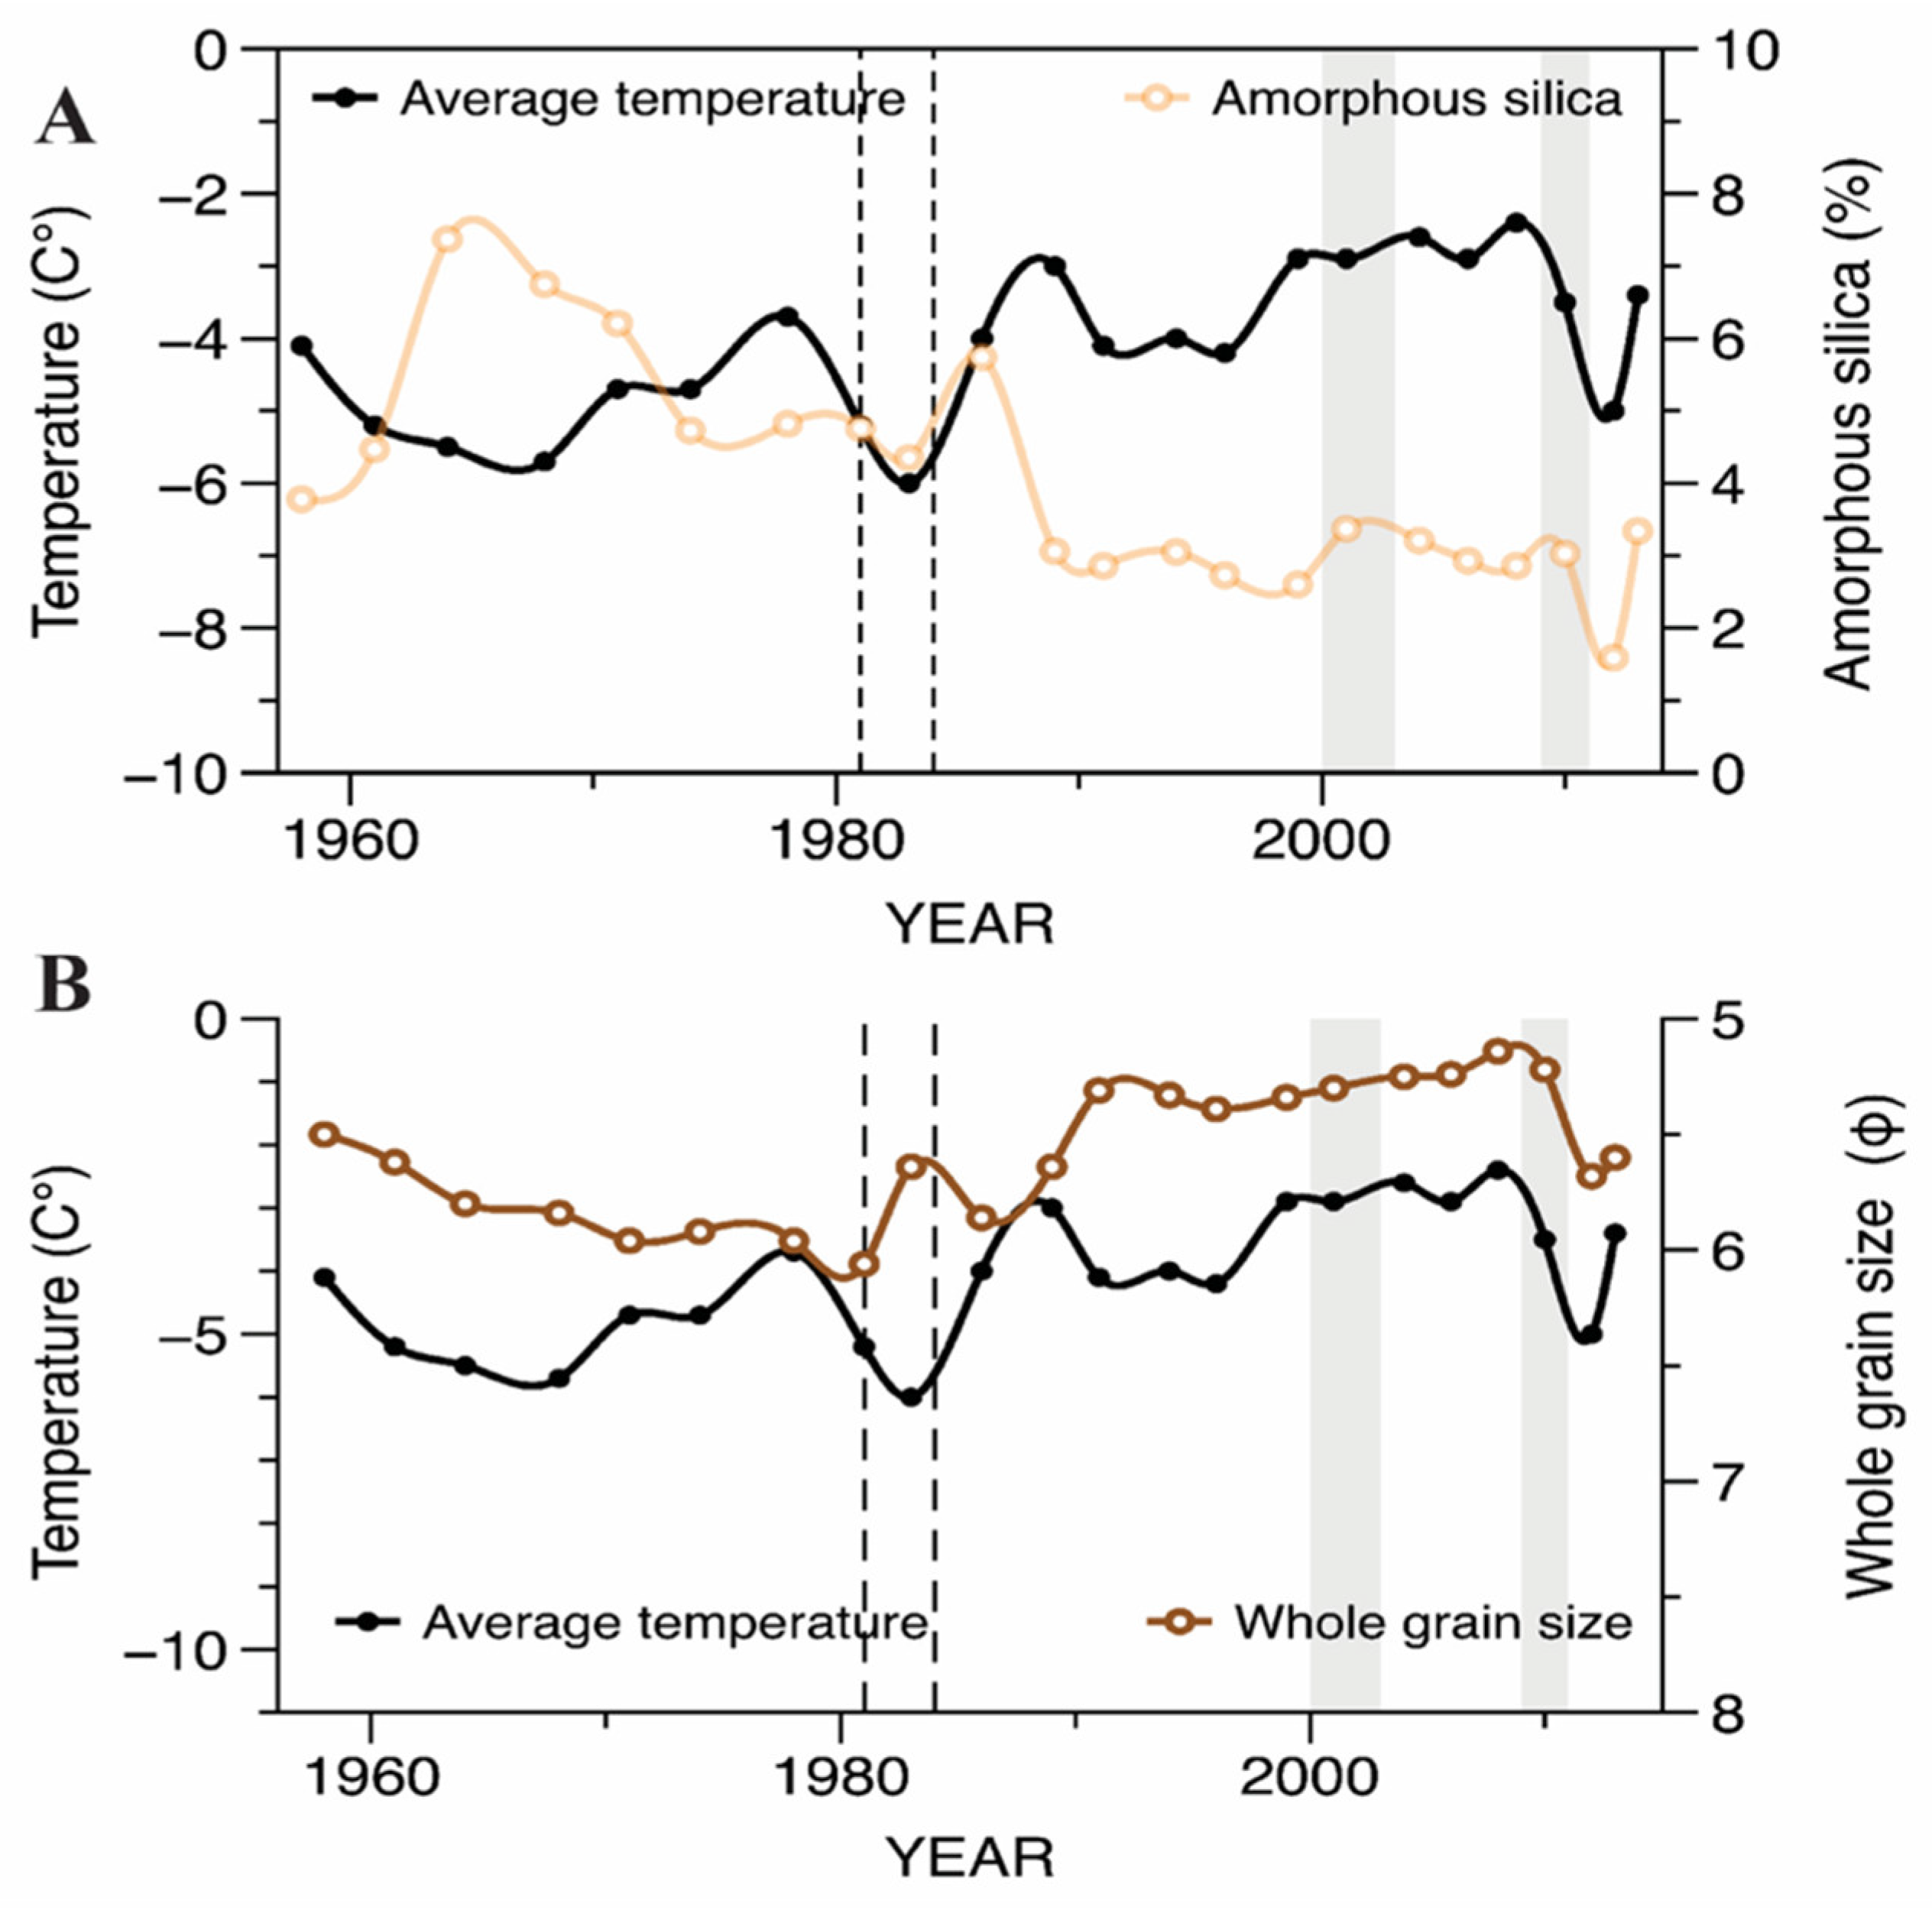
4.5. Comparison between Sediment Characteristics and Meteorological Data by Principal Component Analysis
5. Discussions
5.1. Authegenic Mineral Formation
5.2. Impact of Climate Factors on the Lake-Level Fluctuation
5.3. Wind-Blown Input
5.4. Event Fingerprint
5.5. Summary: Proxy of Climate
5.6. Reconstruction of Past Climate beyond the Observation Era
6. Conclusions
Author Contributions
Funding
Institutional Review Board Statement
Informed Consent Statement
Data Availability Statement
Acknowledgments
Conflicts of Interest
References
- Batima, P.; Natsagdorj, L.; Gombluudev, P.; Erdenetsetseg, B. Observed Climate Change in Mongolia. AIACC Work. Pap. 2005, 12, 1–26. [Google Scholar] [CrossRef] [Green Version]
- Nandintsetseg, B.; Greene, J.S.; Goulden, C.E. Trends in extreme daily precipitation and temperature near lake Hövsgöl, Mongolia. Int. J. Climatol. 2007, 27, 341–347. [Google Scholar] [CrossRef]
- Templer, G.; Swift, J.; Payne, P. The changing significance of risk in the Mongolian pastoral economy. Nomadic Peoples 1993, 33, 105–122. [Google Scholar]
- Begzsuren, S.; Ellis, J.E.; Ojima, D.S.; Coughenour, M.B.; Chuluun, T. Livestock responses to droughts and severe winter weather in the Gobi Three Beauty National Park, Mongolia. J. Arid Environ. 2004, 59, 785–796. [Google Scholar] [CrossRef]
- Batjargal, Z. Desertification in Mongolia. RALA Rep. 1997, 200, 107–113. [Google Scholar]
- Dashnyam, N. Sustainable livestock development in Mongolia. Int. Rev. Environ. Strateg. 2003, 4, 287–296. [Google Scholar]
- Nandintsetseg, B.; Shinoda, M.; Erdenetsetseg, B. Contributions of multiple climate hazards and overgrazing to the 2009/2010 winter disaster in Mongolia. Nat. Hazards 2018, 92, 109–126. [Google Scholar] [CrossRef]
- Lehmkuhl, F.; Grunert, J.; Hülle, D.; Batkhishig, O.; Stauch, G. Paleolakes in the Gobi region of southern Mongolia. Quat. Sci. Rev. 2018, 179, 1–23. [Google Scholar] [CrossRef]
- Ochiai, S.; Kashiwaya, K. Climato-hydrological environment inferred from Lake Baikal sediments based on an automatic orbitally tuned age model. J. Paleolimnol. 2005, 33, 303–311. [Google Scholar] [CrossRef]
- Antipin, V.; Afonina, T.; Badalov, O.; Bezrukova, E.; Bukharov, A.; Bychinsky, V.; Dmitriev, A.A.; Dorofeeva, R.; Duchkov, A.; Esipko, O.; et al. The new BDP-98 600-m drill core from Lake Baikal: A key late Cenozoic sedimentary section in continental Asia. Quat. Int. 2001, 81, 19–36. [Google Scholar] [CrossRef]
- Bezrukova, E.; Letunova, P.; Bukharov, A.; Bychinsky, V.; Gelety, V.; Goreglyad, A.; Gvozdkov, A.; Ivanov, E.; Kalmychkov, G.; Kerber, E.; et al. A new Quaternary record of regional tectonic, sedimentation and paleoclimate changes from drill core BDP-99 at Posolskaya Bank, Lake Baikal. Quat. Int. 2005, 136, 105–121. [Google Scholar] [CrossRef]
- Kashiwaya, K.; Ochiai, S.; Sumino, G.; Tsukamoto, T.; Szyniszewska, A.; Yamamoto, M.; Sakaguchi, A.; Hasebe, N.; Sakai, H.; Watanabe, T.; et al. Climato-hydrological fluctuations printed in long lacustrine records in Lake Hovsgol, Mongolia. Quat. Int. 2010, 219, 178–187. [Google Scholar] [CrossRef]
- Klinge, M.; Sauer, D. Spatial pattern of Late Glacial and Holocene climatic and environmental development in Western Mongolia—A critical review and synthesis. Quat. Sci. Rev. 2019, 210, 26–50. [Google Scholar] [CrossRef]
- Baljinnyam, I.; Bayasgalan, A.; Borisov, B.A.; Cisternas, A.E.; Dem yanovich, M.G.; Ganbaatar, L.; Kochetkov, V.; Kurushin, R.A.; Molnar, P.; Philip, H.; et al. Ruptures of Major Earthquakes and Active Deformation in Mongolia and Its Surroundings; Geological Society of America: Boulder, CO, USA, 1993. [Google Scholar]
- Erdenetsogt, B.O.; Lee, I.; Bat-Erdene, D.; Jargal, L. Mongolian coal-bearing basins: Geological settings, coal characteristics, distribution, and resources. Int. J. Coal Geol. 2009, 80, 87–104. [Google Scholar] [CrossRef]
- Badarch, G.; Dickson Cunningham, W.; Windley, B.F. A new terrane subdivision for Mongolia: Implications for the Phanerozoic crustal growth of Central Asia. J. Asian Earth Sci. 2002, 21, 87–110. [Google Scholar] [CrossRef]
- Owen, L.A.; Cunningham, D.; Richards, B.W.M.; Rhodes, E.; Windley, B.F.; Dorjnamjaa, D.; Badamgarav, J. Timing of formation of forebergs in the northeastern Gobi Altai, Mongolia: Implications for estimating mountain uplift rates and earthquake recurrence intervals. J. Geol. Soc. 1999, 156, 457–464. [Google Scholar] [CrossRef]
- Komatsu, G.; Brantingham, P.J.; Olsen, J.W.; Baker, V.R. Paleoshoreline geomorphology of Böön Tsagaan Nuur, Tsagaan Nuur and Orog Nuur: The Valley of Lakes, Mongolia. Geomorphology 2001, 39, 83–98. [Google Scholar] [CrossRef]
- Lehmkuhl, F.; Lang, A. Geomorphological investigations and luminescence dating in the southern part of Khangay and the Valley of the Gobi Lakes (Central Mongolia). J. Quat. Sci. 2001, 16, 69–87. [Google Scholar] [CrossRef]
- Geological Survey, Mineral Resouces Authority of Mongolia; Institute of Geology and Mineral Resources, Mongolian Academy of Science. Geological Map of Mongolia; Mongolian Academy of Science: Ulaanbaatar, Mongolia, 1998. [Google Scholar]
- Tserensodnom, J. Cataologue of Mongolian Lakes; Shuvuun saaral: Ulaanbaatar, Mongolia, 2000. [Google Scholar]
- Rother, H.; Lehmkuhl, F.; Fink, D.; Nottebaum, V. Surface exposure dating reveals MIS-3 glacial maximum in the Khangai Mountains of Mongolia. Quat. Res. 2014, 82, 297–308. [Google Scholar] [CrossRef]
- Guy, A.; Schulmann, K.; Soejono, I.; Holzrichter, N.; Lexa, O.; Munschy, M. Structures and geodynamics of the Mongolian tract of the Central Asian Orogenic Belt constrained by potential field analyses. Gondwana Res. 2021, 92, 26–53. [Google Scholar] [CrossRef]
- Szumińska, D. Changes in surface area of the Böön Tsagaan and Orog lakes (Mongolia, Valley of the Lakes, 1974–2013) compared to climate and permafrost changes. Sediment. Geol. 2016, 340, 62–73. [Google Scholar] [CrossRef]
- Yu, K.; Lehmkuhl, F.; Diekmann, B.; Zeeden, C.; Nottebaum, V.; Stauch, G. Geochemical imprints of coupled paleoenvironmental and provenance change in the lacustrine sequence of Orog Nuur, Gobi Desert of Mongolia. J. Paleolimnol. 2017, 58, 511–532. [Google Scholar] [CrossRef]
- Lehmkuhl, F.; Nottebaum, V.; Hülle, D. Aspects of late Quaternary geomorphological development in the Khangai Mountains and the Gobi Altai Mountains (Mongolia). Geomorphology 2018, 312, 24–39. [Google Scholar] [CrossRef]
- van der Wal, J.L.N.; Nottebaum, V.C.; Stauch, G.; Binnie, S.A.; Batkhishig, O.; Lehmkuhl, F.; Reicherter, K. Geomorphological Evidence of Active Faulting in Low Seismicity Regions—Examples From the Valley of Gobi Lakes, Southern Mongolia. Front. Earth Sci. 2021, 8, 1–17. [Google Scholar] [CrossRef]
- Nottebaum, V.; Stauch, G.; van der Wal, J.L.N.; Zander, A.; Schlütz, F.; Shumilovskikh, L.; Reicherter, K.; Batkhishig, O.; Lehmkuhl, F. Late Quaternary landscape evolution and paleoenvironmental implications from multiple geomorphic dryland systems, Orog Nuur Basin, Mongolia. Earth Surf. Processes Landf. 2021, 1–23. [Google Scholar] [CrossRef]
- Rizza, M.; Ritz, J.F.; Prentice, C.; Vassallo, R.; Braucher, R.; Larroque, C.; Arzhannikova, A.; Arzhannikov, S.; Mahan, S.; Massault, M.; et al. Earthquake geology of the Bulnay fault (Mongolia). Bull. Seismol. Soc. Am. 2015, 105, 72–93. [Google Scholar] [CrossRef] [Green Version]
- Rizza, M.; Ritz, J.F.; Braucher, R.; Vassallo, R.; Prentice, C.; Mahan, S.; McGill, S.; Chauvet, A.; Marco, S.; Todbileg, M.; et al. Slip rate and slip magnitudes of past earthquakes along the Bogd left-lateral strike-slip fault (Mongolia). Geophys. J. Int. 2011, 186, 897–927. [Google Scholar] [CrossRef] [Green Version]
- Johnson, D.; Sheehy, D.; Miller, D.; Damiran, D. Mongolian rangelands in transition. Secheresse 2006, 17, 133–141. [Google Scholar]
- Ulziikhutag, N. Review of the Flora of Mongolia; Mongolian Academy of Science: Ulaanbaatar, Mongolia, 1989; pp. 3–90. [Google Scholar]
- Walther, M.; Enkhjargal, V.; Gegeensuvd, T.; Odbaatar, E.; Walther, M. Environmental Changes of Orog Nuur (Bayan Khongor Aimag, South Mongolia) Lake Deposits, Paleo-Shorelines and Vegetation History. Erforsch. Biol. Ress. Mong. 2016, 160, 2016–2037. [Google Scholar]
- Davaa, G. Surface Water Resources Assessment, Integrated Water Management National Assessment Report 1; Minstry of Nature Environment and Green Development: Ulaanbaatar, Mongolia, 2012; pp. 9–75.
- Walther, M. Palaeoklimatische Untersuchungen zur jungpleistozaenen Landschaftsentwikclung im Khangai-Bergland und in der nördlichen Gobi (Mongolei). Petermanns Geogr. Mitt. 1998, 142, 207–217. [Google Scholar]
- Kang, S.; Hong, S.Y. Assessing Seasonal and Inter-Annual Variations of Lake Surface Areas in Mongolia during 2000–2011 Using Minimum Composite MODIS NDVI. PLoS ONE 2016, 11, e0151395. [Google Scholar] [CrossRef] [PubMed] [Green Version]
- Szopińska, M.; Dymerski, T.; Polkowska, Ż.; Szumińska, D.; Wolska, L. The chemistry of river–lake systems in the context of permafrost occurrence (Mongolia, Valley of the Lakes) Part II. Spatial trends and possible sources of organic composition. Sediment. Geol. 2016, 340, 84–95. [Google Scholar] [CrossRef]
- Chen, F.; Qiang, M.; Zhou, A.; Xiao, S.; Chen, J.; Sun, D. A 2000-year dust storm record from Lake Sugan in the dust source area of arid China. J. Geophys. Res. Atmos. 2013, 118, 2149–2160. [Google Scholar] [CrossRef]
- Carter, S.J.; Colman, S.M. Biogenic Silica in Lake Baikal Sediments: Results From 1990–1992 American Cores. J. Great Lakes Res. 1994, 20, 751–760. [Google Scholar] [CrossRef]
- Conley, D.J.; Schelske, C.L. Biogenic Silica. In Tracking Environmental Change Using Lake Sediments; Springer: Dordrecht, The Neatherlands, 2002; pp. 281–293. [Google Scholar] [CrossRef]
- Liu, B.; Xu, H.; Lan, J.; Sheng, E.; Che, S.; Zhou, X. Biogenic silica contents of Lake Qinghai sediments and its environmental significance. Front. Earth Sci. 2014, 8, 573–581. [Google Scholar] [CrossRef]
- Edlund, M.B.; Shinneman, A.L.C.; Nergui, S. Diatoms (Bacillariophyceae) from the Valley of the Great Lakes in Western Mongolia. Mong. J. Biol. Sci. 2010, 8, 17–26. [Google Scholar] [CrossRef]
- Conley, D.J.; Struyf, E. Silica. In Encycropedia of Inland Waters; Academic Press: Oxford, UK, 2009; pp. 85–88. ISBN 978-0-12-370626-3. [Google Scholar]
- Mortlock, R.A.; Froelich, P.N. A simple method for the rapid determination of biogenic opal in pelagic marine sediments. Deep Sea Res. Part A Oceanogr. Res. Pap. 1989, 36, 1415–1426. [Google Scholar] [CrossRef]
- Lima, A.L.; Hubeny, J.B.; Reddy, C.M.; King, J.W.; Hughen, K.A.; Eglinton, T.I. High-resolution historical records from Pettaquamscutt River basin sediments: 1.210 Pb and varve chronologies validate record of137Cs released by the Chernobyl accident. Geochim. Cosmochim. Acta 2005, 69, 1803–1812. [Google Scholar] [CrossRef]
- Robbins, J.A.; Edgington, D.N. Determination of recent sedimentation rates in Lake Michigan using Pb-210 and Cs-137. Geochim. Cosmochim. Acta 1975, 39, 285–304. [Google Scholar] [CrossRef] [Green Version]
- Lê, S.; Josse, J.; Husson, F. FactoMineR: An R package for multivariate analysis. J. Stat. Softw. 2008, 25, 1–18. [Google Scholar] [CrossRef] [Green Version]
- Yang, H.; Lee, E.; Do, N.; Ko, D.; Kang, S. Seasonal and Inter-annual Variations of Lake Surface Area of Orog Lake in Gobi, Mongolia During 2000–2010. Korean J. Remote Sens. 2012, 28, 267–276. [Google Scholar] [CrossRef]
- Fukushi, K.; Munemoto, T.; Sakai, M.; Yagi, S. Monohydrocalcite: A promising remediation material for hazardous anions. Sci. Technol. Adv. Mater. 2011, 12, 064702. [Google Scholar] [CrossRef] [PubMed]
- Last, W. Geolimnology of salt lakes. Geosci. J. 2002, 6, 347–369. [Google Scholar] [CrossRef]
- Cohen, A.S. Paleolimnology: The History and Evolution of Lake Systems; Oxford University Press: New York, NY, USA, 2003; ISBN 0195133536. [Google Scholar]
- Keisuke Fukushi, H.M. Control of Water Chemistry in Alkaline Lakes: Solubility of Monohydrocalcite and Amorphous Magnesium Carbonate in CaCl2–MgCl2–Na2CO3 Solutions. ACS Earth Space Chem. 2018, 2, 735–744. [Google Scholar] [CrossRef]
- Yagi, S.; Fukushi, K. Removal of phosphate from solution by adsorption and precipitation of calcium phosphate onto monohydrocalcite. J. Colloid Interface Sci. 2012, 384, 128–136. [Google Scholar] [CrossRef] [PubMed]
- Fukushi, K.; Imai, E.; Sekine, Y.; Kitajima, T.; Gankhurel, B.; Davaasuren, D.; Hasebe, N. In Situ Formation of Monohydrocalcite in Alkaline Saline Lakes of the Valley of Gobi Lakes: Prediction for Mg, Ca, and Total Dissolved Carbonate Concentrations in Enceladus’ Ocean and Alkaline-Carbonate Ocean Worlds. Minerals 2020, 10, 669. [Google Scholar] [CrossRef]
- Sellwood, B. Applied sedimentology. Mar. Pet. Geol. 1990, 7, 197. [Google Scholar] [CrossRef]
- Maasri, A.; Gelhaus, J. The new era of the livestock production in Mongolia: Consequences on streams of the Great Lakes Depression. Sci. Total Environ. 2011, 409, 4841–4846. [Google Scholar] [CrossRef]
- Dana, G.L.; Lenz, P.H. Effects of increasing salinity on an Artemia population from Mono Lake, California. Oecologia 1986, 68, 428–436. [Google Scholar] [CrossRef]
- Aladin, N.V.; Potts, W.T.W. Changes in the Aral Sea ecosystems during the period 1960-1990. Hydrobiologia 1992, 237, 67–79. [Google Scholar] [CrossRef]
- Wen, Z.; Zheng, M.-P.; Xu, X.-Z.; Liu, X.-F.; Guo, G.-L.; He, Z.-H. Biological and ecological features of saline lakes in northern Tibet, China. Hydrobiologia 2005, 541, 189–203. [Google Scholar] [CrossRef]
- Williams, W.D. Salinity as a determinant of the structure of biological communities in salt lakes. Hydrobiologia 1998, 381, 191–201. [Google Scholar] [CrossRef]
- Harrison, S.; Kohfeld, K.; Roelandt, C.; Claquin, T. The role of dust in climate changes today, at the Last Glacial Maximum and in the future. Earth-Sci. Rev. 2001, 54, 43–80. [Google Scholar] [CrossRef]
- An, C.-B.; Zhao, J.; Tao, S.; Lv, Y.; Dong, W.; Li, H.; Jin, M.; Wang, Z. Dust variation recorded by lacustrine sediments from arid Central Asia since ~15 cal ka BP and its implication for atmospheric circulation. Quat. Res. 2011, 75, 566–573. [Google Scholar] [CrossRef]
- Rydberg, J.; Lindborg, T.; Sohlenius, G.; Reuss, N.; Olsen, J.; Laudon, H. The Importance of Eolian Input on Lake-Sediment Geochemical Composition in the Dry Proglacial Landscape of Western Greenland. Arct. Antarct. Alp. Res. 2016, 48, 93–109. [Google Scholar] [CrossRef] [Green Version]
- Kobashi, T.; Box, J.E.; Vinther, B.M.; Goto-Azuma, K.; Blunier, T.; White, J.W.C.; Nakaegawa, T.; Andresen, C.S. Modern solar maximum forced late twentieth century Greenland cooling. Geophys. Res. Lett. 2015, 42, 5992–5999. [Google Scholar] [CrossRef] [Green Version]


| Lake Name | Core Name | Core Length | Water Depth | Latitude | Longitude |
|---|---|---|---|---|---|
| Olgoy | OL02 | 43 cm | 1 m | 46°33′07.72″ N | 100°05′38.88″ E |
| Orog | OR02 | 43 cm | 1 m | 45°03′17.60″ N | 100°37′40.87″ E |
| Boontsagaan | BTS01 | 31 cm | 9.7 m | 45°36′17.20″ N | 099°13′11.80″ E |
| Boontsagaan | BTS02 | 31 cm | 10 m | 45°36′19.50″ N | 099°12′28.90″ E |
| Sample ID | Core Depth (cm) | Mass Depth (g/cm2) | 210Pbex (Bq/kg) | Apparent Age (a) | 210Pbex Error (%) |
|---|---|---|---|---|---|
| Olgoy 01 | 0.5 | 0.1 | 150 | 0.5 | 10.6 |
| Olgoy 05 | 4.5 | 1.3 | 113 | 9.5 | 14.2 |
| Olgoy 10 | 9.5 | 4.6 | 89 | 17.1 | 14.8 |
| Olgoy 15 | 14.5 | 7.0 | 185 | - | 12 |
| Olgoy 20 | 19.5 | 11.3 | 37 | 45.1 | 10.8 |
| Olgoy 25 | 24.5 | 15.2 | 16 | 72.3 | 16.6 |
| Olgoy 30 | 29.5 | 18.7 | 13 | 79.6 | 16.6 |
| Olgoy 35 | 34.5 | 23.7 | - | - | 13 |
| Olgoy 40 | 39.5 | 26.7 | 24 | 59.4 | 17 |
| BT02 01 | 0.5 | 0.2 | 222 | 2.5 | 11.41 |
| BT02 03 | 1.5 | 0.7 | 208 | 4.6 | 9.43 |
| BT02 05 | 2.5 | 1.1 | 203 | 5.4 | 9.5 |
| BT02 07 | 3.5 | 1.4 | 195 | 6.7 | 9.03 |
| BT02 09 | 4.5 | 1.7 | 168 | 11.5 | 10.5 |
| BT02 11 | 5.5 | 2.1 | 170 | 11.1 | 10.54 |
| BT0213 | 6.5 | 2.4 | 138 | 17.8 | 12.86 |
| BT02 17 | 8.5 | 3.2 | 132 | 19.2 | 14.12 |
| BT02 21 | 10.5 | 4.0 | 127 | 20.5 | 15.45 |
| BT02 35 | 17.5 | 6.8 | 80 | 35.3 | 20.31 |
| BT02 41 | 20.5 | 8.3 | 63 | 43.0 | 28.72 |
| BT02 45 | 22.5 | 9.6 | 60 | 44.6 | 26.81 |
| BT02 55 | 27.5 | 16.0 | 29 | 68.0 | 79.56 |
| Orog 01 | 0.5 | 0.3 | 128 | 0.0 | 15.5 |
| Orog 03 | 3.5 | 2.7 | 58 | 25.4 | 20.2 |
| Orog 05 | 5.5 | 3.5 | 52 | 28.8 | 13 |
| Orog 10 | 10.5 | 9.8 | 35 | 41.7 | 16.1 |
| Orog 13 | 13.5 | 13.8 | 37 | 40.1 | 23.3 |
| Orog 15 | 15.5 | 17.7 | 11 | 77.6 | 23.5 |
| Orog 18 | 18.5 | 21.5 | 20 | 59.9 | 24.3 |
| Orog 20 | 20.5 | 24.2 | 30 | 46.9 | 22.8 |
| Orog 23 | 23.5 | 28.5 | 17 | 65.9 | 23.8 |
| Orog 25 | 25.5 | 31.3 | 5 | 101.6 | 24.5 |
| Orog 30 | 30.5 | 36.9 | - | - | 24.6 |
| Orog 35 | 35.5 | 43.4 | 8 | 89.1 | 17.7 |
| Proxies | OLGOY | Proxies | BOONTSAGAAN | Proxies | OROG | |||||||||
|---|---|---|---|---|---|---|---|---|---|---|---|---|---|---|
| PC1 | PC2 | PC3 | Com | PC1 | PC2 | PC3 | Com | PC1 | PC2 | PC3 | Com | |||
| Water content | −0.4 | 0.7 | −0.3 | 2.0 | Water content | 0.8 | 0.2 | 0.4 | 1.5 | Water content | 0.4 | 0.9 | −0.1 | 1.4 |
| Grain density | - | 0.2 | 0.5 | 1.3 | Grain density | −0.7 | - | 0.3 | 1.3 | Grain density | −0.1 | −0.2 | 0.6 | 1.3 |
| Organic | −0.1 | 0.9 | 0.1 | 1.0 | Organic | −0.2 | 0.1 | 0.9 | 1.1 | Organic | 0.3 | 0.1 | −0.1 | 1.3 |
| Carbonate | 0.4 | −0.8 | −0.1 | 1.5 | Carbonate | −0.2 | −0.1 | −0.9 | 1.1 | Carbonate | 0.9 | - | 0.2 | 1.1 |
| Amorphous silica | 0.7 | −0.4 | 0.2 | 1.7 | Amorphous silica | −0.3 | 0.2 | −0.7 | 1.5 | Amorphous silica | 0.9 | 0.3 | 0.1 | 1.2 |
| Whole grain size | 0.9 | −0.1 | 0.1 | 1.0 | Whole grain size | −0.6 | 0.4 | −0.3 | 2.3 | Whole grain size | 0.9 | −0.1 | −0.1 | 1.1 |
| Mineral grain size | 0.8 | −0.1 | - | 1.0 | Mineral grain size | −1.0 | −0.1 | - | 1.0 | Mineral grain size | 0.8 | −0.2 | - | 1.1 |
| Galuut temp | −0.8 | 0.2 | −0.1 | 1.2 | Galuut temp | 0.1 | −0.9 | 0.2 | 1.2 | BKH temp | −0.3 | 0.9 | - | 1.2 |
| Galuut wind | 0.1 | 0.3 | −0.8 | 1.4 | Galuut wind | 0.9 | −0.1 | 0.2 | 1.1 | BKH wind | 0.2 | 0.8 | −0.1 | 1.2 |
| Galuut prec | 0.3 | - | 0.7 | 1.4 | Galuut prec | 0.3 | 0.9 | - | 1.2 | BKH prec | 0.3 | −0.1 | 0.8 | 1.2 |
| Baidrag temp | 0.2 | −0.9 | −0.1 | 1.1 | Jinst temp | −0.1 | 0.9 | −0.3 | 1.3 | |||||
| Baidrag wind | 0.8 | - | - | 1.0 | Jinst wind | 0.4 | 0.3 | −0.7 | 2.1 | |||||
| Baidrag prec | 0.0 | 0.7 | 0.6 | 1.9 | Jinst prec | 0.1 | −0.1 | 0.9 | 1.0 | |||||
| SS loadings | 3.1 | 2.4 | 1.5 | SS loadings | 4.2 | 3.1 | 2.7 | SS loadings | 3.6 | 3.2 | 2.6 | |||
| Proportion var | 0.3 | 0.2 | 0.2 | Proportion var | 0.3 | 0.2 | 0.2 | Proportion var | 0.3 | 0.3 | 0.2 | |||
| Cumulative var | 0.3 | 0.6 | 0.7 | Cumulative var | 0.3 | 0.6 | 0.8 | Cumulative var | 0.3 | 0.5 | 0.7 | |||
| Proportion explain | 0.5 | 0.3 | 0.2 | Proportion explain | 0.4 | 0.3 | 0.3 | Proportion explain | 0.4 | 0.3 | 0.3 | |||
| Cumulative proportions | 0.5 | 0.8 | 1.0 | Cumulative proportions | 0.4 | 0.7 | 1.0 | Cumulative proportions | 0.4 | 0.7 | 1.0 | |||
Publisher’s Note: MDPI stays neutral with regard to jurisdictional claims in published maps and institutional affiliations. |
© 2021 by the authors. Licensee MDPI, Basel, Switzerland. This article is an open access article distributed under the terms and conditions of the Creative Commons Attribution (CC BY) license (https://creativecommons.org/licenses/by/4.0/).
Share and Cite
Udaanjargal, U.; Hasebe, N.; Davaasuren, D.; Fukushi, K.; Tanaka, Y.; Gankhurel, B.; Katsuta, N.; Ochiai, S.; Miyata, Y.; Gerelmaa, T. Characteristics of Lake Sediment from Southwestern Mongolia and Comparison with Meteorological Data. Geosciences 2022, 12, 7. https://doi.org/10.3390/geosciences12010007
Udaanjargal U, Hasebe N, Davaasuren D, Fukushi K, Tanaka Y, Gankhurel B, Katsuta N, Ochiai S, Miyata Y, Gerelmaa T. Characteristics of Lake Sediment from Southwestern Mongolia and Comparison with Meteorological Data. Geosciences. 2022; 12(1):7. https://doi.org/10.3390/geosciences12010007
Chicago/Turabian StyleUdaanjargal, Uyangaa, Noriko Hasebe, Davaadorj Davaasuren, Keisuke Fukushi, Yukiya Tanaka, Baasansuren Gankhurel, Nagayoshi Katsuta, Shinya Ochiai, Yoshiki Miyata, and Tuvshin Gerelmaa. 2022. "Characteristics of Lake Sediment from Southwestern Mongolia and Comparison with Meteorological Data" Geosciences 12, no. 1: 7. https://doi.org/10.3390/geosciences12010007
APA StyleUdaanjargal, U., Hasebe, N., Davaasuren, D., Fukushi, K., Tanaka, Y., Gankhurel, B., Katsuta, N., Ochiai, S., Miyata, Y., & Gerelmaa, T. (2022). Characteristics of Lake Sediment from Southwestern Mongolia and Comparison with Meteorological Data. Geosciences, 12(1), 7. https://doi.org/10.3390/geosciences12010007