Abstract
On 27 September 2021, a shallow earthquake with focal depth of 10 km and moment magnitude Mw6.0 occurred onshore in central Crete (Greece). The evolution of possible preseismic patterns in the area of central Crete before the Mw6.0 event was investigated by applying the method of multiresolution wavelet analysis (MRWA), along with that of natural time (NT). The monitoring of preseismic patterns by critical parameters defined by NT analysis, integrated with the results of MRWA as the initiation point for the NT analysis, forms a promising framework that may lead to new universal principles that describe the evolution patterns before strong earthquakes. Initially, we apply MRWA to the interevent time series of the successive regional earthquakes in order to investigate the approach of the regional seismicity towards critical stages and to define the starting point of the natural time domain. Then, using the results of MRWA, we apply the NT analysis, showing that the regional seismicity approached criticality for a prolonged period of ~40 days before the occurrence of the Mw6.0 earthquake, when the κ1 natural time parameter reached the critical value of κ1 = 0.070, as suggested by the NT method.
1. Introduction
On 27 September 2021, a strong Mw6.0 earthquake occurred onshore in central Crete (Greece), in close proximity to the city of Heraklion (Figure 1). The mainshock occurred in the vicinity of the Arkalochori town and was widely felt in Crete and the surrounding islands. The earthquake caused one casualty, several injuries and extensive structural damage to the surrounding villages. The strongest aftershock in the sequence, with local magnitude 5.2, occurred within the first 24 h, while there were eleven aftershocks with magnitude greater than ML4.0.
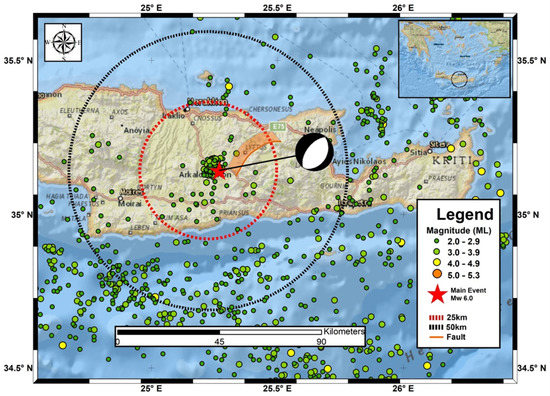
Figure 1.
The observed seismicity in the central Crete region between 15 September 2017 and 27 September 2021. The mainshock is denoted with a red star, while earthquakes with threshold magnitude Mth = 2.0 are represented with circles in different color and size. The two circles with radius 25 and 50 km are noted with red and black dashed lines, respectively. The focal mechanism of the mainshock as estimated by GFZ is presented (see text for details).
Crete is located at the front of the Hellenic Island arc (Figure 1) and is an area of important tectonic deformation and high seismic activity, as a result of the collision between the Eurasian and African plates [1,2]. The Mediterranean seafloor subducts northwards beneath Crete at a rate of 35 mm/y, which greatly exceeds the convergence between Africa and Eurasia (5–10 mm/y) due to the rapid SW motion of the southern Aegean itself, relative to Eurasia [1,3]. The dominant horizontal and vertical movements construct a complex fault tectonic structure driven by the presence of both extensional and compressional stress regimes in the area [4,5]. A study on shallow normal fault earthquakes shows that there are two extensional stress regimes trending NE–SW and NW–SE in the Hellenic Arc [4,6]. In [7], focal mechanisms and GPS velocities showed that Nubia–Aegean convergence was accommodated by shallowly dipping thrust faulting along the subduction interface, as well as by steeper splay faults in the overriding material.
In the onshore central Crete region, there are two large tectonic features, the northern Heraklion and the southwest Messara tectonic grabens, shaped by fault zones with an average NE-SW direction [1,2,5]. The Heraklion graben is bounded by the Ida Mountain in the west and the Dictea mountain to the east, along the Malevizi and Kasteli fault zones, respectively. The fault zones in central Crete can be divided into four distinguished groups. The first group has faults cutting the basement rocks, or bound basement rocks and Miocene sediments with an E-W direction, while the second one comprises with large and moderated scale faults cutting the previous mentioned formations with N-S angles. The third and fourth groups are focused on faults with a NE-SW and NW-SE strike, respectively, which appear to be the youngest faults occurring on Crete Island [2,5,8,9]. Recent results suggest that the fault length distribution in the area of central Crete presents a hierarchical pattern that follows a q-exponential distribution following the principles of non-extensive statistical physics [10].
The 27 September 2021 Mw6.0 ruptured zone has a NNE-SSW direction [11]. In the activated zone, the dominant features are NNE-SSW normal faults such as the well-known Kastelli Fault [12], with code GRCS743 in the Greek Database of Seismogenic Sources [13] (http://gredass.unife.it/, accessed on 1 October 2021). The moment tensor solutions for the main event, obtained from several reporting agencies (see https://www.seismicportal.eu/mtws/, accessed on 1 October 2021), suggest that the activated fault was a normal fault with a NW median dip direction of about 54°, in agreement with [11,12,13]. The neotectonic Kastelli fault bounds to the northwest of the Dikti massif that consists of carbonate sediments and metamorphic terranes [9]. It is characterized by a 300-m-high major escarpment. Following [9], its strike progressively varies southwestwards from N80° E to N25° E, while dips 70–75° northwestwards with well-exposed dip-slip slicken lines with pitches of 85–115°, showing a 13 km long recent reactivation at the base of the mountain front, which corresponds to a maximum possible earthquake magnitude of M6.7 (see details in Table 1 of [9]). The maximum measured throw value affecting the Upper Pleistocene slope deposits is about 6 m. In the hanging wall, alluvial–colluvial deposits composed of unconsolidated conglomerates are present.
Strong arguments suggest that the earthquake generation process can be considered as a critical point phenomenon that culminates with a large event, which is the critical point [14,15,16,17,18,19,20,21,22,23,24]. New findings regarding the complex dynamics that characterize various geodynamic phenomena illustrate stimulating features in the framework of new concepts, such as that of non-extensive statistical physics [17,18,19,20,21,22,23,24], multiresolution wavelets analysis [25,26,27] and of the novel time domain, termed as natural time [22,23,28,29,30,31,32,33,34,35,36,37,38,39].
The concept of natural time (NT) has been introduced recently to analyze possible preseismic signals [28,29,34]. The analysis of various complex systems in the NT domain enables the optimal extraction of signal information by reducing the uncertainties related to the conventional time, as well as the identification of long-range correlations in the evolution of the system, even in the presence of “heavy tails” [29]. The usefulness of NT analysis has been discussed in a number of applications to known critical phenomena, such as fracturing, earthquakes, the 2-D Ising model and 3-D turbulent flow [35], and references therein, and it has been tested experimentally in fracturing experiments in the laboratory by analyzing acoustic emissions time series [22,40].
Furthermore, wavelet-based methods have been introduced to characterize fractal signals [41,42,43] and to overcome effects associated with non-stationarities [44,45], a very frequent effect in the time dynamics of an earthquake sequence.
The occurrence of a strong earthquake onshore in central Crete is rare in recent and historical earthquake catalogs, and this makes its study attractive. We note that, according to [9], the mean recurrence interval of Kastelli fault, for the last 13 ka, is estimated to about 812 years. The goal of the present work is to test and evaluate the seismicity patterns in terms of MRWA and NT analyses, as applied in the evolution of seismicity prior to the recent Mw6.0 central Crete strong event, recognizing the critical stages in earthquake preparation processes. More specifically, the initial application of MRWA in a broader time period reveals time segments where the NT analysis is then used to investigate for indicators suggesting the entrance to the critical stage prior to the Mw = 6.0 central Crete earthquake, integrated with the results of MRWA applied to the interevent time series of the successive events, in order to define, with an objective technique, the starting point for the analysis in the NT domain. We note that the first application of NT analysis on seismicity was based on the recognition of a Seismic Electrical Signal (SES) [34] that was used as the initial point for the application of NT analysis [34,36]. The description of seismicity evolution with the NT parameters, integrated with the results of MRWA, represents a novel framework is independent of the possible observation of an SES [34,36], since it is based only on a detailed recording of seismicity in the investigated region. The integration of these two methods may thus lead to a better understanding of the evolution of earthquake generation processes and to the recognition of the period where an activated fault zone is in the critical state.
2. Principles of Methodology Applied and Data Selection and Analysis
2.1. Data Selection
The upgrading of the regional seismological networks [46,47,48,49,50,51] provides complete spatial coverage in the broader area of Greece and an accurate catalog of microseismicity, with a magnitude of completeness (Mc) down to 2.0, in the studied area (see Figure 3 in [51]), enabling the application of such methodologies. The earthquake catalogs used herein are from the revised solutions reported by the Hellenic Unified Seismological Network [52]. Figure 1 presents the seismic activity observed in the region of central Crete for a period starting from 15 September 2017, approximately 1473 days before the 27 September 2021 mainshock. In the present work, MRWA and MT methods are applied to the seismicity data located within circled areas, with the mainshock’s epicenter as the center and for radii of 25 and 50 km and magnitude thresholds of 2.0, 2.5 and 3.0, respectively. In Figure 2, the time–magnitude plot for a radius of 25 and 50 km around the epicenter and magnitude thresholds, Mth = 2.0, Mth = 2.5 and Mth = 3.0, are presented. From the aforementioned catalog, six subcatalogs (SCx) according to selected magnitude threshold and epicentral radius were produced and presented in Table 1.
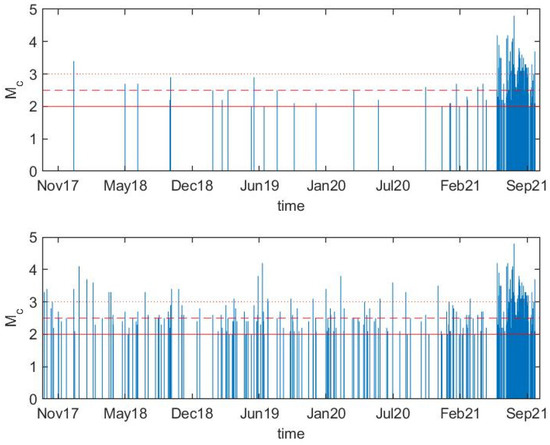
Figure 2.
Time–magnitude plot (from 15 September 2017 to 27 September 2021) for a radius of space 25 (top) and 50 km (bottom) around the epicenter. Horizontal lines delineate the three magnitude thresholds (Mth) used for the production of corresponding datasets: Mth = 2.0 (red solid line), Mth = 2.5 (red dashed line), Mth = 3.0 (red dotted line).

Table 1.
Characteristics of time–magnitude subcatalogs generated from seismic event catalog covering the period from 15 September 2017 to 27 September 2021.
2.2. Multiresolution Wavelets Analysis to the Seismicity of Central Crete
The temporal evolution of seismicity and the time-scaling properties are of crucial importance [53,54,55] for understanding the correlation properties of seismicity [56]. The analysis of time intervals between successive seismic events can be grouped in exponential or power laws revealing similar behaviors over different scales [57]. A detailed presentation is given in [27,58].
Following [27,58], the discrete wavelet transform (DWT) applied transforms a data vector of length M into a different vector of the same length. For a point process such as that of the interevent times sequence, the wavelet coefficients can be derived from
where the scale variable m and the translation variable n are integers, L represents the total number of interevent times ti analyzed and ψ is the wavelet function. We note that, as already pointed out in [27,58], smaller scales correspond to more rapid variations and, therefore, to higher frequencies.
Furthermore, as demonstrated in [27,58], the standard deviation of wavelet coefficients as a function of scale, as described from
analyzed, where N is the number of wavelet coefficients at a given scale m and the brackets indicate the average among the coefficients at a scale m.
For each one of the SCs presented in Table 1, we produce a corresponding dataset with interevent times between two successive events versus the occurrence time of the second event until the major seismic event. The number of produced datasets is 6 and the time period that was covered for MRWA of interevent times spanned from 15 September 2017 to 27 September 2021, when the main event of Mw6.0 occurred. The produced point-process datasets are presented in Figure 3 (datasets from SC1, SC2), Figure 4 (datasets from SC3, SC4) and Figure 5 (datasets from SC5, SC6).
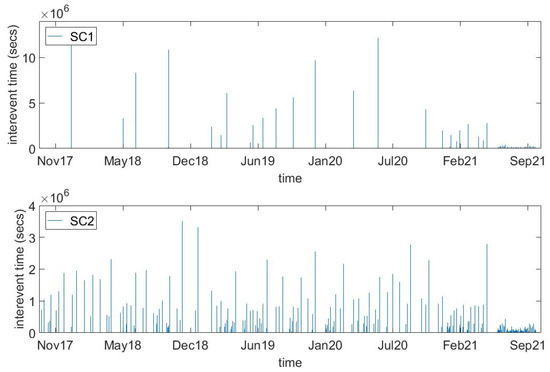
Figure 3.
Dataset with interevent times between two successive events versus occurrence time of each event for SC1 (top) and SC2 (bottom) subcatalogs (as defined in Table 1). Low amplitude interevent times before September 2021 dictate increased seismic activity.
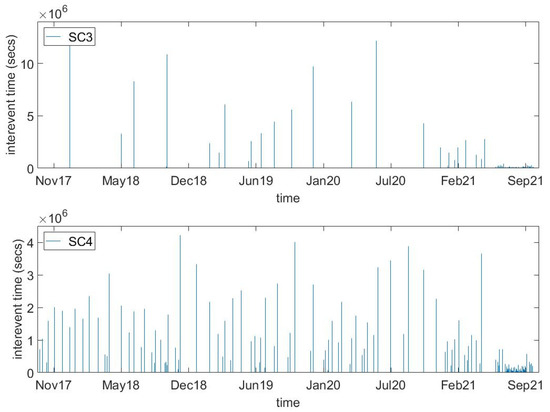
Figure 4.
Dataset with interevent times between two successive events versus occurrence time of each event for SC3 (top) and SC4 (bottom) subcatalogs (as defined in Table 1). Low amplitude interevent times before September 2021 dictate increased seismic activity.
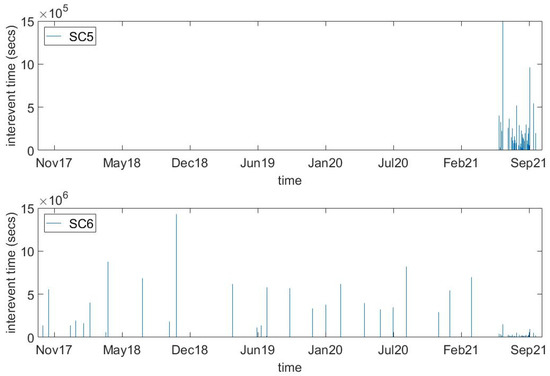
Figure 5.
Dataset with interevent times between two successive events versus occurrence time of each event for SC3 (top) and SC4 (bottom) subcatalogs (as defined in Table 1). For better depiction of the whole time series, we are starting from 2nd event of the catalog since the 1st interevent time between 1st and 2nd event produce two orders of magnitude higher value and thus suppresses the presentation of the last event of the catalog where smaller values exist.
The initial challenge in wavelet analysis is the selection of the wavelet basis function as well as the decomposition level of the signal. Since there is no standard procedure for basis selection, several approaches have been proposed: from general quantitative approaches (maximum cross correlation, distribution error, maximum information criterion extraction, maximizing Shannon entropy, variance correlation, energy preservation [59]) to dedicated ones [60]. All these proposals just re-validate that wavelet basis selection remains mainly an ad hoc problem. In the current study, the choice of wavelet basis is dictated by the requirement to identify a rather sharp change in a possible cyclic sequence. As a general rule, if we want to identify closely spaced features, wavelets with smaller support are more appropriate. The support of the wavelet should be small enough to separate the features of interest, since wavelet bases with larger support tend to fail to identify closely spaced features. Following the same pre-processing approach as in [26,27,58], we tested several small support wavelets (i.e., haar, db2, db3, sym2, sym3, coif2) at small scales up to m = 4 and received quite similar results. Thus, in the current work, we present results from the analysis using the db3 wavelet. Another reason for selecting small support wavelets is the limited number of available data. In agreement with results presented in [26,27], we investigated how interesting features in seismic catalogs regarding MRWA can be derived with a minimum set of 16 events in each moving window, along with at least 16 shifts of 2 events of this moving window. This led to a minimum required dataset of 48 events. We investigated how a dataset with fewer events cannot provide us a reliable indication of absolute minimum of σwav. Those values led to the selection of the magnitude thresholds that we are going to use, along with the epicenter area that we are interested in. In our study, the smaller dataset that we used is 70 events (Table 1).
Herein, the time evolution of the σwav(m) is investigated using fixed event number windows of 16 events shifting through the entire series, where the shift between successive windows was fixed in 4 events (3 in the case of Mth = 3.0 and R = 25 km due to limited number of events). Consistently, with the length of the time window, we analyzed the time variation of the σwav(m) for lower scales (m = 1 to 4) since the number of available events is limited. Each calculated value is associated with the time of the last event in the window. Figure 6, Figure 7 and Figure 8 shows a representative set of results for the time evolution of the σwav(m) using the db3 wavelet with four scales for MRWA, for the seismicity observed around the epicenter of the mainshock and within a radius of 25 and 50 km, respectively.
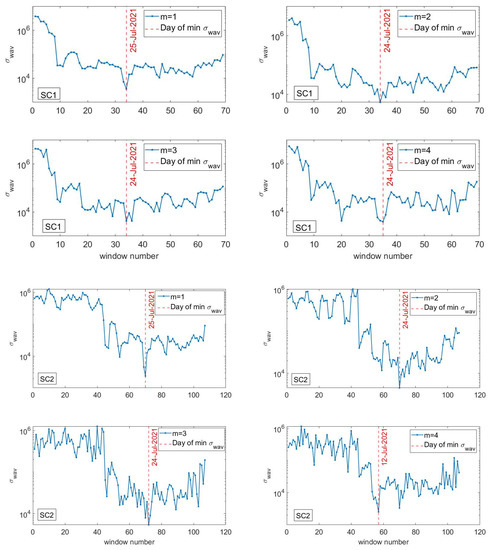
Figure 6.
Time variation of σwav(m) with scale m ranging from 1 up to 4, for moving windows with length of 16 events and a shift of 4 events within a magnitude threshold, Mth = 2.0 and radius R = 25 km (interevent times from SC1 subcatalog—top four plots) and 50 km (interevent times from SC2 subcatalog—bottom four plots) around the epicenter. Red vertical line indicates the day of minimum in variance, observed at each scale.
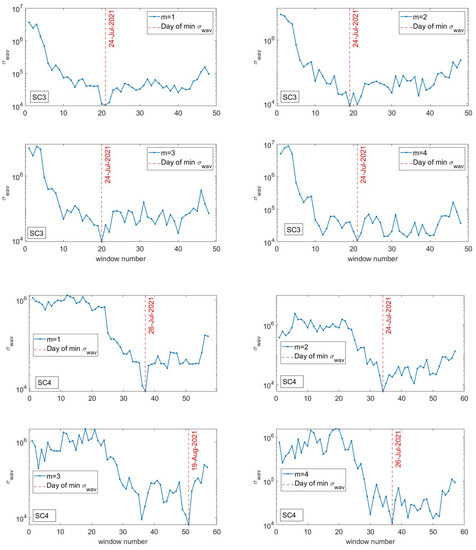
Figure 7.
Time variation of σwav(m) with scale m ranging from 1 up to 4, for moving windows with length of 16 events and a shift of 4 events within a magnitude threshold, Mth = 2.5 and radius R = 25 km (interevent times from SC3 subcatalog—top four plots) and 50 km (interevent times from SC4 subcatalog—bottom four plots) around the epicenter. Red vertical line indicates the day of minimum in variance, observed at each scale.
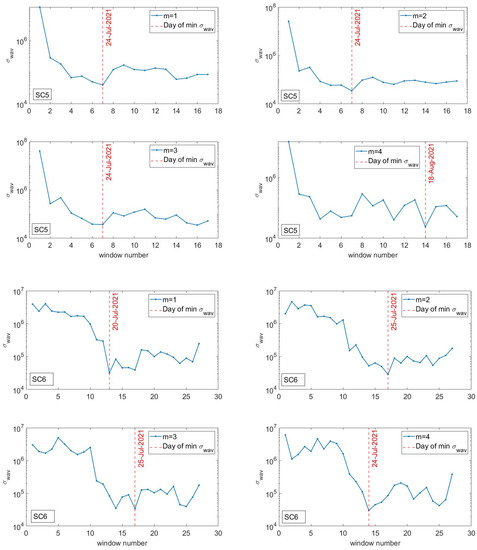
Figure 8.
Time variation of σwav(m) with scale m ranging from 1 up to 4, for moving windows with length of 16 events and a shift of 3 events within a magnitude threshold, Mth = 3.0 and radius R = 25 km (interevent times from SC5 subcatalog—top four plots) and 50 km (interevent times from SC6 subcatalog—bottom four plots) around the epicenter. Red vertical line indicates the day of minimum in variance, observed at each scale.
An initial comment from Figure 6 is the significant temporal variability in the strength of the multiscale properties of the interevent times. As observed in previous studies [26,27,58], before the major event of the seismic sequence, a significant decrease in the temporal evolution of the σwav, m(t) appeared, especially at lower scales. Plots in Figure 6, Figure 7 and Figure 8 dictate the search for a time marker beginning several weeks before the major event for all the scales analyzed. The sharp decrease, which is observed before the major event, can be qualified as such a time marker, since the decrease is evident for several days and is clearly identifiable. From Figure 6, which corresponds to Mth = 2.0, the candidate time marker is 24-July-2021, while for Mth = 2.5 (Figure 7) and Mth = 3.0 (Figure 8) the same time marker is the dominating one.
Translating the results from lower scales in an alternative way, we propose the use of the observed time marker of 24-July-2021, which appears several weeks before the major event, as the initiation point for the natural time analysis that follows. This lead time is consistent with the fact that, in natural time analysis of the magnitude time series, clear changes in the temporal correlations are observed a few months before major earthquakes in California and Japan by means of detrended fluctuation analysis [61,62,63].
2.3. Natural Time Analysis of Seismicity before the Central Crete Mw6.0 Earthquake
Here, we summarize the principles of Natural Time analysis (NT), as applied in the case of central Crete Mw6.0 preseismic pattern. The analysis of a complex system in the NT domain has been introduced in [28,34]. In the case of seismicity, the natural time χ, defined as , serves as an index for the occurrence of the kth event out of N total events. The seismic moment released during the kth event is then considered, forming the pair (χk, Mk) for further analysis (see [30]). The evolution of (χk, Mk) is further described by the continuous function F(ω), defined as:
where and stands for the natural frequency.
F(ω) is normalized by division with F(0)
where . The quantity pk describes the probability to observe an earthquake event at natural time χk. The normalized power spectrum can then be obtained from (4), as . In the context of probability theory, and for natural frequencies of less than 0.5, Π(ω) reduces to a characteristic function for the probability distribution pk. It has been shown that the following relation holds [22,27,30,31,32,33,34,35,36,37,38,62,63]
As presented in [28,34], for ω → 0, (4) leads to
where κ1 is the variance in natural time, given as
It has been shown that the properties of Π(ω) at ω → 0, i.e., the values of κ1 = 0.07, can signify the approach of a complex system toward some critical point [34], such as that of an impending large earthquake (see [31,37] and references therein). Theoretically, it has been shown that κ1 approaches 0.070 as N → ∞, when there are no long-ranged correlations in the system [34].
As a new event occurs, the pair (χk, pk) is rescaled and κ1 varies. It has been verified that when the parameter κ1 converges to the value 0.070, the system enters a critical state [34,35].
Furthermore, the entropy in the NT domain, Snt, is defined as [34]
where .
The entropy, Snt, is a dynamic quantity that depends on the sequential order of events. Moreover, upon the time reversal T, i.e., Tpm = pN−m+1, the entropy, Snt−, is further defined. When the analyzed seismicity approaches a “true” critical state, the following conditions should be fulfilled [27,34,63]:
- (i).
- The “average” distance D, defined by the normalized power spectra Π(ω) of the evolving seismicity and by the theoretical estimation of Π(ω) for κ1 = 0.070, should be less than 10−2.
- (ii).
- The parameter κ1 should approach the critical value of κ1 = 0.070 by “descending from above”.
- (iii).
- Both natural time entropies, Snt and Snt−, should be lower than the entropy of uniform noise Su = (ln2/2) − 1/4 when κ1 approaches 0.070.
- (iv).
- Since the dynamic evolution of the system is expected to be self-similar in the critical state, the time of the true coincidence should not vary upon changing (within reasonable limits) either the magnitude threshold, Mth, or the area used in the calculation.
The authors of [27,58] proposed the use of the time marker indicated by MRWA in the seismicity evolution before the major event as the initiation point for the NT analysis. In the frame of this approach, the two independent methods (MRWA and NT analysis) were integrated to identify the approach to the critical stage in the earthquake preparation process. In particular, the initial application of MRWA in a broader time period of the regional seismicity before the major event reveals time segments where the NT analysis is going to investigate for indicators suggesting the entrance to the critical stage.
In Figure 9, the computed parameters D, κ1, Snt and Snt−, as evolved event by event, are plotted in the natural time and conventional time domains as they approach the critical stage in the regional seismicity of central Crete, for threshold magnitudes of Mth = 2.0, 2.5 and 3.0 and for areas of radius R = 25 and R = 50 km, respectively, around the epicenter of the Mw6.0 main event. This analysis clearly demonstrates that, from about August 17, 2021 (i.e., about 41 days before the Mw6.0 earthquake of 27 September 2021), the estimated parameters suggest that a critical stage has been approached. In all cases, for Mth = 2.0, 2.5 and 3.0, and R = 25 and R = 50 km, the NT analysis starts at approximately two months before the main event, i.e., 24 July, 2021, around the corresponding time marker indicated by MRWA (see Figure 6, Figure 7 and Figure 8). It may, thus, be considered that the critical point for the regional seismicity was approached around that time. In Figure 9, we observe that all the requirements (i–iv) are fulfilled a few days before the mainshock for all the cases that we study. The results, thus, indicate that the regional seismicity presented criticality characteristics before the main event.
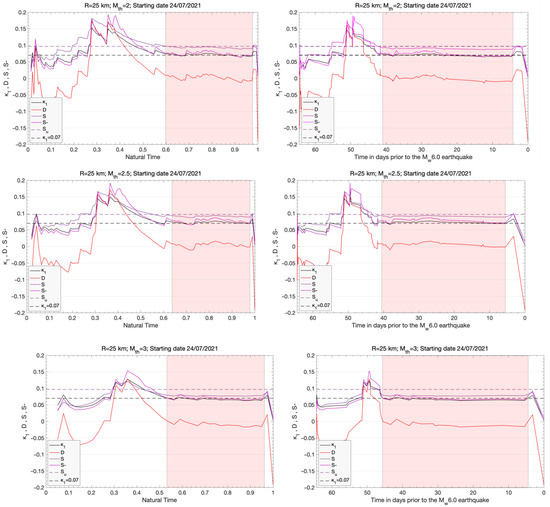
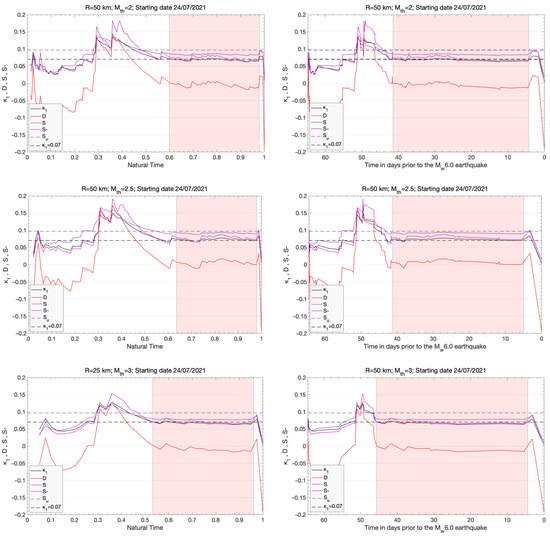
Figure 9.
Time evolution of the NT analysis parameters κ1, D, Snt and Snt− as they evolve event by event prior to the central Crete Mw6.0 mainshock in natural time (left column) and conventional time (days; right column), considering a radius R = 25 km (top 3 rows) and 50 km (bottom 3 rows) around the Mw = 6.0 epicenter and a magnitude threshold, Mth = 2.0, 2.5 and 3.0. The dashed horizontal lines indicate the entropy limit of Su = 0.0966 and the value κ1= 0.070. The shaded rectangle marks the time when the critical stage of κ1 = 0.070 is approached.
3. Concluding Remarks
In the present work, the evolution of the regional patterns of seismicity in the area of the central Crete (Mw6.0) strong earthquake on 27 September 2021 was investigated using MRWA and NT analysis. The applied methods have suggested that it is possible to define when the fault system is in a critical stage during the preparation process of a major earthquake. The analysis was performed in the natural time domain, with an approximate starting point indicated by MRWA. The latter showed a decrease in the standard deviation of the wavelet coefficients σwav(m) at much lower scales, similar to the observations in [27,58], prior to the occurrence of major events. Within this joint approach, the initial application of MRWA in regional seismicity around the epicenter, and for a wide time period before the mainshock, indicated a time segment where the NT analysis was applied in order to explore possible indicators that suggested the entrance to a critical stage. We note that the epicenter could have been also determined in advance by following the procedure described in [63].
The results demonstrated that regional seismicity approached criticality for a prolonged period of approximately 40 days before the Mw6.0 earthquake that occurred on 27 September 2021 onshore in central Crete, in agreement with the results in [58]. In other words, the NT analysis parameters κ1, D, Snt and Snt−, that characterize the evolution of the regional seismicity, approach the theoretical values of critical point phenomena for a prolonged period of 40 days before the Mw6.0 mainshock, in a similar way to that of non-equilibrium critical systems. Hence, the analysis of the regional seismicity in the natural time domain, initiated at approximately the time marks indicated by the results of MRWA, pointed to an approximate date of the impending large Mw6.0 earthquake of central Crete within a narrow time window in the order of a few days. These results lay further support to the methodology introduced in [27,58] regarding the combination of MRWA and NT analyses for the identification of critical stages of regional seismicity prior to strong earthquakes, providing a novel and promising framework for better understanding the evolution of earthquake generation processes.
Author Contributions
Conceptualization, F.V.; methodology, F.V., G.M. and G.H.; validation, F.V., G.M. and G.H.; resources, F.V., G.M., G.H. and G.C.; data curation, F.V., G.M., G.H. and G.C.; writing—original draft preparation, F.V.; writing—review and editing, F.V., G.M., G.H. and G.C. All authors have read and agreed to the published version of the manuscript.
Funding
We acknowledge support of this study by the project “Operation of the Hellenic Seismological Network of Crete”, funded by the Region of Crete. G.C. acknowledges support by the Operational Program «Human Resources Development, Education and Lifelong Learning» in the context of the project “Reinforcement of Postdoctoral Researchers–2nd Cycle (MIS-5033021), implemented by the State Scholarships Foundation (ΙΚΥ), co-financed by Greece and the European Union (European Social Fund—ESF).
Data Availability Statement
Data are available at http://eida.gein.noa.gr/, (accessed on 1 October 2021), hosted by the National Observatory of Athens, Institute of Geodynamics with doi:10.7914/SN/HL (last accessed on 1 October 2021).
Acknowledgments
The authors are grateful to all staff involved in the Hellenic Unified Seismic Network.
Conflicts of Interest
The authors declare no conflict of interest.
References
- McKenzie, D. Active Tectonics of the Mediterranean Region. Geophys. J. R. Astron. Soc. 1972, 30, 109–185. [Google Scholar] [CrossRef]
- Le Pichon, X.; Angelier, J. The Hellenic Are and Trench System: A key to the neotectonic evolution of the eastern Mediterranean area. Tectonophysics 1979, 60, 1–42. [Google Scholar] [CrossRef]
- Reilinger, R.; Mcclusky, S.; Paradissis, D.; Ergintav, S.; Vernant, P. Geodetic constraints on the tectonic evolution of the Aegean region and strain accumulation along the Hellenic subduction zone. Tectonophysics 2010, 488, 22–30. [Google Scholar] [CrossRef]
- Comninakis, P.; Papazachos, B. Space and time distribution of the intermediate focal depth earthquakes in the Hellenic Arc. Tectonophysics 1980, 70, T35–T37. [Google Scholar] [CrossRef]
- Delibasis, N.; Ziazia, M.; Voulgaris, N.; Papadopoulos, T.; Stavrakakis, G.; Papanastassiou, D.; Drakatos, G. Microseismic activity and seismotectonics of Heraklion Area (central Crete Island, Greece). Tectonophysics 1999, 308, 227–248. [Google Scholar] [CrossRef]
- Armijo, R.; Lyon-Caen, H.; Papanastassiou, D. East-west extension and Holocene normal faults scraps in the Hellenic arc. Geology 1992, 20, 491–494. [Google Scholar] [CrossRef]
- Shaw, B.; Jackson, J. Earthquake mechanisms and active tectonics of the Hellenic subduction zone. Geophys. J. Int. 2010, 181, 966–984. [Google Scholar] [CrossRef]
- Ten Veen, J.H.; Meijer, P.T. Late Miocene to recent tectonic evolution of Crete (Greece): Geological observations and model analysis. Tectonophysics 1998, 298, 191–208. [Google Scholar] [CrossRef]
- Caputo, R.; Catalano, S.; Monaco, C.; Romagnoli, G.; Tortorici, G.; Tortorici, L. Active faulting on the island of Crete (Greece). Geophys. J. Int. 2010, 183, 111–126. [Google Scholar] [CrossRef]
- Vallianatos, F.; Kokinou, E.; Sammonds, P. Non Extensive statistical physics approach to fault population distribution. A case study from the Southern Hellenic Arc (Central Crete). Acta Geophys. 2011, 59, 770–784. [Google Scholar] [CrossRef]
- Vasilakis, E. Study of the Tectonic Features of the Messara Basin, Central Crete with Remote Sensing and GIS. PhD Thesis, National and Kapodistrian University of Athens, Section of Geophysics—Geothermics, Department of Geology and Geoenvironment, Athens, Greece, 2006. [Google Scholar]
- Caputo, R.; Catalano, S.; Monaco, C.; Romagnoli, G. Middle-late quaternary geodynamics of Crete, southern Aegean, and seismotectonic implications. Bull. Geol. Soc. Greece 2010, 43, 400–408. [Google Scholar] [CrossRef]
- Caputo, R.; Pavlides, S. Greek Database of Seismogenic Sources (GreDaSS); Università Degli Studi di Ferrara: Ferrara, Italy, 2013. [Google Scholar]
- Bak, P.; Tang, C. Earthquakes as a self-organized critical phenomenon. J. Geophys. Res. Space Phys. 1989, 94, 15635–15637. [Google Scholar] [CrossRef]
- Kiyashchenko, D.; Smirnova, N.; Troyan, V.; Vallianatos, F. Dynamics of multifractal and correlation characteristics of the spatio-temporal distribution of regional seismicity before the strong earthquakes. Nat. Hazards Earth Syst. Sci. 2003, 3, 285–298. [Google Scholar] [CrossRef]
- Kiyashchenko, D.; Smirnova, N.; Troyan, V.; Vallianatos, F. Seismic hazard precursory evolution: Fractal and multifractal as-pects. Phys. Chem. Earth 2004, 29, 367–378. [Google Scholar] [CrossRef]
- Michas, G.; Vallianatos, F.; Sammonds, P. Non-extensivity and long-range correlations in the earthquake activity at the West Corinth rift (Greece). Nonlinear Process. Geophys. 2013, 20, 713–724. [Google Scholar] [CrossRef]
- Rundle, J.B.; Turcotte, D.L.; Shcherbakov, R.; Klein, W.; Sammis, C. Statistical physics approach to understanding the multiscale dynamics of earthquake fault systems. Rev. Geophys. 2003, 41, 5-1–5-30. [Google Scholar] [CrossRef]
- Sornette, D. Critical Phenomena in Natural Sciences; Springer: Berlin/Heidelberg, Germany, 2000. [Google Scholar]
- Tsallis, C. Introduction to Nonextensive Statistical Mechanics: Approaching a Complex World; Springer: Berlin, Germany, 2009. [Google Scholar]
- Uritsky, V.; Smirnova, N.; Troyan, V.; Vallianatos, F. Critical dynamics of fractal fault systems and its role in the generation of pre-seismic electromagnetic emissions. Phys. Chem. Earth 2004, 29, 473–480. [Google Scholar] [CrossRef]
- Vallianatos, F.; Michas, G.; Benson, P.; Sammonds, P. Natural time analysis of critical phenomena: The case of acoustic emissions in triaxially deformed Etna basalt. Phys. A Stat. Mech. Appl. 2013, 392, 5172–5178. [Google Scholar] [CrossRef]
- Vallianatos, F.; Michas, G.; Papadakis, G. Non-extensive and natural time analysis of seismicity before the Mw6.4, October 12, 2013 earthquake in the South West segment of the Hellenic Arc. Phys. A Stat. Mech. Appl. 2014, 414, 163–173. [Google Scholar] [CrossRef]
- Chatzopoulos, G. Accelerating deformation seismicity patterns before the 3 March 2021 Thessaly strong earthquake. First results. Bull. Geol. Soc. 2021, 58, 87–104. [Google Scholar] [CrossRef]
- Telesca, L.; Lapenna, V.; Alexis, N. Multiresolution wavelet analysis of earthquakes. Chaos Solitons Fractals 2004, 22, 741–748. [Google Scholar] [CrossRef]
- Telesca, L.; Hloupis, G.; Nikolintaga, I.; Vallianatos, F. Temporal patterns in southern Aegean seismicity revealed by the multiresolution wavelet analysis. Commun. Nonlinear Sci. Numer. Simul. 2007, 12, 1418–1426. [Google Scholar] [CrossRef]
- Vallianatos, F.; Michas, G.; Hloupis, G. Multiresolution wavelets and natural time analysis before the January–February 2014 Cephalonia (Mw6.1 & 6.0) sequence of strong earthquake events. Phys. Chem. Earth 2015, 85, 201–209. [Google Scholar]
- Uyeda, S.; Kamogawa, M.; Tanaka, H. Analysis of electrical activity and seismicity in the natural time domain for the volcanic-seismic swarm activity in 2000 in the Izu Island region, Japan. J. Geophys. Res. Space Phys. 2009, 114, 2310. [Google Scholar] [CrossRef]
- Varotsos, P.A.; Sarlis, N.; Skordas, E.; Lazaridou, M.S. Natural entropy fluctuations discriminate similar-looking electric signals emitted from systems of different dynamics. Phys. Rev. E 2005, 71, 11110. [Google Scholar] [CrossRef]
- Varotsos, P.; Sarlis, N.; Tanaka, H.K.; Skordas, E. Similarity of fluctuations in correlated systems: The case of seismicity. Phys. Rev. E 2005, 72, 41103. [Google Scholar] [CrossRef] [PubMed]
- Varotsos, P.A.; Sarlis, N.; Skordas, E.; Tanaka, H.K.; Lazaridou, M.S. Entropy of seismic electric signals: Analysis in natural time under time reversal. Phys. Rev. E 2006, 73, 31114. [Google Scholar] [CrossRef]
- Varotsos, P.A.; Skordas, E.; Sarlis, N.; Lazaridou, M.S. Fluctuations, under time reversal, of the natural time and the entropy distinguish similar looking electric signals of different dynamics. J. Appl. Phys. 2008, 103, 14906. [Google Scholar] [CrossRef]
- Varotsos, P.; Sarlis, N.; Skordas, E. Detrended fluctuation analysis of the magnetic and electric field variations that precede rupture. Chaos Interdiscip. J. Nonlinear Sci. 2009, 19, 23114. [Google Scholar] [CrossRef]
- Varotsos, P.A.; Sarlis, N.; Skordas, E.S. Natural Time Analysis: The New View of Time; Springer: New York, NY, USA, 2011. [Google Scholar]
- Varotsos, P.; Sarlis, N.V.; Skordas, E.S.; Uyeda, S.; Kamogawa, M. Natural time analysis of critical phenomena. Proc. Natl. Acad. Sci. USA 2011, 108, 11361–11364. [Google Scholar] [CrossRef]
- Sarlis, N.; Skordas, E.; Lazaridou, M.S.; Varotsos, P. Investigation of seismicity after the initiation of a Seismic Electric Signal activity until the main shock. Proc. Japan Acad. Ser. B 2008, 84, 331–343. [Google Scholar] [CrossRef]
- Sarlis, N.; Skordas, E.; Varotsos, P. Multiplicative cascades and seismicity in natural time. Phys. Rev. E 2009, 80, 22102. [Google Scholar] [CrossRef] [PubMed]
- Sarlis, N.; Skordas, E.; Varotsos, P. Nonextensivity and natural time: The case of seismicity. Phys. Rev. E 2010, 82, 21110. [Google Scholar] [CrossRef] [PubMed]
- Abe, S.; Sarlis, N.V.; Skordas, E.S.; Tanaka, H.K.; Varotsos, P.A. Origin of the Usefulness of the Natural-Time Representation of Complex Time Series. Phys. Rev. Lett. 2005, 94, 170601. [Google Scholar] [CrossRef]
- Saltas, V.; Vallianatos, F.; Triantis, D.; Stavrakas, I. Complexity in Laboratory Seismology: From electrical and acoustic emis-sions to fracture. In Complexity of Seismic Time Series; Chelidze, T., Telesca, L., Eds.; Elsevier: Amsterdam, The Netherlands, 2018. [Google Scholar]
- Thurner, S.; Lowen, S.B.; Feurstein, M.C.; Heneghan, C.; Feichtinger, H.G.; Teich, M.C. Analysis, Synthesis, and Estimation of Fractal-Rate Stochastic Point Processes. Fractals 1997, 5, 565–595. [Google Scholar] [CrossRef]
- Abry, P.; Flandrin, P.; Taqqu, M.S.; Veitch, D. Wavelets for the analysis, estimation, and synthesis of scaling data. In Self-Similar Network Traffic and Performance Evaluation; Wiley: Hoboken, NJ, USA, 2000. [Google Scholar]
- Abry, P.; Flandrin, P.; Taqqu, M.S.; Veitch, D. Self-similarity and long-range dependence through the wavelet lens. In Theory and Applications of Long-Range Dependence; Doukhan, P., Oppenheim, G., Taqqu, M.S., Eds.; Birkhäuser: Basel, Switzerland, 2002; pp. 527–556. [Google Scholar]
- Wornell, G.W.; Gaumond, C.F. Signal Processing with Fractals: A Wavelet Based Approach. J. Acoust. Soc. Am. 1999, 105, 18. [Google Scholar] [CrossRef]
- Teich, M.C.; Heneghan, C.; Lowen, S.B.; Turcott, R.G. Estimating the fractal exponent of point processes in biological systems using wavelet- and fourier-transform methods. In WAVELETS in Medicine and Biology; Informa UK Limited: London, UK, 2017; pp. 383–412. [Google Scholar]
- Evangelidis, C.P.; Triantafyllis, N.; Samios, M.; Boukouras, K.; Kontakos, K.; Ktenidou, O.-J.; Fountoulakis, I.; Kalogeras, I.; Melis, N.S.; Galanis, O.; et al. Seismic Waveform Data from Greece and Cyprus: Integration, Archival, and Open Access. Seism. Res. Lett. 2021, 92, 1672–1684. [Google Scholar] [CrossRef]
- Hloupis, G.; Papadopoulos, I.; Makris, J.P.; Vallianatos, F. The South Aegean seismological network—HSNC. Adv. Geosci. 2013, 34, 15–21. [Google Scholar] [CrossRef][Green Version]
- Chatzopoulos, G.; Papadopoulos, I.; Vallianatos, F. The Hellenic seismological network of Crete (HSNC): Validation and results of the 2013 aftershock sequences. Adv. Geosci. 2016, 41, 65–72. [Google Scholar] [CrossRef][Green Version]
- Chouliaras, G. Investigating the earthquake catalog of the National Observatory of Athens. Nat. Hazards Earth Syst. Sci. 2009, 9, 905–912. [Google Scholar] [CrossRef]
- Chouliaras, G.; Melis, N.S.; Drakatos, G.; Makropoulos, K. Operational network improvements and increased reporting in the NOA (Greece) seismicity catalog. Adv. Geosci. 2013, 36, 7–9. [Google Scholar] [CrossRef]
- Mignan, A.; Chouliaras, G. Fifty Years of Seismic Network Performance in Greece (1964–2013): Spatiotemporal Evolution of the Completeness Magnitude. Seismol. Res. Lett. 2014, 85, 657–667. [Google Scholar] [CrossRef]
- Hellenic Unified Seismic Network (H.U.S.N.). Available online: http://www.gein.noa.gr/en/networks/husn (accessed on 1 October 2021).
- Godano, C.; Caruso, V. Multifractal analysis of earthquake catalogues. Geophys. J. Int. 1995, 121, 385–392. [Google Scholar] [CrossRef]
- Öncel, A.O.; Main, I.G.; Alptekin, O.; Cowie, P.A. Spatial variation in the fractal properties of seismicity in the north Anatolian fault zone. Tectonophysics 1996, 257, 189–202. [Google Scholar] [CrossRef]
- Hainzl, S.; Scherbaum, F.; Beauval, C. Estimating Background Activity Based on Interevent-Time Distribution. Bull. Seismol. Soc. Am. 2006, 96, 313–320. [Google Scholar] [CrossRef]
- Corral, Á.; Christensen, K. Comment on “Earthquakes Descaled: On Waiting Time Distributions and Scaling Laws”. Phys. Rev. Lett. 2006, 96, 109801. [Google Scholar] [CrossRef] [PubMed]
- Abe, S.; Suzuki, N. Scale-free statistics of time interval between successive earthquakes. Phys. A Stat. Mech. Appl. 2005, 350, 588–596. [Google Scholar] [CrossRef]
- Vallianatos, F.; Michas, G.; Hloupis, G. Seismicity Patterns Prior to the Thessaly (Mw6. 3) Strong Earthquake on 3 March 2021 in Terms of Multiresolution Wavelets and Natural Time Analysis. Geosciences 2021, 11, 379. [Google Scholar] [CrossRef]
- Ngui, W.K.; Leong, M.S.; Hee, L.M.; Abdelrhman, A.M. Wavelet Analysis: Mother Wavelet Selection Methods. Appl. Mech. Mater. 2013, 393, 953–958. [Google Scholar] [CrossRef]
- Wijayaab, D.R.; Sarnoa, R.; Zulaikac, E. Information Quality Ratio as a novel metric for mother wavelet selection. Chemom. Intell. Lab. Syst. 2017, 160, 59–71. [Google Scholar] [CrossRef]
- Sarlis, N.V.; Skordas, E.S.; Varotsos, P.A. Order parameter fluctuations of seismicity in natural time before and after mainshocks. Europhys. Lett. 2010, 91, 59001. [Google Scholar] [CrossRef]
- Varotsos, P.A.; Sarlis, N.V.; Skordas, E.S. Study of the temporal correlations in the magnitude time series before major earthquakes in Japan. J. Geophys. Res. Space Phys. 2014, 119, 9192–9206. [Google Scholar] [CrossRef]
- Sarlis, N.V.; Skordas, E.S.; Varotsos, P.A.; Nagao, T.; Kamogawa, M.; Uyeda, S. Spatiotemporal seismicity variations and epicenter. Proc. Natl. Acad. Sci. USA 2015, 112, 986–989. [Google Scholar] [CrossRef] [PubMed]
Publisher’s Note: MDPI stays neutral with regard to jurisdictional claims in published maps and institutional affiliations. |
© 2022 by the authors. Licensee MDPI, Basel, Switzerland. This article is an open access article distributed under the terms and conditions of the Creative Commons Attribution (CC BY) license (https://creativecommons.org/licenses/by/4.0/).