Abstract
There has been a proliferation of equations proposed to describe the unsaturated shear strength envelope going back to the 1970s. However, there have been limited studies to verify the suitability of one unsaturated shear strength equation over another. Most proposed shear strength equations have attempted to relate the shear strength of an unsaturated soil to some aspect(s) of the soil–water characteristic curve (SWCC). Estimation procedures have generally focused on using that of air-entry value (AEV) as defined by the drying (or desorption) branch of the degree of saturation SWCC (S-SWCC). This paper studies the suitability of using two “anchor points” (or reference points) along the drying S-SWCC to estimate the unsaturated soil shear strength function. The anchor points referred to are the air-entry value (AEV) of the soil and the “residual suction point” of the soil defined in terms of the S-SWCC. Shear strength conditions associated with both so-called anchor points are used as “boundary conditions” that should be satisfied when estimating the shear strength function for unsaturated soils. Past research laboratory measurements published in the research literature are used as part of the verification process for this study.
1. Introduction
The shear strength for an unsaturated soil takes the form of a nonlinear mathematical function with respect to soil suction. Shear strength laboratory testing is both costly and requires special laboratory equipment and testing procedures. Many shear strength equations are not required; rather, what is required is a methodology that relates unsaturated soil shear strength to a more easily measured relationship, such as the soil–water characteristic curve (SWCC). Geotechnical engineers need an estimation procedure for a shear strength function similar to the hydraulic conductivity function widely accepted for saturated–unsaturated seepage analyses. A single estimation shear strength equation is needed that is sufficiently accurate and of a reasonable cost to implement in geotechnical engineering practice.
It is quite widely acceptable in geotechnical engineering practice to use nonlinear permeability and water storage functions based on the measurement of soil–water characteristic curves (SWCCs) [1]. It is suggested that a similar methodology should be applied in shear strength related analyses.
The soil–water characteristic curve is a family of drying and wetting curves that can be written in terms of various designations for the amount of water in the soils (e.g., gravimetric water content, volumetric water content, and degree of saturation). A typical family of soil–water characteristic curves [2,3] is shown in Figure 1.
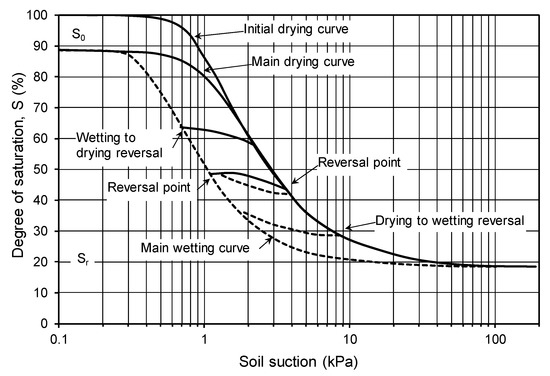
Figure 1.
Family of soil–water characteristic curves (SWCCs) described by drying and wetting cycles for a soil (after Klute, 1965, 1986).
If the soil does not undergo overall volume changes as soil suction is changed, then any of the mentioned water content designations can be used in the estimation of unsaturated soil functions. It has been demonstrated that the degree of saturation designation (i.e., saturation SWCC (S-SWCC)) is preferable when estimating the permeability function [4]. The degree of saturation has also been the preferred water content designation since the early studies on unsaturated soil shear strength [5]. It is also suggested that the main drying curve of the S-SWCC be used to estimate unsaturated soil property functions and then consideration be given to hysteretic effect caused by wetting [6].
Since the 1970s, several forms for unsaturated shear strength equations have been proposed by researchers [7]. Based on the findings in numerous shear strength studies, Fredlund (2019) suggested a new procedure for estimating the unsaturated shear strength based on two so-called anchor points defined by the drying S-SWCC [6]. The procedure was suggested; however, an adequate verification analysis of laboratory data was not provided. The verification of the Fredlund (2019) procedure is the purpose of this research paper.
The objective of the paper is to briefly examine the features of past proposed shear strength equations for an unsaturated soil and assess the viability of the equation proposed by Fredlund (2019). The Fredlund (2019) methodology uses the Bao et al. (1998) unsaturated shear strength equation to define the “slope” of the unsaturated shear strength function between two so-called anchor points; namely, the air-entry value (AEV) of the soil and residual suction conditions. The results of a parametric study are used to illustrate the applicability of the Bao et al. (1998) function over a wide range of degrees of saturation soil–water characteristic curves. The verification process is conducted using published laboratory test data sets.
The hypothesis for the research study centers around the use of information from the drying, degree of saturation branch of the soil–water characteristic curve (S-SWCC), (along with the saturated shear strength parameters), to estimate the unsaturated shear strength function.
The scope of the study was limited to the examination of laboratory measured data that have been published in research papers. The study was also limited in the sense that a detailed comparison was not made to other shear strength equations that have been published. It has been suggested that possibly as many as 50 equations have been proposed to define the shear strength function for an unsaturated soil [8]. The scope of the present study was also limited in the sense that only the Fredlund and Xing (1994) SWCC equation was used in the study. Other equations could have been used for a similar study provided the SWCC functions were continuous over the entire soil suction range.
2. Background and Literature Review
Numerous unsaturated shear strength equations have been suggested over the past six decades [9]. Even since the earliest research undertaken at Imperial College, London [5], it was suggested that the unsaturated shear strength could be related to the degree of saturation of the soil. Some of the soils show bimodal SWCC behavior in the study by Satyanaga and Rahardjo (2019) [10]. The present study was limited to the consideration of soils with a singular dominant void space distribution (i.e., unimodal behavior).
In 1978, Fredlund et al. [11] proposed an unsaturated shear strength equation based on two independent stress state variables. The friction angle (φ′) associated with net normal stress (σ − ua) was assumed to affect shear strength of the soil in a manner independent of matric suction (ua − uw), where ua is the pore-air pressure; uw is the pore-water pressure; and σ is the normal total stress on the failure plane. The soil property associated with matric suction (φb) took the form of a friction angle. The friction angle associated with soil suction was initially assumed to be constant based upon experimental data available at that time. The proposed shear strength equation was assumed to be linear in form and independent of the effect of net normal stress. The linear form of the proposed unsaturated soil shear strength equation is presented as follows,
where: c′ is effective stress parameter from saturated tests; σ − ua is the net normal stress on the failure plane; φ′ is the effective angle of internal friction for the saturated soil, and φb is the contribution to the shear strength contributed by soil suction. The angle (φb) may be relatively constant over a limited suction range; however, when tests are performed over a wider soil suction range, the shear strength envelope shows nonlinearity [12,13]. Over time, several nonlinear shear strength equations have been proposed for the shear strength for unsaturated soil [9]. Essentially all unsaturated shear strength equations maintained independent roles for matric suction and net total stress components.
The matric suction component of shear strength can also be visualized as being part of an apparent cohesion in the soil [14], as shown in Equation (2).
where: ct is total cohesion. In essence, the soil is assumed to have two components of cohesion and one friction angle (φ′). Over time, the preference appears to favor thinking of a soil as having two components to cohesion.
Essentially all unsaturated soil property characterizations have tended towards using the soil–water characteristic curve (SWCC) for the purpose of quantifying the soil suction component of cohesion. While the SWCC can be quantified in terms of gravimetric water content, volumetric water content, or degree of saturation, it is the latter (i.e., S-SWCC) that best embraces soils that undergo volume change as soil suction is increased. The S-SWCC has also been shown to provide a means of identifying two important pivotal points on the soil–water characteristic curve. These are the air-entry value of the soil (ψaev) and the residual suction (ψr) (along with the residual degree of saturation). These points quantify important anchor points associated with the estimation of unsaturated soil shear strength [9].
Table 1 summarizes several equations that have been proposed to characterize unsaturated soil shear strength. Some shear strength equations are scaled over the entire suction range, whereas in other cases, there is one equation from zero suction to the air-entry value and another equation from the air-entry value to a high suction value. Most shear strength equations are limited to maximum soil suctions less than residual suction. Only the soil suction portion of shear strength equations is shown in Table 1 since all characterizations have treated the net total stress as having an independent influence.

Table 1.
Some shear strength equations for unsaturated soils 1.
Examination of the above-mentioned unsaturated shear strength equations reveal a commonality among the equations. First, the strength due to net total normal stress is uncoupled from the effect of soil suction. Second, the proposed equations make use of information from the soil–water characteristic curve to assist in quantifying the contribution to strength from soil suction. Thirdly, all equations are empirical and need to be verified through comparison to experimental laboratory testing measurements.
There appears to be a wide acceptance that the air-entry value (AEV), as defined by the S-SWCC, is the “start point” where the soil begins to behave as an unsaturated soil. Several of the proposed shear strength equations also attempt to use the residual suction as a control point when defining the unsaturated shear strength for practical engineering applications [24].
In this study, it was assumed that the AEV and residual suction (ψr) formed two anchor points on the degree of saturation SWCC (S-SWCC). These anchor points were used in conjunction with the Bao et al. (1998) [16] empirical relationship for the estimation of the unsaturated shear strength function.
3. Theory and Parametric Study Related to S-SWCCs
This section is divided into subheadings that provide a concise description of the experimental results, their interpretation, and the experimental conclusions that can be drawn.
3.1. Theory of S-SWCCs
The Fredlund and Xing (1994) equation [25] for the soil–water characteristic curve was used to represent the drying degree of saturation SWCC over the entire range of soil suction. There were three fitting parameters associated with the Fredlund and Xing (1994) equation [25], namely, afx, nfx, and mfx. The initial degree of saturation (So) also needed to be calculated external to the fitting process (See Equation (3) and the illustration of variables in Figure 2).
where is soil suction, S() is degree of saturation as a function of suction, , So is the initial saturation. The “correction factor” (C()) relies on an approximation of the “residual suction”, and ensures that the degree of saturation goes to 1,000,000 kPa at zero degree of saturation. The afx parameter is related to the inflection point, the nfx parameter is related to the steepness of the S-SWCC function, and the mfx parameter influences the SWCC in the residual suction region. The correction factor (C()) has the following mathematical form, Equation (4),
where is residual suction.
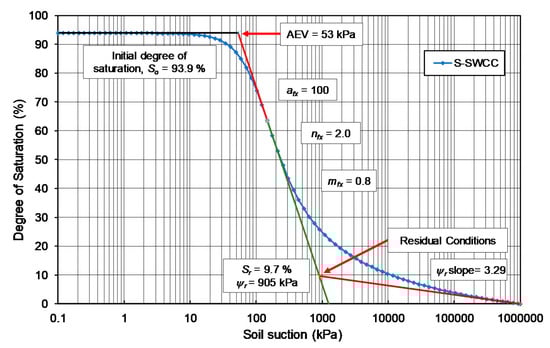
Figure 2.
Definitions of S-SWCC variables and fitting parameters.
The three fitting parameters of Fredlund and Xing (1994) [25] served different roles in defining the soil–water characteristic curve (SWCC). There was some interdependency amongst the fitting parameters; however, the primary role of each variable was quite interdependent. Consequently, it was possible to assign certain loosely defined attributes to each of the SWCC fitting parameters. Figure 2 also suggests that there are anchor points associated with the S-SWCC, namely, (i) the air-entry value (AEV) and the (ii) residual conditions, (i.e., residual suction (ψr) and residual degree of saturation (Sr)).
For convenience in performing mathematical operations such as differentiation, it was expedient to transform the soil suction scale to a Log10 scale. Figure 3 shows the transformed suction scale, along with three straight lines used to define the air-entry value (AEV) and the residual condition, (i.e., Sr and ψr). The uppermost line was assumed to be horizontal and passed throughout initial “near- saturation” point, So %. It should be noted that while the measured gravimetric water content versus Log10 of soil suction may have sloped somewhat in the low suction range, however, the S-SWCC can generally be assumed to be horizontal in the low suction range.
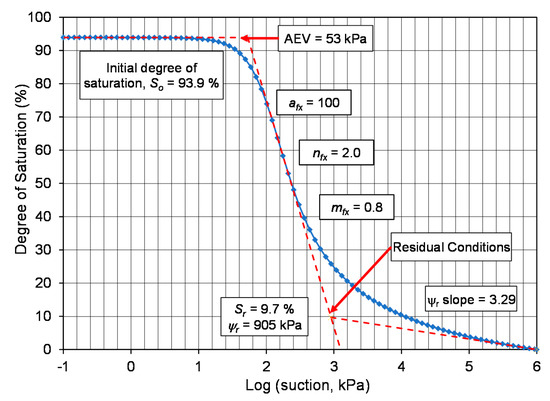
Figure 3.
Variables defined using a Log10 transformed scale for suction.
Figure 4 shows the S-SWCC for the same example shown in Figure 3 with the following fitting parameters: afx = 100 kPa; nfx = 2.0; and mfx = 0.8. The “data” symbol on the graphs signifies the afx variable (i.e., 100 kPa) used in calculating the S-SWCC. The “bell-shaped” graph shows the arithmetic slope of degree of saturation versus suction. It is noteworthy that the point of maximum (or steepest) slope (on an arithmetic scale) occurred at a suction value of approximately 180 kPa, a value slightly beyond the inflection point. The difference in values occurred because of the interaction of the various S-SWCC fitting parameters and, in particular, the effect of the correction factor (C(ψ)). The nature of the correction factor (C(ψ)) is discussed later in this paper.
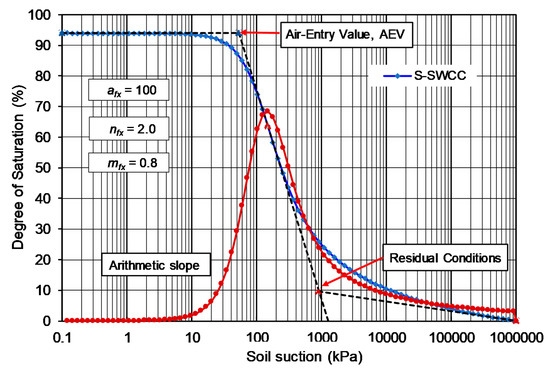
Figure 4.
Plot of the selected reference example S-SWCC, along with two defining anchor points.
The bell-shaped curve in Figure 4 signifies the arithmetic slope of the S-SWCC curve and is defined by Equation (5).
where: defines an increment of degree of saturation change (i.e., ΔS = Si − Si+1) and signifies the corresponding increment of suction change (i.e., ). The objective was to calculate the point of maximum change of slope (i.e., inflection point with smax and the related ) on the best-fit curve. A tangent line could then be drawn through the point of maximum slope along the S-SWCC and be defined by Equation (6).
where: Sint is the degree of saturation at the inflection point along the S-SWCC and b1 is the intercept constant corresponding to zero degree of saturation. The AEV can be defined as the intersection point between a horizontal line through in the low suction range (e.g., 0.1 kPa) and tangent line through the inflection point as shown in Figure 3 [9]. Figure 3 shows the interpretation lines on the S-SWCC. The calculated AEV was 53.0 kPa.
The residual condition point (ψr, Sr) formed the second anchor points that were used to define the unsaturated soil shear strength function. While the function was the same as that proposed by Bao et al. (1998), the application of the function differed in the sense that the function was used to define the slope of the unsaturated shear strength envelope rather than using it to define shear strength values.
The point corresponding to residual conditions (i.e., residual water content, Sr and soil suction, ψr) formed the second anchor point along the S-SWCC, as shown in Figure 4. Defining the residual condition point required the extension of a straight line (on a semi-log plot), starting with a suction of 1,000,000 kPa (i.e., degree of saturation equal to zero) and extending tangent to the S-SWCC in the high suction range. The calculated residual suction (ψr) was 904.9 kPa. The calculated residual degree of saturation (Sr) was 9.68%.
3.2. Study of “Correction Factor” Related to Maximum Suction Point
The correction factor (C(ψr)) proposed by Fredlund and Xing (1994) (i.e., Equation (4)) is a stand-alone function that directs the SWCC sigmodal function towards a common limiting suction of one million kPa. The limiting suction is based on theoretical thermodynamic, vapor pressure considerations corresponding to completely dry conditions. Figure 5 plots the correction factor function (C(ψr)) for values of residual suction (ψr), ranging from 0.1 to 10,000. The correction factor function is superimposed over the sigmodal S-SWCC over the entire range of suction values.
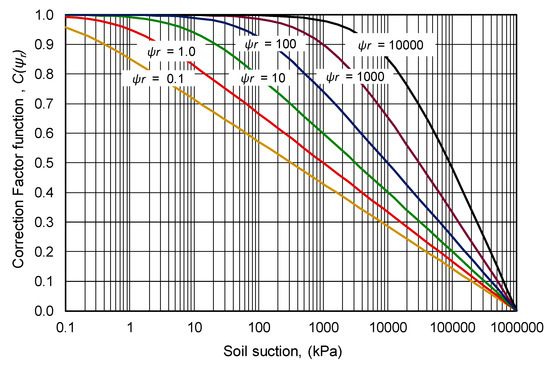
Figure 5.
Correction factor (C(ψr)) function for various residual suction values.
The correction factor functions (C(ψr)) plotted in Figure 5 showed that all functions converged to an essentially straight line as a maximum suction of 1,000,000 kPa was approached. Consequently, the slope of the third straight line (on the transformed suction scale) had a slope that was a function of the residual suction of the soil. Stated another way, the final portion of the S-SWCC was controlled by thermodynamic considerations and the residual suction of the soil.
Differentiating the correction factor function (C(ψr)) with respect to suction yielded fixed values for the derivative of the function with respect to suction, as shown in Figure 6. The following empirical equation (i.e., Equation (7)) fits the values for the slope of the C(ψr) function.
where: X = Log10 (residual suction); j = 7.20574; k = −1.2355 and l = 0.00385.
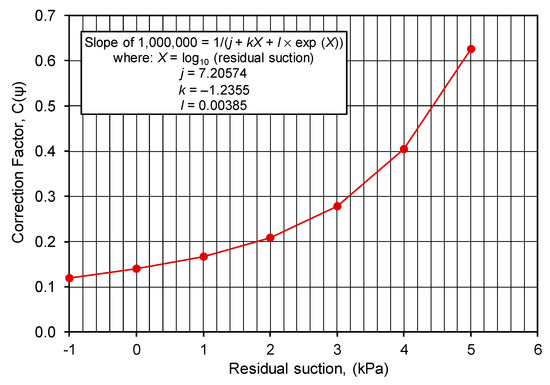
Figure 6.
Slope of the correction factor (C(ψr)) function as zero degree of saturation is approached.
The correction factor function (C(ψr)) served a role in the interpretation of the S-SWCC function; namely, it provided a means whereby the second bending (or break) point (i.e., the residual conditions point) could be quantified. The slope of the correction factor function could be extended backward from the convergent suction point of one million kPa. This line will intersect with the tangent line through the maximum slope near the inflection point. This proposed empirical construction provides a procedure for identifying the second bending point along the S-SWCC function. It is not clear at this point whether there is any further physical significance to the identified second bending point. In other words, the residual condition point is identified using an empirical methodology.
3.3. Degree of Saturation, S-SWCC Parameter Study
The following parametric study is limited to the application of the Fredlund–Xing (1994) sigmoidal equation [25] for the degree of saturation soil–water characteristic curve (S-SWCC). The study assumes unimodal soil behavior for the drying (or desorption) soil–water characteristic curve (i.e., S-SWCC).
The reference example, shown in Figure 4, was first studied for the following SWCC fitting parameters; namely, afx = 100, nfx = 2.0, and mfx = 0.8. An approximate residual suction value was estimated to be 1000 kPa. The air-entry value (AEV) was calculated to be 53.14 as the intersection point between the horizontal line and the line through the inflection point. A more accurate value for the residual suction can be calculated following the generation of the S-SWCC. The more precise calculation of residual conditions gave a residual suction (ψr) equal to 904.9 kPa and a residual degree of saturation (Sr) equal to 9.68%.
All other cases evaluated as part of the parametric study were variations of the reference example by varying afx from 3.2 to 3200 kPa, varying nfx from 1.2 to 5.0, and varying mfx from 0.4 to 3.0. The results of the parametric study covered the range of S-SWCC fitting parameter variations commonly encountered in geotechnical engineering practice.
3.4. Observation from S-SWCC Parametric Study
The fitting parameters of Fredlund and Xing (1994) [25] have independent purposes to serve; however, there is inter-dependency between the fitting variables. Table 2 shows the ranges of fitting parameters used for this study. The afx parameter varied from 10 to 1000 kPa, the nfx parameter varied from 1.2 to 5, and the mfx parameter varied from 0.4 to 3. This resulted in the analysis of 11 S-SWCC relationships.
Table 2.
Summary of fitting parameters for the S-SWCC parametric study.
The afx parameter represents the lateral shift of the S-SWCC and is often used to represent the inflection point on the S-SWCC sigmodal equation. Changes in the afx parameter represent the lateral shift of the S-SWCC. Its magnitude is always somewhat larger than the air-entry value of the soil. Coarse, uniform sand soils can have typical afx values ranging from 0.1 to 10 kPa. Highly plastic, intact, clayey soils can have typical afx values ranging from several hundred kPa to several thousand kPa. Most other soils are somewhere between these limiting values.
The nfx parameter is usually interpreted to represent the steepness of the S-SWCC function at the inflection point. The nfx parameter represents the actual steepness of the S-SWCC function at the inflection point. Stated another way, the inflection point defined by the afx variable can be used to calculate a sloping line that can then be used to define both the air-entry value (AEV) and residual conditions.
The AEV of a soil was always somewhat smaller than the suction at the inflection point, as shown in Figure 7. The difference between the AEV and the afx variable was influenced by the nfx parameter. Smaller nfx values resulted in a larger difference between the afx parameter and the AEV. Figure 7 is shown for a nfx value of 2 and a nfx value of 0.8. It can be observed that a nfx value of 2 resulted in approximately one order of magnitude difference between the inflection point and residual suction values. The 1:1 equality line in Figure 8 represents the afx value. Changing the nfx value and the mfx value changed the spread between the AEV and the residual suction.
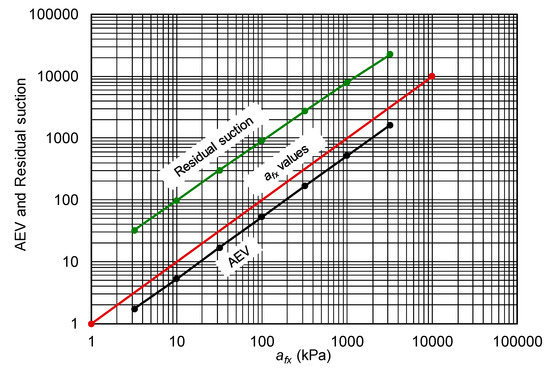
Figure 7.
Effect of changing afx parameter on the AEV and residual suction.
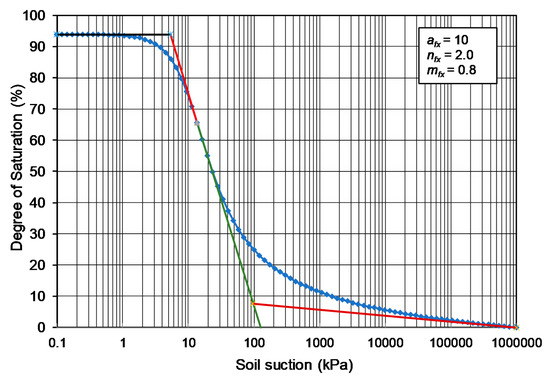
Figure 8.
S-SWCC for the case of afx equal to 10 kPa while nfx remains at 2 and mfx remains at 0.8.
It is difficult to define the role of the mfx parameter other than to say that it provides a third fitting parameter that provides further flexibility in defining the curvature of the S-SWCC function near the AEV and the residual suction.
Selected graphs from the fitting parameters shown in Table 2 are used to illustrate the role of each of the fitting parameters in the Fredlund and Xing (1994) equation [25]. The second block of fitting parameters in Table 2 show the effect of changing the steepness (i.e., nfx value) of the S-SWCC function and the third block of fitting parameters shows the effect of changing the mfx values.
3.5. Observation Related to Changing the afx Parameters
The effect of changing the afx fitting parameter over three orders of magnitude (i.e., 10 kPa to 1000 kPa) is shown in Figure 8 and Figure 9. Combining the graphs illustrates the effect of changing the afx parameter over three orders of magnitude while keeping nfx at 2.0 and mfx at 0.8. While the afx variables were each shifted one order of magnitude, it was observed that the correction factor (C(ψ)) significantly changed the remainder of the curve as the function was directed towards a common point with suction terminating at 1,000,000 kPa and a degree of saturation of zero.
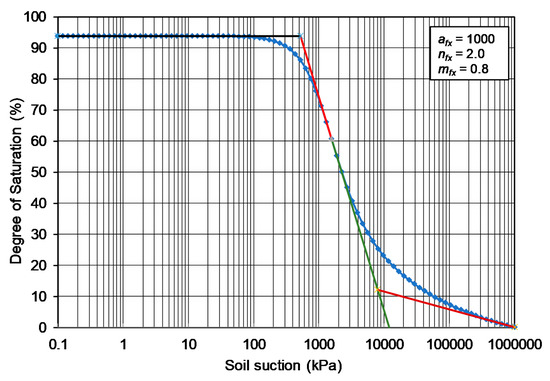
Figure 9.
S-SWCC for the case of afx equal to 1000 kPa while nfx remains at 2 and mfx remains at 0.8.
4. Proposed Fredlund (2019) Shear Strength Equation
There are numerous shear strength equations or functions that have been proposed for an unsaturated soil (Table 1). The proposed equations can be subdivided as: (i) equations that can be “fitted” to a data set and (ii) equations that can be used to estimate the shear strength function. Essentially all the estimation procedures claim to be based on information obtained from the soil–water characteristic curve (SWCC). Comparisons of estimated shear strength functions to measured laboratory data are not that reassuring since considerable scatter is often observed between measured and estimated shear strength functions [9].
It has been generally assumed that the unsaturated shear strength function for a soil can be adequately estimated for geotechnical engineering practice through use of the degree of saturation soil–water characteristic curve, (S-SWCC). This assumption is consistent with research findings on unsaturated soils dating back to the 1960s [5]. However, the procedure whereby the degree of saturation is used to describe unsaturated shear strength has evolved with time. The present study uses the S-SWCC to define the slope of the unsaturated shear strength envelope as opposed to directly using the S-SWCC to calculate shear strengths along the strength envelope. Since the unsaturated shear strength function is nonlinear, the S-SWCC is applied in an incremental manner between the AEV of the soil and residual conditions. Following are some of the assumptions that are invoked in the development of proposed Fredlund (2019) shear strength equation [6].
- It is assumed that the soil behaves as a saturated soil for all negative pore-water pressures up to the AEV. (The AEV is also assumed to be defined by the S-SWCC). In this region of negative pore-water pressures, the soil may have the conventional interpretation for (i) effective cohesion (c’) and (ii) effective angle of internal friction (ϕ’).
- It is assumed that the unsaturated shear strength envelope remains at a constant value for shear strength at soil suctions greater than the residual suction (ψr). The authors are aware that sand soil may experience a drop in shear strength at suction values past residual suction (Donald, 1957). At the same time, clay soils may experience an increase in strength at suction values beyond residual suction. However, for the purposes of this study, it is assumed that shear strength remains at a constant value. This assumption has been shown to be consistent for most soils tested in the high suction range [26].
- It is assumed that the Fredlund and Xing (1994) equation [25], along with the correction factor (C(ψ)). can be used to compute suction values in the high suction range. It is possible to undertake similar analyses using other SWCC equations that have been proposed; however, only the Fredlund and Xing (1994) equation [25] will be used to limit the scope of this paper.
- The transition between the suctions defined by the AEV and residual suction should scale in accordance with the logarithm of soil suction since the S-SWCC relationship is approximately linear between these two points on the S-SWCC. The Bao et al. (1998) function [16] scales in accordance with the logarithm of soil suction but it appears that it is the slope of the shear strength function that scales in accordance with the logarithm of soil suction.
The proposed Fredlund (2019) mathematical function meets the following basic conditions; (i) the slope must be equal to the tangent of the effective angle of internal friction at the air-entry value for the soil and (ii) the slope must go to zero as the residual suction is approached. Intermediate conditions are scaled on a linear logarithm basis between the AEV and residual suction basis.
4.1. Use of the Bao et al. (1998) Shear Strengh Parameters (ζ)
Bao et al. (1998) proposed that the increase in strength of a soil should be scaled back at soil suctions beyond the AEV. The soil parameter (ζ) was introduced to scale down the magnitude of the shear strength. Figure 10 shows that the scaled down soil parameter (ζ) meets the required conditions near the air-entry value but does not satisfy observed measurements of unsaturated shear strength near residual suction [26]. It is suggested that the scaled down soil parameter (ζ) be used to designate the slope of the shear strength function rather than the actual shear strength.
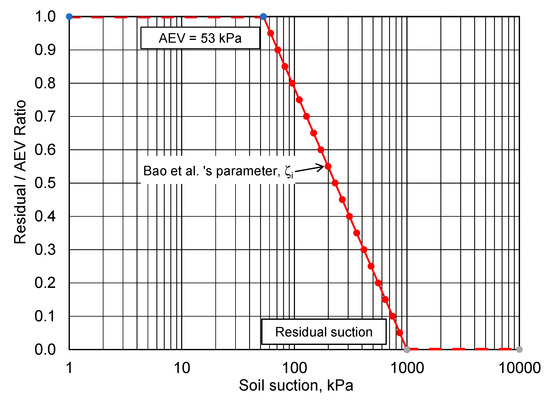
Figure 10.
Shear strength parameter proposed by Bao et al. (1998) for an unsaturated soil.
The boundary conditions for the shear strength envelope become the slope of the shear strength function at the AEV and at residual conditions. The slope of the shear strength function can be scaled between these two extremes using an incremental tangent method, as shown in Figure 11.
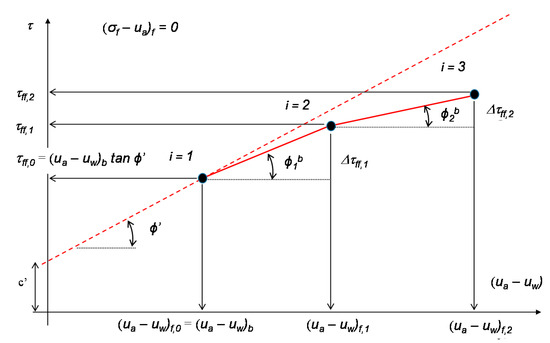
Figure 11.
Marching forward process using the incremental tangent method.
The parameter (ζ) for the total cohesion calculation [16] is introduced as the slope of the unsaturated shear strength. When the suction is lower than AEV, the ζ parameter is 1.0. As suction increases, the ζ parameter decreases and goes to zero at residual suction. The shear strength at the AEV (τAEV) can be calculated as follows:
Equation (8) provides the starting point for marching forward for the entire unsaturated shear strength function. Next, a selected series of suction steps can be taken in marching forward towards residual suction conditions. The following equation can be used to calculate the suction at the next point.
where: n is the number of points used to generate the shear strength envelope. The index variable (i) goes from 1 to n. When i = 1, , and when i = n, . It is necessary to remember the immediate past suction value as the calculations move forward.
The next step is to calculate the Bao et al. (1998) parameter (ζ) [16]
The shear strength at any suction can be calculated by marching forward in increments between the AEV and residual conditions, ref. [6].
where i = 1, , and . A few example S-SWCCs are analyzed in the following section to illustrate the interaction between the soil–water characteristic curve and the unsaturated shear strength envelope. The calculations move between a logarithm scale and an arithmetic in moving between the two functions.
4.2. Observation Related to the Calculated Unsaturated Shear Strength Envelope
Several examples of S-SWCC are used, along with the Bao et al. (1998) function [16], to calculate the proposed Fredlund (2019) unsaturated shear strength envelope. The assumed saturated soil properties are an effective angle of internal friction of 30 degrees and an effective cohesion of 10 kPa. Figure 12 shows the unsaturated shear strength envelope for the reference example where afx equal to 100 kPa.
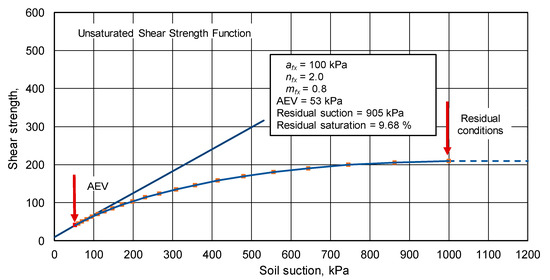
Figure 12.
Unsaturated shear strength envelope for reference example where afx is equal to 100 kPa.
The unsaturated shear strength envelope is defined by using the Bao et al. (1998) function [16] to define the slope of the shear strength envelope while marching forward from a suction equal to the AEV and ending with a suction value equal to residual conditions. The assumption is made that the slope of the unsaturated shear strength function is equal to the tangent of the effective angle of internal friction at the AEV. It is also assumed that the slope of the unsaturated shear strength function is equal to zero at residual suction conditions.
It is noteworthy that the S-SWCC function is commonly plotted with respect to the logarithm based 10 scale for soil suction while the unsaturated shear strength function is plotted with respect to the arithmetic suction scale. As a result, the difference between the AEV and the residual suction have the appearance of being stretched with respect to suction. This is simply the consequence of taking the anchor points with respect to soil suction from the S-SWCC relationship and transferring them to an arithmetic scale for the shear strength envelope. The underlying assumption is that the effect of soil suction changes in accordance with the degree of saturation of the soil.
Figure 13 shows the unsaturated shear strength envelope for the case where afx was equal to 10 kPa while the nfx value was kept at 2.0 and mfx was kept at 0.8. The AEV was 5.3 kPa and the residual suction was 97.3 kPa. It was noted that the afx value largely controlled the range of suctions over which soil suction influenced shear strength. Slight variations in the residual suction point appeared to have a secondary effect on the shear strength function. However, it is important that residual suction was identified as an end point (or an anchor point) for the unsaturated shear strength function [22].
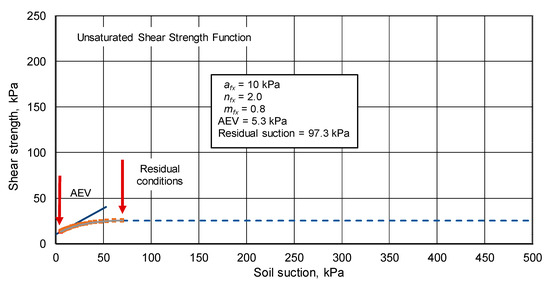
Figure 13.
Unsaturated shear strength envelope for the case of afx equal to 10 kPa.
Figure 14 shows the unsaturated shear strength envelope for the case where afx was equal to 1000 kPa. The AEV was equal to 518.9 kPa and the residual suction was equal to 7946 kPa. Changes in the afx and residual suction values significantly changed the region over which suction influenced, however, the overall shape of the shear strength envelope remained the same.
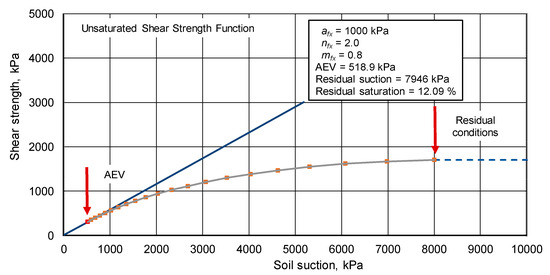
Figure 14.
Unsaturated shear strength envelope for the case of afx equal to 1000 kPa.
4.3. Observations on Combined Envelopes for Other afx Parameters
The effect of changing afx values can more clearly be observed by plotting the estimated functions for several afx values onto one plot for comparison purposes. Figure 15 shows a plot that embraces the entire range of suctions up to a maximum suction value of 24,000 kPa.
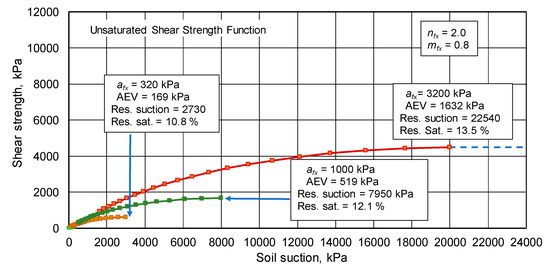
Figure 15.
Unsaturated shear strength envelopes for residual suction up to 24,000 kPa.
The unsaturated shear strength envelopes illustrate the significance differences in shear strength as the afx variable is changed. In general, the effect of soil suction on coarse-grained soils (low afx values) is much smaller than the suction effect on fine-grained soils (high afx values). Figure 16 expands the scale to show the effects of suction in the lower afx variable range. The suction scale is further expanded in Figure 17 with a maximum suction of 200 kPa.
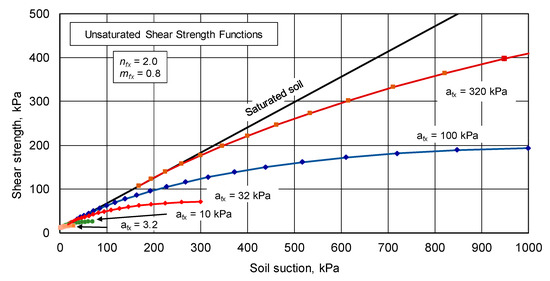
Figure 16.
Unsaturated shear strength envelopes for residual suction up to 1000 kPa.
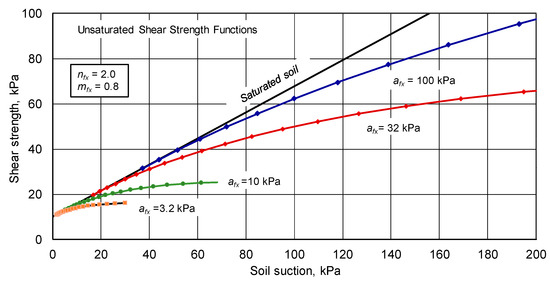
Figure 17.
Unsaturated shear strength envelopes for residual suction up to 200 kPa.
All unsaturated shear strength envelopes estimated using the proposed Fredlund (2019) procedure showed strength envelopes that had shapes that were consistent with measured shear strength envelopes published in the research literature. However, the test of the proposed prediction procedure needs to be verified using examples where the drying S-SWCC and the shear strength were measured over a significant suction range. No complete data sets were measured as part of this study; however, a search of the research literature revealed a limited number of data sets that can be re-analyzed and used for verification purposes. The results of the verification tests are presented in the next section of this paper.
5. Verification Procedure Using Experimental Data
There are two key parts to the shear strength verification process. First, some data can be used to support the assumptions related to the limiting conditions (i.e., the anchor points) of the shear strength function. Second, there are data sets that can be used to verify the character of the region between the limiting boundary conditions.
The limiting conditions of the shear strength function designated (i) the slope of the shear strength envelope in the vicinity of the air-entry value (AEV) and (ii) the slope of the shear strength function as residual conditions are approached. Published laboratory data were used to lend support to both limiting boundary conditions.
The second part of the verification study was related to the estimation of the shear strength function based on the measurement of the degree of saturation SWCC. It was more difficult to obtain data sets in support of this latter requirement because support data must extend over the entire range of suctions between the AEV and residual suction conditions.
5.1. Verification of the Limiting Conditions for the Shear Strength Function
A research study on unsaturated shear strength behavior was conducted at Imperial College, London, in the 1950s and 1960s [5]. Two soils were tested in the laboratory using modified axis-translation triaxial cells. These were a compacted boulder clay and a compacted clay shale. The published data were further analyzed by Fredlund et al. (1978) [11]. The analysis showed that there was a smooth transition away from the saturated shear strength parameters (i.e., effective cohesion (c’) and effective angle of internal friction (ϕ’)) as matric suctions were increased beyond a particular value.
Satija (1978) [12] reported the laboratory triaxial test results using the axis-translation technique to test a clay soil under negative pore-water pressures. The test followed the consolidated drained test procedure, as well as the constant water content test procedure. Two series of tests were performed; one with the soil compacted at high density and the other compacted at low density. The inferred AEV (based on the shear strength envelopes) for high density material was 140 kPa while the AEV for low density material was 40 kPa. Both test procedures showed that the shear strength increased at a reduced rate as matric suction was increased beyond the inferred AEVs. It is noted that the SWCCs were not measured.
Gan and Fredlund (1988) used a modified direct shear test on a compacted sandy clay glacial till soil [13]. The AEV for the soil was subsequently confirmed by pressure plate tests to be around 60 kPa [7].
Bao, Gong, and Zhan (1998) proposed the use of a shear strength function [16] that varied between saturated shear strength parameters up to the AEV of the soil, decreasing to a value of zero at residual suction conditions. The proposed Bao et al. (loc. cit.) shear strength function has been adopted for the control of the slope of the shear strength function between the AEV and residual suction conditions in the Fredlund (2019) function. Based on the above-mentioned laboratory studies, there has been a consensus that the shear strength begins to deviate from saturated soil behavior near the point of the AEV measured for the SWCC.
Nishimura and Fredlund (2002) measured the shear strength and the SWCC on two soils prepared from a slurry condition [26]. The SWCC on the silt soil showed an AEV of approximately 10 kPa and a residual suction of 500 kPa. The SWCC on the kaolin soil showed an AEV of approximately 100 kPa and a residual suction of 10,000 kPa. Specimens for shear strength testing were prepared in controlled total suction environments up to 100,000 kPa. Once the residual suction conditions were exceeded, there was no further measurable increase in shear strength registered for either the silt or the kaolin materials. The independently measured SWCC and shear strength provide support for both limiting conditions for the proposed shear strength function; namely, that the slope of the shear strength envelope corresponds to the saturated effective shear strength parameter for suction up to the AEV and then reduces to a horizontal line as residual conditions are approached.
Rassam and Cook (2002) tested a soil with an AEV of 30 kPa and a residual suction of 200 kPa [21]. Their test results showed that the shear strength envelope became horizontal once residual suction conditions were exceeded. Vilar (2006) tested a soil with an AEV of 30 kPa and a residual suction of approximately 700 kPa [22] and found similar results to those of Rassam and Cook (2002)
5.2. Verification of Intermediate Shear Strength Function between AEV and Residual Suction
The results of several laboratory datasets related to the two boundary conditions for the unsaturated soil shear strength function have been presented. It is possible; however, that both boundary conditions could be met and still the intermediate function might not fit experimental data. In other words, an understanding of the slope of the shear strength function at the AEV and residual suction conditions does not assure that intermediate slope values would necessarily fit experimental data. Experimental data presented in the following section primarily relate the character of unsaturated shear strength function between the AEV and residual suction.
5.2.1. Sand Tested by Donald (1956)
In 1956, Donald performed a series of relatively simple experiments on four sand materials using a conventional direct shear box [27]. A water column was used to subject sand specimens to various matric suctions up to about 30 kPa. The AEVs ranged from 6 to 17 Pa and the residual suction values ranged from 9 to 26 kPa. These coarse sand materials were given the following designations; namely, (i) fine Frankston sand, (ii) graded Frankston sand, (iii) medium Frankston, and iv.) brown sand. Common to these materials was the low suctions at which the materials desaturated and the small difference between the AEV and residual suction (i.e., in one case only about 3 kPa). The finest grained material was fine Frankston.
Figure 18 shows the S-SWCC and the calculated unsaturated shear strength envelopes for fine Frankston sand [27] when using the Fredlund (2019) proposed calculation procedure. The measured direct shear strength results are also shown. The calculated shear strengths and the measured results showed reasonable agreement. The AEV was calculated to be 15.5 kPa and residual suction was reached at 26.7 kPa. Once residual suction values were exceeded there was a slight reduction in shear strength. This was as anticipated for a coarse sand material. The cohesion intercept was zero and the effective friction angle was 23.5 degrees.
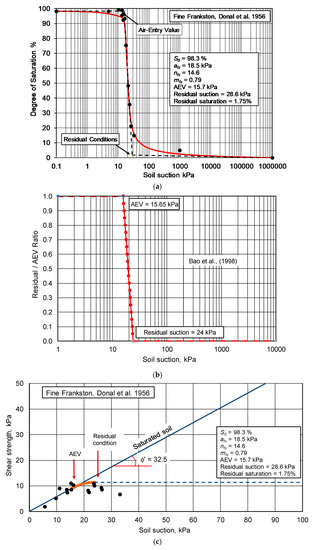
Figure 18.
Comparison of calculated and measured shear strength function for fine Frankston sand: (a) S-SWCC for fine Frankston sand; (b) Bao et al. (1998) shear strength function for the sand; (c) Calculated shear strength function by Bao et al. (1998).
Figure 19 shows the S-SWCC and the calculated unsaturated shear strength envelopes for graded Frankston sand [27] when using the Fredlund (2019) calculation procedure. The calculated shear strengths and the measured results showed reasonable agreement. The AEV was calculated to be 9.0 kPa and residual suction was reached at 19.0 kPa. The cohesion intercept was zero and the effective friction angle was 23.5 degrees. There was a slight reduction in shear strength once residual suction was exceeded.
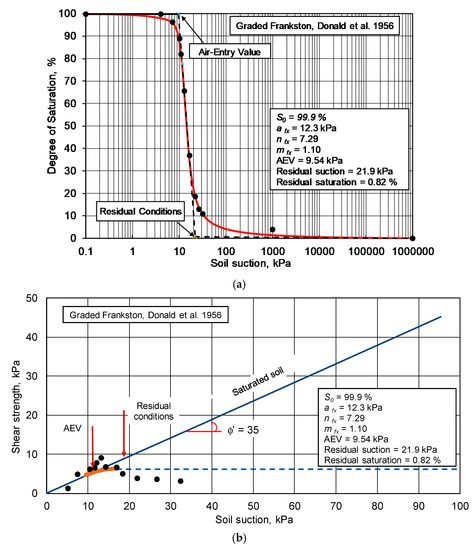
Figure 19.
Comparison of calculated and measured shear strength function for graded Frankston sand: (a) S-SWCC for graded Frankston sand; (b) Calculated shear strength function by Bao et al. (1998).
The two other sands tested by Donald (1956) [27] (i.e., medium Frankston and brown sand) were also analyzed and the results showed similar behavior. All four materials were coarse materials and the proposed Fredlund (2019) analytical procedure appeared to be applicable.
5.2.2. Clay Soils Tested by Escario and Juca (1989)
Escario and Juca (1989) performed SWCCs and shear strength tests on Red clay of Guadalix de la Sierra [28]. The specimens were compacted and tested in a modified direct shear apparatus. The Guadalix Red silty clay was tested using a confining pressure of 120 kPa [24]. Figure 20 shows the SWCC and shear strength test results for specimens of the silty clay using the adjusted residual suction of 8000 kPa. The AEV was measured to be approximately 57 kPa. The residual suction was estimated to be around 26,279 kPa using the construction procedure proposed by Vanapalli et al. (1996) [7]. The effective angle of internal friction was measured to be 32.5 degrees and the cohesion intercept was 20 kPa.
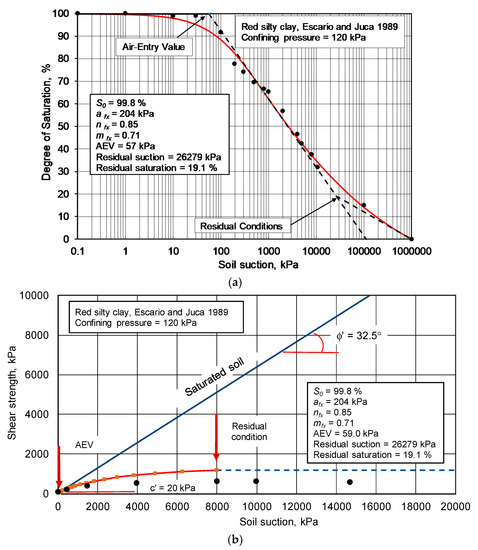
Figure 20.
SWCC and shear strength test results for Guadalix Red silty clay [24,28]: (a) S-SWCC for Guadalix Red silty clay; (b) Shear strength test results for Guadalix Red silty clay tested with a confining pressure of 120 kPa.
The results in Figure 20 show that the estimated shear strength envelope based on the S-SWCC was somewhat higher than the measured shear strength envelope. It appeared that there may have been a “shut-down” in shear strength change at a lower suction than the calculated residual suction. This shut-down type of behavior was observed by Tran et al. (2014; 2016) [29,30] in the study of water (and vapor) flow through soils as residual conditions were approached. It was found that there appeared to be a shut-down of moisture flow when the degree of saturation approached about 2/3rds of the way (in terms of the degree of saturation) between the AEV and residual suction.
It may not be possible to place physical significance in the empirical construction used to identify a unique point identifying residual conditions. Figure 20 shows that there is a departure from the tangential line through the inflection point and the fitted Fredlund and Xing [Reference] (1994) equation [25] at a considerably higher degree of saturation. In other words, the effect of residual suction may start to occur at a higher degree of saturation. Since the S-SWCC is interpreted on a Log10 scale for suction, a change in the residual suction point has a significant effect when used to estimate the unsaturated shear strength envelope.
Figure 21 illustrates the effect of changing residual suction from a degree of saturation of 17.1% (with a residual suction of 24,320 kPa) to a degree of saturation of 42% (corresponding to adjusted residual suction of 4000 kPa). The authors have identified the changed residual conditions as: (i) the adjusted residual suction, and (ii) the adjusted degree of saturation. The “adjusted” conditions are identified as the point where a separation starts to occur between the straight line on a semi-log10 plot and the best-fit line through the data points. The change in the adjusted residual suction is now (100−42% or) 58% of the original difference in the degree of saturation and the residual degree of saturation, (i.e., 83%).
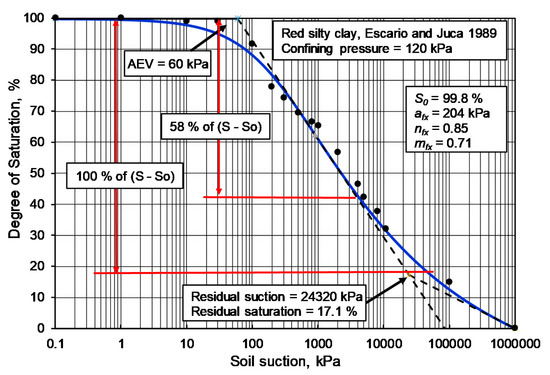
Figure 21.
Effect of reducing the residual suction shut-off value.
Figure 22 shows a replot of the unsaturated shear strength calculated when using a residual suction value of 4000 kPa and 8000 kPa. There is now a close fit between the measure shear strength laboratory data and the estimated shear strength function. Further soils need to be analyzed in a similar manner to confirm that the observed pattern is repeated.
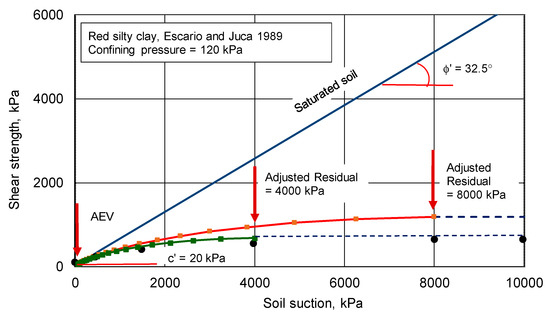
Figure 22.
Shows a re-plot of the unsaturated shear strength envelope using a residual suction of 4000 kPa.
5.2.3. Kaolin Soil Tested by Thu et al. (2006)
Thu, Rahardjo, and Leong (2006) presented degree of saturation SWCC results, along with shear strength results, for a compacted kaolin soil [23]. The best-fit parameters for the S-SWCC when using the Fredlund and Xing (1994) equation [25] were as follows: afx = 130 kPa, nfx = 2.2, mfx = 1.5, and a residual suction of 400 kPa. The calculated AEV was 60 kPa.
Figure 23 presents the estimated shear strength envelope along with the measured laboratory results. The closeness of the fit between the estimated and measured shear strength values once again depends on the assessment of a distinct residual suction point. The location of the residual suction point is somewhat flexible because of the shift related to moving from a logarithm scale to an arithmetic scale on the shear strength envelope.
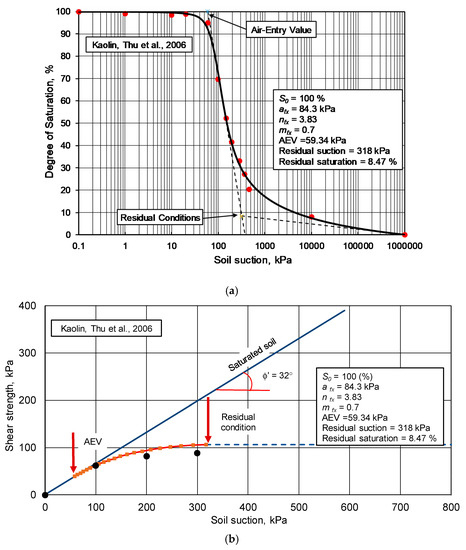
Figure 23.
S-SWCC along with the estimated and measured shear strength function for compacted kaolin [23]: (a) S-SWCC for compacted kaolin; (b) Estimated and measured shear strength function for compacted kaolin.
5.2.4. Other Data Sets
Published data appears to have provided a strong relationship between the main drying degree of saturation SWCC and the unsaturated shear strength envelope. There are also other supportive experimental data sets that may not be complete but do lend correlative support to the relationship between shear strength and the S-SWCC.
Nishimura, T., and Fredlund, D.G. (2002) [26] published results of the measurement of the SWCC on silt and kaolin soils but only measured shear strength near the residual suction range and higher. The SWCC on the silt soil showed an AEV of approximately 10 kPa and a residual suction of 500 kPa. The SWCC on the kaolin soil showed an AEV of approximately 100 kPa and a residual suction of 10,000 kPa. The results clearly showed essentially no strength gain in the region beyond residual suction.
Rassam and Cook (2002) [21] and Vilar (2006) [22] suggested the use of a hyperbolic function for the shear strength function, starting from the air-entry value of the soil. It was noted that the shear strength became essentially constant at residual suction conditions and suggested that the shear strength be measured in this region and be used as a reference (or anchor point) value for the shear strength function. The soil tested had an AEV of 30 kPa and a residual suction of approximately 700 kPa.
Further data sets involving the measurement of the S-SWCC and the shear strength envelope would clearly be useful. However, there appear to be sufficient data sets on a variety of soil types to conclude that there is a strong relationship between the anchor points (i.e., AEV and residual suction). It is suggested that sufficient experimental verification data has been presented to proceed with use of the Fredlund (2019) estimation procedure for most routine geotechnical engineering applications. It is also suggested that, to be conservative in the estimation process, the suction from a point 2/3rds of the way along the degree of saturation line be used as the assessed residual suction.
5.2.5. Anomalies and the Need for Further Research
It is also recommended that there should be an ongoing search to determine whether there might be other data sets involving the S-SWCC and measured shear strength envelopes that can be analyzed and used to further refine the estimation procedure.
There also appear to be some data sets that are hard to interpret within the framework of the proposed Fredlund (2019) relationship between the S-SWCC and measured shear strengths. One such example is the data collected from a detailed shear strength study reported by Cunningham et al. (2030). The unsaturated shear strength of the unsaturated soil specimens was measured using constant suction triaxial tests where suction was maintained through use of air circulation through a coarse porous disk at the base of the soil specimens. The soil was a reconstituted silty clay and the S-SWCC could be closely fit with the Fredlund and Xing (1994) equation [25] showing an inflection point, afx = 900 kPa, nfx = 2.5, and mfx = 1.0. The AEV was 423 kPa and the residual suction was 3830 kPa. The triaxial test results show an increase in strength up to a suction value of approximately 700 kPa. This would indicate that shear strength no longer increases, even prior to reaching an inflection point suction value, as indicated on the S-SWCC. Further study may be needed to fully understand the relationship between the shear strength of this soil and the S-SWCC.
6. Verification and Conclusions Using Experimental Data
The study of existing data sets shows that there is a relationship between the S-SWCC and the shear strength envelope for an unsaturated soil. The relationship quite closely adheres to the Fredlund (2019) construction procedure proposed for the estimation of the shear strength envelope. Verification was studied in terms of the: (i) boundary conditions that must be satisfied by the estimated shear strength function and (ii) the intermediate character (shape) of the shear strength envelope.
It can be concluded that the estimated shear strength envelope, calculated in accordance with the Fredlund (2019) proposed procedure, might be slightly higher than the values that are measured in some cases. Further data set assessments are welcomed but in the interim a reduced residual suction value might be appropriate. In other words, a suction value (i.e., about 2/3rds of the way to residual degree of saturation) can be used when estimating the unsaturated shear strength function.
Further data sets may provide refinement to the selection of the most appropriate residual suction value to use for the estimation of the unsaturated shear strength function from the S-SWCC; however, it appears the overall theoretical framework is sound.
Author Contributions
Conception and design of the research study were undertaken by D.G.F. Acquisition of data were conducted by T.P.A.T. Both authors analyzed and interpreted the data. Both authors have read and agreed to publish this manuscript.
Funding
The first author acknowledges the partial support of Hue University under the Core Research Program, Grant No. NCM.DHH.2018.03.
Institutional Review Board Statement
Not applicable.
Informed Consent Statement
Not applicable. No humans were involved as part of the study.
Data Availability Statement
This study does not report any raw data.
Acknowledgments
The critique of the analytical aspects and evaluation of theoretical aspects by Gilson Gitirana, Goiania, Brazil, is acknowledged.
Conflicts of Interest
The authors declare no conflict of interest.
References
- Fredlund, D.; Fredlund, M. Application of ‘Estimation Procedures’ in Unsaturated Soil Mechanics. Geoscience 2020, 10, 364. [Google Scholar] [CrossRef]
- Klute, A. Laboratory measurement of hydraulic conductivity of saturated soil. Methods Soil Anal. Part 1 Phys. Mineral. Prop. Incl. Stat. Meas. Sampl. 1965, 9, 210–221. [Google Scholar]
- Klute, A. Water retention: Laboratory methods. Methods Soil Anal. Part 1 Phys. Mineral. Prop. Incl. Stat. Meas. Sampl. 1986, 5, 635–662. [Google Scholar]
- Zhang, F.; Fredlund, D. Examination of the estimation of relative permeability for unsaturated soils. Can. Geotech. J. 2015, 52, 2077–2087. [Google Scholar] [CrossRef]
- Bishop, A.; Alpan, I.; Blight, G. Factors controlling the shear strenth of partly saturated coheslve soil. In ASCE Res. Conf. Shear Strength of Loheslve Soil. Univ. of Colordo, Boulder P; ASCE: New York, NY, USA, 1960. [Google Scholar]
- Fredlund, D.D. Determination of unsaturated soil property functions for engineering practice. In Proceedings of the 17th African Regional Conference on Soil Mechanics and Geotechnical Engineering, Cape Town, South Africa, 7–9 October 2019. [Google Scholar]
- Vanapalli, S.K.; Fredlund, D.E.; Pufahl, D.E.; Clifton, A.W. Model for the prediction of shear strength with respect to soil suction. Can. Geotech. J. 1996, 33, 379–392. [Google Scholar] [CrossRef]
- Vanapalli, S. Shear strength of unsaturated soils and its applications in geotechnical engineering practice. In Proceedings of the 4th Asia-Pacific Conference on Unsaturated Soils, New Castle, Australia, 23–25 November 2009. [Google Scholar]
- Fredlund, D.G.; Rahardjo, H.; Fredlund, M.D. Unsaturated Soil Mechanics in Engineering Practice; Wiley: Hoboken, NJ, USA, 2012. [Google Scholar]
- Satyanaga, A.; Rahardjo, H. Unsaturated shear strength of soil with bimodal soil-water characteristic curve. Géotechnique 2019, 69, 828–832. [Google Scholar] [CrossRef]
- Fredlund, D.G.; Morgenstern, N.R.; Widger, R.A. The shear strength of unsaturated soils. Can. Geotech. J. 1978, 15, 313–321. [Google Scholar] [CrossRef]
- Satija, B.S. Shear Behaviour of Partially Saturated Soils. Ph.D. Thesis, IIT Delhi, New Delhi, India, 1978. [Google Scholar]
- Drnevich, V.; Gan, K.; Fredlund, D. Multistage Direct Shear Testing of Unsaturated Soils. Geotech. Test. J. 1988, 11, 132. [Google Scholar] [CrossRef]
- Taylor, D.W. Fundamentals of Soil Mechanics. Soil Sci. 1948, 66, 161. [Google Scholar] [CrossRef]
- Garven, E.A.; Vanapalli, S.K. Evaluation of Empirical Procedures for Predicting the Shear Strength of Unsaturated Soils. In Proceedings of the Unsaturated Soils 2006, Carefree, Arizona, 2–6 April 2006; pp. 2570–2592. [Google Scholar] [CrossRef]
- Bao, C.G.; Gong, B.-W.; Zhan, L.-T. Properties of unsaturated soils and slope stability of expansive soils. In Proceedings of the Second International Conference on Unsaturated Soils—UNSAT98, Beijing, China, 27–30 August 1998. [Google Scholar]
- Fredlund, D.G.; Xing, A.; Fredlund, M.D.; Barbour, S.L. The relationship of the unsaturated soil shear strength to the soil-water characteristic curve. Can. Geotech. J. 1996, 33, 440–448. [Google Scholar] [CrossRef]
- Guan, G.S.; Rahardjo, H.; Choon, L.E. Shear Strength Equations for Unsaturated Soil under Drying and Wetting. J. Geotech. Geoenvironmental Eng. 2010, 136, 594–606. [Google Scholar] [CrossRef]
- Khalili, N.; Khabbaz, M.H. A unique relationship for χ for the determination of the shear strength of unsaturated soils. Géotechnique 1998, 48, 681–687. [Google Scholar] [CrossRef]
- Chaney, R.; Demars, K.; Öberg, A.; Sällfors, G. Determination of Shear Strength Parameters of Unsaturated Silts and Sands Based on the Water Retention Curve. Geotech. Test. J. 1997, 20, 40. [Google Scholar] [CrossRef]
- Rassam, D.W.; Cook, F. Predicting the shear strength envelope of unsaturated soils. Geotech. Test. J. 2002, 25, 215–220. [Google Scholar]
- Vilar, O.M. A simplified procedure to estimate the shear strength envelope of unsaturated soils. Can. Geotech. J. 2006, 43, 1088–1095. [Google Scholar] [CrossRef]
- Thu, T.M.; Rahardjo, H.; Leong, E.-C. Effects of Hysteresis on Shear Strength Envelopes from Constant Water Content and Consolidated Drained Triaxial Tests. In Proceedings of the Unsaturated Soils 2006, Carefree, Arizona, 2–6 April 2006; pp. 1212–1222. [Google Scholar] [CrossRef]
- Vanapalli, S.; Sillers, W.; Fredlund, M. The meaning and relevance of residual state to unsaturated soils. In Proceedings of the 51st Canadian Geotechnical Conference, Sn, Edmonton, AB, Canada, 4–7 October 1998. [Google Scholar]
- Fredlund, D.; Xing, A. Equations for the soil-water characteristic curve. Can. Geotech. J. 1994, 31, 521–532. [Google Scholar] [CrossRef]
- Nishimura, T.; Fredlund, D.G. Hysteresis effects resulting from drying and wetting under relatively dry conditions. In Proceedings of the Third International Conference on Unsaturated Soils, UNSAT 2002, Recife, Brazil, 10–13 March 2002. [Google Scholar]
- Donald, I. Shear strength measurements in unsaturated non-cohesive soils with negative pore pressures. In Proceedings of the 2nd Australian and New Zealand Conference on Soil Mechanics and Foundation Engineering, Canterbury, New Zealand, 27 September 1956. [Google Scholar]
- Escario, V.; Juca, J.; Coppe, M. Strength and deformation of partly saturated soils. In Congrès International de Mécanique des Sols et des Travaux de Fondations; A.A. Balkema: Rotterdam, The Netherlands, 1989. [Google Scholar]
- Tran, D.T.Q.; Chan, D.H.; Fredlund, D.G. Reassessment of Soil Suction at the Evaporation Rate Reduction Point for Saturated-Unsaturated Soil Surfaces. In Geo-Congress 2014: Geo-Characterization and Modeling for Sustainability; American Society of Civil Engineers: Atlanta, Georgia, 2014; pp. 4084–4096. [Google Scholar] [CrossRef]
- Tran, D.T.; Fredlund, D.G.; Chan, D.H. Improvements to the calculation of actual evaporation from bare soil surfaces. Can. Geotech. J. 2016, 53, 118–133. [Google Scholar] [CrossRef]
Publisher’s Note: MDPI stays neutral with regard to jurisdictional claims in published maps and institutional affiliations. |
© 2021 by the authors. Licensee MDPI, Basel, Switzerland. This article is an open access article distributed under the terms and conditions of the Creative Commons Attribution (CC BY) license (http://creativecommons.org/licenses/by/4.0/).