Geochemical and Mineralogical Characterization of Construction Materials from Historical Buildings of Ferrara (Italy)


Abstract

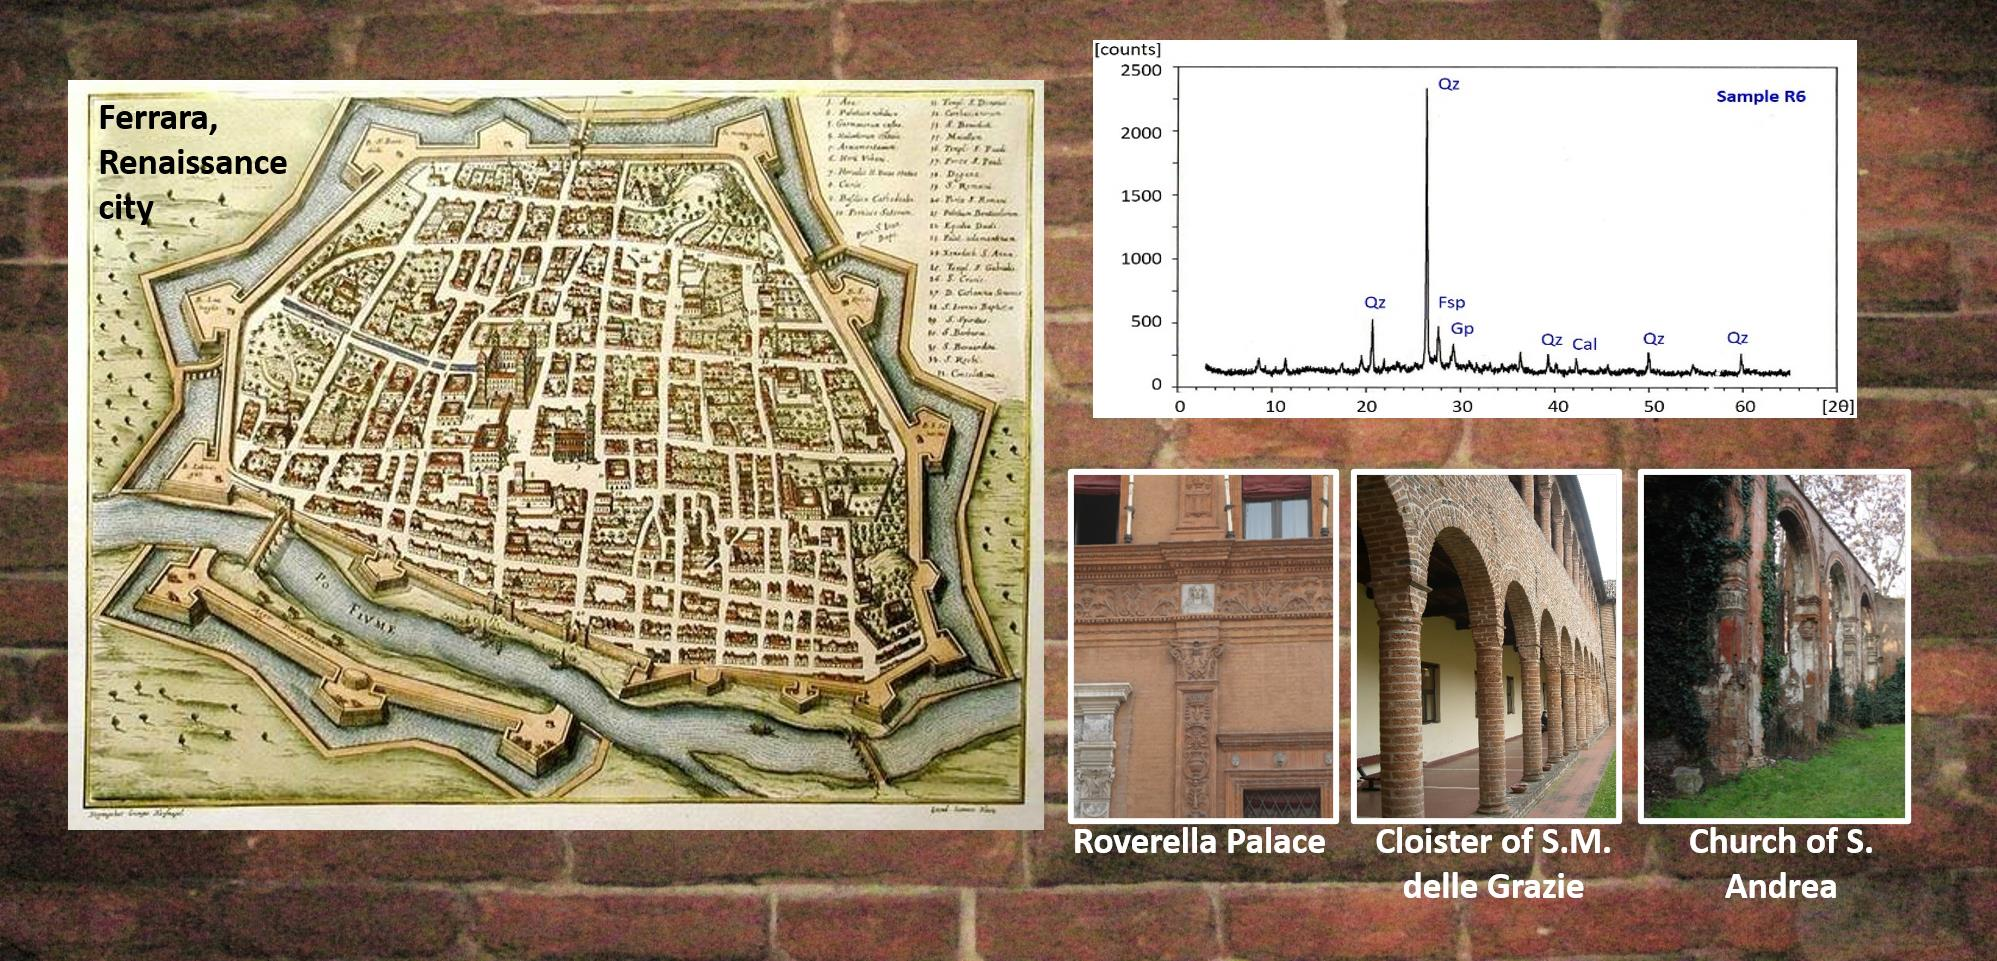
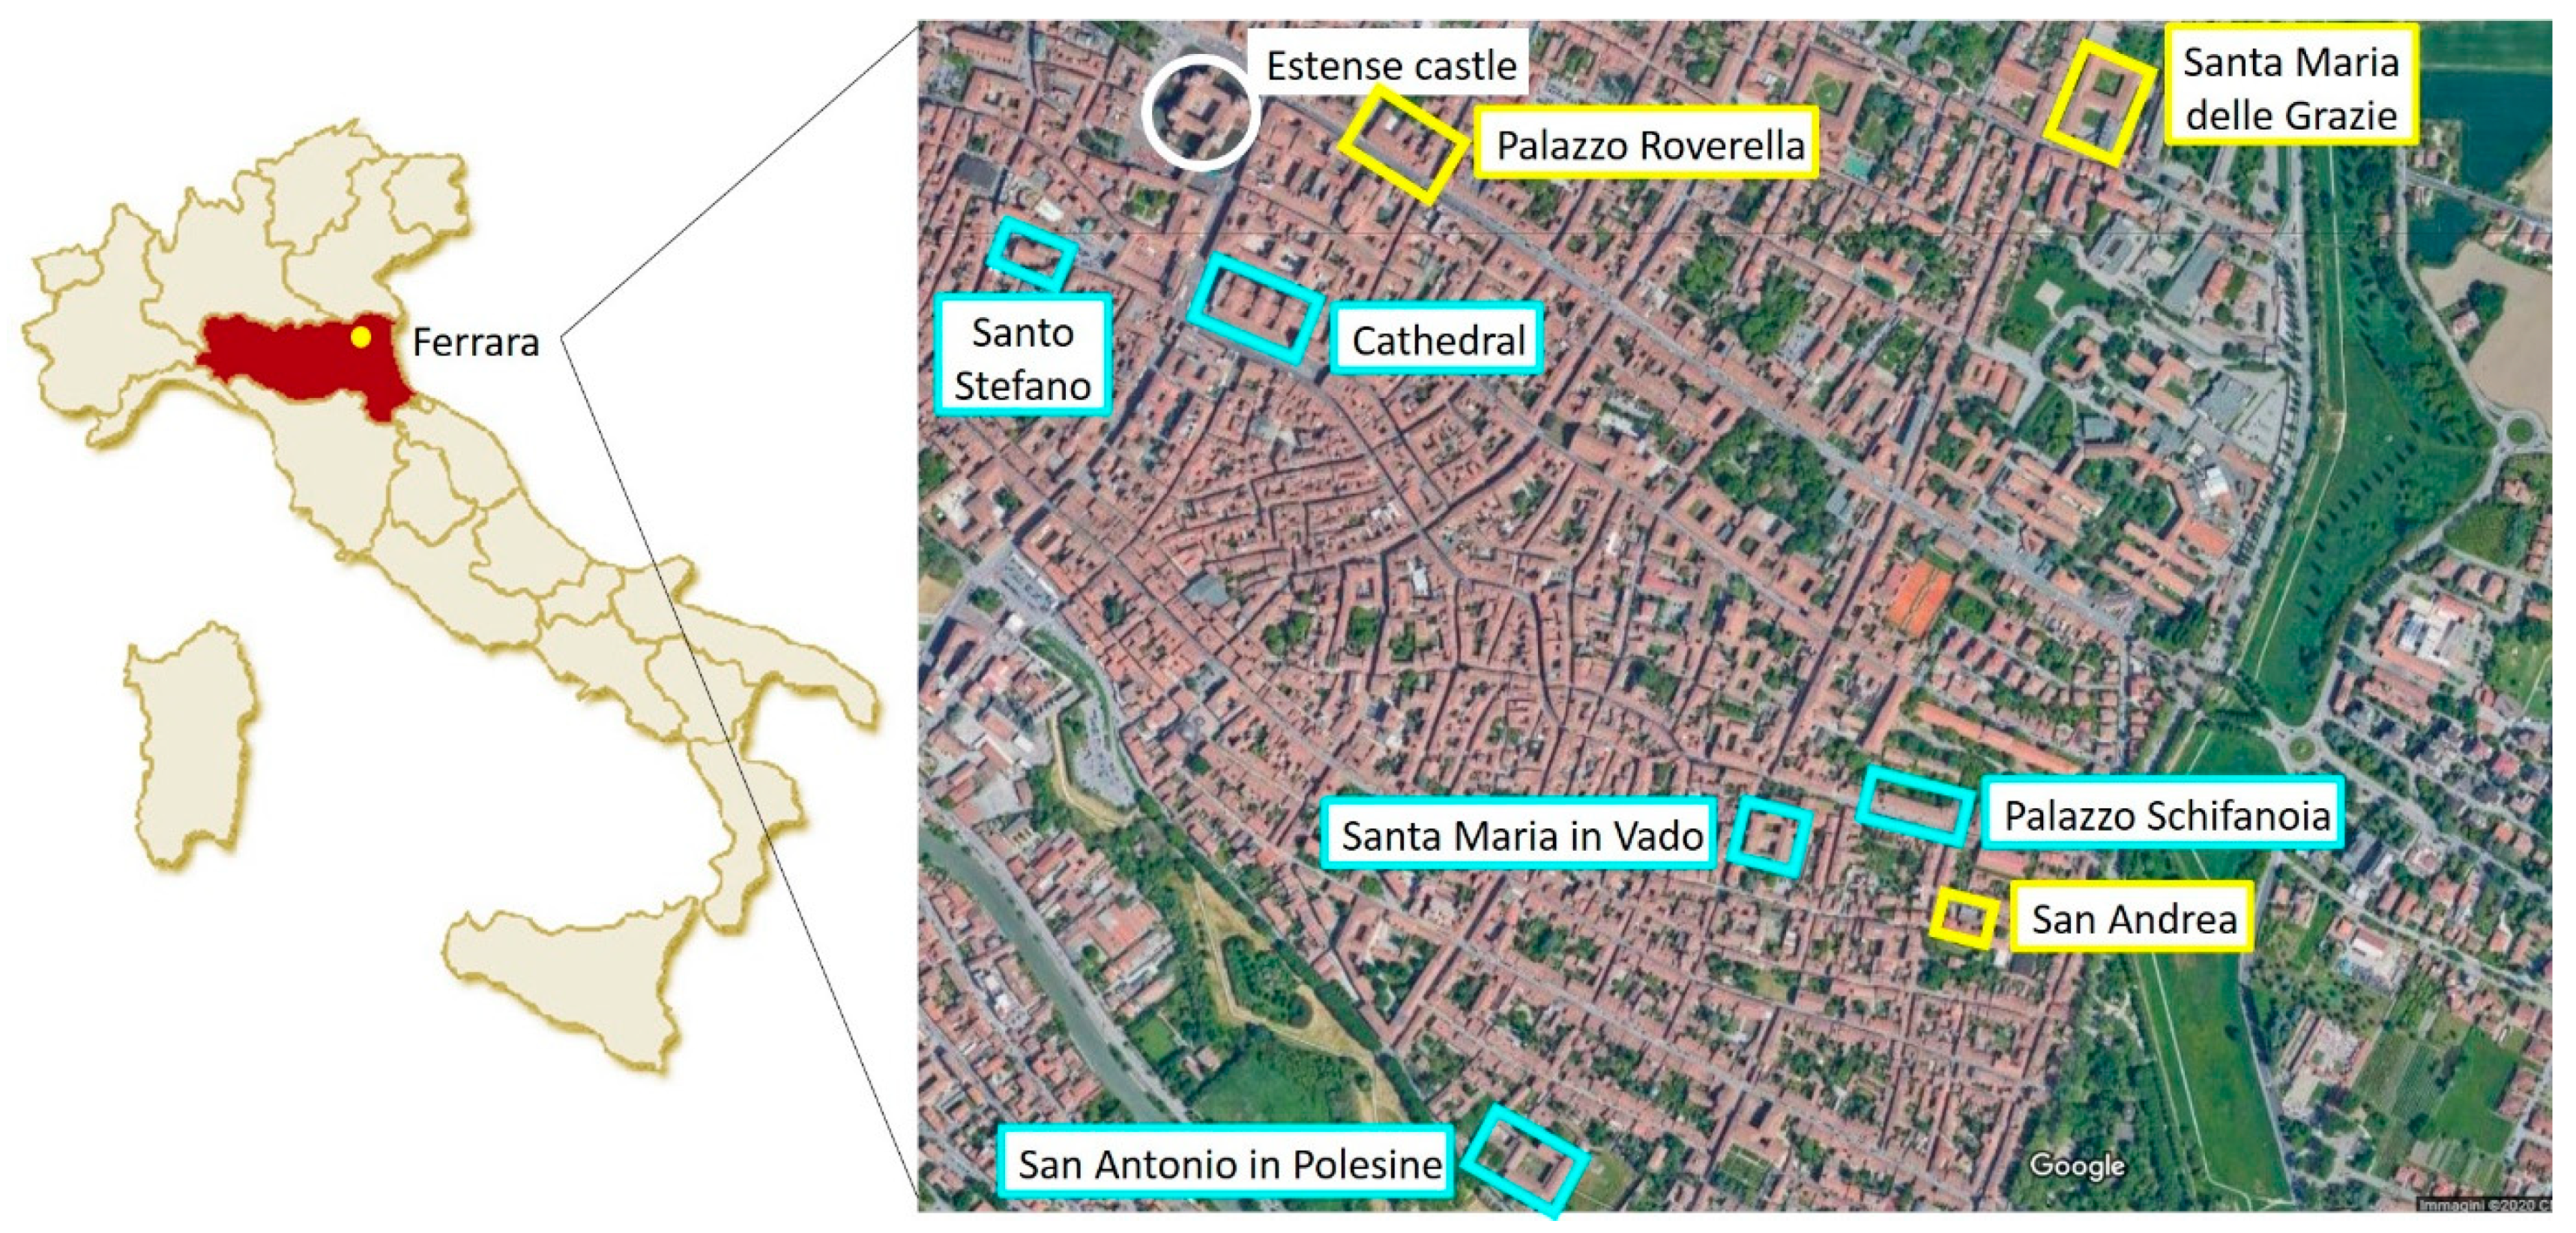
1. Introduction
2. Materials and Methods
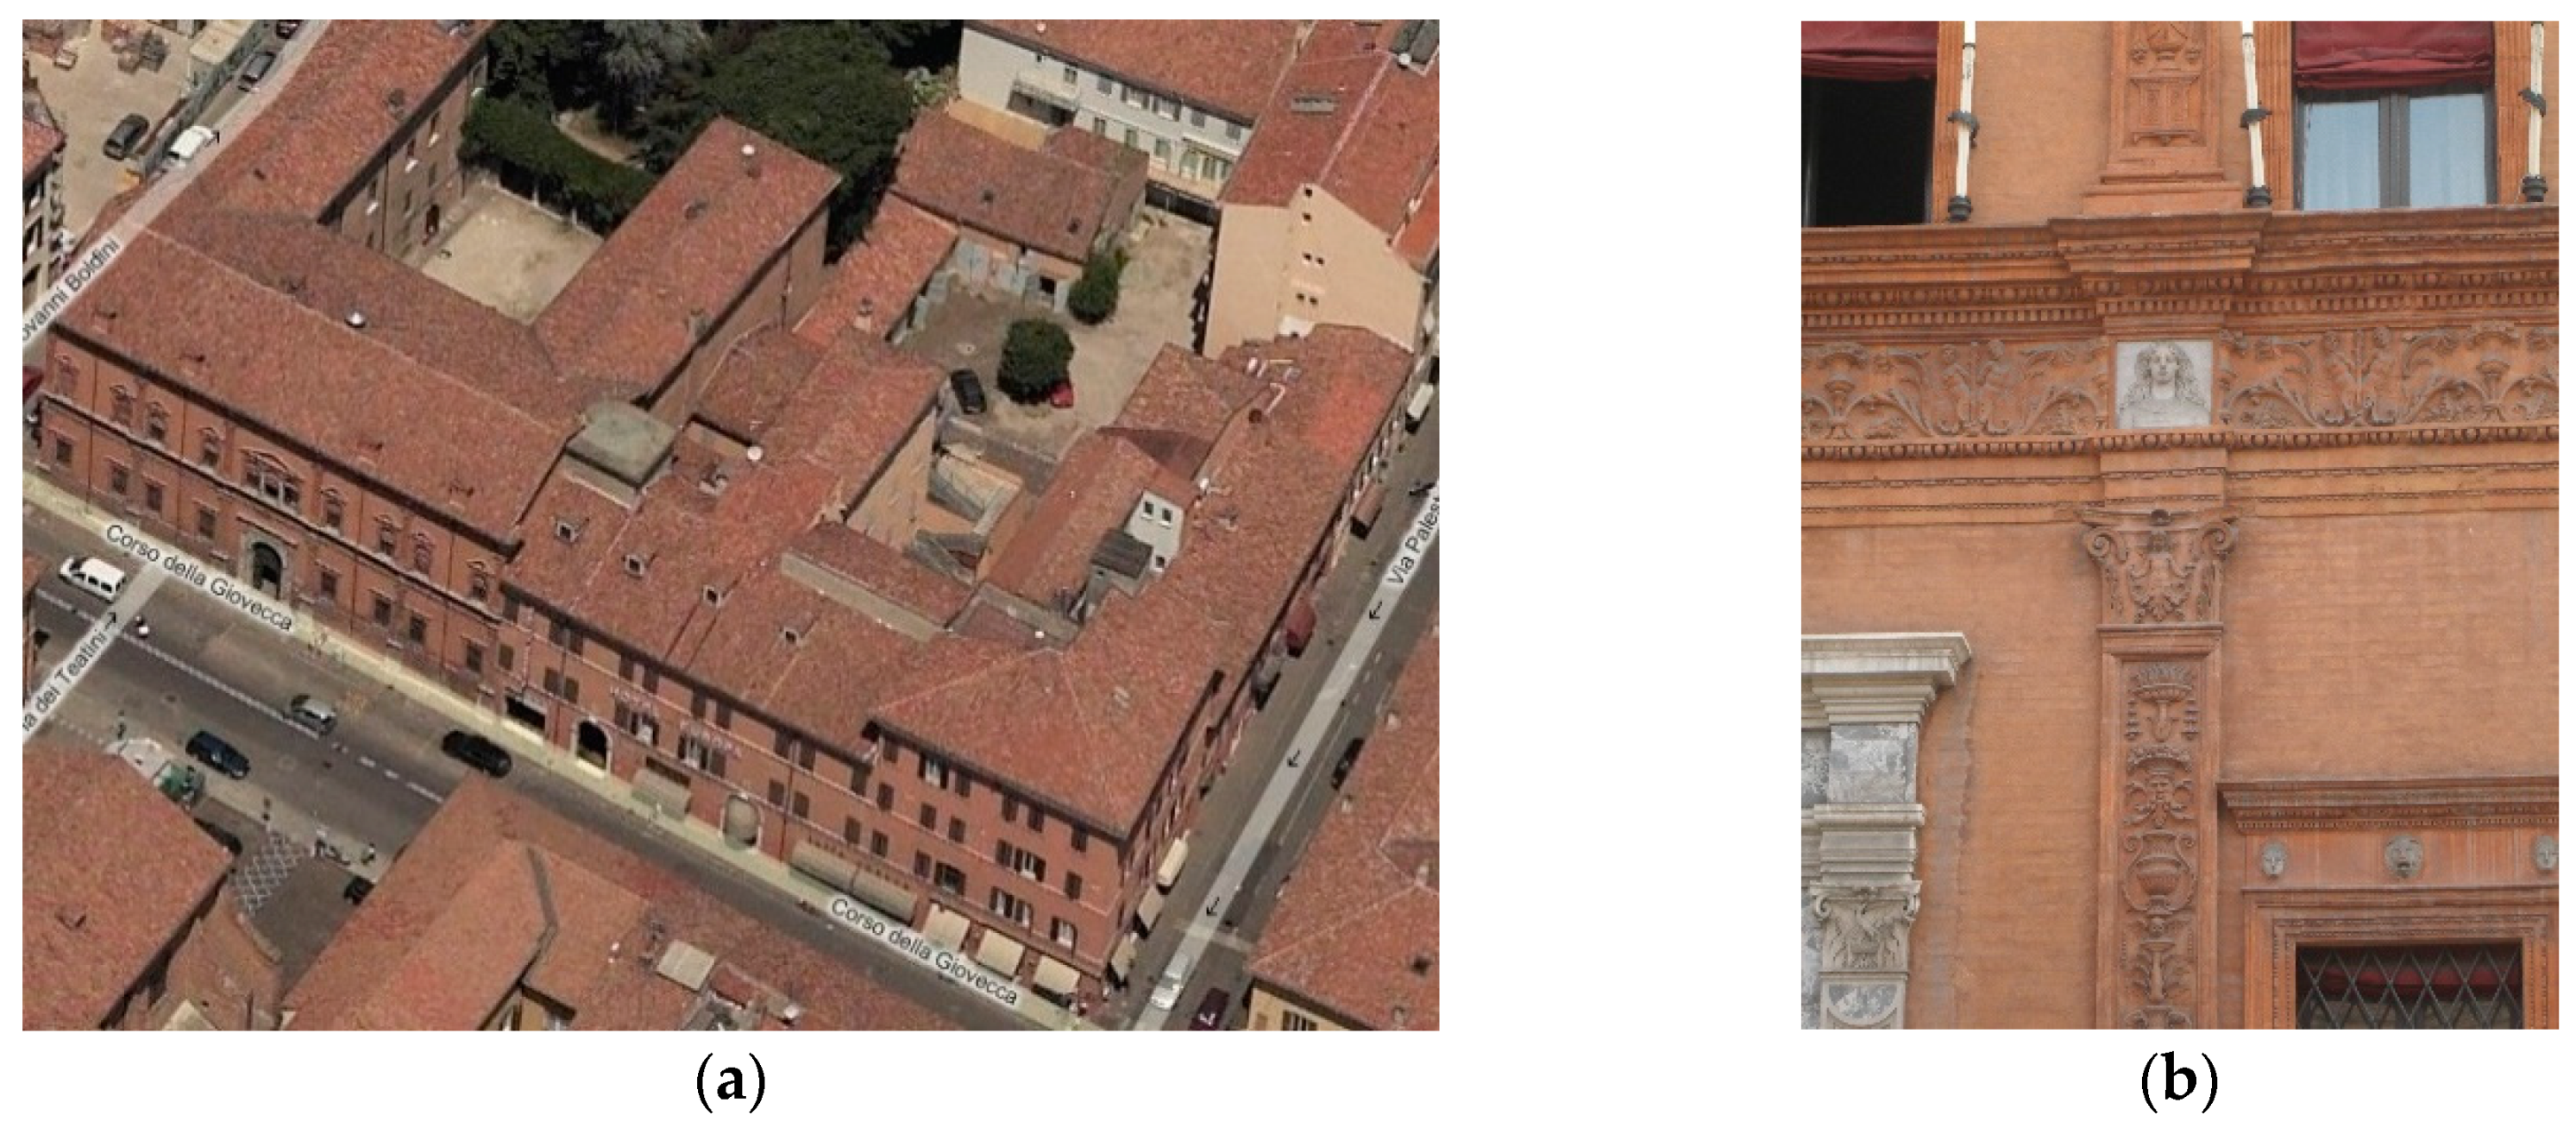
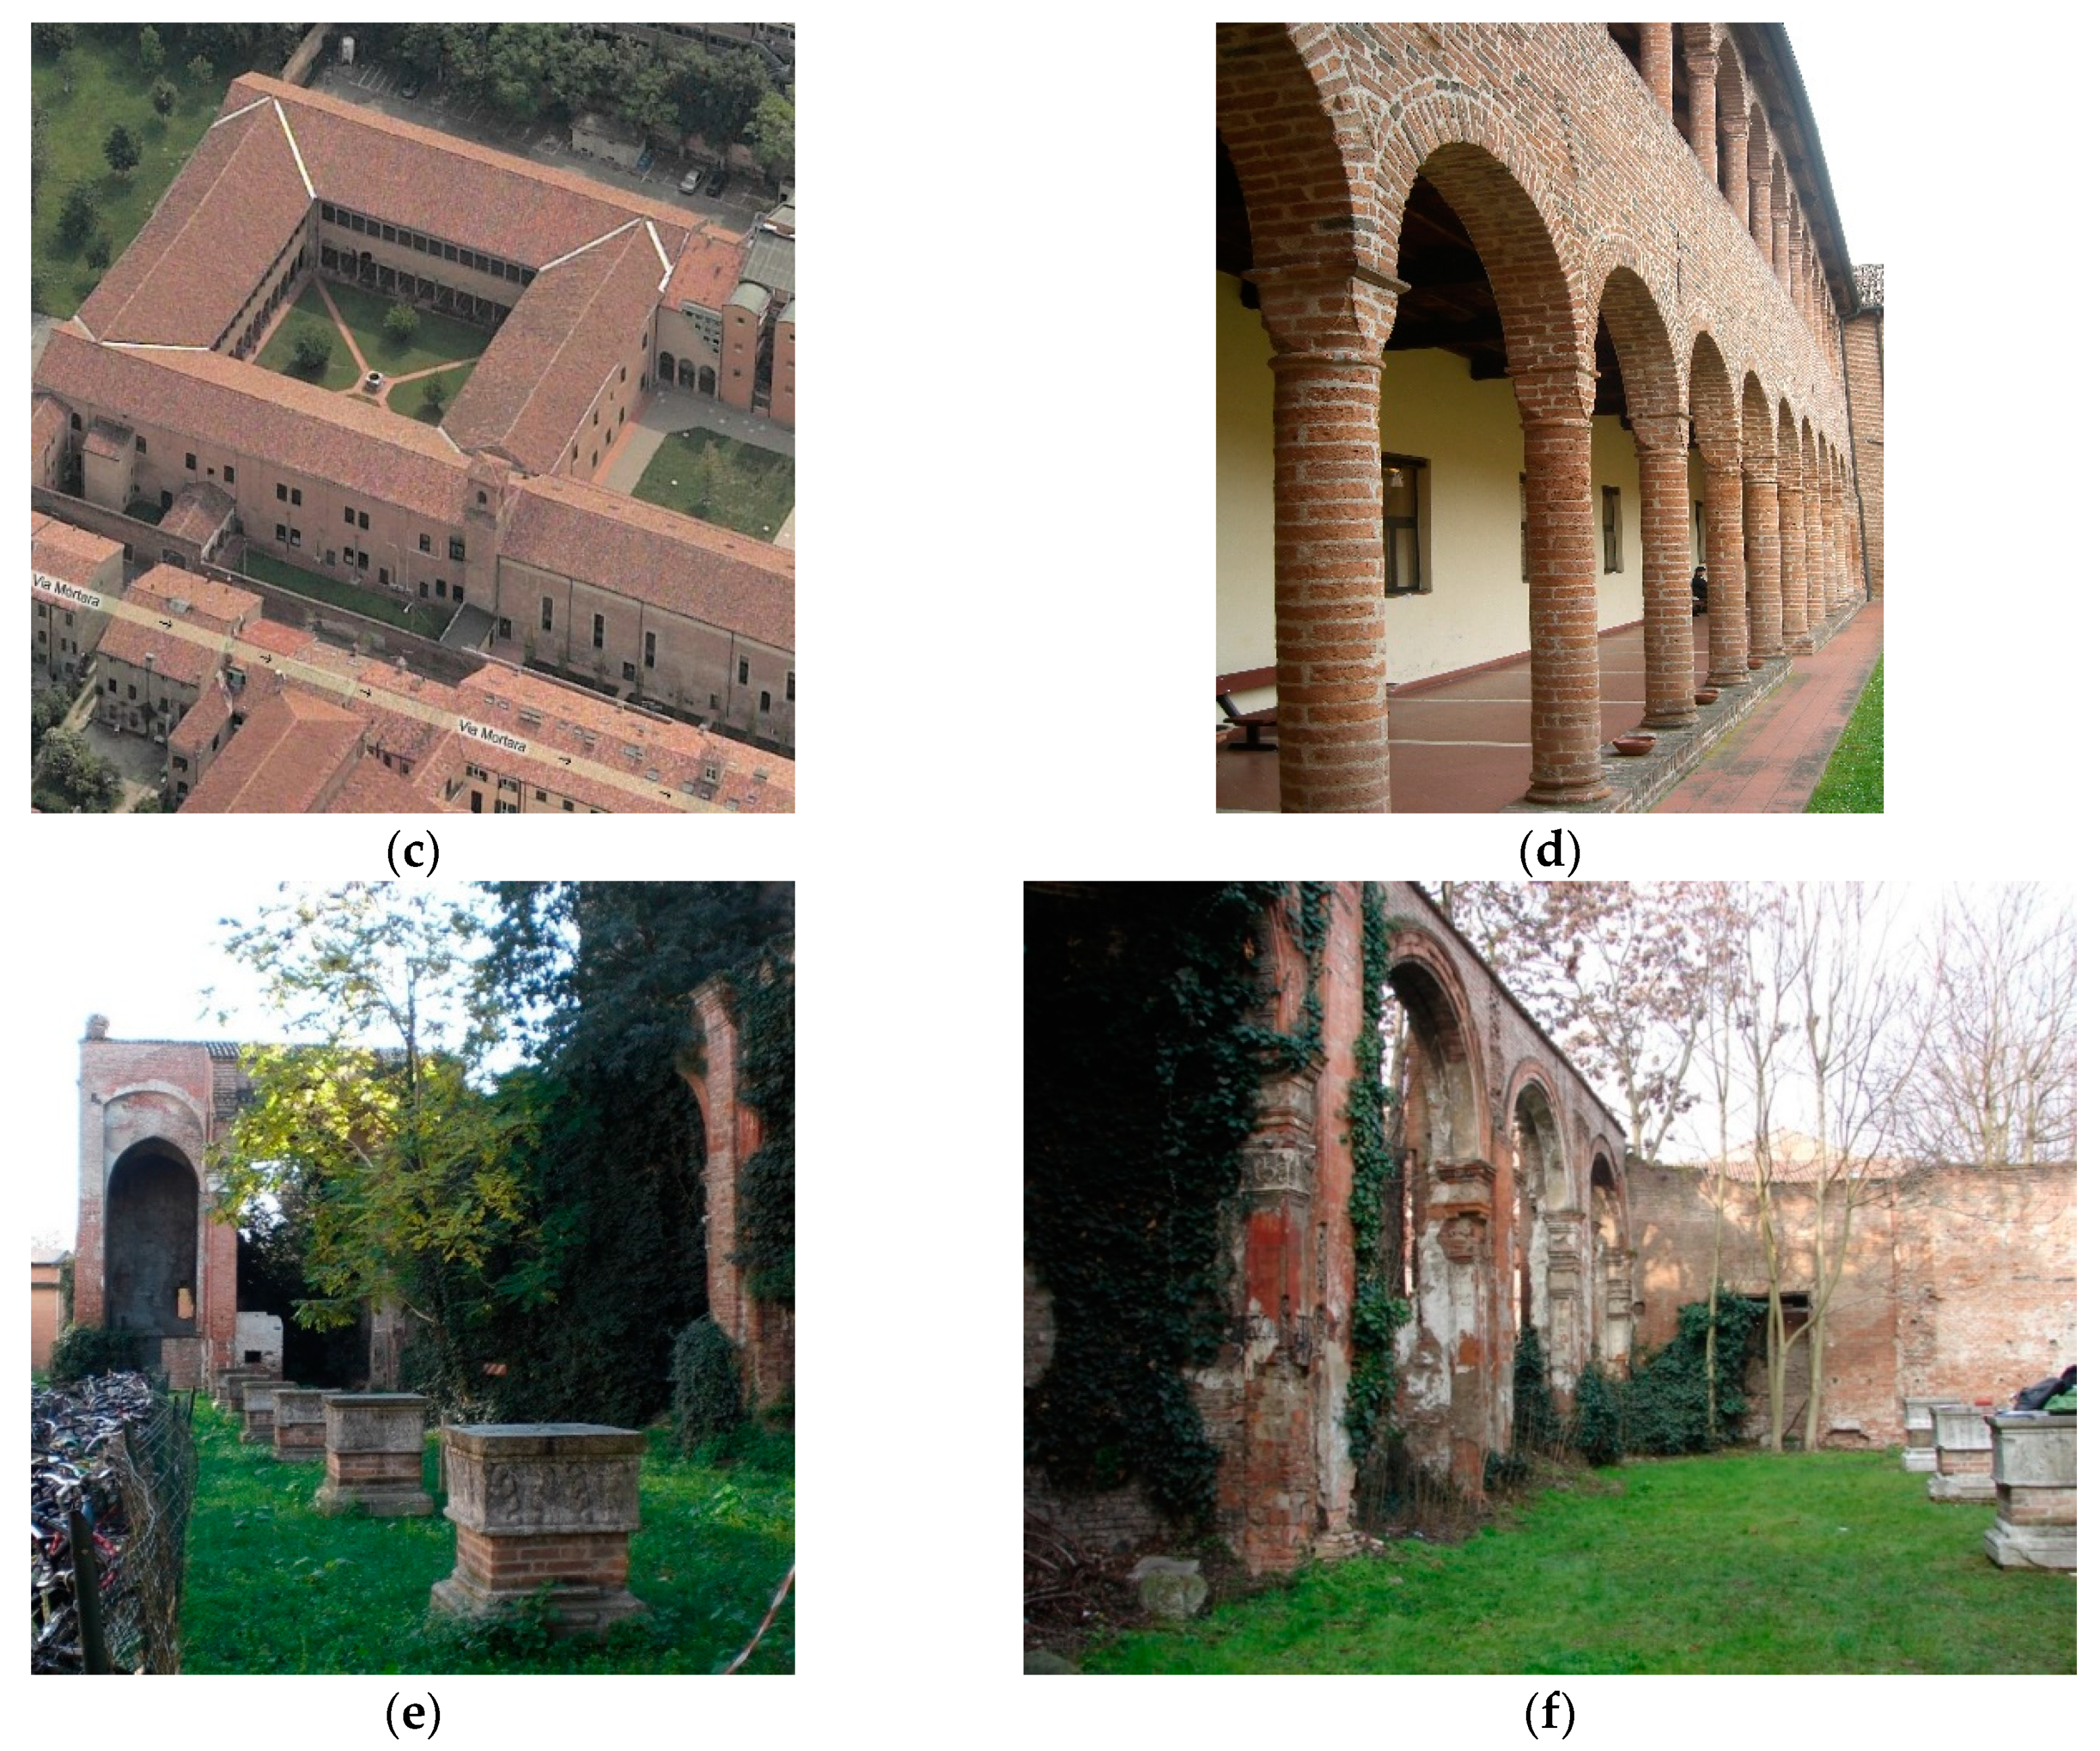
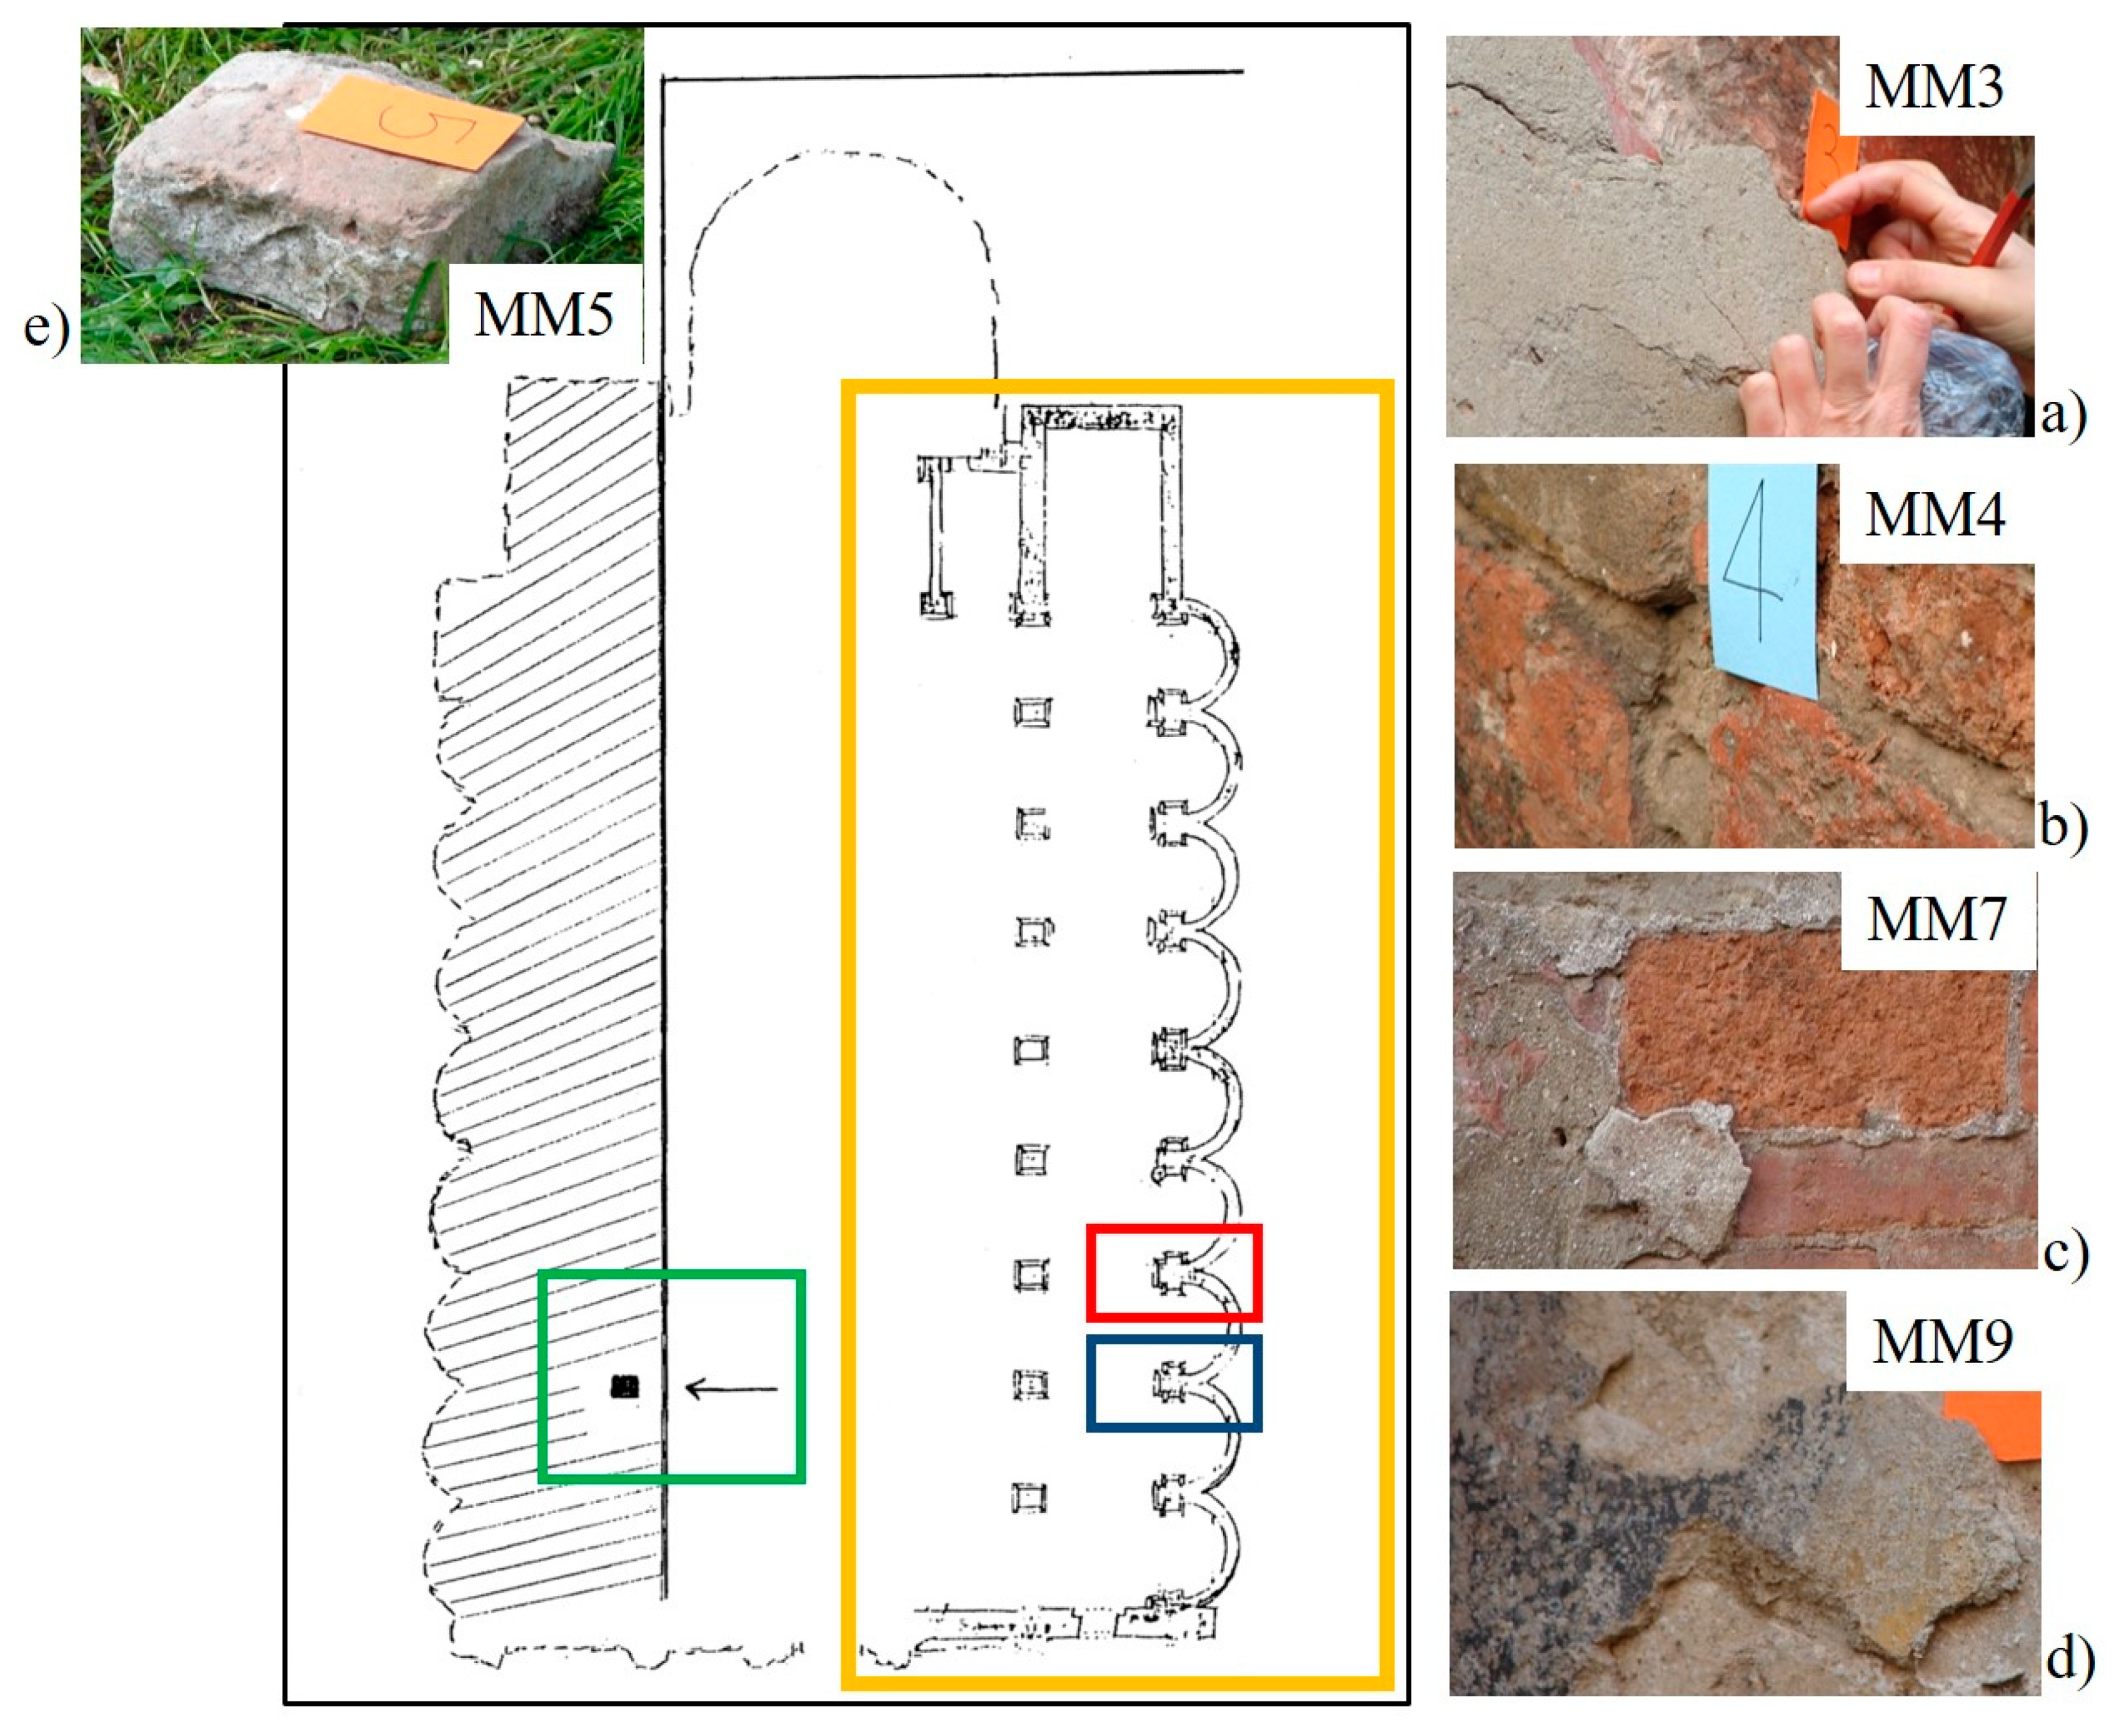
2.1. Sampling
- the remains of the church of San Andrea dating back to around the year 1000 (Figure 2e,f).
2.2. Chemical Analysis
3. Results
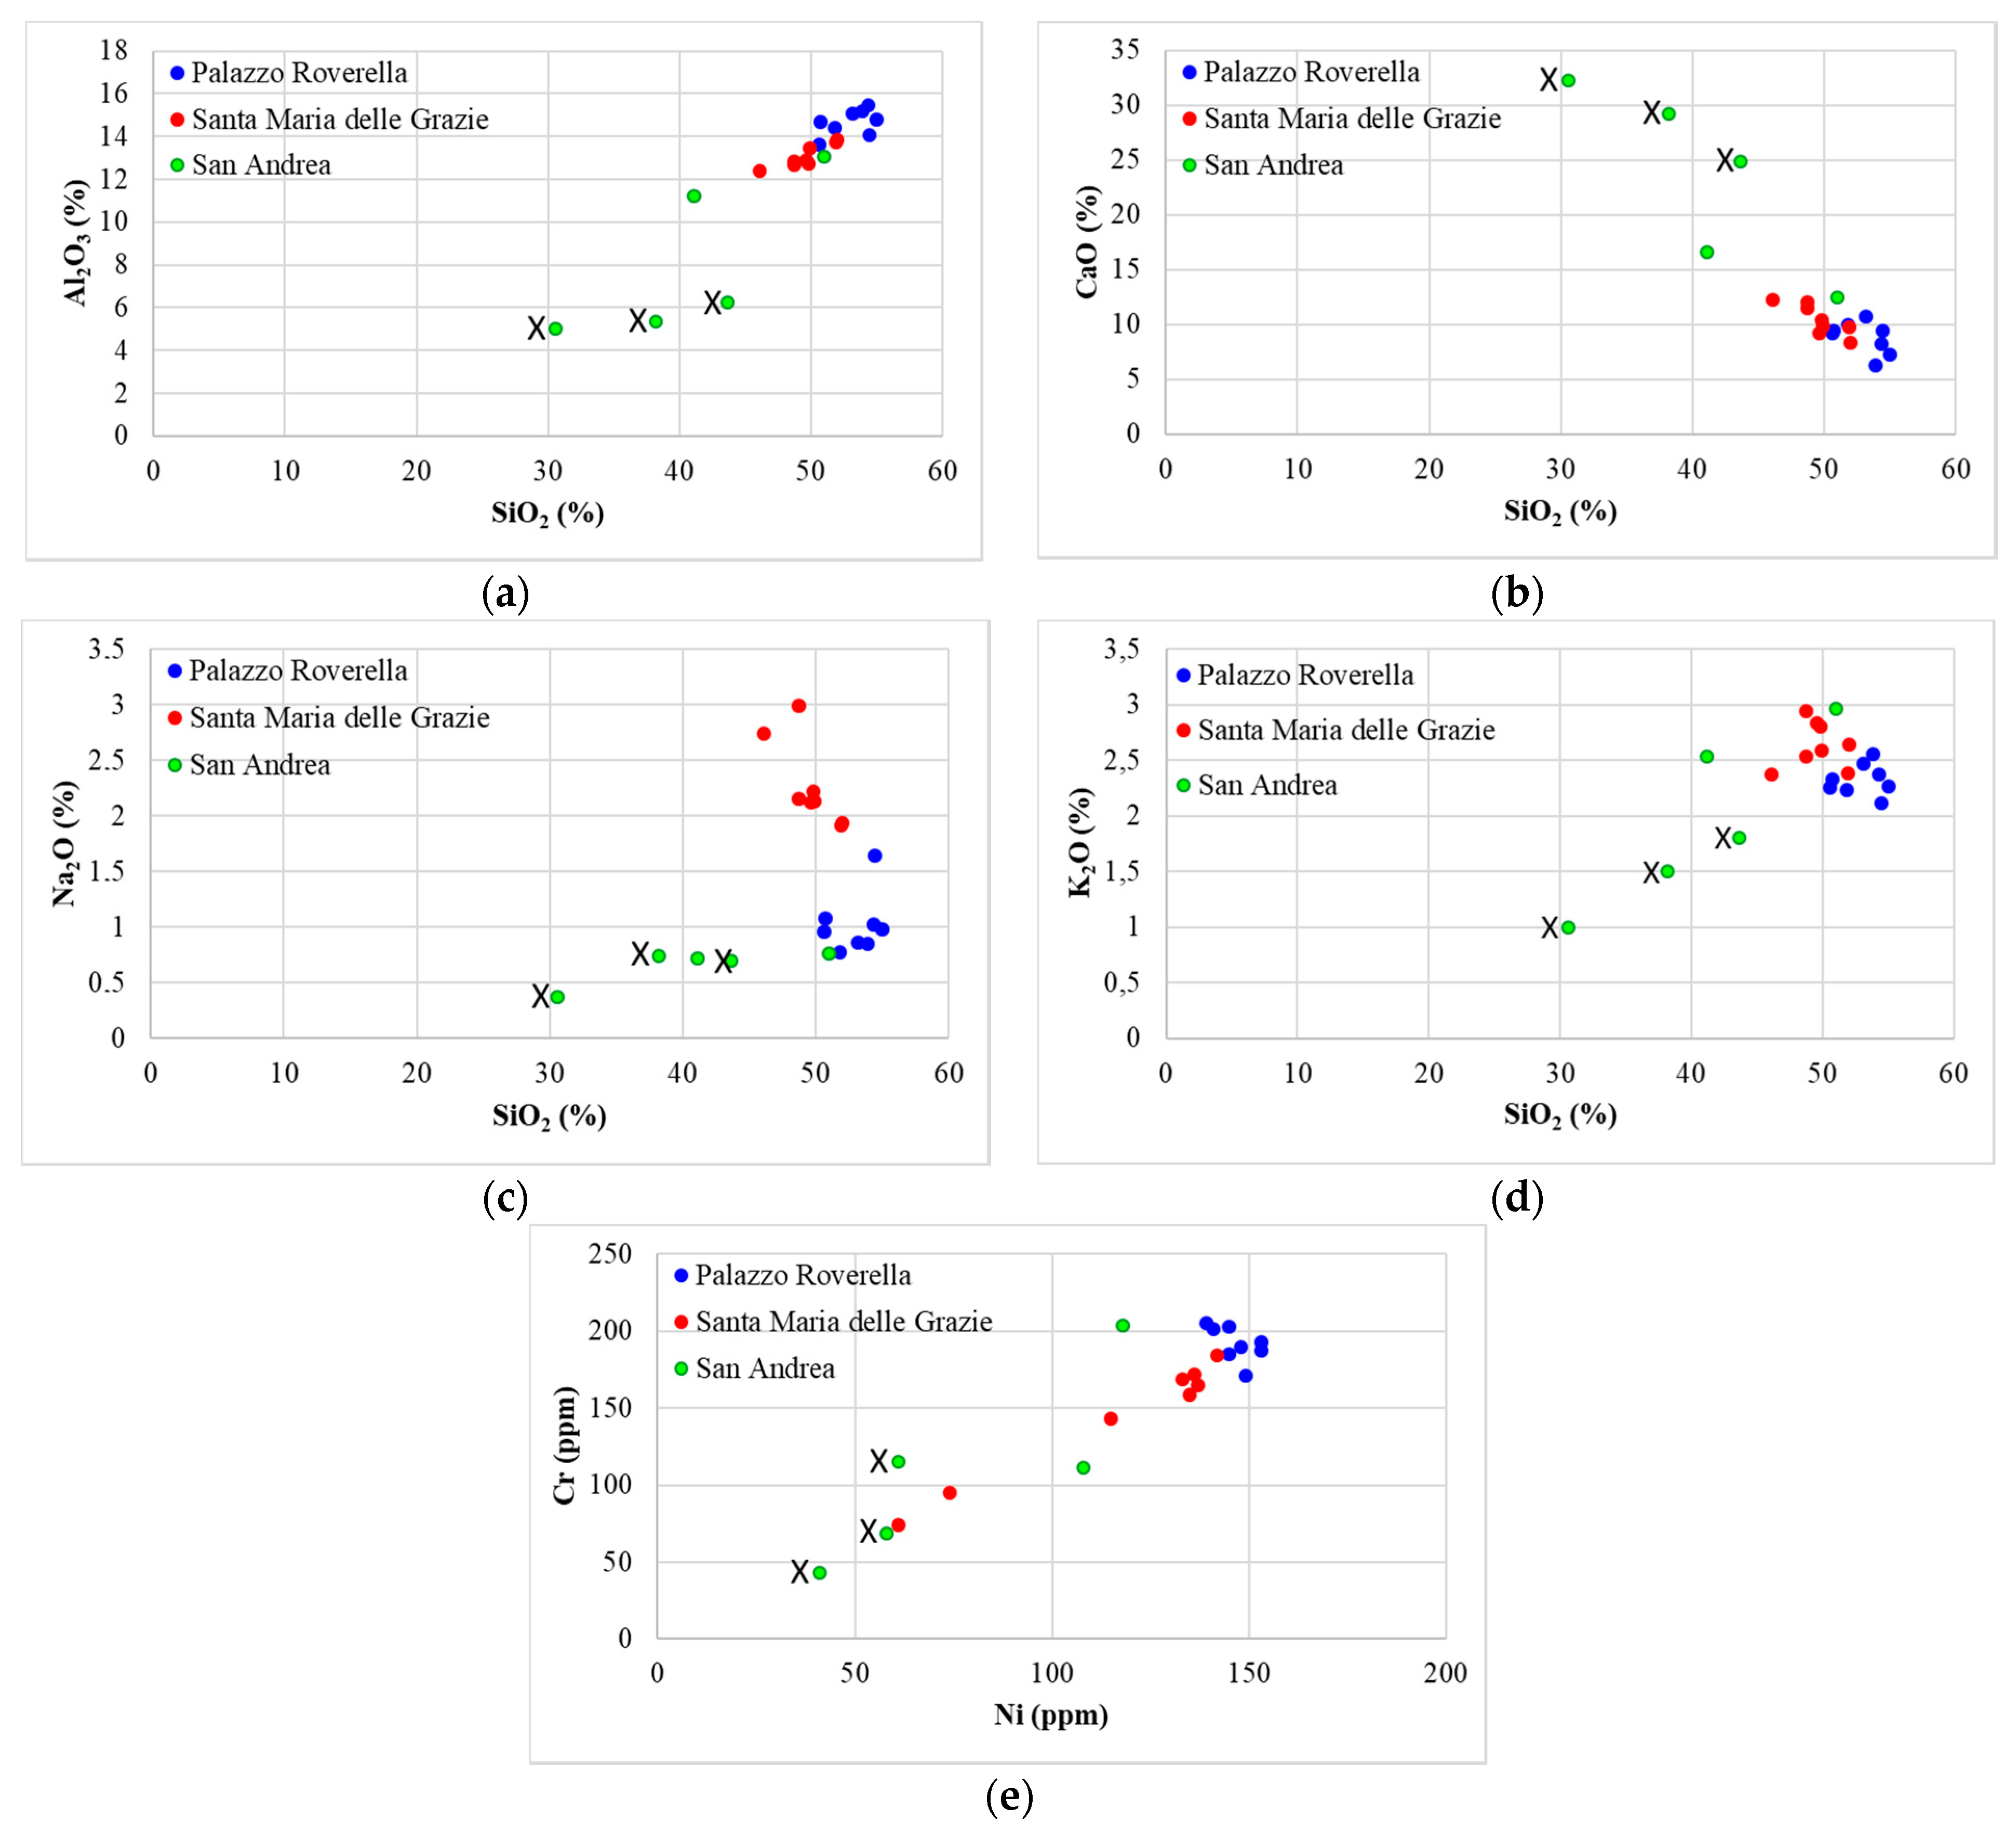
3.1. XRF Analyses
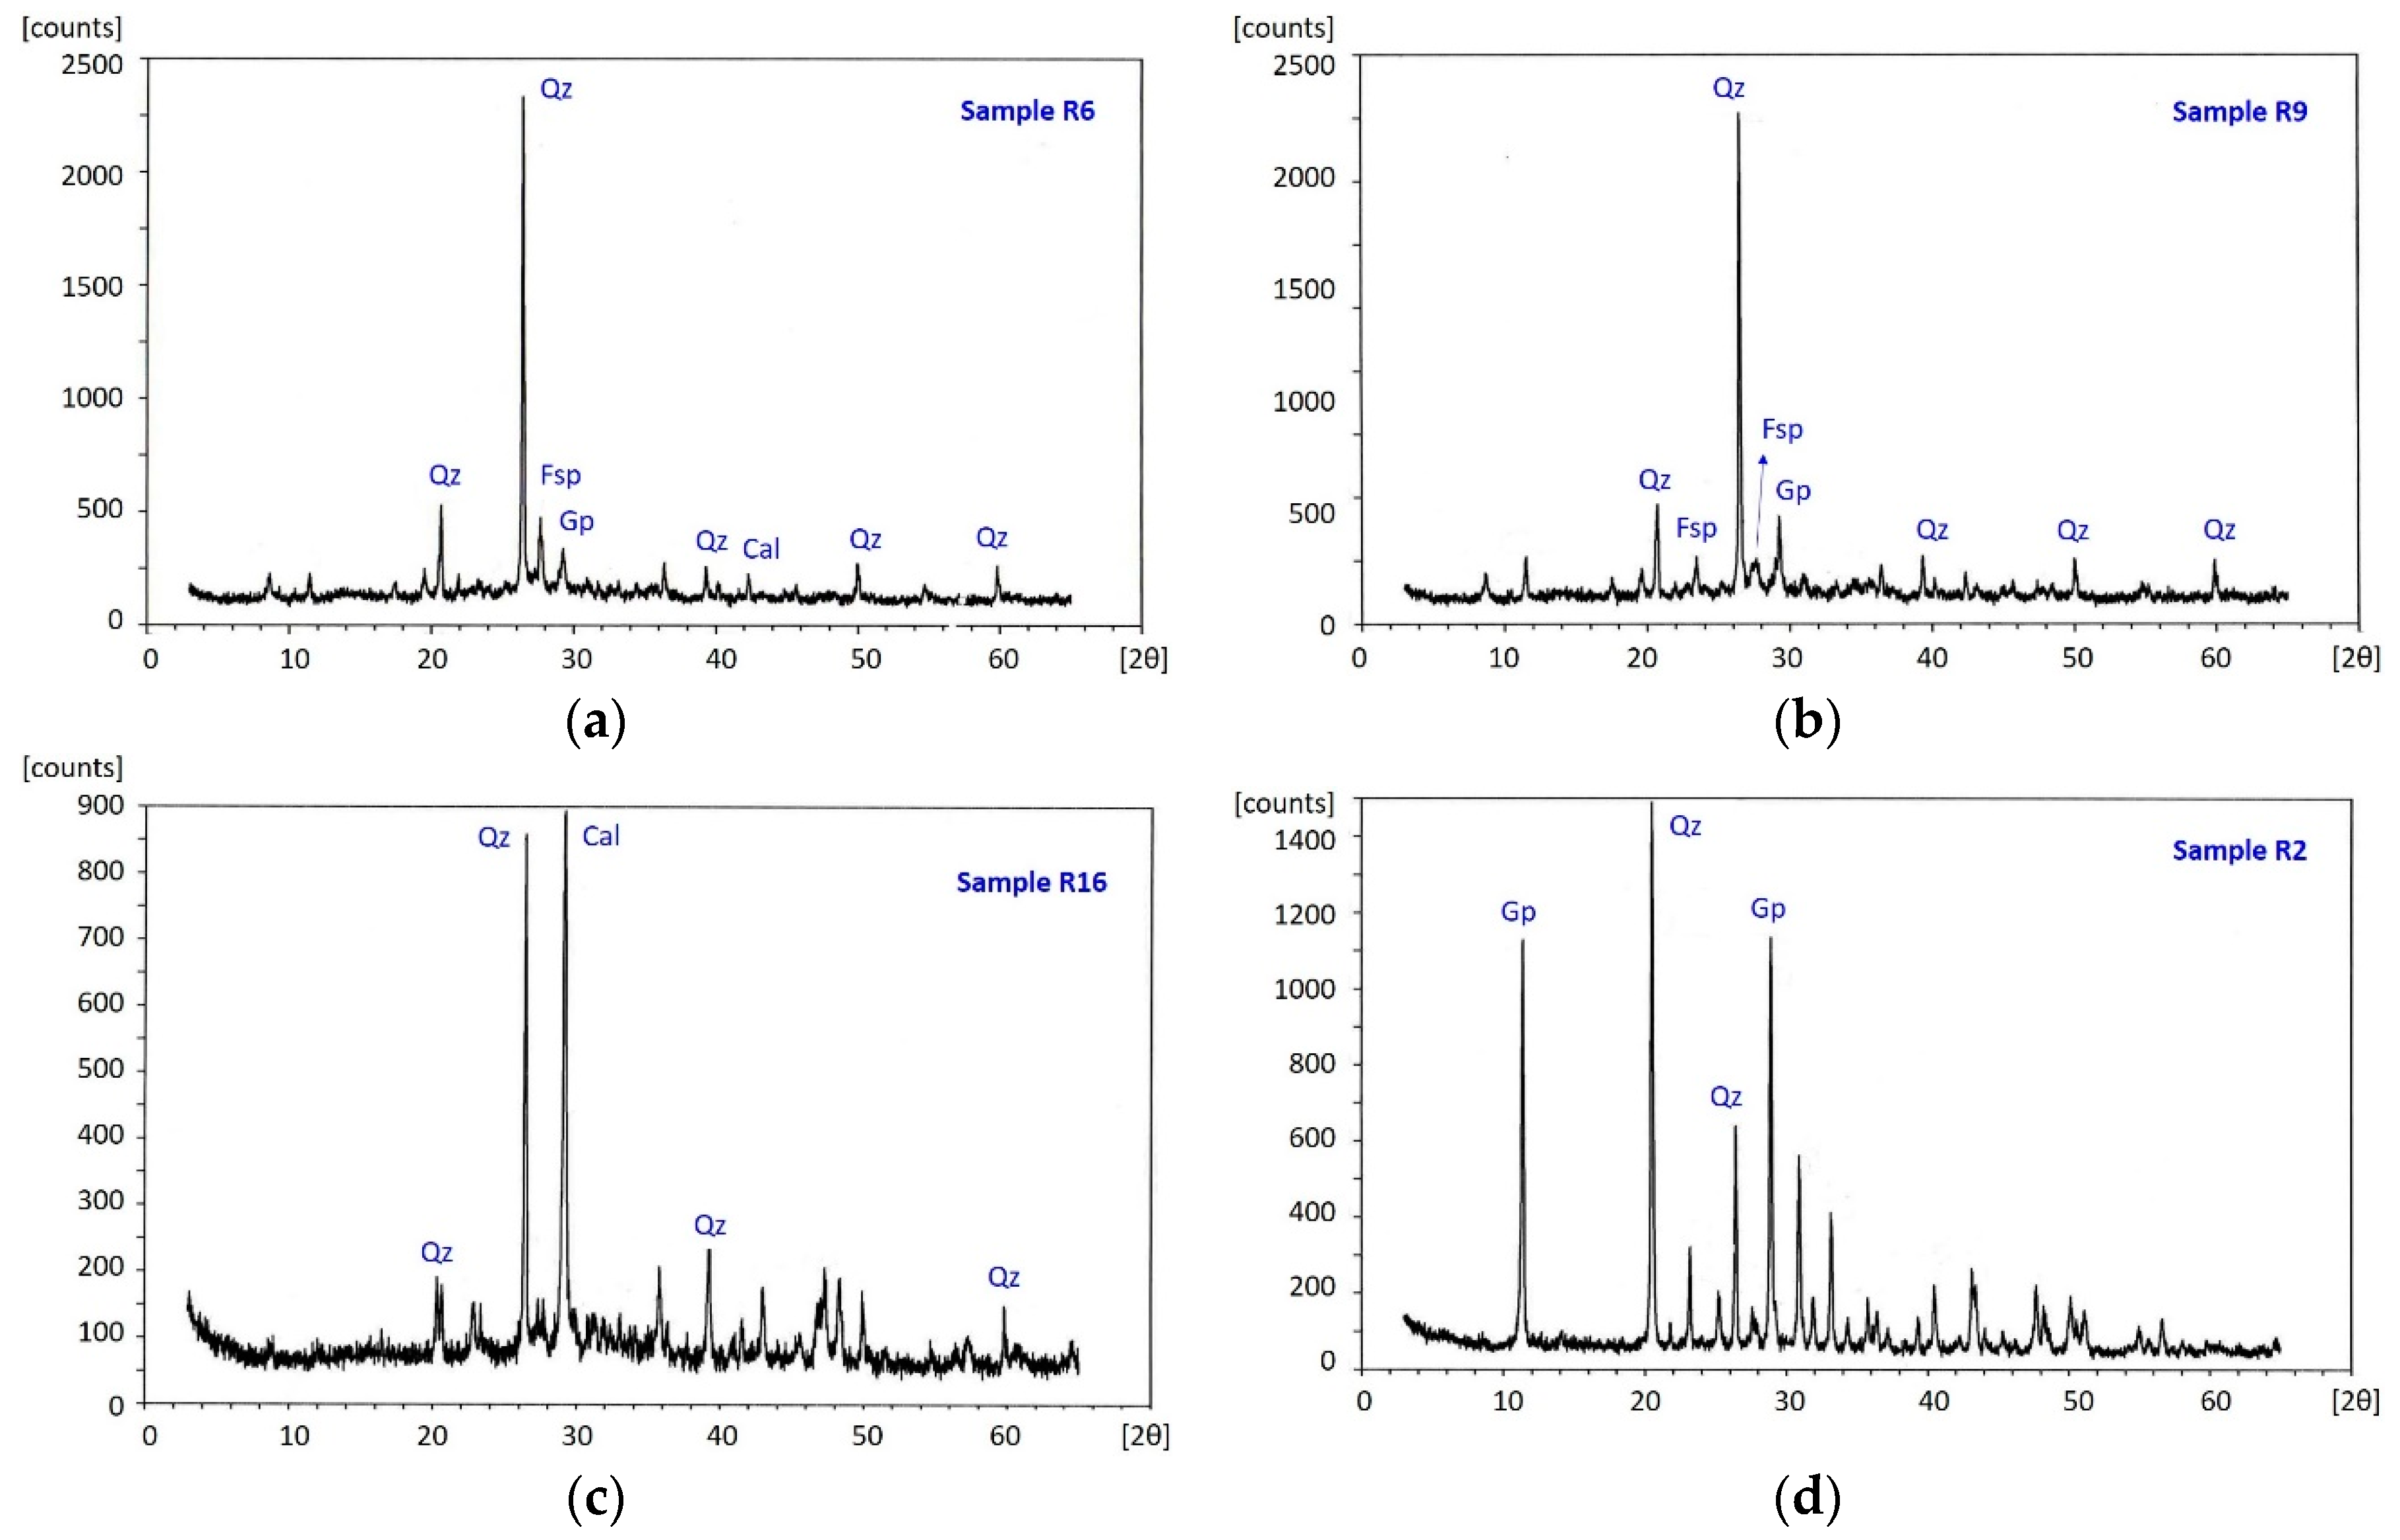
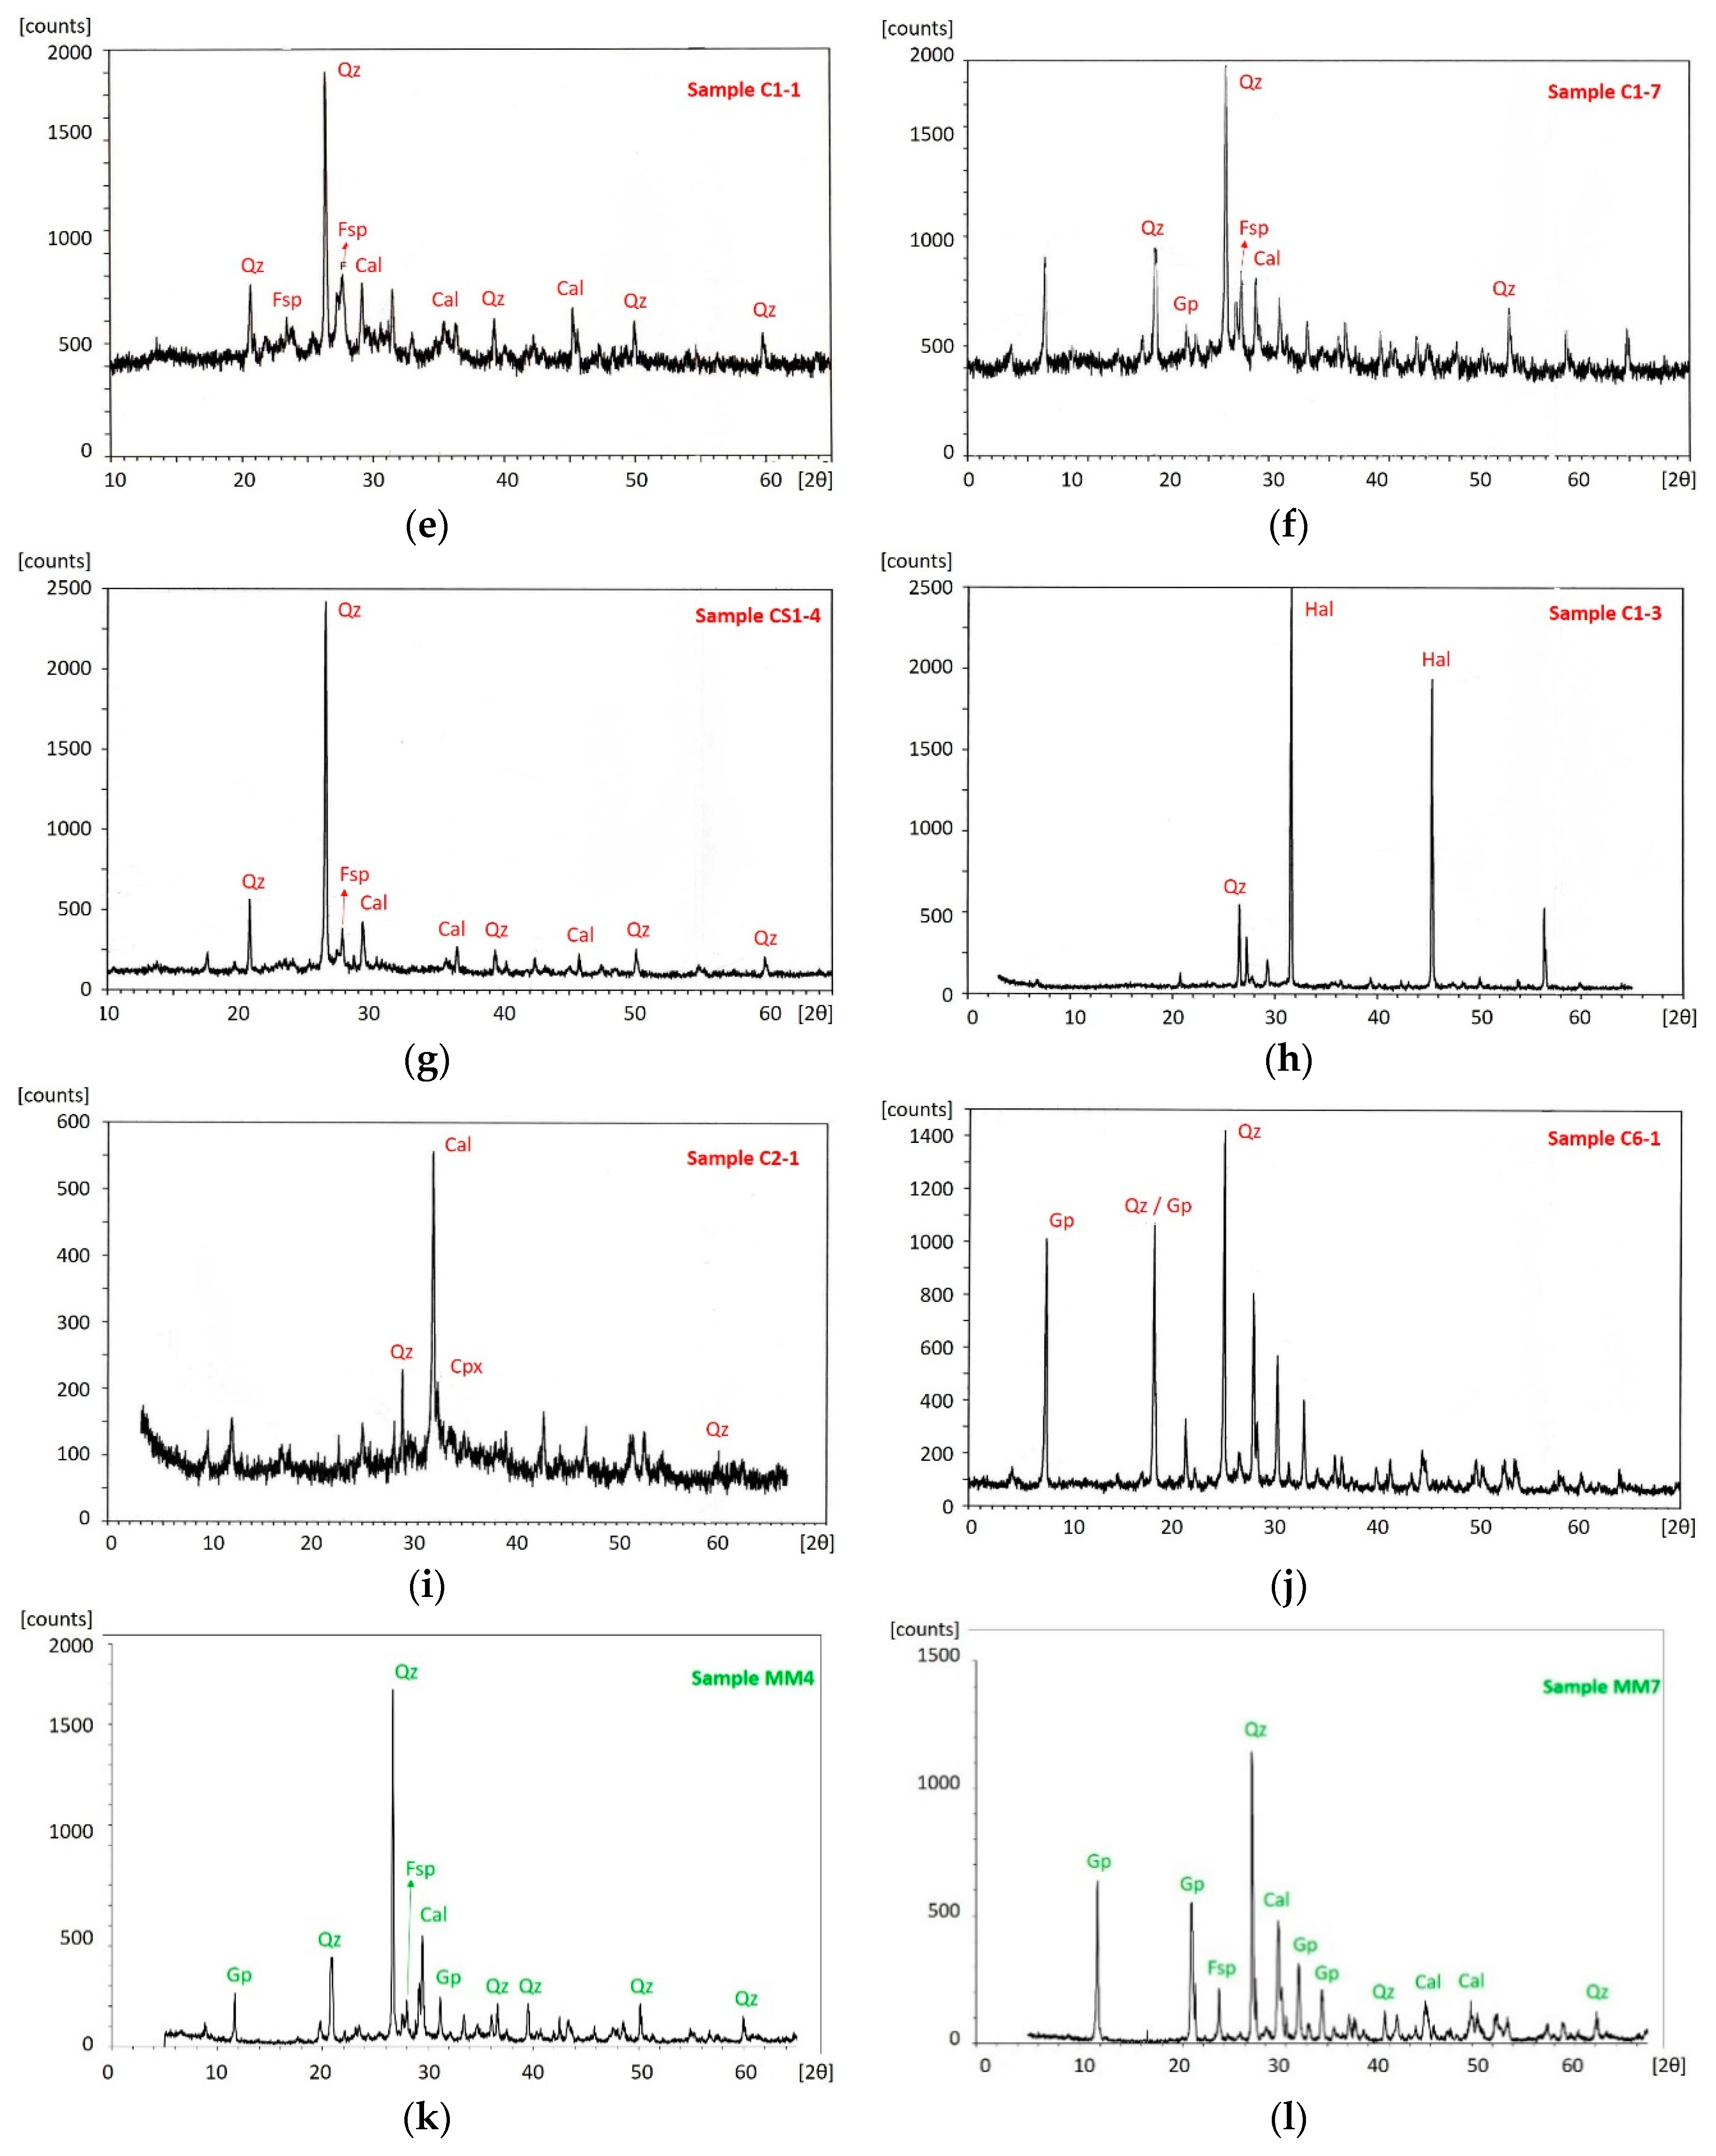
3.2. XRPD Analyses
4. Discussion
5. Conclusions
Author Contributions
Funding
Acknowledgments
Conflicts of Interest
References
- UNSECO. Ferrara, City of the Renaissance, and Its Po Delta. Available online: https://www.unesco.beniculturali.it/en/projects/ferrara-citta-del-rinascimento-e-il-delta-del-po/ (accessed on 26 October 2020).
- Iotti, R. Estensi, Prima Parte: La Corte di FERRARA; Il Bulino: Modena, Italy, 1997. [Google Scholar]
- Rosenberg, C.M. The Este Monuments and Urban Development in Renaissance Ferrara; Cambridge University Press: Cambridge, UK, 1997. [Google Scholar]
- McIver, K.A.; Rosenberg, C.M. The Este Monuments and Urban Development in Renaissance Ferrara. Sixt. Century J. 1998, 29, 121. [Google Scholar] [CrossRef]
- McIver, K.A. The Este Monuments and Urban Development in Renaissance Ferrara. Renaiss. Stud. 1999, 13, 230–233. [Google Scholar] [CrossRef]
- Dean, T. Land and Power in Late Medieval Ferrara: The Rule of the Este, 1350–1450; Cambridge University Press: Cambridge, UK, 1987. [Google Scholar]
- Guarnieri, C. Archeologia urbana a Ferrara e nel ferrarese; le ultime scoperte. In Uno Sguardo sul Passato. Archeologia nel Ferrarese; Berti, F., Ed.; All’Insegna del Giglio: Florence, Italy, 1995; pp. 183–206. [Google Scholar]
- Frizzi, A. Memorie per la Storia di Ferrara; Abbam Servadio: Ferrara, Italy, 1791. [Google Scholar]
- Frizzi, A. Memorie per la Storia di Ferrara: Diario di Antonio Frizzi in continuazione delle memorie per la storia di Ferrara; Abbam Servadio: Ferrara, Italy, 1858. [Google Scholar]
- Ceccarelli, F.; Marchesi, A.; De Norcen, M.T.S. Biagio Rossetti 1444–1516, Architettura e Documenti; Bononia University Press: Bologna, Italy, 2019. [Google Scholar]
- Farinelli, A.; Scafuri, F. Ferrara VII-XX Secolo. Trasformazioni, Addizioni, Ampliamenti; Comune di Ferrara: Ferrara, Italy, 1991. [Google Scholar]
- Zevi, B. Saper Vedere L’urbanistica. Ferrara di Biagio Rossetti, la Prima Città Moderna Europea; Einaudi: Turin, Italy, 1971. [Google Scholar]
- Marciano, A.F. L’età di Biagio Rossetti: Rinascimenti di Casa d’Este; Corbo: Ferrara, Italy, 1991. [Google Scholar]
- Genta, L. Il Palazzo Magnanini detto Roverella e Il Circolo dei Negozianti; Pineda: Ferrara, Italy, 1947. [Google Scholar]
- Guarini, M.A. Compendio Historico Dell’Origine, Accrescimento e Prerogative delle Chiese e Luoghi pii Della Città e Diocesi di Ferrara; Eredi Baldini: Ferrara, Italy, 1621. [Google Scholar]
- Scalabrini, G.A. Memorie Storiche Della Chiesa di Ferrara e dei Suoi Borghi; Coatti: Ferrara, Italy, 1773. [Google Scholar]
- Giordano, B. Il Monastero Agostiniano di Santa Maria delle Grazie Detto di Mortara; Deputazione Provinciale Ferrarese di Storia Patria, Atti e Memorie: Ferrara, Italy, 2000; pp. 15–30. [Google Scholar]
- Marzola, M. Per la Storia Della Chiesa Ferrarese nel Secolo XVI (1497–1590); Società Editrice Internazionale: Turin, Italy, 1976. [Google Scholar]
- Barotti, C. Iscrizioni sepolcrali e civili di Ferrara. Manoscritto Biblioteca Comunale Ariostea Mignani, cl. 528.
- Medri, G. Chiese di Ferrara nella Cerchia Antica; Banca di credito Agrario di Ferrara: Bologna, Italy, 1967. [Google Scholar]
- Frahm, E.; Doonan, R. The technological versus methodological revolution of portable XRF in archaeology. J. Archaeol. Sci. 2013, 40, 1425–1434. [Google Scholar] [CrossRef]
- Gómez-Laserna, O.; Arrizabalaga, I.; Prieto-Taboada, N.; Olazabal, M.A.; Arana, G.; Madariaga, J.M. In situ DRIFT, Raman, and XRF implementation in a multianalytical methodology to diagnose the impact suffered by built heritage in urban atmospheres. Anal. Bioanal. Chem. 2015, 407, 5635–5647. [Google Scholar] [CrossRef] [PubMed]
- Hormes, J.; Diekamp, A.; Klysubun, W.; Bovenkamp, G.-L.; Börste, N. The characterization of historic mortars: A comparison between powder diffraction and synchrotron radiation based X-ray absorption and X-ray fluorescence spectroscopy. Microchem. J. 2016, 125, 190–195. [Google Scholar] [CrossRef]
- Szczepaniak, M.; Nawrocka, D.; Mrozek-Wysocka, M. Applied geology in analytical characterization of stone materials from historical building. Appl. Phys. A 2008, 90, 89–95. [Google Scholar] [CrossRef]
- Freire, M.T.; Santos Silva, A.; do Rosário Veiga, M.; de Brito, J. The history of Portuguese interior plaster coatings: A mineralogical survey using XRD. Archaeometry 2015, 57, 147–165. [Google Scholar] [CrossRef]
- Ghale, D.B.; Bohara, N.B.; Duwal, N.; Bhattarai, J. Investigation on the mineralogical phase of ancient brick samples of Kathmandu valley (Nepal) using XRD and FTIR analysis. Rasayan J. Chem. 2019, 12, 402–408. [Google Scholar] [CrossRef]
- Figueiredo, M.; Silva, T.; Veiga, J. Analysis of degradation phenomena in ancient, traditional and improved building materials of historical monuments. Appl. Phys. A 2008, 92, 151–154. [Google Scholar] [CrossRef]
- Boukir, A.; Fellak, S.; Doumenq, P. Structural characterization of Argania spinosa Moroccan wooden artifacts during natural degradation progress using infrared spectroscopy (ATR-FTIR) and X-Ray diffraction (XRD). Heliyon 2019, 5, e02477. [Google Scholar] [CrossRef]
- Hassan, S.A.M. Multiscientific approach for the characterization and assessment of the degradation state of the historical Al-Shafi’i mosque walls (Jeddah, Kingdom of Saudi Arabia). Sci. Cult. 2021, 7, 1–19. [Google Scholar]
- Marrocchino, E.; Telloli, C.; Caraccio, S.; Guarnieri, C.; Vaccaro, C. Medieval Glassworks in the City of Ferrara (North Eastern Italy): The Case Study of Piazza Municipale. Heritage 2020, 3, 819–837. [Google Scholar] [CrossRef]
- Franzini, M.; Leoni, L.; Saitta, M. Revisione di una metodologia analitica per fluorescenza X basata sulla correzione completa degli effetti di matrice. Rend. Soc. Ital. Mineral. Petrogr. 1975, 31, 365–378. [Google Scholar]
- Marrocchino, E.; Rapti-Caputo, D.; Vaccaro, C. Chemical-mineralogical characterisation as useful tool in the assessment of the decay of the Mesóla Castle (Ferrara, Italy). Constr. Build. Mater. 2010, 24, 2672–2683. [Google Scholar] [CrossRef]
- Lachance, G.R.; Traill, R.J. Practical solution to the Matrix problem in X-ray analysis. Can. Spectrosc. 1966, 11, 43–48. [Google Scholar]
- Rousseau, R.M. Corrections for matrix effects in X-ray fluorescence analysis—A tutorial. Acta Part B At. Spectrosc. 2006, 61, 759–777. [Google Scholar] [CrossRef]
- Liu, H.; Zhou, X.; Zhang, X.; Wu, K.; Lu, C. Experimental Study and Matrix Effect Correction of Pseudobinary Samples in XRF Analysis. IOP Conf. Series Mater. Sci. Eng. 2018, 389, 012002. [Google Scholar] [CrossRef]
- Marrocchino, E.; Telloli, C.; Pedrini, M.; Vaccaro, C. Natural stones used in the Orsi-Marconi palace façade (Bologna): A petro-mineralogical characterization. Heritage 2020, 3, 1109–1123. [Google Scholar] [CrossRef]
- Bergamaschi, B.; Marzola, L.; Radice, M.; Manfredini, S.; Baldini, E.; Vicentini, C.B.; Marrocchino, E.; Molesini, S.; Ziosi, P.; Vaccaro, C.; et al. Comparative Study of SPA Mud from “Bacino Idrominerario Omogeneo dei Colli Euganei (B.I.O.C.E.)—Italy” and Industrially Optimized Mud for Skin Applications. Life 2020, 10, 78. [Google Scholar] [CrossRef]
- Elert, K.; Coltrone, G.; Navarro, C.R.; Pardo, E.S. Durability of bricks used in the conservation of historic buildings influence of composition and microstructure. J. Cult. Herit. 2003, 4, 91–99. [Google Scholar] [CrossRef]
- Cantù, M.; Giacometti, F.; Landi, A.G.; Riccardi, M.P.; Tarantino, S.C.; Grimoldi, A. Characterization of XVIIIth century earthen mortars from Cremona (Northern Italy): Insights on a manufacturing tradition. Mater. Charact. 2015, 103, 81–89. [Google Scholar] [CrossRef]
- Whitney, D.L. Abbreviations for Names of Rock-Forming Minerals. Am. Mineral. 2010, 95, 185–187. [Google Scholar] [CrossRef]
- Toniolo, L.; Zerbi, C.M.; Bugini, R. Black layers on historical architecture. Environ. Sci. Pollut. Res. 2009, 16, 218–226. [Google Scholar] [CrossRef]
- Sabbioni, C.; Zappia, G.; Ghedini, N.; Gobbi, G.; Favoni, O. Black crusts on ancient mortars. Atmos. Environ. 1998, 32, 215–223. [Google Scholar] [CrossRef]
- Potgieter-Vermaak, S.S.; Godoi, R.H.M.; Van Grieken, R.; Potgieter, J.H.; Oujja, M.; Castillejo, M. Micro-structural characterization of black crust and laser cleaning of building stones by micro-Raman and SEM techniques. Spectrochim Acta Part A Mol. Biomol. Spectros. 2005, 61, 2460–2467. [Google Scholar] [CrossRef]
- La Russa, M.F.; Comite, V.; Aly, N.; Barca, D.; Fermo, P.; Rovella, N.; Antonelli, F.; Tesser, E.; Aquino, M.; Ruffolo, S. Black crusts on Venetian built heritage, investigation on the impact of pollution sources on their composition. Eur. Phys. J Plus 2018, 133, 370. [Google Scholar] [CrossRef]
- Abdullah, M.A.K. Dehydration of gypsum component of plasters and stuccos in some egyptian archaeological buildings and evaluation of K2SO4 activator as a consolidant. Sci. Cult. 2019, 5, 49–59. [Google Scholar]
- Kholod, K.S.; Mona, F.A.; Abubakr, M.M. The presence of cement mortars in the added chambers of El Sakakeny palace: A case study. Sci. Cult. 2017, 3, 25–29. [Google Scholar]
- Stefani, M.; Zuppiroli, M. The interaction of geological and anthropic processes shaping the urban growth of Ferrara and the evolution of the surrounding plain. Ital. J. Quat. Sci. 2010, 23, 355–372. [Google Scholar]
- Bianchini, G.; Laviano, R.; Lovo, S.; Vaccaro, C. Chemical-mineralogical characterisation of clay sediments around Ferrara (Italy): A tool for an environmental analysis. Appl. Clay Sci. 2002, 21, 165–176. [Google Scholar] [CrossRef]
- Bergstad, M.; Or, D.; Withers, P.J.; Shokri, N. The influence of NaCl concentration on salt precipitation in heterogeneous porous media. Water Resour. Res. 2017, 53, 1702–1712. [Google Scholar] [CrossRef]
- Falchi, L.; Slanzi, D.; Balliana, E.; Driussi, G.; Zendri, E. Rising damp in historical buildings: A Venetian perspective. Build. Environ. 2018, 131, 117–127. [Google Scholar] [CrossRef]
- Çelik, M.Y.; Aygün, A. The effect of salt crystallization on degradation of volcanic building stones by sodium sulfates and sodium chlorides. Bull. Eng. Geol. Environ. 2019, 78, 3509–3529. [Google Scholar] [CrossRef]
- Karagiannis, N.; Karoglou, M.; Bakolas, A.; Krokida, M.; Moropoulou, A. Drying kinetics of building materials capillary moisture. Constr. Build. Mater. 2017, 137, 441–449. [Google Scholar] [CrossRef]
- Pandey, S.C.; Pollard, A.M.; Viles, H.A. A simulation study of capillary transport, preferential retention and distribution of salts in historic sandstone buildings. Environ. Earth Sci. 2017, 76, 434. [Google Scholar] [CrossRef]
- Luo, Y.; Ma, S.; Zheng, S.; Liu, C.; Han, D.; Wang, X. Mullite-based ceramic tiles produced solely from high-alumina fly ash: Preparation and sintering mechanism. J. Alloy. Compd. 2018, 732, 828–837. [Google Scholar] [CrossRef]
- Bianchini, G.; Marrocchino, E.; Moretti, A.; Vaccaro, C. Chemical-mineralogical characterization of historical bricks from Ferrara: An integrated bulk and micro-analitycal approach. In Geomaterials in Cultural Heritage; Special Publication 2006; Maggetti, M., Messiga, B., Eds.; Geological Society: London, UK, 2006; Volume 257, pp. 127–140. [Google Scholar]
- Duminuco, P.; Messiga, B.; Riccardi, M.P. Firing process of natural clays. Some microtextures and related phase compositions. Thermochim. Acta 1998, 321, 185–190. [Google Scholar] [CrossRef]
- Bondesan, M.; Ferri, R.; Stefeani, M. Rapporti fra lo Sviluppo Urbano di Ferrara e l’evoluzione Idrografica, Sedimentaria e Geomorfologica del Territorio in Ferrara nel Medioevo. In Topografia Storica e Archeologia Urbana; Casalecchio di Reno: Bologna, Italy, 1995; pp. 27–42. [Google Scholar]
- Sanfilippo, G.; Aquilia, E. Multidisciplinary process aimed at the diagnosis and treatment of damages in stony cultural heritage: The balustrade of Villa Cerami (Catania). Mediter. Archaeol. Archaeom. 2018, 18, 191–205. [Google Scholar]
- Di Benedetto, C.; Graziano, S.F.; Guarino, V.; Rispoli, C.; Munzi, P.; Morra, V.; Cappelletti, P. Romans’ established skills: Mortars from D46b mausoleum, porta mediana necropolis, Cuma (Naples). Mediter. Archaeol. Archaeom. 2018, 18, 131–146. [Google Scholar]


| Samples | Description |
|---|---|
| R6 | Brick from flower decoration |
| R7 | Brick from flower decoration |
| R8 | Brick from flower decoration |
| R17 | Brick from flower decoration |
| R21 | Brick from flower decoration, visible sulphating process |
| R22 | Brick from flower decoration |
| R9 | Brick from the façade |
| R12 | Brick from the façade |
| R13 | Brick from the façade |
| R14 | Brick from the façade |
| R15 | Brick from the façade |
| R1 | Plaster |
| R2 | Plaster |
| R4 | Plaster |
| R16 | Plaster |
| C1-1 | Cotto, 5th layer from the ground |
| C1-3c | Cotto |
| C1-4 | Cotto |
| C1-5 | Cotto |
| C4-1 | Cotto, 6th layer from the ground |
| C4-3 | Cotto, 7th layer from the ground |
| C5-3 | Cotto, 8th layer from the ground |
| CS1-1 | Cotto, 2nd layer from the ground |
| CS1-2 | Cotto, 7th layer from the ground |
| CS1-3 | Cotto, 8th layer from the ground |
| C1-6 | Cotto with biological degradation, 8th layer from the ground |
| C1-7 | Cotto with efflorescence, 16th layer from the ground |
| C2-2 | Cotto with black crust |
| C2-3 | Cotto degraded, 3rd layer from the ground |
| C5-1 | Cotto disaggregated, 9th layer from the ground |
| C5-4 | Cotto degraded, 6th layer from the ground |
| C5-5 | Cotto disaggregated, 3rd layer from the ground |
| C1-2 | Mortar, 5th layer from the ground |
| C2-4 | Replacing mortar from layer under the external plaster |
| C4-2 | Mortar, 6th−7th layer from the ground |
| C5-2 | Mortar, 9th layer from the ground |
| CS1-4 | Mortar, 8th layer from the ground |
| C1-3 | Saline efflorescence of the sample C1-3c, 5th layer from the ground |
| C2-1 | Black crust |
| C6-1 | Black sulphate crust |
| MM4 | Brick at 50 cm from the ground |
| MM5 | Brick detached |
| MM3 | Plaster at 2 m from the ground, coloured in grey |
| MM7 | Plaster at 2 m from the ground, coloured in brown and grey |
| MM9 | Plaster at 2 m from the ground, coloured in grey |
| Palazzo Roverella | Santa Maria delle Grazie | San Andrea | ||||||||||||||||||
|---|---|---|---|---|---|---|---|---|---|---|---|---|---|---|---|---|---|---|---|---|
| R6 | R9 | R12 | R15 | R17 | R21 | R22 | C1-1 | C1-7 | C2-3 | C4-1 | C4-3 | C5-5 | CS1-1 | CS1-2 | MM3 | MM4 | MM5 | MM7 | MM9 | |
| SiO2 | 50.60 | 51.86 | 54.99 | 53.88 | 50.71 | 53.15 | 54.47 | 49.84 | 46.12 | 48.72 | 49.90 | 49.60 | 48.71 | 52.02 | 51.94 | 43.67 | 41.15 | 51.01 | 30.59 | 38.22 |
| TiO2 | 0.65 | 0.70 | 0.71 | 0.71 | 0.69 | 0.72 | 0.70 | 0.64 | 0.61 | 0.62 | 0.63 | 0.64 | 0.63 | 0.68 | 0.66 | 0.25 | 0.55 | 0.64 | 0.21 | 0.28 |
| Al2O3 | 13.63 | 14.43 | 14.79 | 15.20 | 14.67 | 15.10 | 14.08 | 12.73 | 12.42 | 12.84 | 13.45 | 12.89 | 12.68 | 13.85 | 13.73 | 6.26 | 11.23 | 13.09 | 5.04 | 5.34 |
| Fe2O3 | 5.66 | 6.11 | 6.26 | 6.29 | 6.29 | 6.34 | 6.20 | 5.73 | 5.25 | 5.53 | 5.56 | 5.55 | 5.67 | 5.94 | 5.75 | 2.66 | 5.14 | 5.51 | 2.44 | 2.43 |
| MnO | 0.12 | 0.15 | 0.14 | 0.14 | 0.14 | 0.15 | 0.14 | 0.12 | 0.14 | 0.14 | 0.13 | 0.12 | 0.15 | 0.15 | 0.13 | 0.12 | 0.12 | 0.13 | 0.08 | 0.09 |
| MgO | 4.96 | 4.58 | 4.32 | 4.63 | 4.61 | 5.13 | 4.52 | 4.37 | 2.62 | 2.70 | 4.67 | 5.43 | 4.32 | 5.07 | 4.54 | 2.32 | 3.71 | 4.87 | 2.34 | 2.49 |
| CaO | 9.26 | 10.04 | 7.32 | 6.26 | 9.42 | 10.80 | 9.39 | 10.41 | 12.24 | 11.49 | 9.83 | 9.25 | 12.04 | 8.36 | 9.81 | 24.84 | 16.66 | 12.45 | 32.26 | 29.18 |
| Na2O | 0.96 | 0.78 | 0.98 | 0.85 | 1.08 | 0.86 | 1.65 | 2.22 | 2.74 | 2.99 | 2.13 | 2.12 | 2.16 | 1.94 | 1.92 | 0.70 | 0.72 | 0.77 | 0.37 | 0.74 |
| K2O | 2.26 | 2.23 | 2.27 | 2.56 | 2.33 | 2.47 | 2.12 | 2.80 | 2.37 | 2.94 | 2.59 | 2.84 | 2.54 | 2.64 | 2.38 | 1.80 | 2.54 | 2.97 | 1.00 | 1.50 |
| P2O5 | 0.13 | 0.15 | 0.17 | 0.15 | 0.14 | 0.14 | 0.16 | 0.12 | 0.14 | 0.11 | 0.12 | 0.15 | 0.13 | 0.21 | 0.14 | 0.12 | 0.18 | 0.18 | 0.09 | 0.11 |
| LOI | 11.77 | 8.99 | 8.05 | 9.34 | 9.89 | 5.14 | 6.56 | 11.00 | 15.37 | 11.92 | 10.97 | 11.41 | 10.96 | 9.14 | 9.00 | 17.27 | 18.00 | 8.83 | 25.58 | 19.62 |
| Tot | 100 | 100 | 100 | 100 | 100 | 100 | 100 | 100 | 100 | 100 | 100 | 100 | 100 | 100 | 100 | 100 | 100 | 100 | 100 | 100 |
| V | 97 | 100 | 105 | 105 | 104 | 100 | 88 | 86 | 72 | 89 | 86 | 88 | 84 | 99 | 102 | 34 | 73 | 94 | 19 | 125 |
| Cr | 201 | 203 | 190 | 171 | 185 | 193 | 205 | 169 | 74 | 95 | 172 | 159 | 143 | 165 | 184 | 69 | 111 | 204 | 43 | 115 |
| Ni | 141 | 145 | 148 | 149 | 145 | 153 | 139 | 133 | 61 | 74 | 136 | 135 | 115 | 137 | 142 | 58 | 108 | 118 | 41 | 61 |
| Cu | 44 | 42 | 41 | 39 | 50 | 44 | 44 | 35 | 38 | 40 | 29 | 36 | 47 | 43 | 39 | 21 | 34 | 39 | 11 | 23 |
| Zn | 99 | 110 | 125 | 126 | 122 | 111 | 101 | 87 | 76 | 88 | 101 | 186 | 90 | 108 | 89 | 29 | 48 | 63 | 13 | 17 |
| Ga | 18 | 21 | 17 | 19 | 19 | 21 | 18 | 17 | 14 | 19 | 16 | 18 | 17 | 18 | 18 | 6 | 11 | 13 | 6 | 6 |
| Rb | 104 | 106 | 64 | 125 | 91 | 82 | 87 | 110 | 98 | 108 | 99 | 98 | 101 | 118 | 115 | 40 | 57 | 78 | 25 | 27 |
| Sr | 233 | 264 | 130 | 226 | 206 | 199 | 203 | 322 | 330 | 344 | 231 | 226 | 321 | 277 | 286 | 424 | 246 | 285 | 421 | 327 |
| Zr | 156 | 173 | 93 | 160 | 137 | 125 | 133 | 142 | 141 | 105 | 140 | 148 | 151 | 214 | 158 | 41 | 83 | 133 | 32 | 38 |
| Ba | 408 | 398 | 399 | 381 | 422 | 409 | 380 | 345 | 306 | 355 | 358 | 327 | 409 | 363 | 378 | 240 | 237 | 419 | 101 | 322 |
| La | 24 | 29 | 34 | 30 | 29 | 23 | 28 | 20 | 20 | 34 | 27 | 29 | 28 | 26 | 32 | 14 | 26 | 23 | 10 | 19 |
| Ce | 51 | 48 | 68 | 54 | 48 | 61 | 66 | 51 | 49 | 47 | 59 | 57 | 71 | 56 | 51 | n.d. | 13 | 22 | n.d. | 28 |
| Pb | 44 | 58 | 96 | 62 | 40 | 32 | 33 | 18 | 22 | 23 | 12 | 15 | 21 | 30 | 23 | 32 | 14 | 17 | 17 | 534 |
| Sc | 24 | 22 | 26 | 22 | 25 | 25 | 22 | 23 | 17 | 23 | 21 | 18 | 22 | 21 | 23 | 6 | 8 | 13 | 2 | 6 |
| Co | 21 | 17 | 22 | 21 | 23 | 21 | 18 | 16 | 14 | 15 | 19 | 16 | 16 | 19 | 16 | 9 | 13 | 19 | 3 | 8 |
| Th | 11 | 7 | 9 | 7 | 5 | 10 | 12 | 9 | 5 | 1 | 9 | 11 | 7 | 10 | 5 | 1 | 5 | 7 | 1 | n.d. |
| Y | 25 | 28 | 15 | 23 | 22 | 19 | 24 | 29 | 19 | 22 | 27 | 25 | 26 | 31 | 27 | 10 | 15 | 20 | 6 | 5 |
| Nb | 14 | 18 | 11 | 15 | 13 | 11 | 13 | 13 | 13 | 13 | 11 | 13 | 14 | 17 | 15 | 4 | 7 | 12 | 2 | 3 |
| S | 10,402 | 16,718 | 9628 | 9779 | 5816 | 7724 | 3483 | 1257 | 31,742 | 3131 | 1937 | 5571 | 8998 | 1301 | 4944 | 7100 | 22,967 | 1673 | 127,516 | 2394 |
| Samples | Description | Qz | Cal | Gp | Fsp | Cpx | Hem | Ilm | Pl | Hl |
|---|---|---|---|---|---|---|---|---|---|---|
| R6 * | Decoration | 35% | 10% | 10% | 15% | 15% | 15% | |||
| R7 | Decoration | 45% | 22% | 21% | 11% | 2% | ||||
| R8 | Decoration | 50% | 33% | 2% | 15% | |||||
| R17 | Decoration | 45% | 20% | 2% | 20% | 5% | 8% | |||
| R21 | Decoration | 35% | 20% | 20% | 10% | 5% | 10% | |||
| R22 | Decoration | 50% | 30% | 10% | 10% | |||||
| R9 * | Brick | 40% | 20% | 15% | 13% | 2% | 10% | |||
| R12 | Brick | 50% | 10% | 20% | 10% | 10% | ||||
| R13 | Brick | 40% | 20% | 10% | 10% | 10% | 10% | |||
| R14 | Brick | 45% | 12% | 11% | 10% | 10% | 10% | 2% | ||
| R15 | Brick | 50% | 3% | 3% | 25% | 8% | 8% | |||
| R1 | Plaster | 30% | 30% | 30% | 10% | |||||
| R2 * | Plaster | 40% | 50% | 10% | ||||||
| R4 | Plaster | 35% | 25% | 25% | 15% | |||||
| R16 * | Plaster | 40% | 38% | 10% | 2% | 10% | ||||
| C1-1 * | Cotto | 40% | 20 | 20 | 5% | 3% | 10 | 2% | ||
| C1-3c | Cotto | 35% | 15% | 10% | 10% | 10% | 3% | 15% | 2% | |
| C1-4 | Cotto | 35% | 10% | 15% | 10% | 10% | 20% | |||
| C1-5 | Cotto | 45% | 4% | 15% | 15% | 3% | 3% | 15% | ||
| C4-1 | Cotto | 40% | 15% | 3% | 12% | 2% | 12% | 12% | 2% | |
| C4-3 | Cotto | 40% | 15% | 5% | 15% | 5% | 10% | 10% | 1% | |
| C5-3 | Cotto | 35% | 13% | 10% | 15% | 10% | 2 | 15% | ||
| CS1-1 | Cotto | 40% | 20% | 10% | 20% | 10% | ||||
| CS1-2 | Cotto | 40% | 25% | 3% | 10% | 2% | 10% | 10% | ||
| CS1-3 | Cotto | 30% | 3 | 10% | 16% | 10% | 8% | 16% | 8% | |
| C1-6 | Cotto degr. | 40% | 10% | 20% | 10% | 10% | 10% | |||
| C1-7 * | Cotto degr. | 35% | 10% | 20% | 10% | 10% | 15% | |||
| C2-2 | Cotto degr. | 40% | 20% | 3% | 15% | 2% | 20% | |||
| C2-3 | Cotto degr. | 40% | 15% | 20% | 3% | 3% | 16% | 3% | ||
| C5-1 | Cotto degr. | 45% | 20% | 12% | 8% | 12% | 3% | |||
| C5-4 | Cotto degr. | 45% | 20% | 11% | 11% | 10% | 3% | |||
| C5-5 | Cotto degr. | 40% | 20% | 3% | 9% | 3% | 15% | 8% | 2% | |
| C1-2 | Mortar | 40% | 30% | 15% | 3% | 2% | 10% | |||
| C2-4 | Mortar | 40% | 30% | 22% | 3% | 10% | ||||
| C4-2 | Mortar | 25% | 23% | 23% | 7% | 7% | 15% | |||
| C5-2 | Mortar | 50% | 30% | 10% | 3% | 7% | ||||
| CS1-4 * | Mortar | 50% | 30% | 10% | 3% | 7% | ||||
| C1-3 * | Saline effl. | 25% | 15% | 3% | 3% | 54% | ||||
| C2-1 * | Black crust | 30% | 55% | 15% | ||||||
| C6-1 * | Black crust | 45% | 11% | 35% | 3% | 3% | 3% | |||
| MM4 * | Brick | 40% | 20% | 20% | 20% | |||||
| MM5 | Brick | 40% | 30% | 30% | ||||||
| MM3 | Plaster | 40% | 30% | 30% | ||||||
| MM7 * | Plaster | 40% | 20% | 10% | 30% | |||||
| MM9 | Plaster | 45% | 35% | 25% | 3% | 2% |
Publisher’s Note: MDPI stays neutral with regard to jurisdictional claims in published maps and institutional affiliations. |
© 2021 by the authors. Licensee MDPI, Basel, Switzerland. This article is an open access article distributed under the terms and conditions of the Creative Commons Attribution (CC BY) license (http://creativecommons.org/licenses/by/4.0/).
Share and Cite
Marrocchino, E.; Telloli, C.; Vaccaro, C. Geochemical and Mineralogical Characterization of Construction Materials from Historical Buildings of Ferrara (Italy). Geosciences 2021, 11, 31. https://doi.org/10.3390/geosciences11010031
Marrocchino E, Telloli C, Vaccaro C. Geochemical and Mineralogical Characterization of Construction Materials from Historical Buildings of Ferrara (Italy). Geosciences. 2021; 11(1):31. https://doi.org/10.3390/geosciences11010031
Chicago/Turabian StyleMarrocchino, Elena, Chiara Telloli, and Carmela Vaccaro. 2021. "Geochemical and Mineralogical Characterization of Construction Materials from Historical Buildings of Ferrara (Italy)" Geosciences 11, no. 1: 31. https://doi.org/10.3390/geosciences11010031
APA StyleMarrocchino, E., Telloli, C., & Vaccaro, C. (2021). Geochemical and Mineralogical Characterization of Construction Materials from Historical Buildings of Ferrara (Italy). Geosciences, 11(1), 31. https://doi.org/10.3390/geosciences11010031