Article

Geochemical and Mineralogical Characterization of Construction Materials from Historical Buildings of Ferrara (Italy)

1
Department of Physics and Earth Sciences, University of Ferrara—Via Saragat 1, 44121 Ferrara, Italy
2
ENEA, Italian National Agency for New Technologies, Energy and Sustainable Economic Development Fusion and Technology for Nuclear Safety and Security Department Nuclear Safety, Security and Sustainability Division—Via Martiri di Monte Sole 4, 40129 Bologna, Italy
3
ISAC-CNR Institute of Atmospheric Sciences and Climate of the National Research Council of Italy, Via Piero Gobetti, 101, 40129 Bologna, Italy
*
Author to whom correspondence should be addressed.
Geosciences 2021, 11(1), 31; https://doi.org/10.3390/geosciences11010031
Submission received: 10 December 2020 / Revised: 3 January 2021 / Accepted: 5 January 2021 / Published: 7 January 2021
(This article belongs to the Special Issue Natural and Environmental Hazards of Cultural Heritage)

Abstract

:
This paper presents a chemical-mineralogical characterization of construction materials from medieval Renaissance buildings of Ferrara (NE Italy) to provide an insight into the nature and provenance of the raw materials used. Biagio Rossetti was an Italian architect and urbanist from the city of Ferrara. From 1483, he was the architect of the Duke of Ferrara Ercole I d’Este who in 1492 assigned him the project of enlarging the city of Ferrara. Biagio Rossetti is still famous because he designed and built many notable palaces and churches in Ferrara, e.g., the Palazzo Roverella, the monastery of Santa Maria delle Grazie and the renovation of the church of San Andrea. To date, only the first two historic buildings are still in use and consequently restored, while the church of San Andrea has been abandoned over the years and the remains have been subject to decay. Different kinds of samples (bricks, cotto, plaster and mortars) were collected from the three sampling sites and analyzed in X-ray fluorescence and X-ray diffractometer to investigate the construction materials through the evaluation of their chemical composition, historic building activity and degradation degree. These investigations should provide knowledge useful for restoration and conservation processes.

Graphical Abstract

1. Introduction

Ferrara was the first Renaissance city to be developed according to a complex urban plan that gave precedence to the harmonious arrangement of urban perspectives rather than to the beauty of the individual buildings and for this reason, declared a World Heritage Site by UNESCO in 1995 [1]. The city reached the top of Renaissance architecture and prestige with the dominion of the Estense family [2,3]. The Estense family considered the urban layout inside the first defensive walls inappropriate to represent their greatness and their dominance over the territory. This was the reason they decided to radically modify the city’s layout [4,5], changing its structure and appearance. Thanks to this, different urban projects never before realized arose in the city, the most important of which was the Addizione Erculea by the architect and urbanist Biagio Rossetti, at the end of the 15th century [6,7].
Biagio Rossetti (1447−1516) was considered the first architect in the history of urbanism to use the advantages of modern methods: balancing humanistic principles and local traditions in the architecture [8,9,10]. In the beginning of 1492, he projected and directed the construction of the defense walls around the city of Ferrara, still well preserved today [11]. After Duke Ercole’s death in 1505, Biagio Rossetti worked for the Cardinal Ippolito d’Este, in which role he was responsible for the creation and restoration of many notable buildings and churches [10,12,13], including Palazzo Roverella, the monastery of Santa Maria delle Grazie and the church of San Andrea, which were the sampling sites chosen for this research work.
Palazzo Magnanini, known as Roverella, is located in the historic center of the city of Ferrara and is characterized by a wonderful façade adorned with precious “cotto”. It was built in the early 1500s in favor of the owner Magnanini until 1700, when it was sold to Countess Teresa Locatelli, widow of Count Pietro Roverella. It remained the property of the Roverella family until 1869 when it was sold to the Zamorani family who assigned the historical building to the Circolo dei Negozianti, who still own it [14].
The first probable reference to the monastery of Santa Maria delle Grazie was in a document dated 17 September 1546, which testified to the beginning of the construction on land owned by Bassano da Lodi [15,16,17]. The construction of the monastery lasted many years, following continuous changes to the original project by the architect Biagio Rossetti. The structure of the building was very simple with on the first floor the cells for the nuns, common and work rooms and the church. The total lack of marble or precious stones could be a sign of the scarcity of money that duke Ercole I d’Este provided for this female religious community. Following the Napoleonic suppressions of 2 August 1799, the monastery was transformed first into a military barracks and then into a shelter for victims. After the end of the Napoleonic wars, it was definitively sold to the University of Ferrara [17].
Historians wrote about the construction of the church of San Andrea around the year 1000, built to the east of the Byzantine Castrum, which was the first medieval fortress of the city of Ferrara [4]. At the beginning, the church was a very modest oratory both in size and in architecture until 1256, the year in which Azzo VII, one of the most important members of the Estense family, reigned over Ferrara. The daughter of Azzo, Beata Beatrice II, obtained from her father permission to consecrate herself to God: first of all, in the convent of San Antonio in Polesine (in Ferrara) and then in the church of San Andrea where she died on 18 January 1262. In 1438, the church of San Andrea was solemnly consecrated by Pope Eugene IV, who was in Ferrara during the Ecumenical Council for the union of the Latin and Greek church. Thanks to this, the church became a center for the faithful [18]. There were numerous burials of illustrious personalities both in the church and in the cloister, for example the architect Biagio Rossetti [19]. In 1796, following the invasion of Napoleon and with the edict of 8 May 1798, the religious orders were suppressed and convents and nonparish churches expropriated. Because of this, San Andrea appeared destroyed [20], until in 1886 it was closed to worship and left to decay. Between 1975 and 1977, the Superintendence for Architectural Heritage in Emilia Romagna designed some requalification: consolidate the apse area and the reconstruction of some walls. To date, the inaccessible ruins of the church of San Andrea are overgrown with trees and climbing plants. Of the ancient splendor only the aisle with small semicircular apses and a small portion of the apse remain.
The aim of this work was to investigate the construction materials of the three different historical sites to better understand the materials used for construction of the churches and historical buildings. Different kinds of samples such as bricks, cotto, plaster and mortars were collected from the three sampling sites and analyzed by two X-ray techniques: X-ray fluorescence [21,22,23] and X-ray powder diffraction [24,25,26]. Through the use of these analytical techniques it was possible to better understand the chemical composition of the samples collected in the three different sampling sites and to evaluate the degree of degradation [27,28,29] especially in the samples collected in the church of San Andrea.

2. Materials and Methods

2.1. Sampling

The city of Ferrara is located in the Emilia Romagna region 50 km from the Adriatic Sea (in the north east of Italy, Figure 1, left side) and it is characterized by a historic center, rich in ancient buildings and historic churches. Most of these buildings are continually being restored, but some of them have been left to decay. For this reason, three different historical sites (palaces and churches) have been chosen to investigate the construction materials.
Different kinds of samples (bricks, cotto, plaster and mortars) were collected in the three different sampling sites located in the city center of Ferrara (Figure 1, right side):
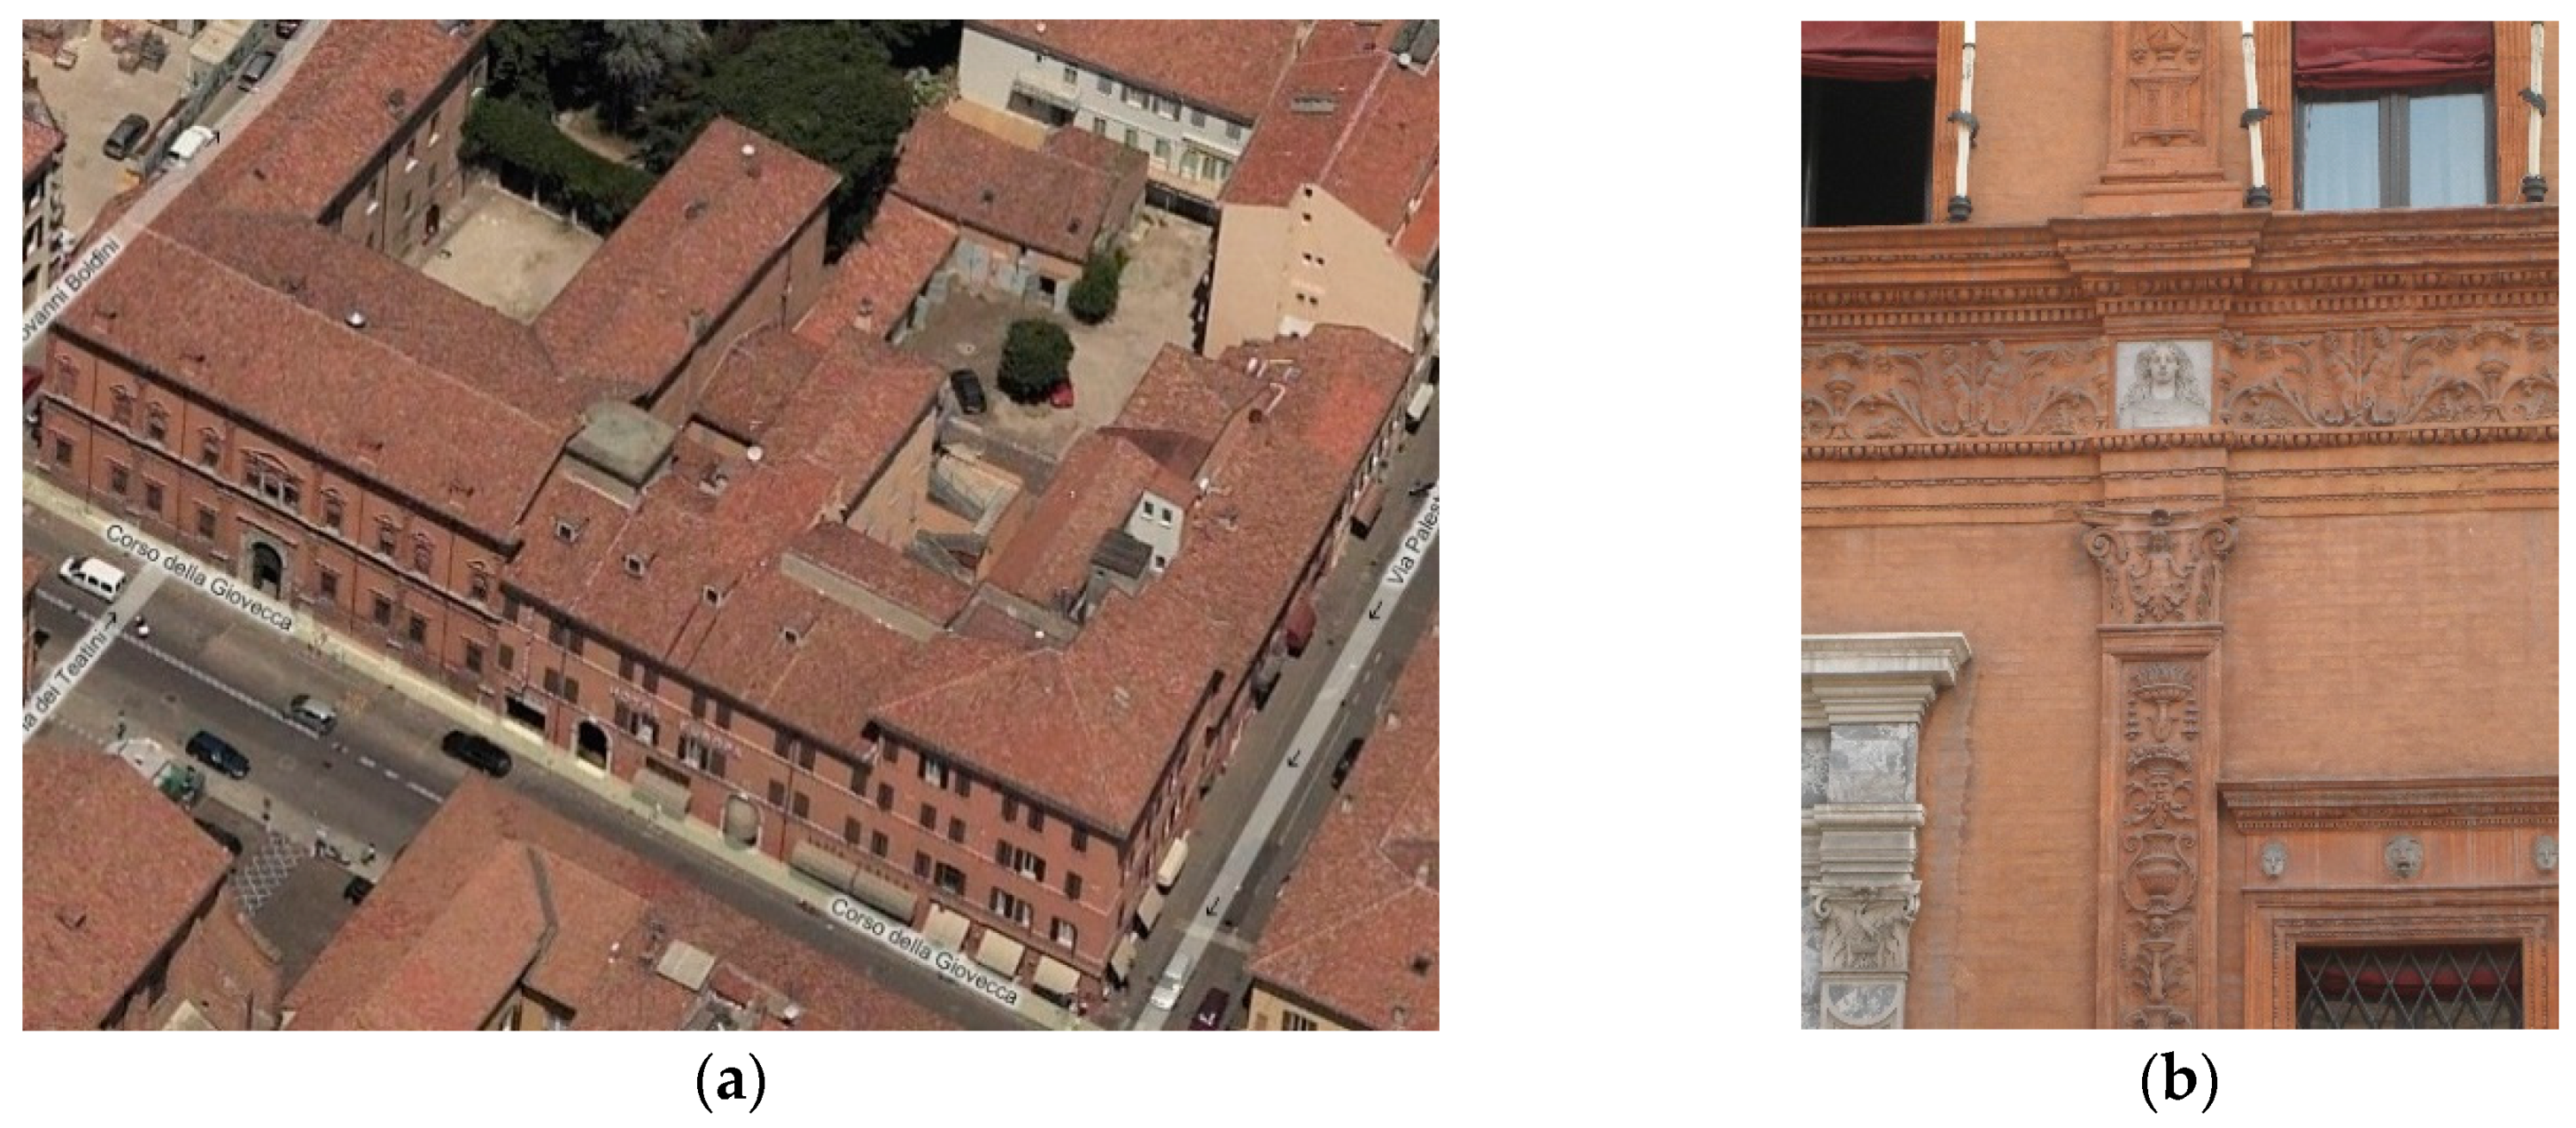
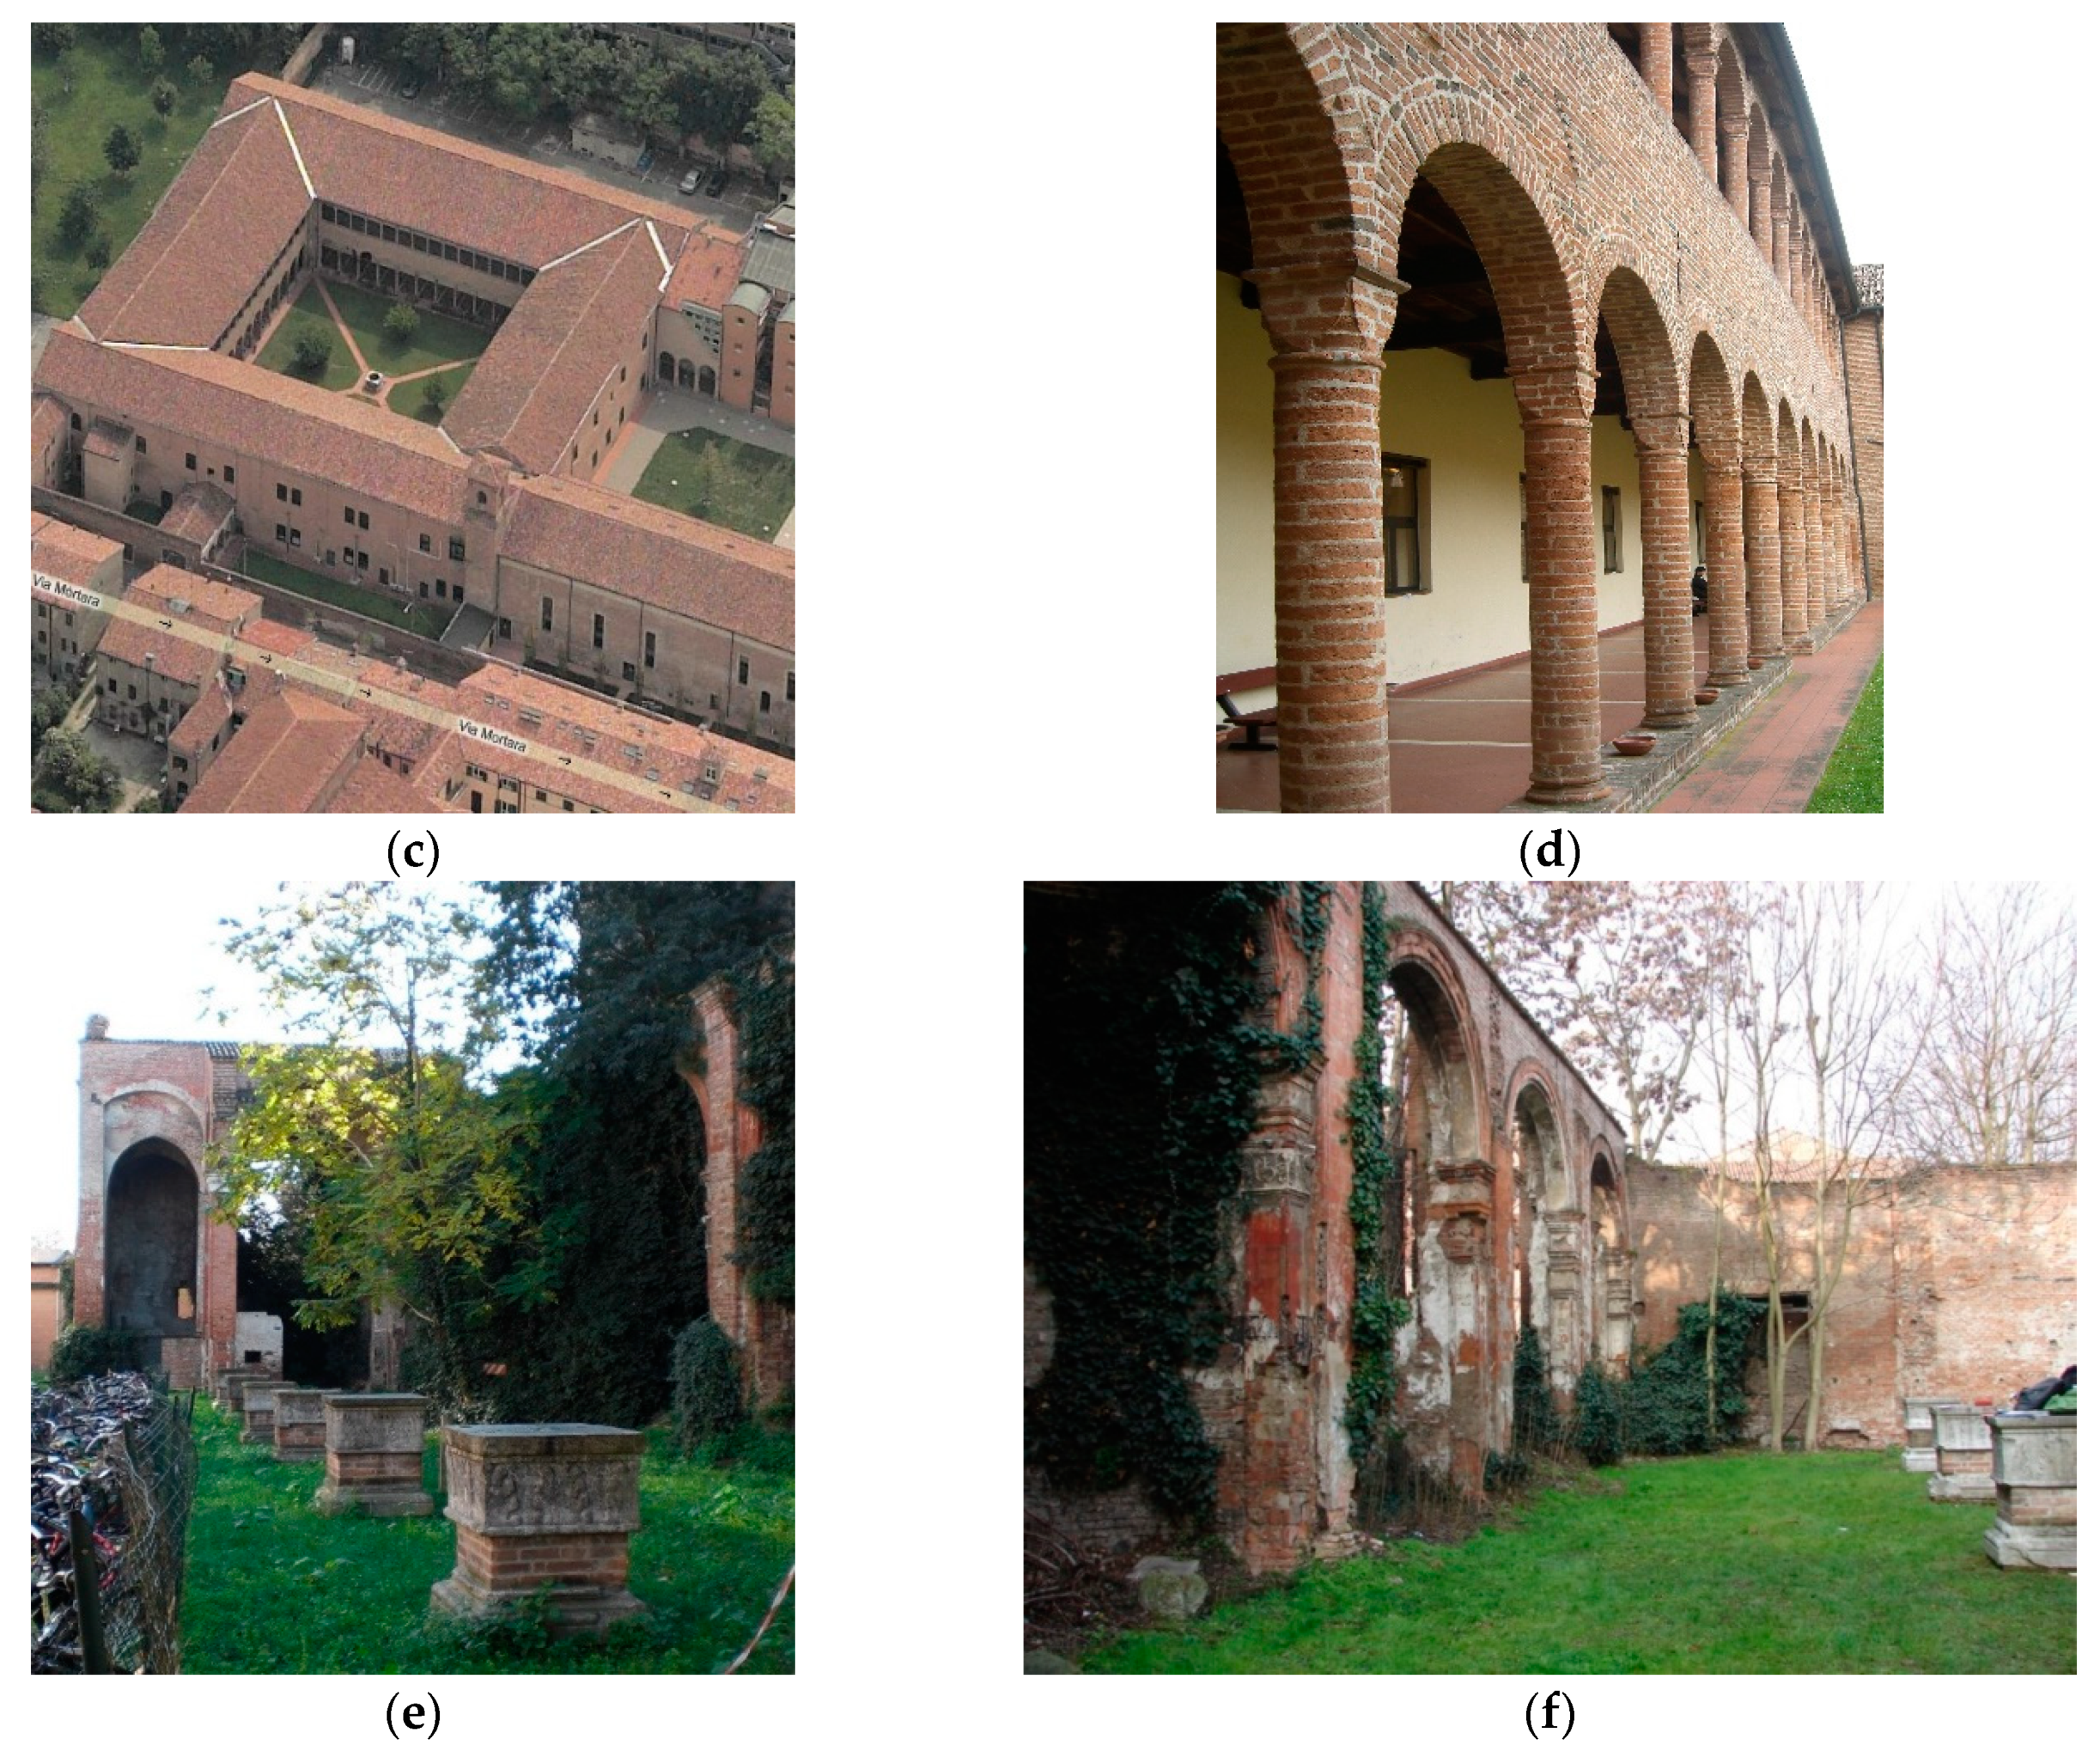
  • two historical buildings in the center of Ferrara, dating back to around 1500 and located in the area called Addizione Erculea: Palazzo Roverella (Figure 2a,b) and the cloister of the monastery of Santa Maria delle Grazie (Figure 2c,d);
  • the remains of the church of San Andrea dating back to around the year 1000 (Figure 2e,f).
The samplings in the Palazzo Roverella and in the cloister of the monastery of Santa Maria delle Grazie were carried out during the restoration phase and the samples (bricks from Palazzo Roverella and cotto from the cloister of Santa Maria delle Grazie) were collected by the Superintendence for the Archaeological Heritage of Emilia Romagna. Table 1 shows the list of the samples analyzed and their description.
In contrast, samplings at the church of San Andrea were carried out on the basis of the various layers of plaster and degradations. Using a flat-tipped chisel and a mallet to obtain suitable fragments, five samples, including both plaster (samples MM3, MM7 and MM9) and bricks (MM4 and MM5), were collected to determine their nature and composition. In Figure 3 the sampling zones and photos of the samples can be observed.
In detail, from the column colored in red on the map in Figure 3, two different kind of samples were collected:
  • a sample of plaster at 2 m from the ground colored in grey (Figure 3a, sample MM3), collected from a brick of ancient masonry and founded under coatings and subsequent plaster;
  • a sample of brick at 50 cm from the ground (Figure 3b, sample MM4).
On the other side, from the column colored in blue in Figure 3, two further samples were collected, both at 2 m from the ground:
  • the sample MM7 represented a layer of plaster colored in brown and grey (Figure 3c);
  • the sample MM9 was plaster colored in grey with black and yellow painting (Figure 3d).
In addition, to better investigate the ancient bricks, a detached brick from the masonry was collected in order not to damage the structure of the archaeological area (Figure 3e, sample MM5).

2.2. Chemical Analysis

The preparation of all the samples and the following analyses were carried out in the laboratories of the Department of Physics and Earth Sciences of the University of Ferrara.
All the samples collected in the three different sampling sites were pulverized using an agate pestle until a powder with a particle size less than 2 μm was obtained.
Part of the powder from all the samples was used for LOI (loss on ignition) calculation and expressed in Table 2 as weight oxide percentage. The sample powders were first dried in an oven at 110 °C then placed in the ceramic crucibles and subjected to a temperature of 1000 °C for one day.
After that, 0.5 g of the powder for each sample was prepared by pressing a tablet on boric acid support for the XRF analysis. The chemical composition of the collected samples was determined by X-ray fluorescence (XRF) with a wavelength dispersion spectrometer ARL Advant-XP (Thermo Fisher Scientific, Waltham, MA, USA) [30] and consisted of an X-ray tube with a Mo target and an SSD Peltier-cooled detector (10 mm2 active area and resolution of <155 eV at 10 kcps) [31]. The maximum voltage and current of 50 kV and 1500 μA, respectively, were used to excite the secondary fluorescence X-rays. A collimator with a diameter of 1 mm was used to collect the emitted secondary X-rays from a surface area of about 0.79 mm2 in air [32].
The XRF technique allowed the major elements to be determined, expressed as a percentage by oxide weight (SiO2, TiO2, Al2O3, Fe2O3, MnO, MgO, CaO, Na2O, K2O, P2O5) and the trace elements reported in ppm (parts per million): V, Cr, Ni, Cu, Zn, Ga, Rb, Sr, Zr, Ba, La, Ce, Pb, Sc, Co, Th, Y, Nd, S. The accuracy of the instrument, estimated on the basis of the results obtained on international standards of geological samples, and the precision, expressed as standard deviation of replicated analyses, were between 2% and 5% for the major elements, and between 5% and 10% for the trace elements. The detection limit (0.01% for major oxides) was estimated to be close to ppm for most trace elements, except for S for which 50 ppm was considered [32]. The processing of the acquired intensities and the correction of the matrix effect was performed according to the model proposed by Lachance and Trail [33], Rousseau [34] and Liu [35].
Moreover, the investigation by X-ray diffractometer from powders allows the development of the mineralogical compounds of the sample through information on its crystalline form. The mineralogical characterization of the samples, previously ground using water and then dried and powdered within an agate mill, was carried out by X-ray powder diffraction (XRPD) by means of a PW1860/00 diffractometer (Philips, Eindhoven, The Netherlands) [36], with a graphite filtered and a Cu Kα radiation (1.54 Å) in a 2θ angular range 5–75°, with a 5 s/step (0.02° 2θ). Diffraction patterns were collected in the 2θ angular range 3–50°, with a 5 s/step (0.02 2θ) [30,37].

3. Results

Selected bricks and cotto samples of the three different sampling sites and two of plaster from the San Andrea site were first prepared for XRF analyses, then each category of samples was subjected to XRPD characterization.

3.1. XRF Analyses

The chemical composition (major and trace elements) of the selected samples collected was determined by XRF.
Table 2 shows the data relating to the chemical elements analyzed in the different samples both for the major elements expressed using oxide concentration in weight % and trace elements concentration expressed in ppm.
In all the samples, the oxides were characterized by a high value of SiO2, Al2O3 and CaO, followed by Fe2O3 and MgO. The samples from Palazzo Roverella and Santa Maria delle Grazie had a homogenous composition characterized by higher aluminosilicates than the samples of San Andrea, except for the MM5 sample that was a detached brick from the masonry.
The high value of SiO2 probably depends on the quantity of fusing agent added to the bricks. However, the low level of TiO2 impurity could be an indicator that a pure SiO2 agent was probably used [30].
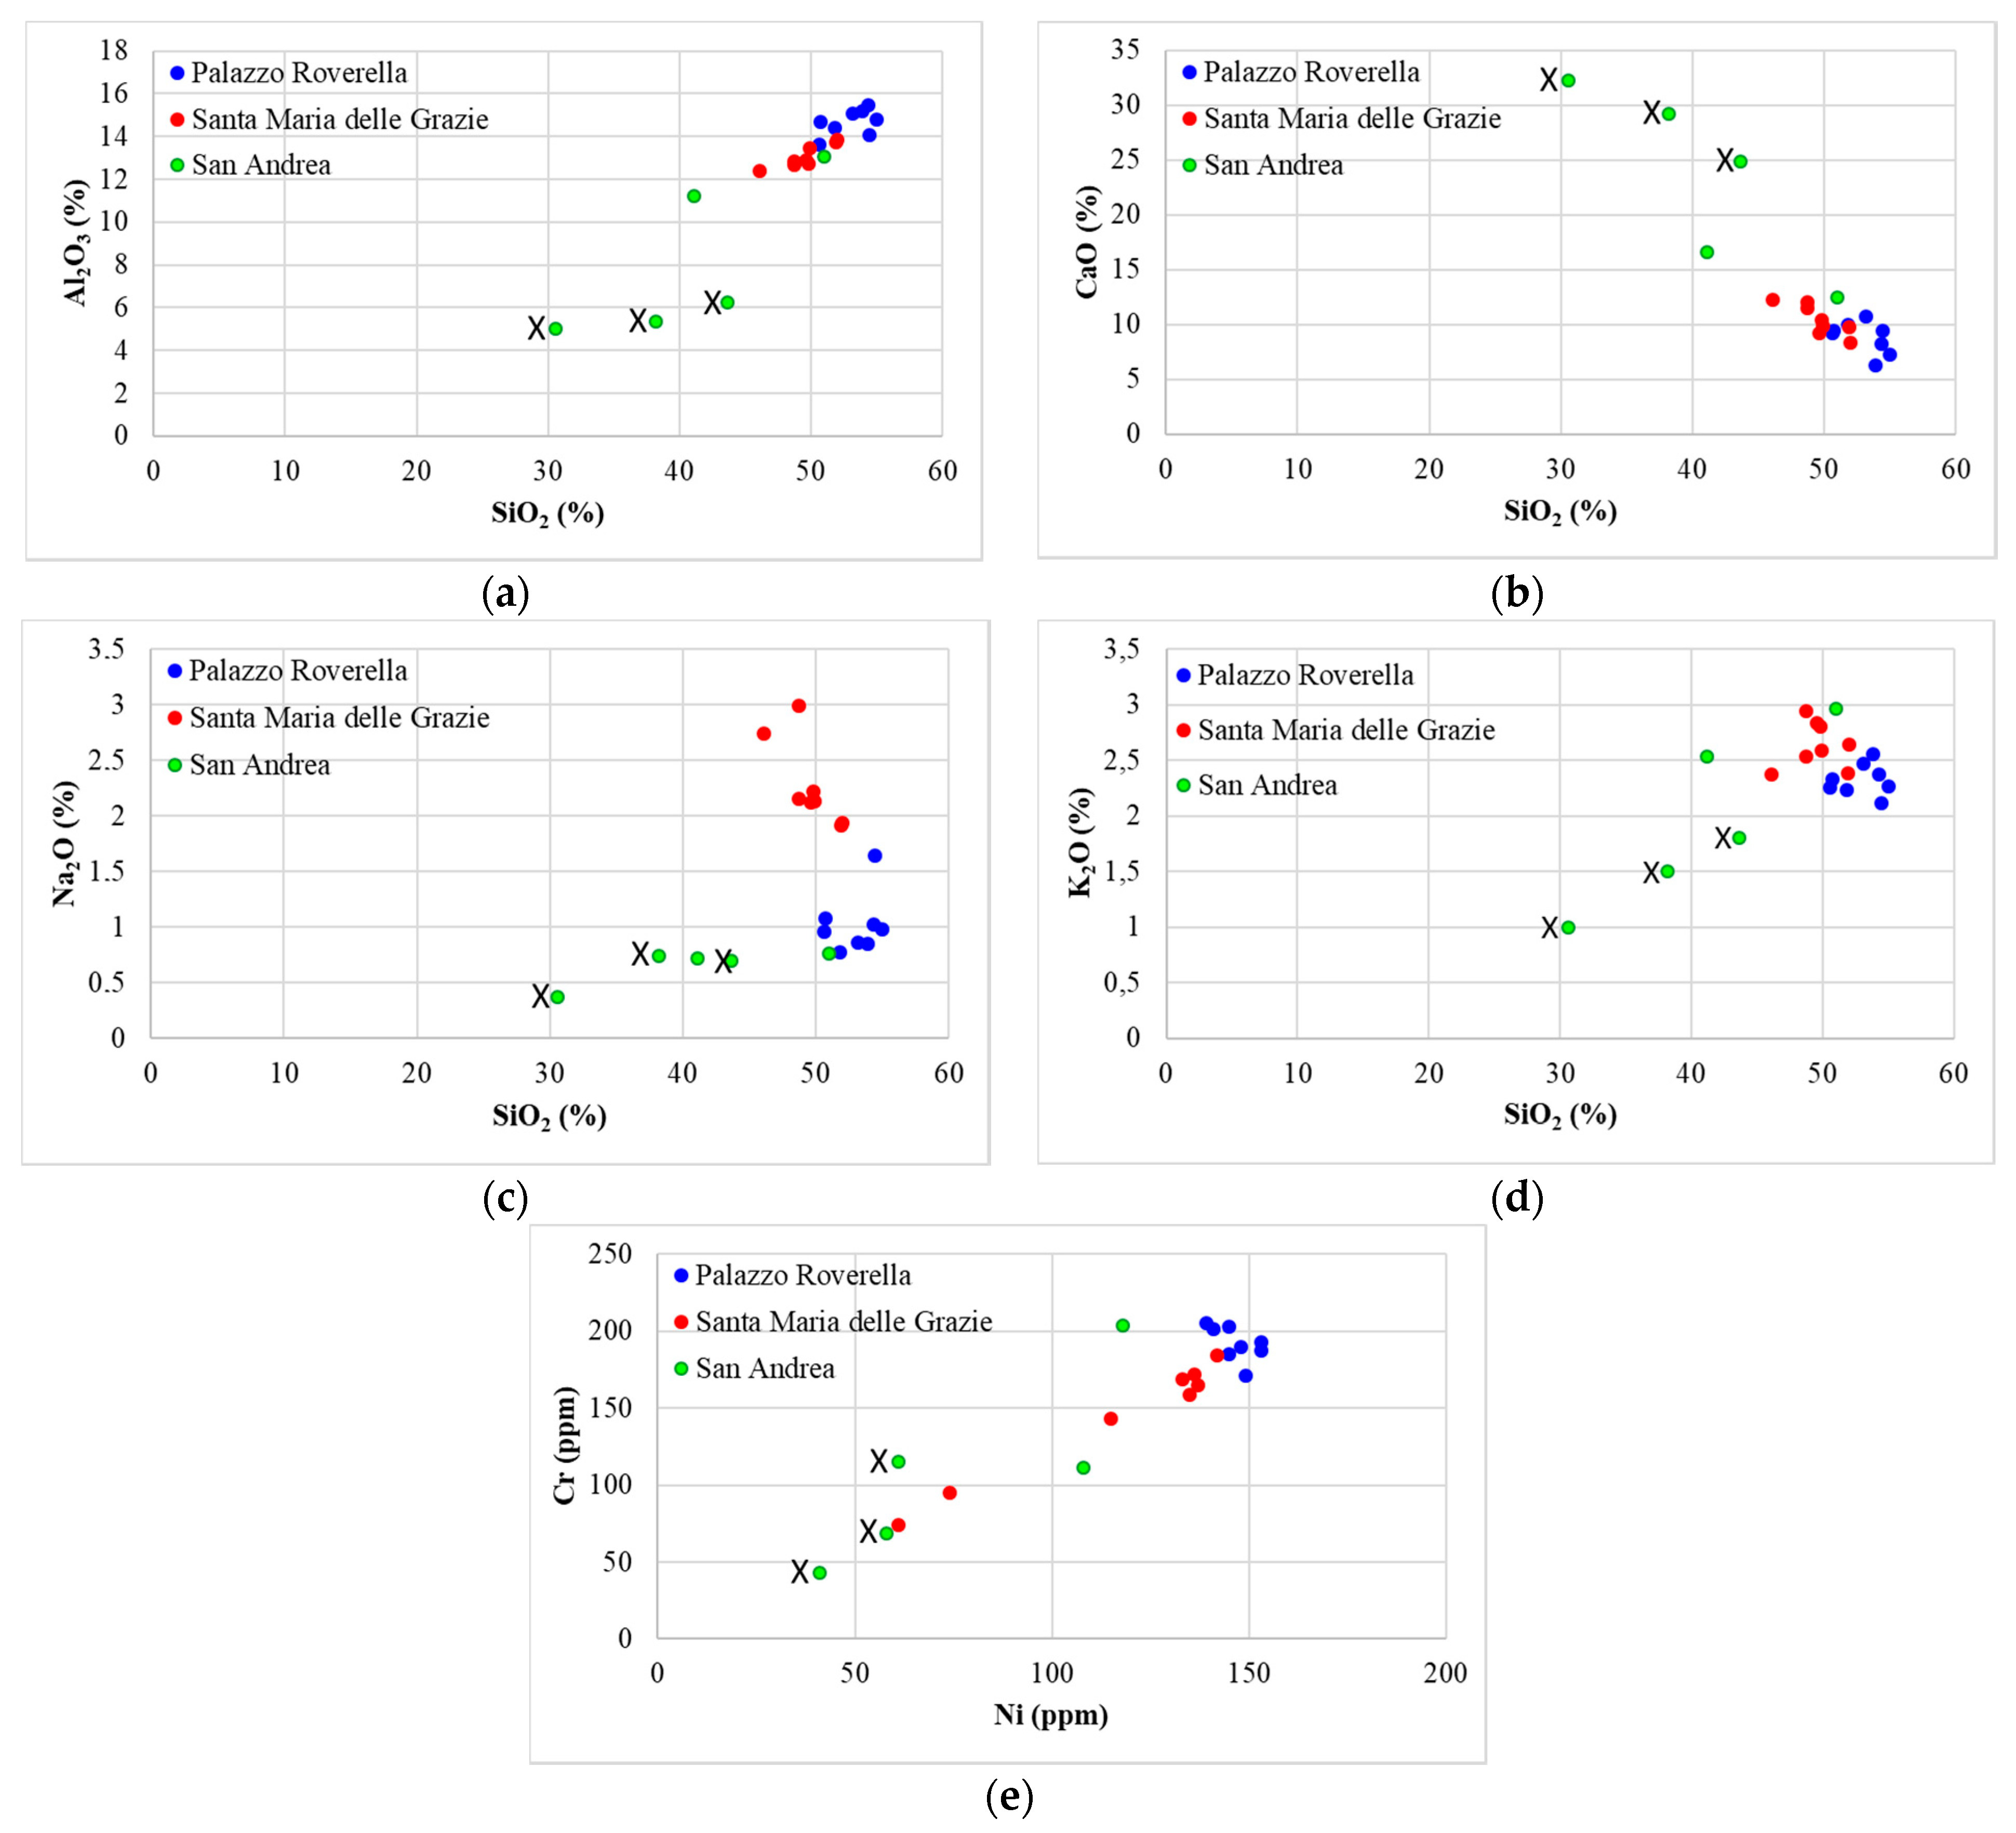
To better investigate the nature of the samples analyzed, these results were plotted using bivariate diagrams with SiO2 wt% as a variation index (Figure 4a–d).
In the binary diagrams, the samples of Palazzo Roverella (in blue) and Santa Maria delle Grazie (in red) presented similar concentrations characterized by high weight percentage of SiO2. Silica concentration was similar in the different kinds of samples (brick, cottos and plaster).
In contrast, the samples of San Andrea (in green) appeared different from each other. It was possible to note that the two brick samples showed a similar weight percentage to the samples collected in Palazzo Roverella and Santa Maria delle Grazie. However, the three plaster samples were characterized by a low weight percentage of silica oxide and a low weight percentage of the other oxides too, with respect to the other samples.
In detail, in the binary diagram Al2O3-SiO2 (Figure 4a), the collected samples of Palazzo Roverella and Santa Maria delle Grazie and the two samples of San Andrea relating to the bricks were grouped in a small area on the right top of the graph with a weight percentage of Al2O3 between 11 and 15, while the two plaster samples showed a very low weight percentage of Al2O3 around 5 and 6.
Figure 4b shows a higher value of CaO (around 30 and 32) of the three plaster samples collected in San Andrea with respect to bricks and cotto in which the weight percentage of CaO was between 6 and ~12. In addition, it was possible to note that the samples collected in the cloister of Santa Maria delle Grazie showed higher weight percentage of calcium oxide with respect to the samples collected in Palazzo Roverella. The restricted CaO range typical of the bricks of Palazzo Roverella and of the cotto of Santa Maria delle Grazie suggested that carbonate sediments were probably quarried as raw materials for brick production. This means that the Ferrara brick-makers noticed that CaO-rich clays produced bricks characterized by better physical-mechanical properties (e.g., higher compressive strength) because carbonates generally have a positive influence on brick textures by promoting a higher degree of vitrification [38,39].
The binary diagrams related to the alkalis (Na2O-SiO2 in Figure 4c and K2O-SiO2 in Figure 4d) show that the samples from the cloister of Santa Maria delle Grazie were generally more enriched in sodium oxide than those of Palazzo Roverella, which, on the other hand, were potassium-rich. The high values of sodium oxide (between 1.92 and 2.99%) in Santa Maria delle Grazie were probably due to the use of Na-rich flux. In contrast, high values of potassium oxide in the samples of Palazzo Roverella could indicate the use of a K-rich flux. In addition, the samples collected in San Andrea showed a similar weight percentage of Na2O to each other, but a different weight percentage of K2O (the bricks were more enriched in K2O with respect to the plaster).
The last binary diagram related to Ni-Cr (Figure 4e) shows the high value in ppm of nickel in the three sampling sites, except for only two samples from Santa Maria delle Grazie and for the plaster from San Andrea.

3.2. XRPD Analyses

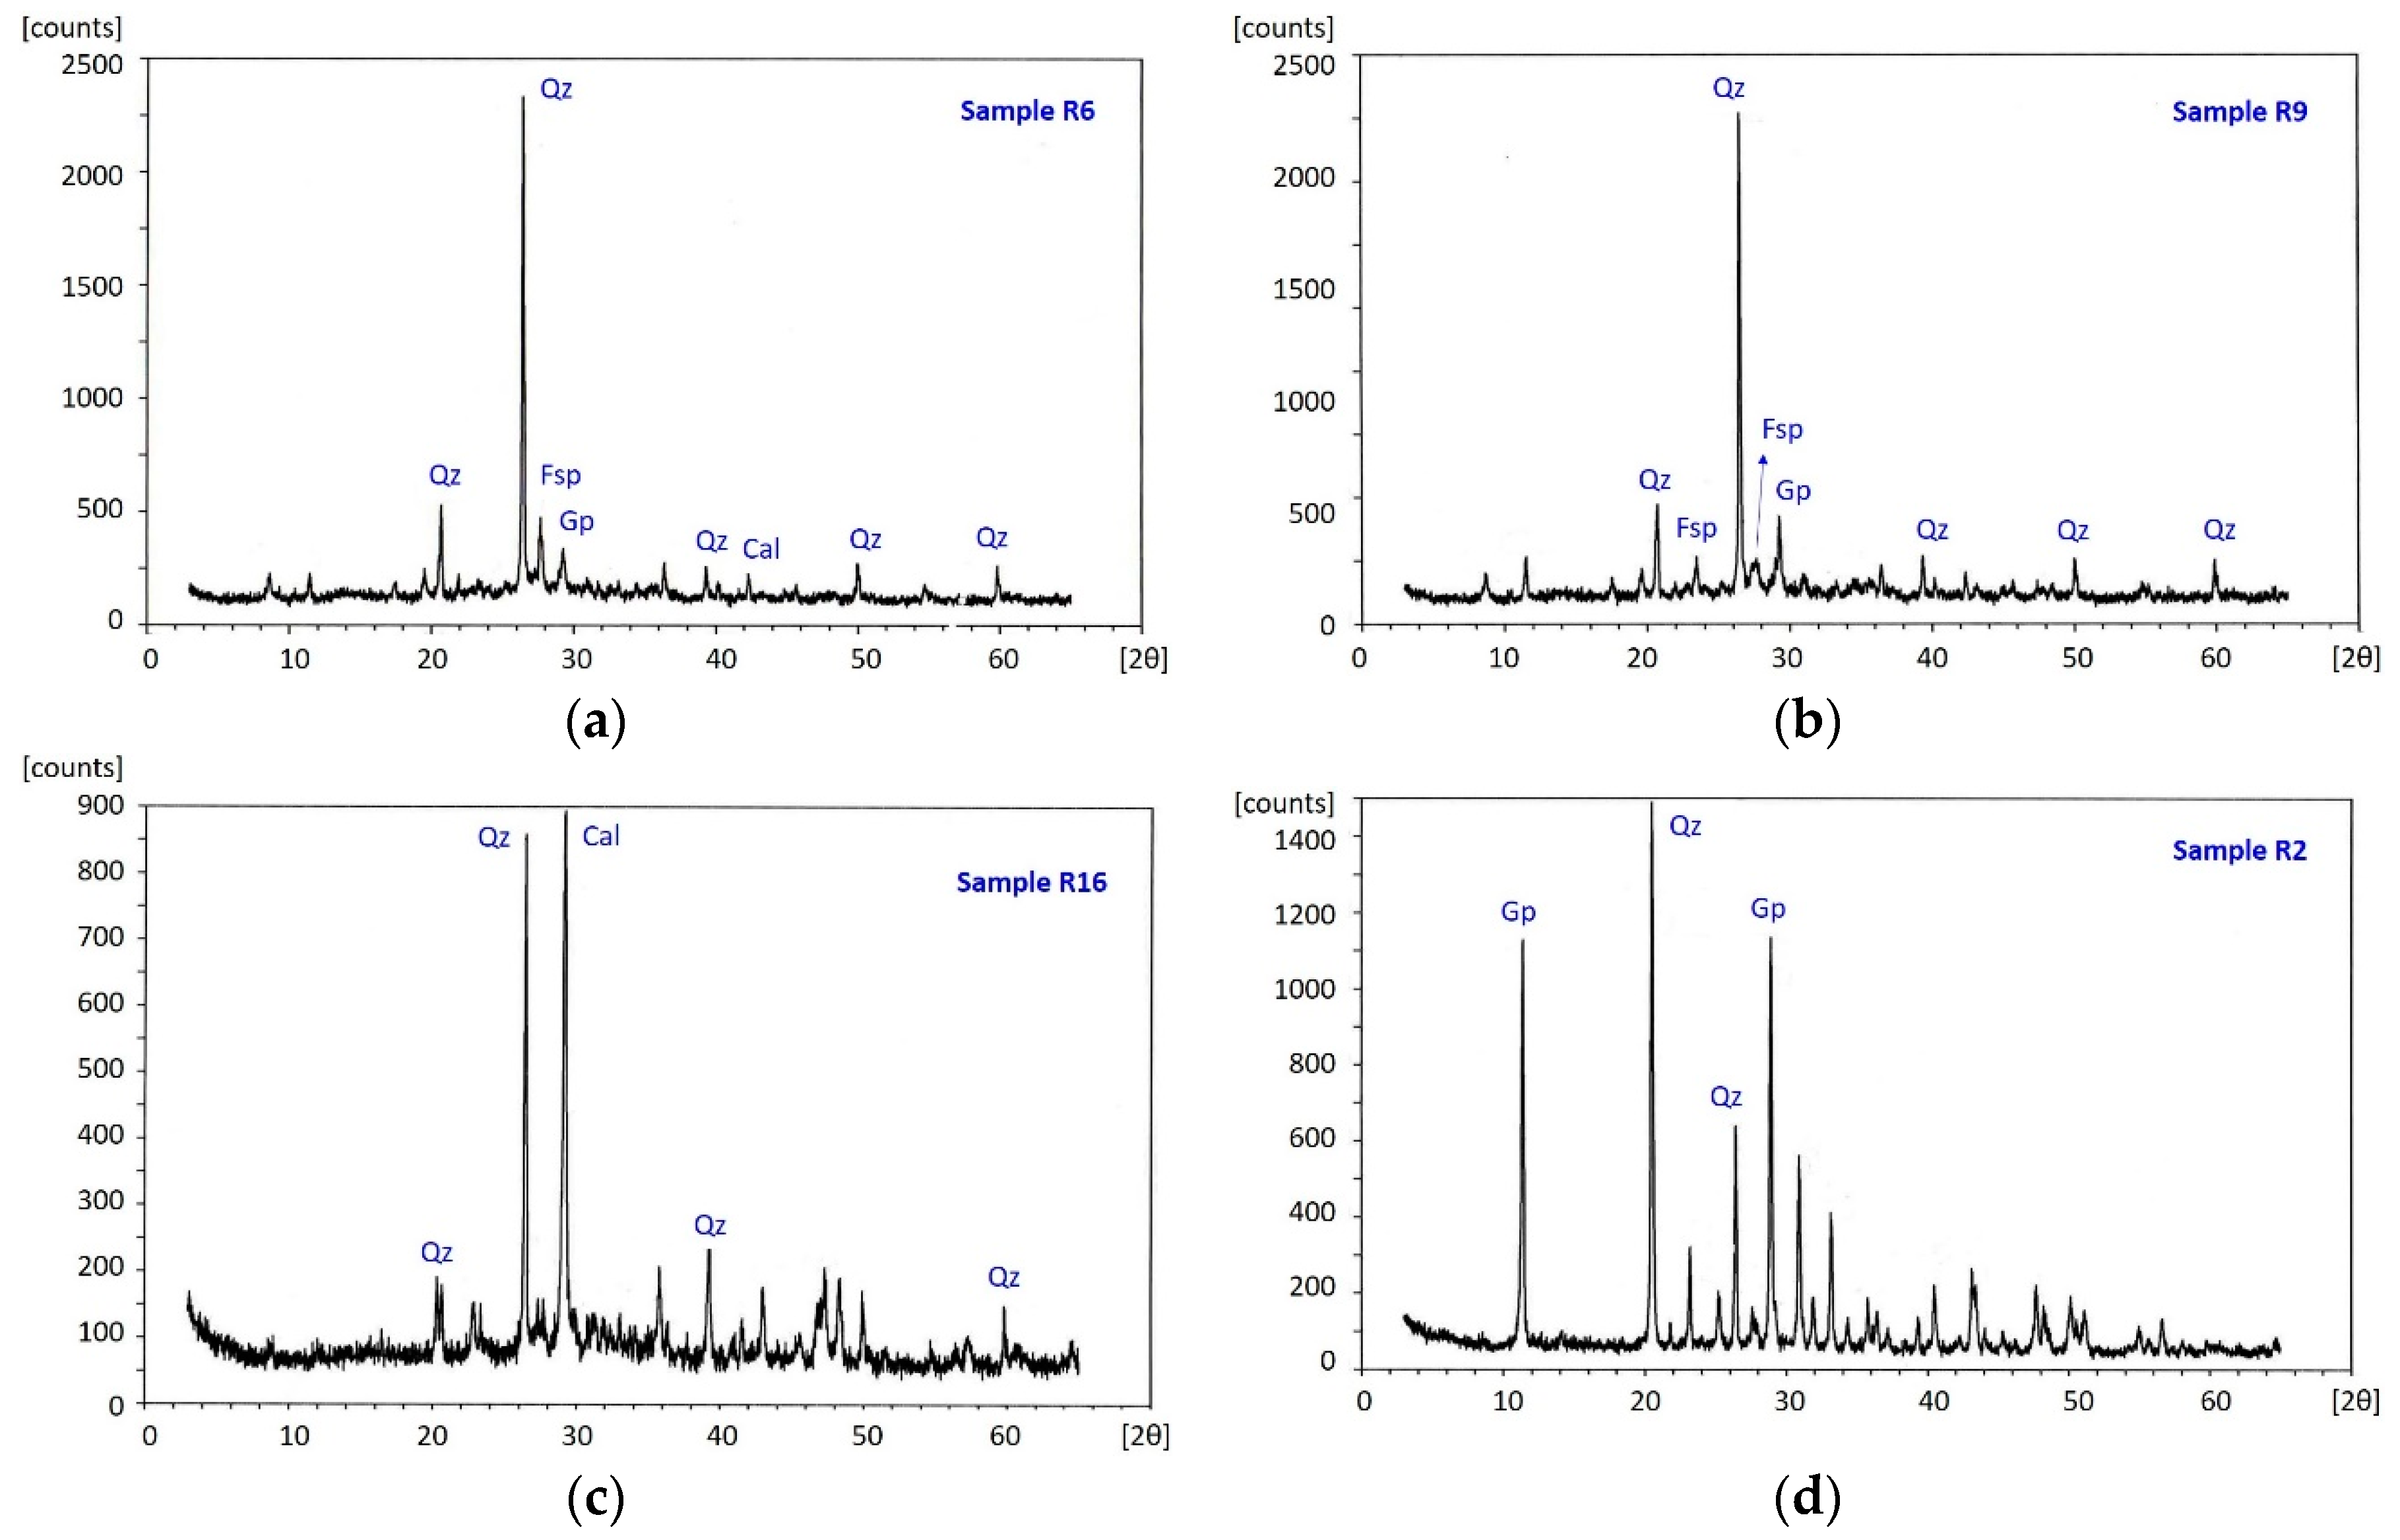
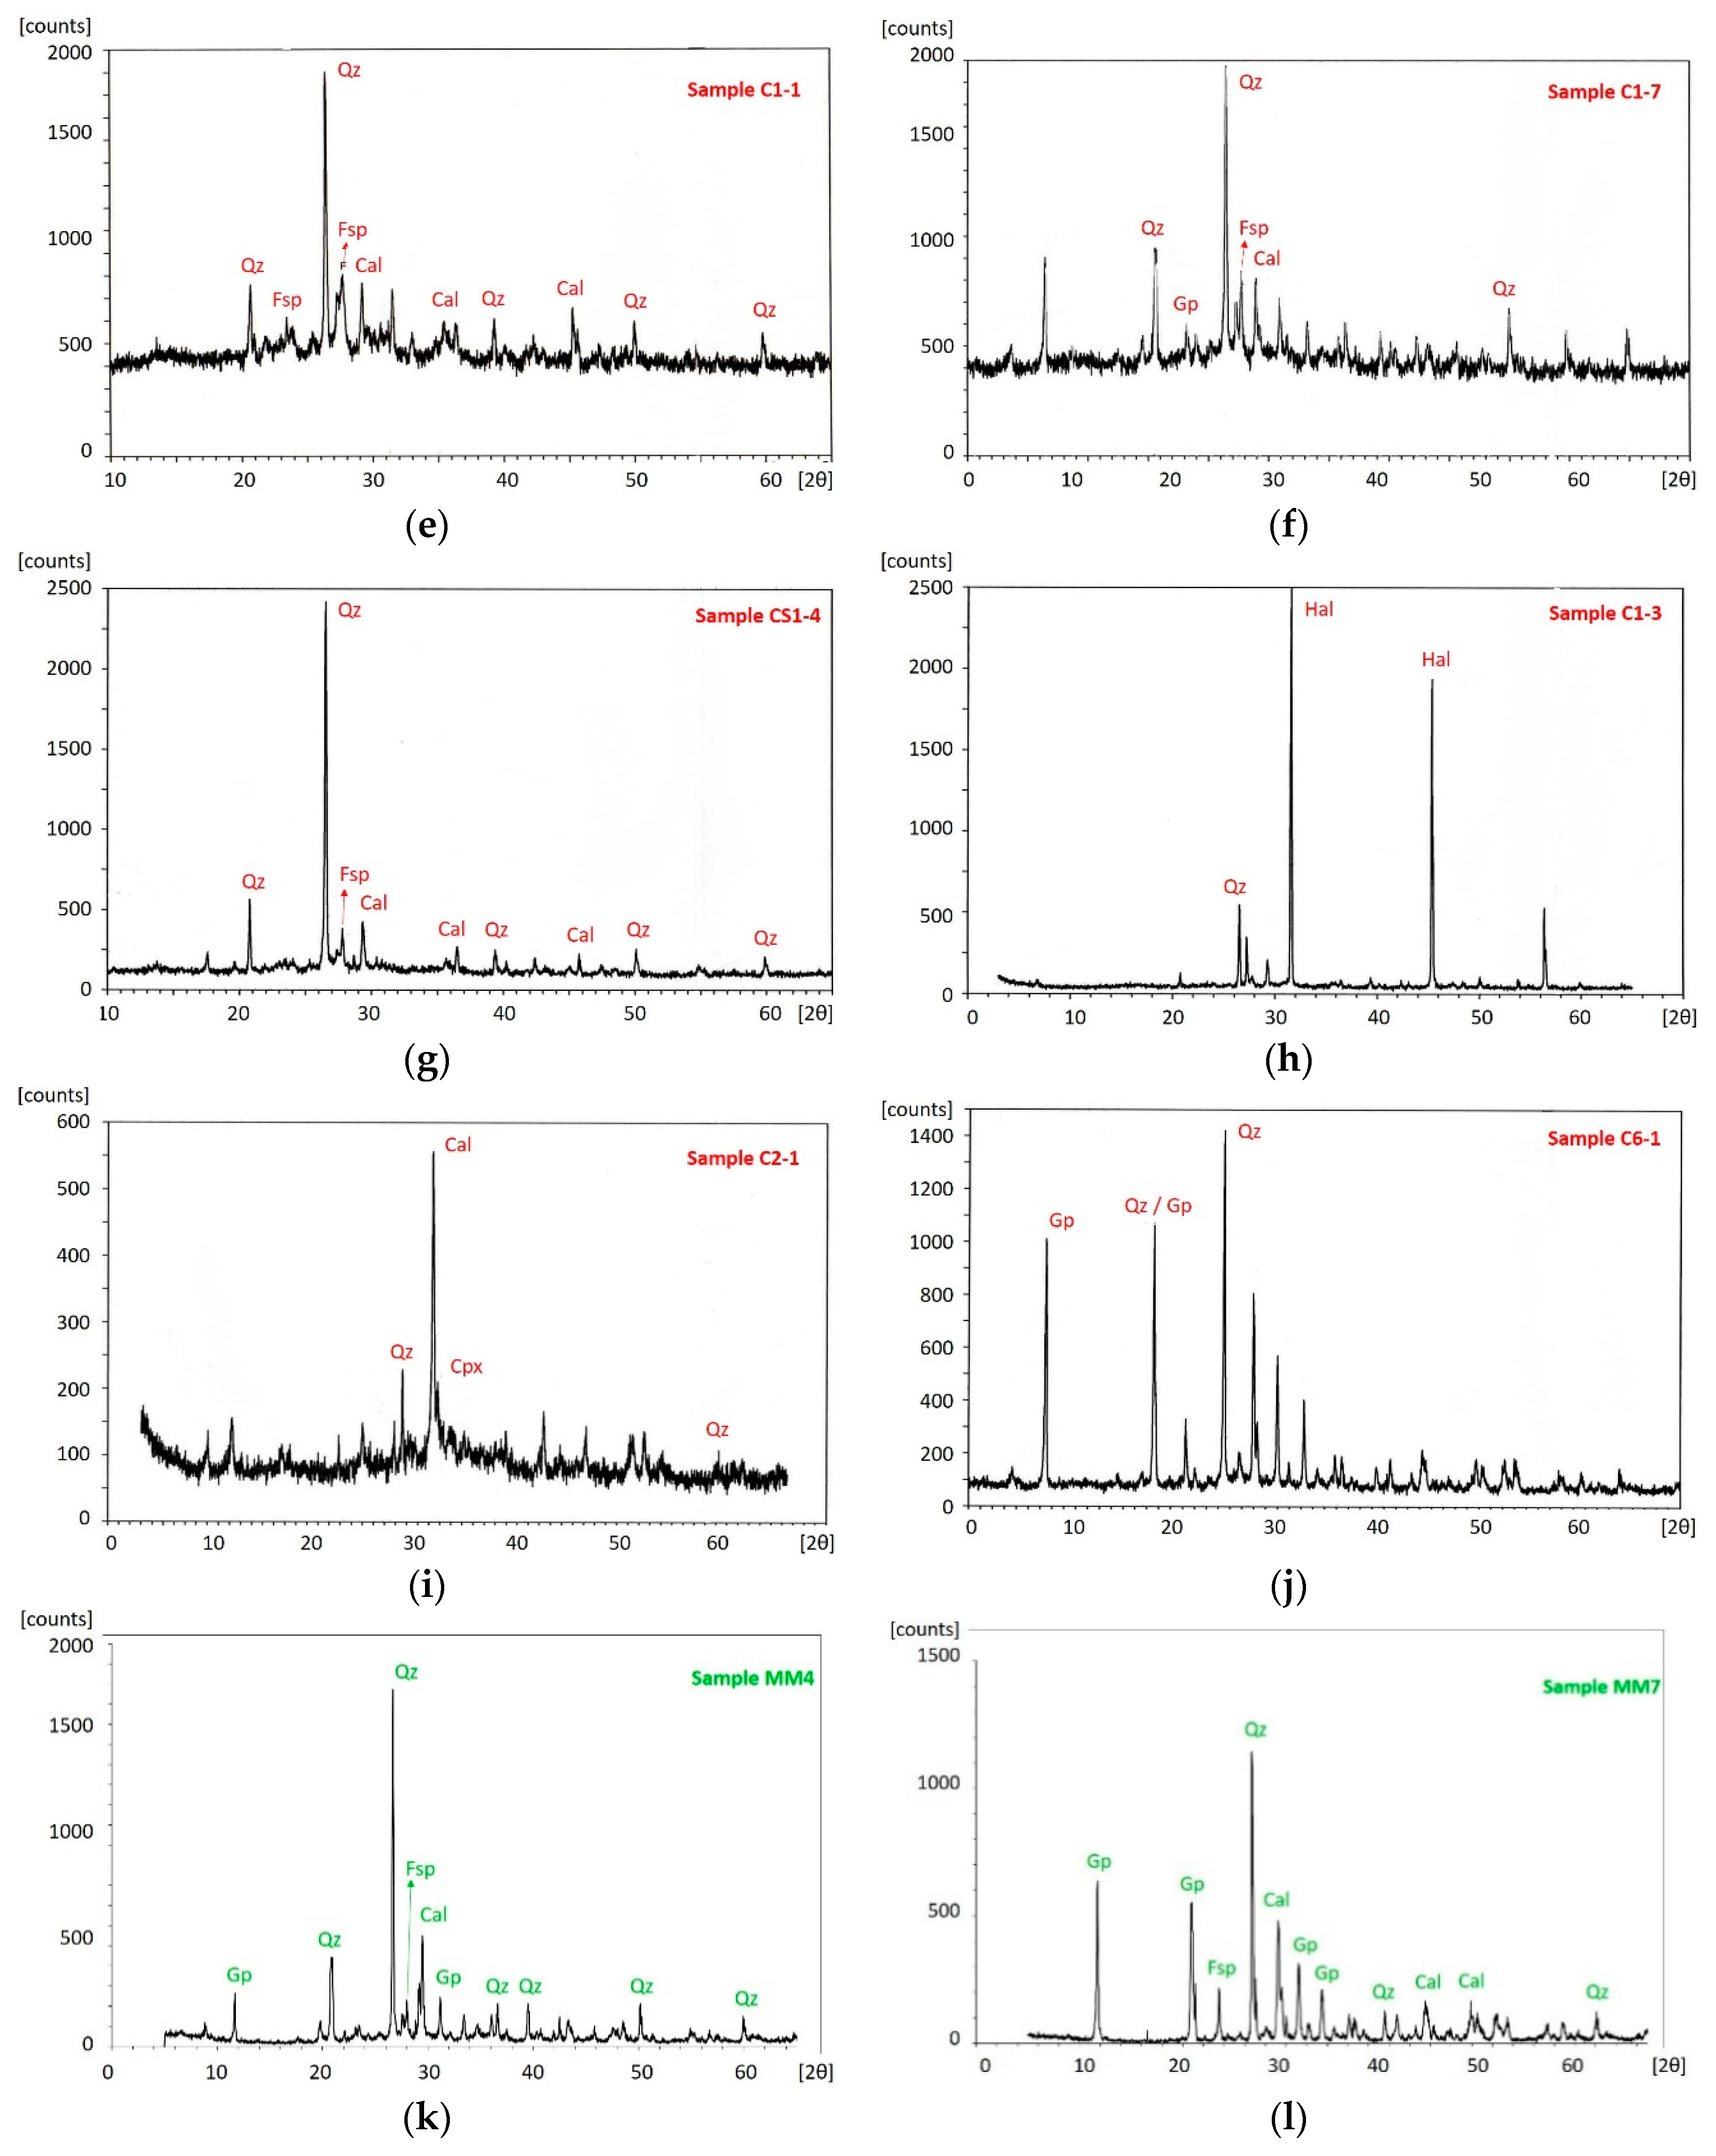
In order not to insert the diffractograms of all the samples, Table 3 summarizes the results obtained by XRPD analyses, which illustrate the main phases identified in the spectra of each sample. In Table 3, the samples were subdivided for categories in relation to the description for each sampling site and Figure 5 shows XRPD spectra from each category, as examples.
In all the samples, the phases were characterized by a high value of quartz followed by calcite and feldspar. In some samples, gypsum was detected. Small peaks of clinopyroxene, hematite, ilmenite, plagioclase and halite were also observed.
From diffractometric analyses, Figure 5a–c and d show the XRPD data of the samples collected in Palazzo Roverella. The samples appeared similar to each other, in which quartz was the major mineralogical phase followed by feldspar and calcite. In the diagram of Figure 5a, the sample R6 represented all the samples collected from the flower decoration of the façade, in which followed by quartz, the brick was enriched by feldspar and a small value of calcite, as confirmed by the XRF analysis. The opposite was true for the sample R9 (Figure 5b) that represented all the brick samples collected on the façade, in which feldspar followed the quartz peak and the peak of calcite was very small. Probably the smaller quantity of feldspar was to be attributed not to a reduced presence of aluminum, but to its division into several mineralogical phases. Figure 5c shows the diffractogram related to the sample R16 that represented the plaster samples of Palazzo Roverella. These samples were characterized by the predominance of calcite phase and quartz too. The last diffractogram was related to the sample R2 that represented the plaster collected on the façade of the palace, in which gypsum and quartz phases were prevalent (Figure 5d).
The diffractograms of the samples collected in the cloister of Santa Maria delle Grazie are shown in Figure 5e–j. In detail, Figure 5e–g illustrate the XRPD results of the samples of cotto, cotto degraded and mortar, respectively, characterized by a similar pattern in which quartz was the major mineralogical phase followed by feldspar and calcite. On the other hand, Figure 5h–j illustrate the degradation phenomena: saline efflorescence (Figure 5h) with high peaks of halite followed by quartz, and black crusts (Figure 5i,j). The presence of gypsum in the samples C6-1 (sulfated black crust) probably could be related to a high value of sulfur [41]. The façade of the cloister of Santa Maria delle Grazie overlooks a narrow and busy street, this could be one of the reasons to better understand the presence of black crusts in the samples collected on the cloister façade [42,43,44].
The samples collected in the church of San Andrea were also characterized by a high quartz peak, but in a lower concentration than the samples from Palazzo Roverella and Santa Maria delle Grazie. In detail, in the bricks (as shown in Figure 5k) quartz was the major mineralogical phase followed by calcite and feldspar. In addition, a gypsum phase was observed, probably as testimony to the fact that plaster was applied in subsequent periods to the construction of the church perhaps with a gypsum-based binder that may have left traces in the samples analyzed [45]. In the plaster, quartz was the major mineralogical phase followed by calcite and alkali feldspar (Figure 5l). This could indicate a standard composition of a mortar, with calcite as a binder and a quartz-feldspar skeleton: the analysis shows calcite mixed with quartz (silica) that was a popular mix for mortars before starting to use cement mortars [46]. A gypsum peak was also observed, which could indicate a binder based not only on lime, but on lime and gypsum.

4. Discussion

The city of Ferrara is situated in the alluvial plain of the Po River at the junction between the internal part the Po River delta plain and the alluvial plain of the Reno River [47].
To investigate the nature of the raw materials, the XRF results were compared with XRF data of two natural sediments from the Po alluvial plain around Ferrara: clays from the Reno river that flows to the south part of Ferrara and comes from the Apennines, and sand and clays from the Po river which flows in the northern area of Ferrara and comes from the Western Alps (Figure 6) [48]. One or both of these sediments may have been used as raw material for the construction of bricks, plaster and/or mortars.
In all the binary diagrams, the Reno clays appeared more homogeneous, while those of the Po river were more dispersive to each other but even so always centered in a single area of the graphs. In addition, clays and sands from the Po river differed from each other in the concentration of silica, of which the sand sediments were enriched with respect to the clays.
In the binary diagram Al2O3-SiO2 of Figure 7a, the collected samples from Palazzo Roverella and Santa Maria delle Grazie were grouped in a small area of the graph represented by high weight percentage of Al2O3 as for the clay samples, both from the Reno river and the Po river. The samples of both historical buildings showed a lower weight percentage of aluminum oxide than that of the local clays, while the samples from the church of San Andrea appeared different with respect to the two clays analyzed, with a lower weight percentage of silica oxide and aluminum oxide. Only the two bricks from San Andrea appeared similar in aluminum oxide concentration to the sand of the Po river.
The opposite was true for the binary diagram CaO-SiO2, in which all five samples from San Andrea showed a higher weight percentage of CaO with respect to the two types of clays. Instead, the samples collected in Palazzo Roverella and Santa Maria delle Grazie showed a similar weight percentage of CaO and SiO2 as the two type of clays and a similar weight percentage of CaO to the sand of the Po river (Figure 7b).
As regards the alkalis (binary diagram Na2O-SiO2 in Figure 7c and K2O-SiO2 in Figure 7d), all the samples from Palazzo Roverella and Santa Maria delle Grazie had high sodium oxide weight percentage compared to the two types of clays. The excess of Na2O, especially in the samples from Santa Maria delle Grazie, cannot be ascribed to the introduction of clay in the starting material. This could be induced by soluble salts precipitated from Na-bearing aqueous solutions [49,50,51]. As a matter of fact, the cotto samples from Santa Maria delle Grazie were collected not far from the floor, in positions probably accessible to capillary rise of ground water [52,53]. On the other hand, the samples from Palazzo Roverella were collected in a position not accessible to rain and/or ground water, so we could hypothesize an addition of a Na-rich component (maybe vegetable ash) as a fluxing agent incorporated during the firing phase [54]. On the opposite side, the samples collected in the church of San Andrea showed a similar weight percentage of sodium oxide of the two type of clays. However, the majority part of the samples from Santa Maria delle Grazie showed a similar weight percentage of Na2O to the sand from the Po river, in fact the sand evidenced a higher weight percentage of Na2O with respect to the clay. In addition, the similar potassium oxide values between the clays and the samples analyzed (except for the three plasters from San Andrea) could suggest that the raw materials were probably mixed to obtain a suitable composition. The three plasters from San Andrea could be due to subsequent restoration. As for the comparison with the sand, all the samples from Palazzo Roverella and also the majority of samples of the Po clay showed a similar weight percentage of K2O.
In accordance with Bianchini et al. 2002 [48] to address the provenance of the materials used, trace elements such as Ni and Cr (expressed in ppm) indicated that the clay sediments around Ferrara could be separated into two groups characterized by high (Cr >180 ppm and Ni >100 ppm; high-Cr) and low (Cr <180 ppm and Ni <100 ppm; low-Cr) contents. The low-Cr sediments were characterized by a higher proportion of clay minerals in which smectite + mixed layers were more abundant than chlorite. The high-Cr sediments were characterized by a coarser grain size and a lower abundance of clay minerals, with chlorite predominating over smectite + mixed layers. In the binary diagram related to Ni-Cr (Figure 7e), the Cr concentration discriminated the clays from the Reno river (low Cr value) with respect to the clays from Po river (high Cr value). Clays from the Reno river had a low concentration of Ni too. This means a difference between the concentration of metals (Ni-Cr) in the fine fraction of the sediments of the two rivers. Most of the samples showed similar values to the clays from Po river, characterized with high-Cr, except for the two samples of Santa Maria delle Grazie (sample C1-7 and C2-3) and all the samples from San Andrea, that were characterized by clays with low-Cr similar to clays from the Reno river. In the graph of Figure 7e the concentrations of Ni and Cr in the sands from the Po river were similar to clays from the Reno river and lower with respect to the clays from Po river, could be explained considering that if present, Cr and Ni were usually concentrated in the clay fraction.
To better characterize the materials used in the construction of the historical buildings analyzed, a comparison between the XRF data of the samples collected and analyzed in this work and the samples collected in similar historical buildings in the city center of Ferrara was carried out.
The historical buildings used for the comparison were shown in Figure 1 colored in light blue; as you can see all the buildings were located in the city center and they were built in the same periods as the Palazzo Roverella and Santa Maria delle Grazie: monastery of san Antonio in Polesine (XII−XVI century), church of Santa Maria in Vado (XV−XVI century), church of Santo Stefano (XV−XVI century), Palazzo Schifanoia (XV−XVI century) and the Cathedral (XV−XVI century).
The XRF data of these other historical buildings were available in Bianchini, et al. [55].
The binary diagrams related to Al2O3-SiO2 (Figure 8a), CaO-SiO2 (Figure 8b) and the alkalis (binary diagrams Na2O-SiO2 in Figure 8c and K2O-SiO2 in Figure 8d) show that the samples of Palazzo Roverella and of the cloister of Santa Maria delle Grazie had values comparable to those collected in the other historical buildings. The samples collected in the church of San Andrea were separate from the group, probably because three samples were plaster, instead of bricks and cotto.
Figure 8e shows the binary diagram Ni-Cr, in which there was no evident correlation between the different samples.
In addition, following the results obtained by XRPD bulk analyses (Table 3), according to the mineralogical phases found and in accordance with Bianchini et al. and Duminuco et al. [55,56], we could propose that the presence of carbonates and/or clinopiroxens, recorded in several samples, suggests that an equilibrium condition of the mixtures was not attained. This could be related to the inhomogeneity of the original starting materials, consisting of microdomains of different composition and indicating a limited mobility of the chemical species during the firing processes [55,56]. Moreover, XRPD bulk analyses cannot be considered completely reliable for the estimation of firing temperatures [55,56], this is clear considering some samples characterized by “ambiguous parageneses” containing carbonate minerals (an indicator of low firing temperature, i.e., <850 °C) and clinopyroxene and/or plagioclase (usually considered high-temperature products, i.e., >950 °C).

5. Conclusions

In this paper, the chemical and mineralogical characterization of bricks, cotto, mortars and plaster from historical buildings in Ferrara allowed the nature of the original raw materials (i.e., clay-rich sediments of local provenance) to be evaluated and the technological information regarding the manufacture (i.e., firing temperatures between c. 800 °C and 1000 °C) to be defined. This information could be a useful investigation tool and provide guidelines for the production and use of new bricks, and terracotta elements, durable and compatible with historical materials. The preservation of ancient architectural heritage is extremely important and should be taken into account during the restoration and conservation of damaged historical masonry.
The samples collected in Palazzo Roverella and in the cloister of Santa Maria delle Grazie show the same chemical composition correlating to other historical buildings of the city center and built in the same periods. All these samples came from different extraction sites but always within the basin of the Po delta in the Ferrara area. The differences found in the major elements were probably due to possible corrections of the original clayey mixture with locally sourced quartz-feldspar sand. These results provide important information for the production and use of bricks, cotto and plaster that are compatible with the historical materials.
Data obtained defined some technological information regarding the manufacture and some information regarding the different provenance of the raw materials. Most of the medieval Renaissance bricks and cotto materials studied seem to have been prepared starting from high-Cr sediments, as these clays show a chemical affinity with the present-day Po river sediments. The low-Cr compositions (recorded in only a few samples) were analogous to the sediments of rivers flowing from the Bolognese Apennines. In accordance with Bianchini et al. [55], this probably means that low-Cr clays were not available in the Ferrara area at that time. It is plausible to assume that low-Cr clays were introduced in the area only after important hydraulic works in the 14th–16th centuries [57] resulted in the diversion of some Apennine torrent rivers (e.g., the Reno river) into the southern branches of the Po river (which was flowing south of Ferrara at that time). Thanks to this information, it was possible to establish that the samples collected in Palazzo Roverella and in the cloister of Santa Maria delle Grazie were built with materials with similar chemical and mineralogical characteristics compared with other historical buildings of the city. However, the samples collected in the church of San Andrea showed different characteristics from the other two buildings.
This study shows that characterizing the old construction materials used and establishing the causes of the decay, if possible, could be useful for the planning of suitable restoration treatment and to identify and characterize the materials that were used to make these architectural elements [58,59]. This gives the restorer adequate information for choosing suitable new materials when replacement is necessary and to avoid incorrect restoration materials.

Author Contributions

Conceptualization, E.M., C.T. and C.V.; methodology, E.M., C.T. and C.V.; formal analysis, E.M. and C.V.; investigation, E.M., C.T. and C.V.; resources, C.V.; data curation, E.M., C.T. and C.V.; writing—original draft, E.M., C.T. and C.V.; visualization, E.M. and C.T.; supervision, E.M. and C.V.; project administration, C.V.; funding acquisition, C.V. All authors have read and agreed to the published version of the manuscript.

Funding

This research received no external funding.

Acknowledgments

The authors would like to acknowledge the anonymous reviewers and the Editors who all allowed us to improve our manuscript considerably with their constructive comments and suggestions. We are also grateful to Dott.ssa Chiara Guarnieri of the direction of the Superintendence for the Archaeological Heritage of Emilia Romagna for making the samples available.

Conflicts of Interest

The authors declare no conflict of interest.

References

  1. UNSECO. Ferrara, City of the Renaissance, and Its Po Delta. Available online: https://www.unesco.beniculturali.it/en/projects/ferrara-citta-del-rinascimento-e-il-delta-del-po/ (accessed on 26 October 2020).
  2. Iotti, R. Estensi, Prima Parte: La Corte di FERRARA; Il Bulino: Modena, Italy, 1997. [Google Scholar]
  3. Rosenberg, C.M. The Este Monuments and Urban Development in Renaissance Ferrara; Cambridge University Press: Cambridge, UK, 1997. [Google Scholar]
  4. McIver, K.A.; Rosenberg, C.M. The Este Monuments and Urban Development in Renaissance Ferrara. Sixt. Century J. 1998, 29, 121. [Google Scholar] [CrossRef]
  5. McIver, K.A. The Este Monuments and Urban Development in Renaissance Ferrara. Renaiss. Stud. 1999, 13, 230–233. [Google Scholar] [CrossRef]
  6. Dean, T. Land and Power in Late Medieval Ferrara: The Rule of the Este, 1350–1450; Cambridge University Press: Cambridge, UK, 1987. [Google Scholar]
  7. Guarnieri, C. Archeologia urbana a Ferrara e nel ferrarese; le ultime scoperte. In Uno Sguardo sul Passato. Archeologia nel Ferrarese; Berti, F., Ed.; All’Insegna del Giglio: Florence, Italy, 1995; pp. 183–206. [Google Scholar]
  8. Frizzi, A. Memorie per la Storia di Ferrara; Abbam Servadio: Ferrara, Italy, 1791. [Google Scholar]
  9. Frizzi, A. Memorie per la Storia di Ferrara: Diario di Antonio Frizzi in continuazione delle memorie per la storia di Ferrara; Abbam Servadio: Ferrara, Italy, 1858. [Google Scholar]
  10. Ceccarelli, F.; Marchesi, A.; De Norcen, M.T.S. Biagio Rossetti 1444–1516, Architettura e Documenti; Bononia University Press: Bologna, Italy, 2019. [Google Scholar]
  11. Farinelli, A.; Scafuri, F. Ferrara VII-XX Secolo. Trasformazioni, Addizioni, Ampliamenti; Comune di Ferrara: Ferrara, Italy, 1991. [Google Scholar]
  12. Zevi, B. Saper Vedere L’urbanistica. Ferrara di Biagio Rossetti, la Prima Città Moderna Europea; Einaudi: Turin, Italy, 1971. [Google Scholar]
  13. Marciano, A.F. L’età di Biagio Rossetti: Rinascimenti di Casa d’Este; Corbo: Ferrara, Italy, 1991. [Google Scholar]
  14. Genta, L. Il Palazzo Magnanini detto Roverella e Il Circolo dei Negozianti; Pineda: Ferrara, Italy, 1947. [Google Scholar]
  15. Guarini, M.A. Compendio Historico Dell’Origine, Accrescimento e Prerogative delle Chiese e Luoghi pii Della Città e Diocesi di Ferrara; Eredi Baldini: Ferrara, Italy, 1621. [Google Scholar]
  16. Scalabrini, G.A. Memorie Storiche Della Chiesa di Ferrara e dei Suoi Borghi; Coatti: Ferrara, Italy, 1773. [Google Scholar]
  17. Giordano, B. Il Monastero Agostiniano di Santa Maria delle Grazie Detto di Mortara; Deputazione Provinciale Ferrarese di Storia Patria, Atti e Memorie: Ferrara, Italy, 2000; pp. 15–30. [Google Scholar]
  18. Marzola, M. Per la Storia Della Chiesa Ferrarese nel Secolo XVI (1497–1590); Società Editrice Internazionale: Turin, Italy, 1976. [Google Scholar]
  19. Barotti, C. Iscrizioni sepolcrali e civili di Ferrara. Manoscritto Biblioteca Comunale Ariostea Mignani, cl. 528.
  20. Medri, G. Chiese di Ferrara nella Cerchia Antica; Banca di credito Agrario di Ferrara: Bologna, Italy, 1967. [Google Scholar]
  21. Frahm, E.; Doonan, R. The technological versus methodological revolution of portable XRF in archaeology. J. Archaeol. Sci. 2013, 40, 1425–1434. [Google Scholar] [CrossRef]
  22. Gómez-Laserna, O.; Arrizabalaga, I.; Prieto-Taboada, N.; Olazabal, M.A.; Arana, G.; Madariaga, J.M. In situ DRIFT, Raman, and XRF implementation in a multianalytical methodology to diagnose the impact suffered by built heritage in urban atmospheres. Anal. Bioanal. Chem. 2015, 407, 5635–5647. [Google Scholar] [CrossRef] [PubMed]
  23. Hormes, J.; Diekamp, A.; Klysubun, W.; Bovenkamp, G.-L.; Börste, N. The characterization of historic mortars: A comparison between powder diffraction and synchrotron radiation based X-ray absorption and X-ray fluorescence spectroscopy. Microchem. J. 2016, 125, 190–195. [Google Scholar] [CrossRef]
  24. Szczepaniak, M.; Nawrocka, D.; Mrozek-Wysocka, M. Applied geology in analytical characterization of stone materials from historical building. Appl. Phys. A 2008, 90, 89–95. [Google Scholar] [CrossRef]
  25. Freire, M.T.; Santos Silva, A.; do Rosário Veiga, M.; de Brito, J. The history of Portuguese interior plaster coatings: A mineralogical survey using XRD. Archaeometry 2015, 57, 147–165. [Google Scholar] [CrossRef]
  26. Ghale, D.B.; Bohara, N.B.; Duwal, N.; Bhattarai, J. Investigation on the mineralogical phase of ancient brick samples of Kathmandu valley (Nepal) using XRD and FTIR analysis. Rasayan J. Chem. 2019, 12, 402–408. [Google Scholar] [CrossRef]
  27. Figueiredo, M.; Silva, T.; Veiga, J. Analysis of degradation phenomena in ancient, traditional and improved building materials of historical monuments. Appl. Phys. A 2008, 92, 151–154. [Google Scholar] [CrossRef]
  28. Boukir, A.; Fellak, S.; Doumenq, P. Structural characterization of Argania spinosa Moroccan wooden artifacts during natural degradation progress using infrared spectroscopy (ATR-FTIR) and X-Ray diffraction (XRD). Heliyon 2019, 5, e02477. [Google Scholar] [CrossRef] [Green Version]
  29. Hassan, S.A.M. Multiscientific approach for the characterization and assessment of the degradation state of the historical Al-Shafi’i mosque walls (Jeddah, Kingdom of Saudi Arabia). Sci. Cult. 2021, 7, 1–19. [Google Scholar]
  30. Marrocchino, E.; Telloli, C.; Caraccio, S.; Guarnieri, C.; Vaccaro, C. Medieval Glassworks in the City of Ferrara (North Eastern Italy): The Case Study of Piazza Municipale. Heritage 2020, 3, 819–837. [Google Scholar] [CrossRef]
  31. Franzini, M.; Leoni, L.; Saitta, M. Revisione di una metodologia analitica per fluorescenza X basata sulla correzione completa degli effetti di matrice. Rend. Soc. Ital. Mineral. Petrogr. 1975, 31, 365–378. [Google Scholar]
  32. Marrocchino, E.; Rapti-Caputo, D.; Vaccaro, C. Chemical-mineralogical characterisation as useful tool in the assessment of the decay of the Mesóla Castle (Ferrara, Italy). Constr. Build. Mater. 2010, 24, 2672–2683. [Google Scholar] [CrossRef]
  33. Lachance, G.R.; Traill, R.J. Practical solution to the Matrix problem in X-ray analysis. Can. Spectrosc. 1966, 11, 43–48. [Google Scholar]
  34. Rousseau, R.M. Corrections for matrix effects in X-ray fluorescence analysis—A tutorial. Acta Part B At. Spectrosc. 2006, 61, 759–777. [Google Scholar] [CrossRef]
  35. Liu, H.; Zhou, X.; Zhang, X.; Wu, K.; Lu, C. Experimental Study and Matrix Effect Correction of Pseudobinary Samples in XRF Analysis. IOP Conf. Series Mater. Sci. Eng. 2018, 389, 012002. [Google Scholar] [CrossRef]
  36. Marrocchino, E.; Telloli, C.; Pedrini, M.; Vaccaro, C. Natural stones used in the Orsi-Marconi palace façade (Bologna): A petro-mineralogical characterization. Heritage 2020, 3, 1109–1123. [Google Scholar] [CrossRef]
  37. Bergamaschi, B.; Marzola, L.; Radice, M.; Manfredini, S.; Baldini, E.; Vicentini, C.B.; Marrocchino, E.; Molesini, S.; Ziosi, P.; Vaccaro, C.; et al. Comparative Study of SPA Mud from “Bacino Idrominerario Omogeneo dei Colli Euganei (B.I.O.C.E.)—Italy” and Industrially Optimized Mud for Skin Applications. Life 2020, 10, 78. [Google Scholar] [CrossRef]
  38. Elert, K.; Coltrone, G.; Navarro, C.R.; Pardo, E.S. Durability of bricks used in the conservation of historic buildings influence of composition and microstructure. J. Cult. Herit. 2003, 4, 91–99. [Google Scholar] [CrossRef]
  39. Cantù, M.; Giacometti, F.; Landi, A.G.; Riccardi, M.P.; Tarantino, S.C.; Grimoldi, A. Characterization of XVIIIth century earthen mortars from Cremona (Northern Italy): Insights on a manufacturing tradition. Mater. Charact. 2015, 103, 81–89. [Google Scholar] [CrossRef]
  40. Whitney, D.L. Abbreviations for Names of Rock-Forming Minerals. Am. Mineral. 2010, 95, 185–187. [Google Scholar] [CrossRef]
  41. Toniolo, L.; Zerbi, C.M.; Bugini, R. Black layers on historical architecture. Environ. Sci. Pollut. Res. 2009, 16, 218–226. [Google Scholar] [CrossRef]
  42. Sabbioni, C.; Zappia, G.; Ghedini, N.; Gobbi, G.; Favoni, O. Black crusts on ancient mortars. Atmos. Environ. 1998, 32, 215–223. [Google Scholar] [CrossRef]
  43. Potgieter-Vermaak, S.S.; Godoi, R.H.M.; Van Grieken, R.; Potgieter, J.H.; Oujja, M.; Castillejo, M. Micro-structural characterization of black crust and laser cleaning of building stones by micro-Raman and SEM techniques. Spectrochim Acta Part A Mol. Biomol. Spectros. 2005, 61, 2460–2467. [Google Scholar] [CrossRef]
  44. La Russa, M.F.; Comite, V.; Aly, N.; Barca, D.; Fermo, P.; Rovella, N.; Antonelli, F.; Tesser, E.; Aquino, M.; Ruffolo, S. Black crusts on Venetian built heritage, investigation on the impact of pollution sources on their composition. Eur. Phys. J Plus 2018, 133, 370. [Google Scholar] [CrossRef]
  45. Abdullah, M.A.K. Dehydration of gypsum component of plasters and stuccos in some egyptian archaeological buildings and evaluation of K2SO4 activator as a consolidant. Sci. Cult. 2019, 5, 49–59. [Google Scholar]
  46. Kholod, K.S.; Mona, F.A.; Abubakr, M.M. The presence of cement mortars in the added chambers of El Sakakeny palace: A case study. Sci. Cult. 2017, 3, 25–29. [Google Scholar]
  47. Stefani, M.; Zuppiroli, M. The interaction of geological and anthropic processes shaping the urban growth of Ferrara and the evolution of the surrounding plain. Ital. J. Quat. Sci. 2010, 23, 355–372. [Google Scholar]
  48. Bianchini, G.; Laviano, R.; Lovo, S.; Vaccaro, C. Chemical-mineralogical characterisation of clay sediments around Ferrara (Italy): A tool for an environmental analysis. Appl. Clay Sci. 2002, 21, 165–176. [Google Scholar] [CrossRef]
  49. Bergstad, M.; Or, D.; Withers, P.J.; Shokri, N. The influence of NaCl concentration on salt precipitation in heterogeneous porous media. Water Resour. Res. 2017, 53, 1702–1712. [Google Scholar] [CrossRef] [Green Version]
  50. Falchi, L.; Slanzi, D.; Balliana, E.; Driussi, G.; Zendri, E. Rising damp in historical buildings: A Venetian perspective. Build. Environ. 2018, 131, 117–127. [Google Scholar] [CrossRef]
  51. Çelik, M.Y.; Aygün, A. The effect of salt crystallization on degradation of volcanic building stones by sodium sulfates and sodium chlorides. Bull. Eng. Geol. Environ. 2019, 78, 3509–3529. [Google Scholar] [CrossRef]
  52. Karagiannis, N.; Karoglou, M.; Bakolas, A.; Krokida, M.; Moropoulou, A. Drying kinetics of building materials capillary moisture. Constr. Build. Mater. 2017, 137, 441–449. [Google Scholar] [CrossRef]
  53. Pandey, S.C.; Pollard, A.M.; Viles, H.A. A simulation study of capillary transport, preferential retention and distribution of salts in historic sandstone buildings. Environ. Earth Sci. 2017, 76, 434. [Google Scholar] [CrossRef]
  54. Luo, Y.; Ma, S.; Zheng, S.; Liu, C.; Han, D.; Wang, X. Mullite-based ceramic tiles produced solely from high-alumina fly ash: Preparation and sintering mechanism. J. Alloy. Compd. 2018, 732, 828–837. [Google Scholar] [CrossRef]
  55. Bianchini, G.; Marrocchino, E.; Moretti, A.; Vaccaro, C. Chemical-mineralogical characterization of historical bricks from Ferrara: An integrated bulk and micro-analitycal approach. In Geomaterials in Cultural Heritage; Special Publication 2006; Maggetti, M., Messiga, B., Eds.; Geological Society: London, UK, 2006; Volume 257, pp. 127–140. [Google Scholar]
  56. Duminuco, P.; Messiga, B.; Riccardi, M.P. Firing process of natural clays. Some microtextures and related phase compositions. Thermochim. Acta 1998, 321, 185–190. [Google Scholar] [CrossRef]
  57. Bondesan, M.; Ferri, R.; Stefeani, M. Rapporti fra lo Sviluppo Urbano di Ferrara e l’evoluzione Idrografica, Sedimentaria e Geomorfologica del Territorio in Ferrara nel Medioevo. In Topografia Storica e Archeologia Urbana; Casalecchio di Reno: Bologna, Italy, 1995; pp. 27–42. [Google Scholar]
  58. Sanfilippo, G.; Aquilia, E. Multidisciplinary process aimed at the diagnosis and treatment of damages in stony cultural heritage: The balustrade of Villa Cerami (Catania). Mediter. Archaeol. Archaeom. 2018, 18, 191–205. [Google Scholar]
  59. Di Benedetto, C.; Graziano, S.F.; Guarino, V.; Rispoli, C.; Munzi, P.; Morra, V.; Cappelletti, P. Romans’ established skills: Mortars from D46b mausoleum, porta mediana necropolis, Cuma (Naples). Mediter. Archaeol. Archaeom. 2018, 18, 131–146. [Google Scholar]
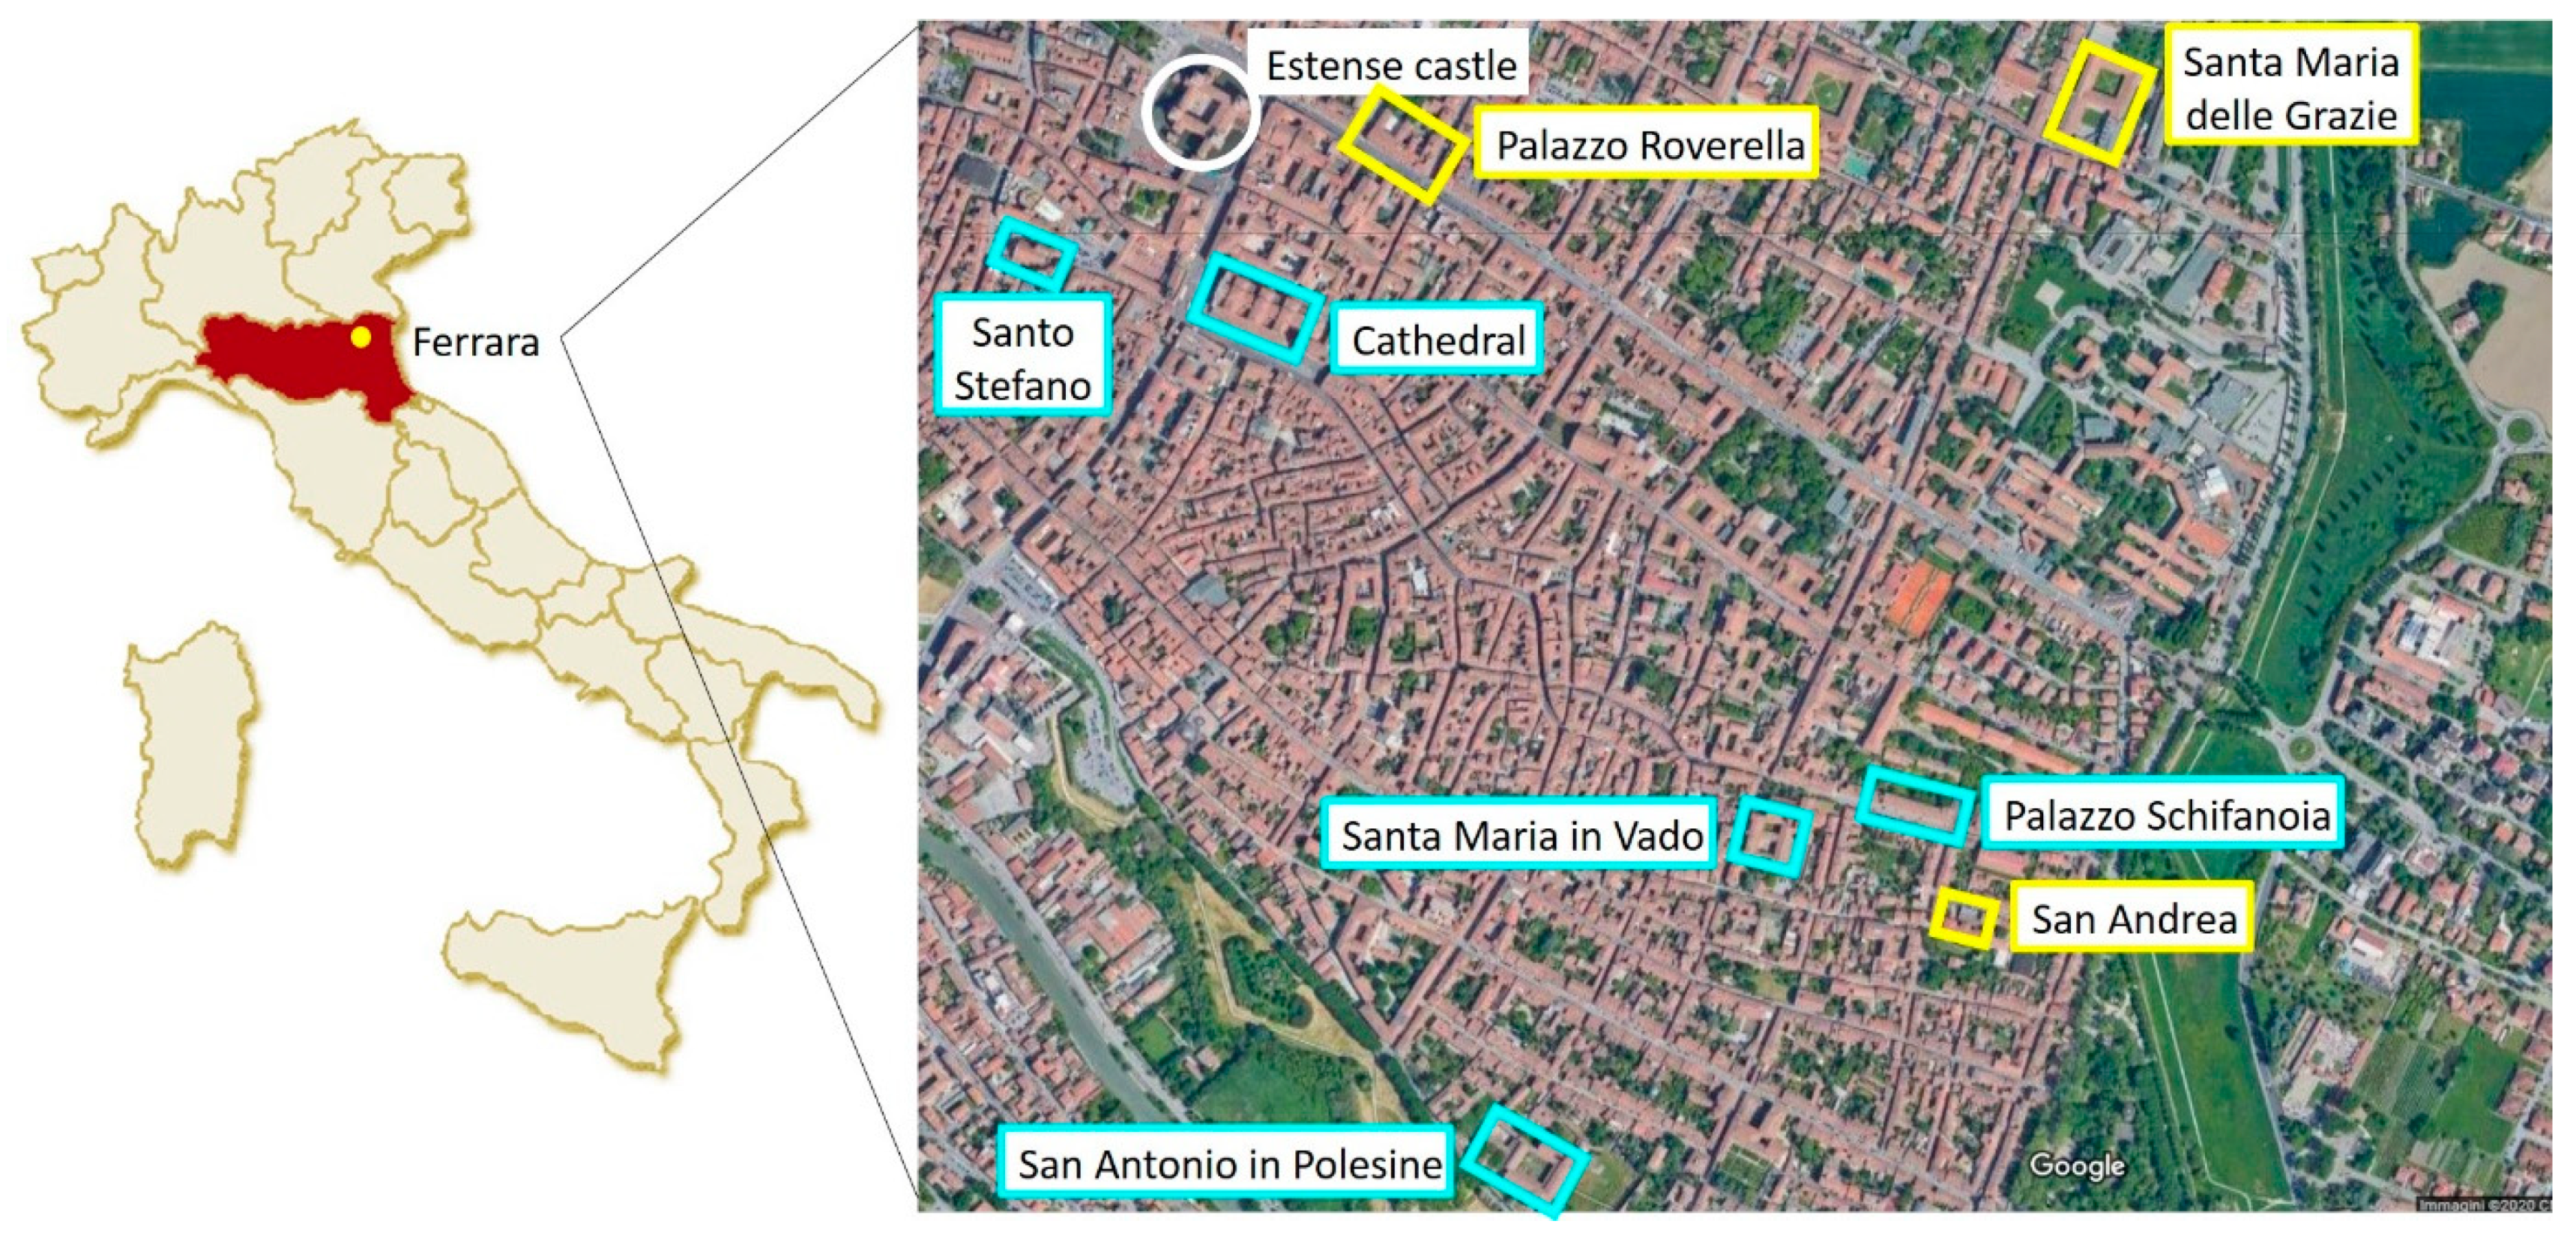
Figure 1. Map of the sampling sites in the city center of Ferrara. Colored in yellow the three different sampling sites: Palazzo Roverella, the cloister of the monastery of Santa Maria delle Grazie and the church of San Andrea. Colored in white the Ferrara castle that represents the main center of Ferrara and colored in light blue other historical buildings (the Cathedral, the church of Santo Stefano, the church of Santa Maria in Vado, the monastery of San Antonio in Polesine and Palazzo Schifanoia) whose XRF analyses were used for comparison.
Geosciences 11 00031 g001
Figure 2. Photo imaging of the three sampling sites: (a) the Palazzo Roverella bird’s eye view; (b) sampling point of sample bricks collected on Palazzo Roverella; (c) the cloister of the monastery of Santa Maria delle Grazie bird’s eye view; (d) columns of the cloister from which cotto samples were collected; (e,f) the remains of the church of San Andrea.
Geosciences 11 00031 g002aGeosciences 11 00031 g002b
Figure 3. Map of the church of San Andrea and the sampling points; colored in red the column from which the samples MM3 and MM4 were collected; colored in blue the column from which the plaster samples MM7−MM9 were collected; colored in green the dot that recalls the exact place of Biagio Rossetti’s burial. In detail: (a) plaster MM3; (b) brick MM4; (c) plaster MM7; (d) plaster MM9; (e) brick MM5.
Geosciences 11 00031 g003
Figure 4. Binary diagrams on the XRF data of the samples collected in the three different sampling sites (blue = Palazzo Roverella; red = cloister of Santa Maria delle Grazie; green = bricks of the church of San Andrea; green and X = plaster of the church of San Andrea): (a) Al2O3-SiO2; (b) CaO-SiO2; (c) Na2O-SiO2; (d) K2O-SiO2; (e) Ni-Cr.
Geosciences 11 00031 g004
Figure 5. XRPD spectrums of the samples analyzed collected in (I) Palazzo Roverella: (a) R6 (flower decoration), (b) R9 (brick), (c) R16 (plaster), (d) R2 (plaster); (II) cloister of Santa Maria delle Grazie: (e) C1-1 (cotto), (f) C1-7 (cotto degraded), (g) CS1-4 (mortar), (h) C1-3 (saline efflorescence from the cotto sample C1-3c), (i) C2-1 (black crust), (j) C6-1 (sulphated black crust); (III) church of San Andrea: (k) MM4 (brick), (l) MM7 (plaster).
Geosciences 11 00031 g005aGeosciences 11 00031 g005b
Figure 6. Schematic map of the flow related to the Po river and the Reno river with respect to the city of Ferrara (in red).
Geosciences 11 00031 g006
Figure 7. Binary diagrams on the XRF data comparing the data of clays from the Reno river and of clays and sands from the Po river [45]: (a) Al2O3-SiO2; (b) CaO-SiO2; (c) Na2O-SiO2; (d) K2O-SiO2; (e) Ni-Cr.
Geosciences 11 00031 g007
Figure 8. Binary diagrams on the XRF data compared to the data of other important historical buildings located in the city center of Ferrara [55]: (a) Al2O3-SiO2; (b) CaO-SiO2; (c) Na2O-SiO2; (d) K2O-SiO2; (e) Ni-Cr.
Geosciences 11 00031 g008
Table 1. List of samples collected and analyzed specifying the type of sample: R represents the samples from Palazzo Roverella, C: samples from Santa Maria delle Grazie and MM: samples from San Antonio.
SamplesDescription
R6Brick from flower decoration
R7Brick from flower decoration
R8Brick from flower decoration
R17Brick from flower decoration
R21Brick from flower decoration, visible sulphating process
R22Brick from flower decoration
R9Brick from the façade
R12Brick from the façade
R13Brick from the façade
R14Brick from the façade
R15Brick from the façade
R1Plaster
R2Plaster
R4Plaster
R16Plaster
C1-1Cotto, 5th layer from the ground
C1-3cCotto
C1-4Cotto
C1-5Cotto
C4-1Cotto, 6th layer from the ground
C4-3Cotto, 7th layer from the ground
C5-3Cotto, 8th layer from the ground
CS1-1Cotto, 2nd layer from the ground
CS1-2Cotto, 7th layer from the ground
CS1-3Cotto, 8th layer from the ground
C1-6Cotto with biological degradation, 8th layer from the ground
C1-7Cotto with efflorescence, 16th layer from the ground
C2-2Cotto with black crust
C2-3Cotto degraded, 3rd layer from the ground
C5-1Cotto disaggregated, 9th layer from the ground
C5-4Cotto degraded, 6th layer from the ground
C5-5Cotto disaggregated, 3rd layer from the ground
C1-2Mortar, 5th layer from the ground
C2-4Replacing mortar from layer under the external plaster
C4-2Mortar, 6th−7th layer from the ground
C5-2Mortar, 9th layer from the ground
CS1-4Mortar, 8th layer from the ground
C1-3Saline efflorescence of the sample C1-3c, 5th layer from the ground
C2-1Black crust
C6-1Black sulphate crust
MM4Brick at 50 cm from the ground
MM5Brick detached
MM3Plaster at 2 m from the ground, coloured in grey
MM7Plaster at 2 m from the ground, coloured in brown and grey
MM9Plaster at 2 m from the ground, coloured in grey
Table 2. XRF data of the major oxides present in the samples analyzed and expressed in weight (%) and the data of the trace elements expressed in ppm (n.d. = not detected).
Palazzo RoverellaSanta Maria delle GrazieSan Andrea
R6R9R12R15R17R21R22C1-1C1-7C2-3C4-1C4-3C5-5CS1-1CS1-2MM3MM4MM5MM7MM9
SiO250.6051.8654.9953.8850.7153.1554.4749.8446.1248.7249.9049.6048.7152.0251.9443.6741.1551.0130.5938.22
TiO20.650.700.710.710.690.720.700.640.610.620.630.640.630.680.660.250.550.640.210.28
Al2O313.6314.4314.7915.2014.6715.1014.0812.7312.4212.8413.4512.8912.6813.8513.736.2611.2313.095.045.34
Fe2O35.666.116.266.296.296.346.205.735.255.535.565.555.675.945.752.665.145.512.442.43
MnO0.120.150.140.140.140.150.140.120.140.140.130.120.150.150.130.120.120.130.080.09
MgO4.964.584.324.634.615.134.524.372.622.704.675.434.325.074.542.323.714.872.342.49
CaO9.2610.047.326.269.4210.809.3910.4112.2411.499.839.2512.048.369.8124.8416.6612.4532.2629.18
Na2O0.960.780.980.851.080.861.652.222.742.992.132.122.161.941.920.700.720.770.370.74
K2O2.262.232.272.562.332.472.122.802.372.942.592.842.542.642.381.802.542.971.001.50
P2O50.130.150.170.150.140.140.160.120.140.110.120.150.130.210.140.120.180.180.090.11
LOI11.778.998.059.349.895.146.5611.0015.3711.9210.9711.4110.969.149.0017.2718.008.8325.5819.62
Tot100100100100100100100100100100100100100100100100100100100100
V97100105105104100888672898688849910234739419125
Cr20120319017118519320516974951721591431651846911120443115
Ni1411451481491451531391336174136135115137142581081184161
Cu4442413950444435384029364743392134391123
Zn9911012512612211110187768810118690108892948631317
Ga1821171919211817141916181718186111366
Rb104106641259182871109810899981011181154057782527
Sr233264130226206199203322330344231226321277286424246285421327
Zr1561739316013712513314214110514014815121415841831333238
Ba408398399381422409380345306355358327409363378240237419101322
La2429343029232820203427292826321426231019
Ce514868544861665149475957715651n.d.1322n.d.28
Pb44589662403233182223121521302332141717534
Sc242226222525222317232118222123681326
Co2117222123211816141519161619169131938
Th117975101295191171051571n.d.
Y25281523221924291922272526312710152065
Nb141811151311131313131113141715471223
S10,40216,71896289779581677243483125731,742313119375571899813014944710022,9671673127,5162394
Table 3. XRPD data of all samples analyzed for the three different sampling sites (R = samples from Palazzo Roverella; C = samples from cloister of Santa Maria delle Grazie; MM = samples from the church of San Andrea). The symbol * highlights the samples for which the diffractograms are shown in Figure 5. The abbreviations are as follows as requested by Whitney [40]: Qz = quartz; Cal = calcite; Gp = gypsum; Fsp = feldspar; Cpx = clinopyroxene; Hem = hematite; Ilm = ilmenite; Pl = plagioclase; Hl = halite.
SamplesDescriptionQzCalGpFspCpxHemIlmPlHl
R6 *Decoration35%10%10%15% 15%15%
R7Decoration45%22%21%11% 2%
R8Decoration50%33%2%15%
R17Decoration45%20%2%20% 5%8%
R21Decoration35%20%20%10% 5%10%
R22Decoration50% 30%10%10%
R9 *Brick40%20%15%13% 2%10%
R12Brick50% 10%20% 10%10%
R13Brick40%20%10%10% 10%10%
R14Brick45%12%11%10%10%10%2%
R15Brick50%3%3%25% 8%8%
R1Plaster30%30%30%10%
R2 *Plaster40% 50%10%
R4Plaster35%25%25%15%
R16 *Plaster40%38% 10% 2%10%
C1-1 *Cotto40%20 20 5%3%102%
C1-3cCotto35%15% 10%10%10%3%15%2%
C1-4Cotto35%10% 15%10%10% 20%
C1-5Cotto45%4%15%15% 3%3%15%
C4-1Cotto40%15%3%12% 2%12%12%2%
C4-3Cotto40%15%5%15% 5%10%10%1%
C5-3Cotto35%13%10%15%10%2 15%
CS1-1Cotto40%20% 10% 20%10%
CS1-2Cotto40%25%3%10% 2%10%10%
CS1-3Cotto30%310%16%10%8% 16%8%
C1-6Cotto degr.40%10%20%10% 10%10%
C1-7 *Cotto degr.35%10%20%10% 10%15%
C2-2Cotto degr.40%20%3%15% 2% 20%
C2-3Cotto degr.40%15% 20% 3%3%16%3%
C5-1Cotto degr.45%20% 12% 8%12%3%
C5-4Cotto degr.45%20% 11% 11%10%3%
C5-5Cotto degr.40%20%3%9% 3%15%8%2%
C1-2Mortar40%30% 15% 3%2%10%
C2-4Mortar40%30% 22% 3%10%
C4-2Mortar25%23%23%7% 7%15%
C5-2Mortar50%30% 10% 3%7%
CS1-4 *Mortar50%30% 10% 3%7%
C1-3 *Saline effl.25%15% 3% 3%54%
C2-1 *Black crust30%55% 15%
C6-1 *Black crust45%11%35%3% 3%3%
MM4 *Brick40%20%20%20%
MM5Brick40%30%30%
MM3Plaster40%30%30%
MM7 *Plaster40%20%10%30%
MM9Plaster45%35%25% 3%2%
Publisher’s Note: MDPI stays neutral with regard to jurisdictional claims in published maps and institutional affiliations.