Abstract
Meltwater from glaciers makes significant contributions to general streamflow and provides water for flora and fauna. Continuous glacier monitoring programs enhance our understanding of the impacts of global warming on glaciers and their topographical features. The objective of this study is to measure spatial and temporal changes in Canada’s Columbia Icefield glaciers. This study uses Landsat (TM 5 and OLI) images to delineate glacier extents in the Columbia Icefield between 1985 and 2018. The study also analyzes the retreat of the Athabasca, Castleguard, Columbia, Dome, Saskatchewan, and Stutfield Glaciers. The total area covered by the Icefield in 1985 was 227 km2. By 2018, the Icefield had lost approximately 42 km2 of its area coverage, representing 18% of its previous coverage. All glaciers in the study region retreated and decreased in area over the study period. The pattern observed in this study is one of general ice loss in the Columbia Icefield, which mirrors patterns observed in other mountain glaciers in Western Canada.
Keywords:
glaciers; Landsat; mass balance; machine learning; remote sensing; global warming; Columbia Icefield 1. Introduction
Glaciers are a notable part of the cryosphere and play an important role in climate studies [1,2]. Glaciers adjust their size as a response to changing climatic conditions, which make them good indicators of climate change. Glaciers remain the largest reservoir of freshwater on Earth, serving more than 1.3 billion people [3]. Meltwater, particularly from mountain glaciers, makes significant contributions to general streamflow, especially in late summer when there are warm periods with dry weather [4,5]. Surface runoff from glaciers during summer regulate stream temperature, making it conducive for irrigation, tourism, industry, hydro power, domestic consumption, and to support aquatic life [6,7]. Like other mountain glaciers, the Columbia Icefield (referred to as the “mother of rivers”) in the Canadian Rockies serves as a significant water resource as its meltwater feeds the Columbia, Athabasca, North Saskatchewan, and Fraser River systems [8]. Glacier run-off in the region is heavily relied upon for hydroelectric power generation in parts of British Columbia. Mass wastage of these glaciers can cause increased volumes of late summer discharge, which could lead to long-term loss of natural fresh water. A glacial lake outburst flood (GLOF) could lead to rapid discharge, which is mostly catastrophic to surrounding regions [9]. Due to the important role these mountain glaciers play in supplementing streams required for human and aquatic consumptions, it is imperative to monitor them periodically. Studies of these mountain glaciers are necessary to understand their response to climate change and to predict the long-term impacts on water availability and global sea-level rise hazard preparedness. The Columbia Icefield also serves as one of the most visited tourist sites in North America; hence, consistent Icefield monitoring is key for decision-making regarding hazard risk assessments that may be associated with glacier cover change [10].
Beginning in the 1980s, the need to monitor these glaciers led to federal mapping, which commenced as part of Canada’s contribution to the International Hydrological Decade. Glacier studies in the region have progressed over the years in the 21st century [10,11,12]. Glaciologists in the area relied on the use of photogrammetric methods for glacier studies due to the size and remoteness of the glaciers [13,14]. These mappings focused on glacier length while a few included glacier thickness and width. The surveys were limited to easily accessible glaciers (Athabasca, Columbia, and Saskatchewan) with smoother features than others in the Canadian Cordillera. Subsequently, monitoring of the Athabasca and Saskatchewan Glaciers expanded to include mapping of glacier terminus changes, elevation, volume changes, and mass balance [15]. The Peyto Glacier, located in the Banff National Park, has the longest record of mass balance [16]. The Columbia Icefield, like other mountain ice in the 20th century, has seen an accelerated wastage of glacier ice [17]. Recent studies by Tennant and Menounos [15] reported that the Icefield retreated by an average of 1150 ± 34 m with an average thinning of 49 ± 25 meter water equivalent (m.w.e.) at a rate of −0.6 ± 0.3 m w.e.·a−1 between 1919 and 2009. Shrinkage reported was 2.4 ± 0.2 and total area lost was 59.6 ± 1.2 km2 (23 ± 5%) at a rate of −0.6 ± 0.3 m.w.e. a−1. These rates are, however, not uniform across the Icefield due to differences in size, topographical features, and surface cover. Remote sensing of glaciers provides a robust way to monitor the health of these glaciers which is assessed via changes in their area, length, volume, and mass balance over a specific period.
The objective of this study is to use Landsat satellite imagery between 1985 and 2018 in combination with high resolution images to measure spatial and temporal changes in the Columbia Icefield.
2. Study Area
The Columbia Icefield is the largest icefield in the Canadian Rockies lying partly in the northwestern tip of Banff National Park and partly in the southern end of Jasper National Park (Figure 1). Meltwater from the Athabasca glacier flows into the Athabasca River and then into Lake Athabasca. Then it flows by the Slave River, through the Mackenzie River, and finally into the Arctic Ocean [18]. Meltwater from the Saskatchewan Glacier flows into Saskatchewan River and crosses the Alberta, Manitoba, and Saskatchewan provinces into the Hudson Bay and finally reaches the Atlantic Ocean. Runoff from the Columbia Glacier flows via the Columbia and Fraser Rivers into the Pacific Ocean. The Icefield comprises 25 glaciers and may be either of individual ice bodies or glacier outlets based on glacial drainage [19].
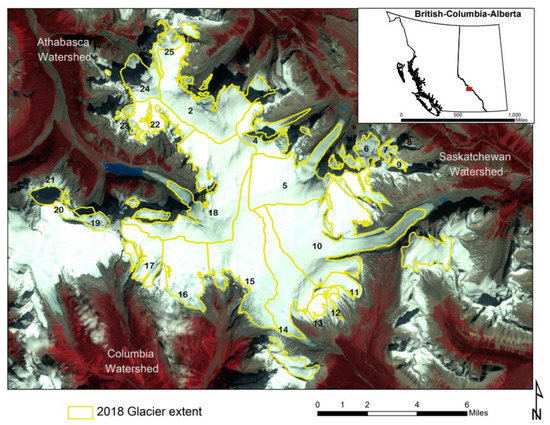
Figure 1.
Study area. Landsat TM 5 scene obtained on 10 September 1999 showing the Columbia Icefield.
The six major glacier outlets include Stutfield to the north, Dome to the northeast, Athabasca and Saskatchewan to the east, Castleguard to the south, and Columbia to the West. The main glacier body is steep, which drops off through the lower glacier tongues into deep canyons. The region is also characterized by lakes and thick, low-level forests in the fringing valley areas. Its elevation ranges between 1000 and 3700 m a.s.l. [14].
The highest peaks of the Columbia Icefield are Mt. Athabasca (3491 m) and Mt. Columbia (3745 m). The lower regions experience the development of alpine tundra in regions above ~2250 m a.s.l., creating the Engelmann Spruce–Subalpine Fir ecosystem [15]. The region has an average annual temperature of –4.0 °C and an annual snow precipitation of 1277 mm between 1919 and 2009 [15]. The region’s climate is characterized by cyclonic storms which occur because of maritime polar air masses from the west (between September and June) and continental polar air masses from the east in winter [15].
3. Data
3.1. Satellite Imagery
We utilized two rectified Landsat Thematic Mapper 5 (TM) scenes (acquired on 5 September 1985, and 8 September 1999) and one Landsat 8 Operational Land Imager (OLI) scene (acquired on 10 September 2018). Both TM and OLI bands have a nominal spatial resolution of 30 m. The visible and near-infrared (VNIR) regions make up five spectral bands with two shortwave infra-red bands. OLI has one cirrus cloud detection band, two thermal bands (TIRS), and a 15 m panchromatic band (USGS 2015). The World Reference System (WRS2) path 44 and row 24 Landsat scenes were downloaded from the USGS Earth Resources Observation and Science Center (EROS) using the USGS Earth Explorer website (https://earthexplorer.usgs.gov). The scenes covered the full extent of the Columbia Icefield with minimal cloud coverage (<20%) [20].
3.2. Reference Data
The primary reference data were glacier boundaries selected from the Northern Cordillera region collection from the Global Land Ice Measurement from Space (GLIMS) inventory [21]. GLIMS is an international initiative whose goal is to join world-wide collaborators to primarily use satellite imagery and a wide range of techniques for glacier studies and monitoring to create a comprehensive database of current extents of world glaciers. The second reference source for the manual digitization was high resolution images from Google Maps and Bing MapsTM.
4. Methods
4.1. Manual Delineation
All bands were resampled to 30 m and were already projected to NAD83 UTM zone 11. For the main processing, a threshold was applied to the NDSI ratio of each year, and glacier boundaries were manually digitized. In areas where there were cast shadows, a TM3/TM5 band ratio was used to help identify ice in those areas [22] at pixel level. After the first classification, detailed digitization was done on areas that appeared to be debris-covered with guidance from Google Maps and Bing images to help identify previously mapped extents and ice in cast shadow. The glacier outlines were overlaid on the false-color composite of TM band equivalents of 543 and 321 as RGB (red, green, blue), which were created for proper identification of glacier and clouds for further corrections [23]. The resulting glacier outlines were superimposed on the respective images, and the total area of each of the glaciers in the Icefield were calculated for the three years. The change in glacier area (km2) was calculated as the difference between the area of a previous year and the following year used in this study. Glacier retreat at the tongues of Athabasca, Stutfield, Columbia, Castleguard, Saskatchewan, and Dome were calculated as the difference between the termini in a previous study year and the termini in the following study year. Table 1 below shows the characteristics of the Icefield which was adopted from Tennant and Menounos [15].

Table 1.
Characteristics and spatial extents of glaciers in the Columbia Icefield.
4.2. Error Estimation
For error in glacier area, a buffer was created around each individual glacier [6], and the difference between the two polygons was calculated. The buffer method for error estimation added and subtracted a specific distance from the glacier outlines and then calculated the difference. In this study, we used the length error as the buffer distance. A detailed error analysis as laid out in the Tennant and Menounos study [6,15] was followed. The area was calculated and subtracted from the area of the digitized boundaries using the raster calculator tool in ArcGIS. The sum of each year’s error was noted, and the total error in glacier change measurements was computed as:
where E∆ is the total error calculated, E21 is the error in year one, and so on. Absolute length error was based on the combined mean horizontal RMSE and half of the resolution of the data (15 m) of a scene. Error in retreat between two years was calculated using Equation (1).
5. Results
Results from this study on glacier area and length changes indicate a significant retreat of the glaciers in the Columbia Icefield from 1985 to 2018. Each glacier experienced some amount of retreat and loss in coverage area (Figure 2). The Columbia Glacier experienced the highest absolute retreat (3.37 km) but has a lake at its terminus. The least retreated glacier was the Athabasca (0.56 km) over the study period. Mean retreat recorded for the Athabasca, Columbia, Stutfield, Dome, Castleguard, and Saskatchewan Glaciers was 1.42 km at a rate of 0.04 km·a−1 as shown in Table 2. Results indicate a retreat in glacier tongues of the Columbia Icefield in the period 1985–2018. All glaciers except Dome and Stutfield experienced lower retreat in 1985–1999 than in 1999–2018. The total mean among all six glaciers between the first half of the study period increased about 400% in the second half of the study period as shown in Table 2. Estimated error in retreat length was 21.6 m, which is negligible since it is less than 1 pixel size (30 m).
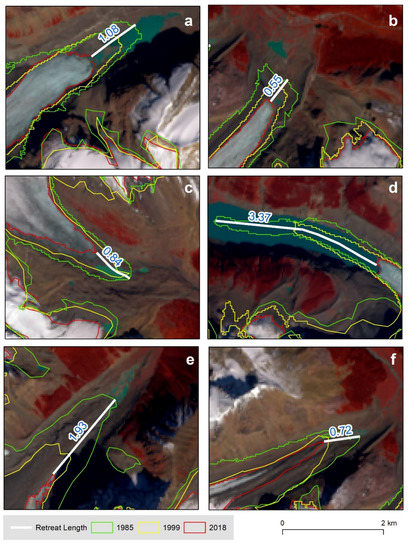
Figure 2.
Length of retreat in six major glaciers in Columbia Icefield. Glacier names: (a) = Saskatchewan, (b) = Athabasca, (c) = Castleguard, (d) = Columbia, (e) = Stutfield, (f) = Dome.
Table 2.
Glacier retreat of the Athabasca, Castleguard, Dome, Saskatchewan, Columbia, and Stutfield Glaciers between 1985 and 2018.
Total area change from 1985 to 2018 (Table 3) was 42.56 km2 for the entire Icefield. The Columbia Glacier lost the largest absolute area of 5.62 km2 at a rate of 1.02% a−1 between 1985 and 2018 while G242711E52106N (G13) lost the smallest relative area (0.1 km2) at a rate of 0.27% a−1 between 1985 and 2005. The least absolute and relative area loss changes were recorded by the G242711E52106N (G13) and G242808E52190N (G8) glaciers, respectively, during the study period.
Table 3.
Glacier area change between 1985 and 2018.
An overlay of the 1985, 1999, and 2018 glacier boundaries, showed a loss in extent of ice in all three watersheds (Athabasca, Columbia and Saskatchewan). For the Athabasca watershed, total ice area loss was 21.26 km2, which was the largest among the three. This is partly due to the watershed hosting most of the glaciers as compared to the other two. The Columbia and Saskatchewan watersheds lost an area of 9.5 km2 and 11.7 km2 of their ice area. The overall mean glacier area change was 1.70 km2 at a rate of 1.87% a−1 during 1985–2018. The mean area changes for the entire Icefield increased from 0.79 km2 between 1985 and 1999 to 1.70 km2 between 1999 and 2018. The estimated error in area change measurements is ±11.84 km2.
For further analysis, the glaciers were divided into classes according to their sizes based on the 1985 image: <1 km2, 1–5 km2, 5–10 km2, 10–15 km2, 15–20 km2, and >20 km2. Glaciers between 1.0 and 5.0 km2 had the largest composite of glaciers per class (Table 4). It was observed that larger glaciers (>20 km2) tend to have the greatest absolute area loss ( −18.23 km2; −15.3%), at a rate of −0.5%a−1, while the smaller glacier classes (<1) experience the opposing trend of the greatest relative area loss (–86.18%; 1.17 km2) at a rate of −2.6% for the entire study period (i.e., 1985–2018). Mean glacier change was seen in all class sizes from 1985–1999 and 1999–2018 as shown in Table 4. Based on evidence from previous studies of the area, it was observed that there was a greater number of smaller glaciers in the area during the study period than there was before 1985. This can be attributed to the weakening and disintegration of larger glaciers into smaller portions and is evidence of glacier shrinkage.
Table 4.
Changes in class sizes of the glaciers between 1985 and 2018.
6. Discussion and Conclusions
The pattern observed in this study is one of general ice loss in the Columbia Icefield. All glaciers retreated and decreased in area cover over the study period. The termini of the six major glaciers—Athabasca, Columbia, Saskatchewan, Stutfield, Dome, and Castleguard—decreased in area by an average of 1.3 km2 while the total area loss of the entire Icefield was 42.56 km2 at a rate of 1.29 km2 a−1 during the study period. Between 1985 and 2018, the mean retreat of the six major glaciers was 1.43 km at a rate of 0.04 km a−1.
The rate of glacier area changes in this study (0.57% a−1) is comparable to the findings of Bolch et al. [12] in their study of Western Canada. Their study revealed an area loss rate of 0.6 ± 0.19% a−1 for the Southern Canadian Rockies, which includes the Columbia Icefield, between 1985 and 2005. From this rate, glacier change may be very subtle; hence, it may take a longer period of glacier monitoring to detect significant changes. However, a perfect agreement with other studies is not to be expected due to differences in the study periods and the extent of spatial coverage. In this study, the highest absolute glacier retreat was recorded for the Columbia Glacier (1.94 ± 0.05 km). This is similar to the results of Tennant and Menounos [15], who, for the same glacier, found the highest retreat of 3.7 ± 0.03 km between 1919 and 2006. The Saskatchewan Glacier had the largest absolute area loss, which is also in agreement with the findings of Tennant and Menounos [15].
Glacier retreat have led to the formation of small water bodies in Athabasca, Columbia, and Saskatchewan watersheds in the study area. Formation of water bodies was also observed in other mountain glaciers in Western Canada [22,24]. Although ice loss patterns have been observed and reported in studies between the mid-1990s and 2000, the area, like other glaciers worldwide, is characterized by variability in glacier parameters, and it is mostly dependent on climate change, among other factors. While the average glacier retreat was 1.43 km within the study period, there were irregular glacier landscape features for every year in the study period. For instance, Baumann [25], measured glacier changes in the Columbia Glacier every year between 1985 and 2010. That study showed that the glacier advanced in some years while in other years (1998, 1999, and 2008), it did not change at all. This could be the case of the other major glaciers in the Icefield due to altitude and changes in snow precipitation over the years.
As seen in some previous studies [15,24], when glacier changes were evaluated according to their class values, smaller-sized glaciers experienced higher relative area loss rates compared to larger-sized glaciers, that had the largest absolute retreat. This is because the larger glaciers have the greatest ice cover to lose. However, the smaller glaciers, which also are usually the detached glaciers, recorded lower relative area loss than the larger glacier bodies, which are avalanche-fed. For each class between 1985–2018, it was observed that the mean rate of area lost for each class-size increased over the subsequent time period (1985–1999 and 1999–2018). The number of individual glaciers within the Columbia Icefield increased compared to years prior to 1985, mainly because a few the larger glaciers disintegrated into smaller portions as they became weak and unstable.
On error analysis, although we were able to provide rough estimates, we do acknowledge that error estimation in glacial studies is still very challenging, and there may be some error sources associated with the study area. A thorough review of glaciology literature reveals that the glaciological community has not emphatically reached a consensus [26] on the subject concerning the best method for error analysis. Thus, a few studies fully quantify errors associated with their mapping. For instance, in this study, we decided to use the GIS buffer method for error analysis, which presented two different measurement possibilities. The first uses 1 pixel size (30 m) [20,26] as the buffer distance. The second uses error length [6,15] as the distance of the buffer, which usually combines one-half of the resolution and the RMSE of the scene. The latter was employed because we wanted to maintain consistency with previous studies of the area.
Since the Columbia Icefield is in a mountainous region, it is important to consider errors that can be introduced by topographic illumination. Our overall confidence in mapping the area is high in regions of clean ice but is slightly less in regions covered in debris, which posed as a major error source due to lack of field data. The use of Google Maps and Bing images helped, but we were unable to justify the clear extent in the debris-covered terminus. Fortunately, the debris cover was relatively low compared to the clean ice areas; thus, we are highly confident in our area delineation and error estimates. The use of the band ratio helped to illuminate internal rocks, which were primarily in cast shadows. Going forward, field data or more improved methods for clearly mapping debris cover may be necessary for proper mapping.
Author Contributions
Data curation, A.I.; Formal analysis, A.I.; Funding acquisition, S.A.; Methodology, A.I. and S.A.; Project administration, S.A.; Resources, A.I.; Software, A.I.; Supervision, S.A.; Visualization, A.I.; Writing—original draft, A.I.; Writing—review & editing, S.A. All authors have read and agreed to the published version of the manuscript.
Funding
This research received no external funding.
Institutional Review Board Statement
Not applicable.
Informed Consent Statement
Not applicable.
Data Availability Statement
Data that were analyzed in this study are publicly available. This data can be found here: (1) USGS Earth Explorer (https://earthexplorer.usgs.gov) (2) Global Land Ice Measurement from Space (GLIMS) inventory (https://www.glims.org/).
Conflicts of Interest
The authors declare no conflict of interest.
References
- Ambinakudige, S. A study of the Gangotri glacier retreat in the Himalayas using Landsat satellite images. Int. J. Geoinf. 2010, 6, 7. [Google Scholar]
- Inamdar, P.; Ambinakudige, S. Spatial Patterns of Glacier Mass Change in the Southern Andes. Photogramm. Eng. Remote Sens. 2016, 82, 811–818. [Google Scholar] [CrossRef]
- Brown, J.; Harper, J.; Humphrey, N. Cirque glacier sensitivity to 21st century warming: Sperry Glacier, Rocky Mountains, USA. Glob. Planet. Chang. 2010, 74, 91–98. [Google Scholar] [CrossRef]
- Zappa, M.; Kan, C. Extreme heat and runoff extremes in the Swiss Alps. Natural Hazards and Earth System Science. Copernic. Publ. Behalf EGU 2007, 7, 375–389. [Google Scholar]
- Jost, G.; Moore, R.D.; Smith, R.; Gluns, D.R. Distributed temperature-index snowmelt modelling for forested catchments. J. Hydrol. 2012, 420, 87–101. [Google Scholar] [CrossRef]
- Granshaw, F.D.; Fountain, A.G. Glacier change (1958–1998) in the north Cascades national park complex, Washington, USA. J. Glaciol. 2006, 52, 251–256. [Google Scholar] [CrossRef]
- Stahl, K.; Moore, R.D. Influence of watershed glacier coverage on summer streamflow in British Columbia, Canada. Water Resour. Res. 2006, 42. [Google Scholar] [CrossRef]
- Marsh, J. Columbia Icefield. 2015. Available online: https://www.thecanadianencyclopedia.ca/en/article/columbia-icefield (accessed on 24 November 2020).
- Berthier, E.; Schiefer, E.; Clarke, G.K.C.; Menounos, B.; Remy, F. Contribution of Alaskan glaciers to sea-level rise derived from satellite imagery. Nat. Geosci. 2010, 3, 92–95. [Google Scholar] [CrossRef]
- Schiefer, E.; Menounos, B.; Wheate, R. Recent volume loss of British Columbian glaciers, Canada. Geophys. Res. Lett. 2007, 34. [Google Scholar] [CrossRef]
- Demuth, M.N.; Pinard, V.; Pietroniro, A.; Luckman, B.H.; Hopkinson, C.; Dornes, P.; Comeau, L. Recent and past-century variations in the glacier resources of the Canadian Rocky Mountains: Nelson River system. Terra Glacial. 2008, 11, 27–52. [Google Scholar]
- Bolch, T.; Menounos, B.; Wheate, R. Landsat-based inventory of glaciers in western Canada, 1985–2005. Remote Sens. Environ. 2010, 114, 127–137. [Google Scholar] [CrossRef]
- Della Ventura, A.; Rampini, A.; Rabagliati, R.; Barbero, R.S. Development of a satellite remote sensing technique for the study of alpine glaciers. Int. J. Remote Sens. 1987, 8, 203–215. [Google Scholar] [CrossRef]
- Haeberli, W. Glacier and permafrost signals of 20th-century warming. Ann. Glaciol. 1990, 14, 99–101. [Google Scholar] [CrossRef]
- Tennant, C.; Menounos, B. Glacier change of the Columbia Icefield, Canadian Rocky Mountains, 1919–2009. J. Glaciol. 2013, 59, 671–686. [Google Scholar] [CrossRef]
- Demuth, M.N.; Munro, D.S.; Young, G.J. Peyto Glacier: One Century of Science; Environment Canada: Saskatoon, SK, Canada, 2006.
- Barry, R.G. The status of research on glaciers and global glacier recession: A review. Prog. Phys. Geogr. Earth Environ. 2006, 30, 285–306. [Google Scholar] [CrossRef]
- Kite, G.; Reid, I. Volumetric change of the Athabasca Glacier over the last 100 years. J. Hydrol. 1977, 32, 279–294. [Google Scholar] [CrossRef]
- The Editors of Encyclopaedia Britannica. Columbia Icefield. 2018. Available online: https://www.britannica.com/place/Columbia-Icefield (accessed on 24 November 2020).
- Racoviteanu, A.E.; Paul, F.; Raup, B.; Khalsa, S.J.S.; Armstrong, R. Challenges and recommendations in mapping of glacier parameters from space: Results of the 2008 Global Land Ice Measurements from Space (GLIMS) workshop, Boulder, Colorado, USA. Ann. Glaciol. 2009, 50, 53–69. [Google Scholar] [CrossRef]
- Glims, N. Global Land Ice Measurements from Space Glacier Database; Compiled and Made Available by the International GLIMS Community and the National Snow and Ice Data Center: Boulder, CO, USA, 2005; updated 2018; Available online: https://nsidc.org/data/nsidc-0272 (accessed on 24 November 2020). [CrossRef]
- Paul, F.; Bolch, T.; Kääb, A.; Nagler, T.; Nuth, C.; Scharrer, K.; Shepherd, A.; Strozzi, T.; Ticconi, F.; Bhambri, R.; et al. The glaciers climate change initiative: Methods for creating glacier area, elevation change and velocity products. Remote Sens. Environ. 2015, 162, 408–426. [Google Scholar] [CrossRef]
- Ambinakudige, S.; Joshi, K. Remote Sensing of Cryosphere. In Remote Sensing—Applications; InTech Open: Rijeka, Croatia, 2012; pp. 369–380. [Google Scholar]
- Tennant, C.; Menounos, B.; Wheate, R.D.; Clague, J.J. Area change of glaciers in the Canadian Rocky Mountains, 1919 to 2006. Cryosphere 2012, 6, 1541–1552. [Google Scholar] [CrossRef]
- CellMed, A. GLP-1 CellBeads® for the Treatment of Stroke Patients with Space-Occupying Intracerebral Hemorrhage. 2011. Available online: http://www.clinicaltrials.gov (accessed on 13 May 2016).
- Burns, P.; Nolin, A.W. Using atmospherically-corrected Landsat imagery to measure glacier area change in the Cordillera Blanca, Peru from 1987 to 2010. Remote Sens. Environ. 2014, 140, 165–178. [Google Scholar] [CrossRef]


Publisher’s Note: MDPI stays neutral with regard to jurisdictional claims in published maps and institutional affiliations. |
© 2020 by the authors. Licensee MDPI, Basel, Switzerland. This article is an open access article distributed under the terms and conditions of the Creative Commons Attribution (CC BY) license (http://creativecommons.org/licenses/by/4.0/).