Integrated Geodetic and Hydrographic Measurements of the Yacht Port for Nautical Charts and Dynamic Spatial Presentation


Abstract
1. Introduction
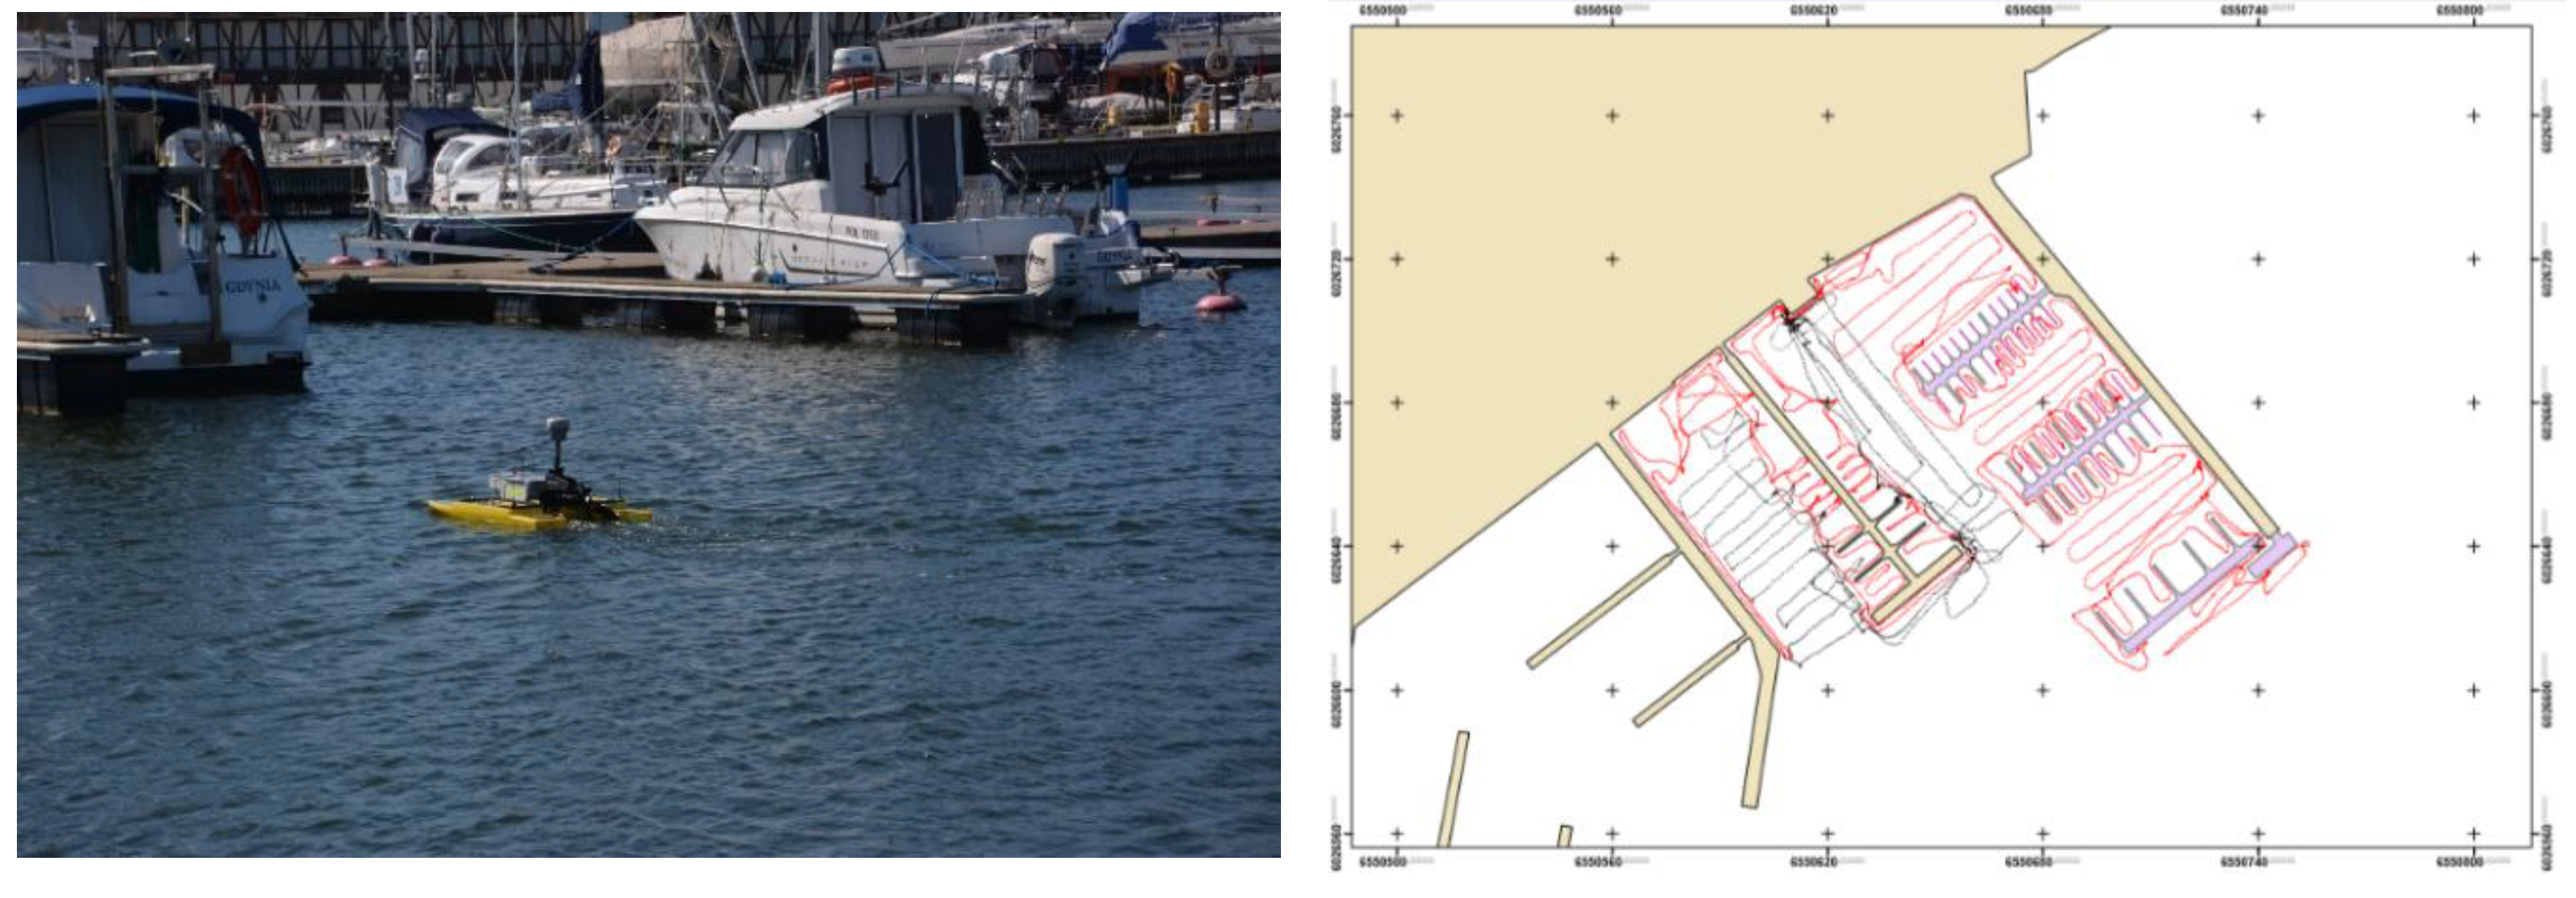
2. Materials
3. Methods
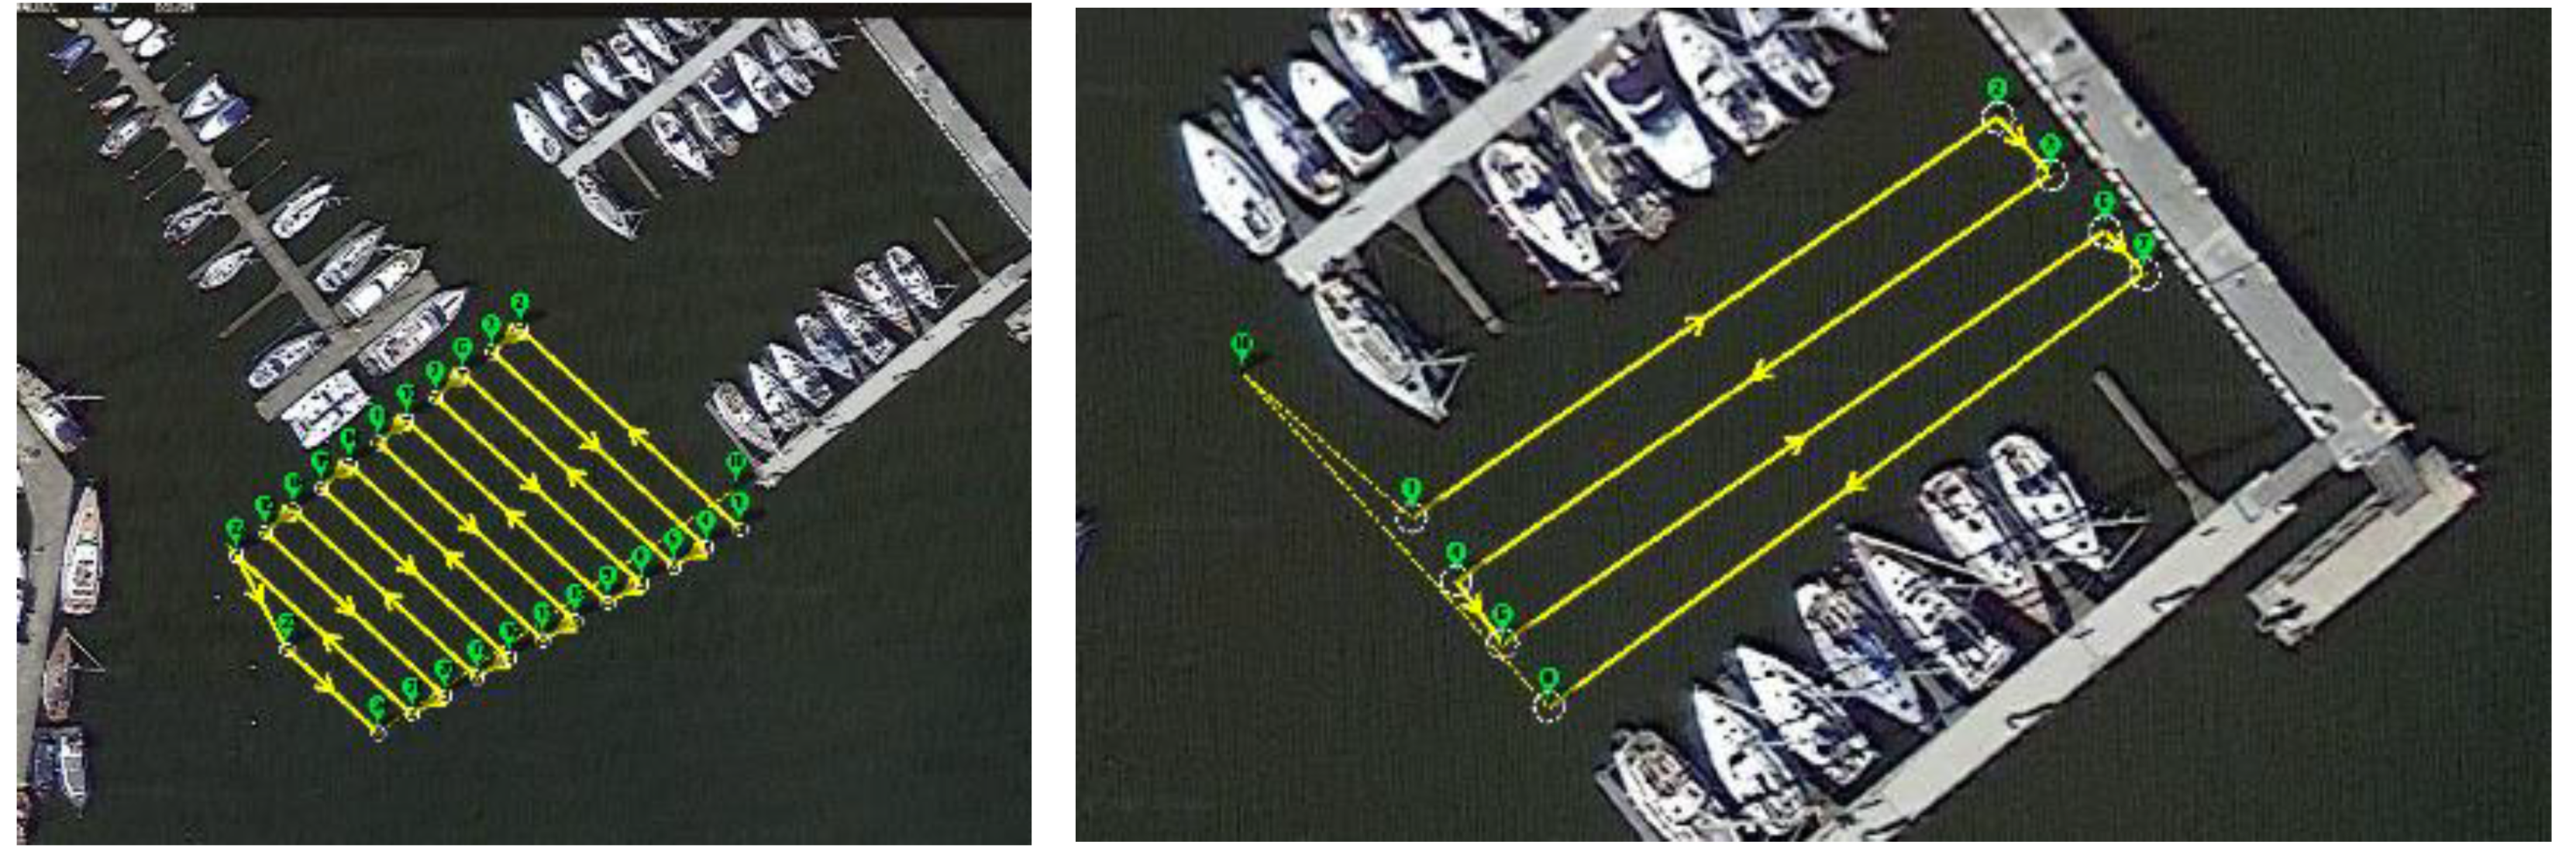
3.1. Hydrography
3.2. GNSS Surveying
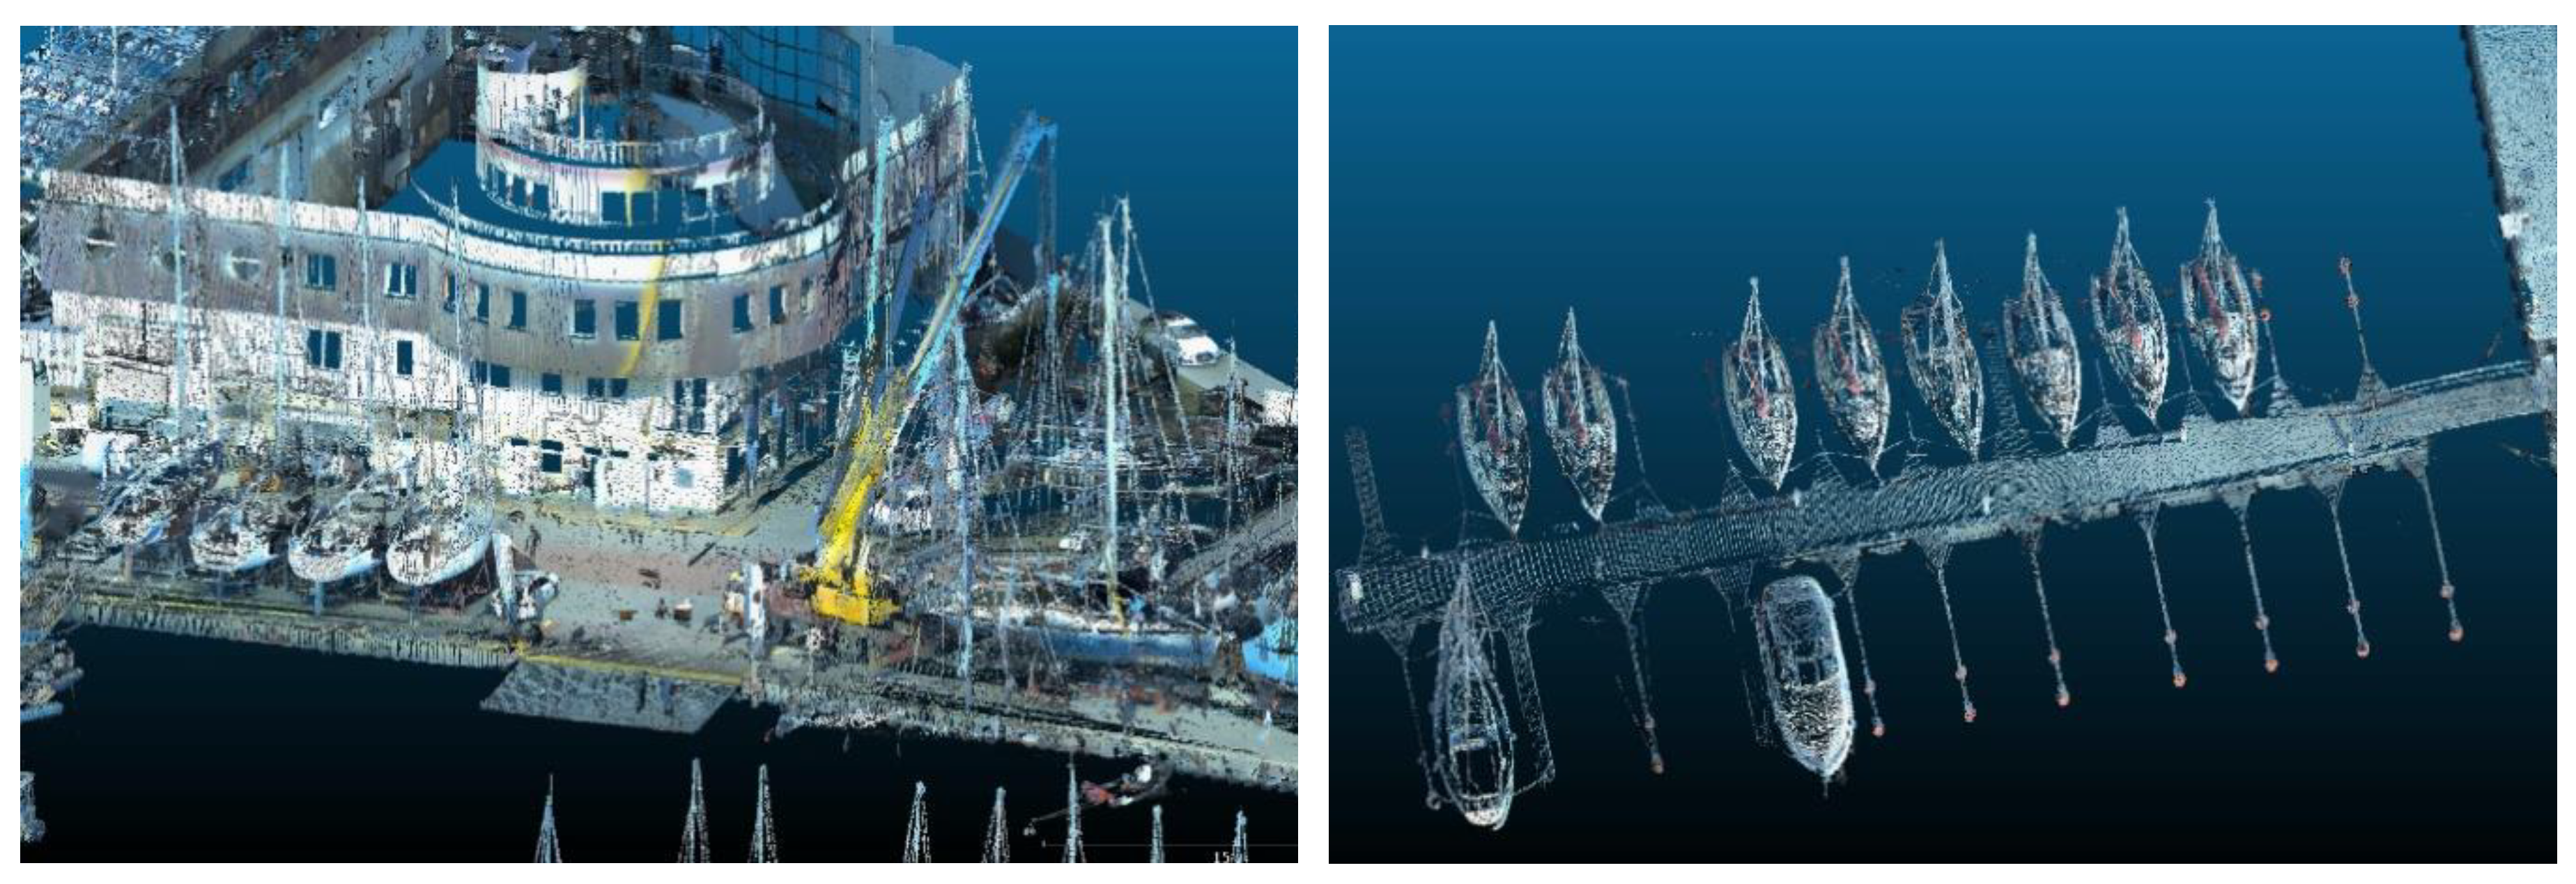
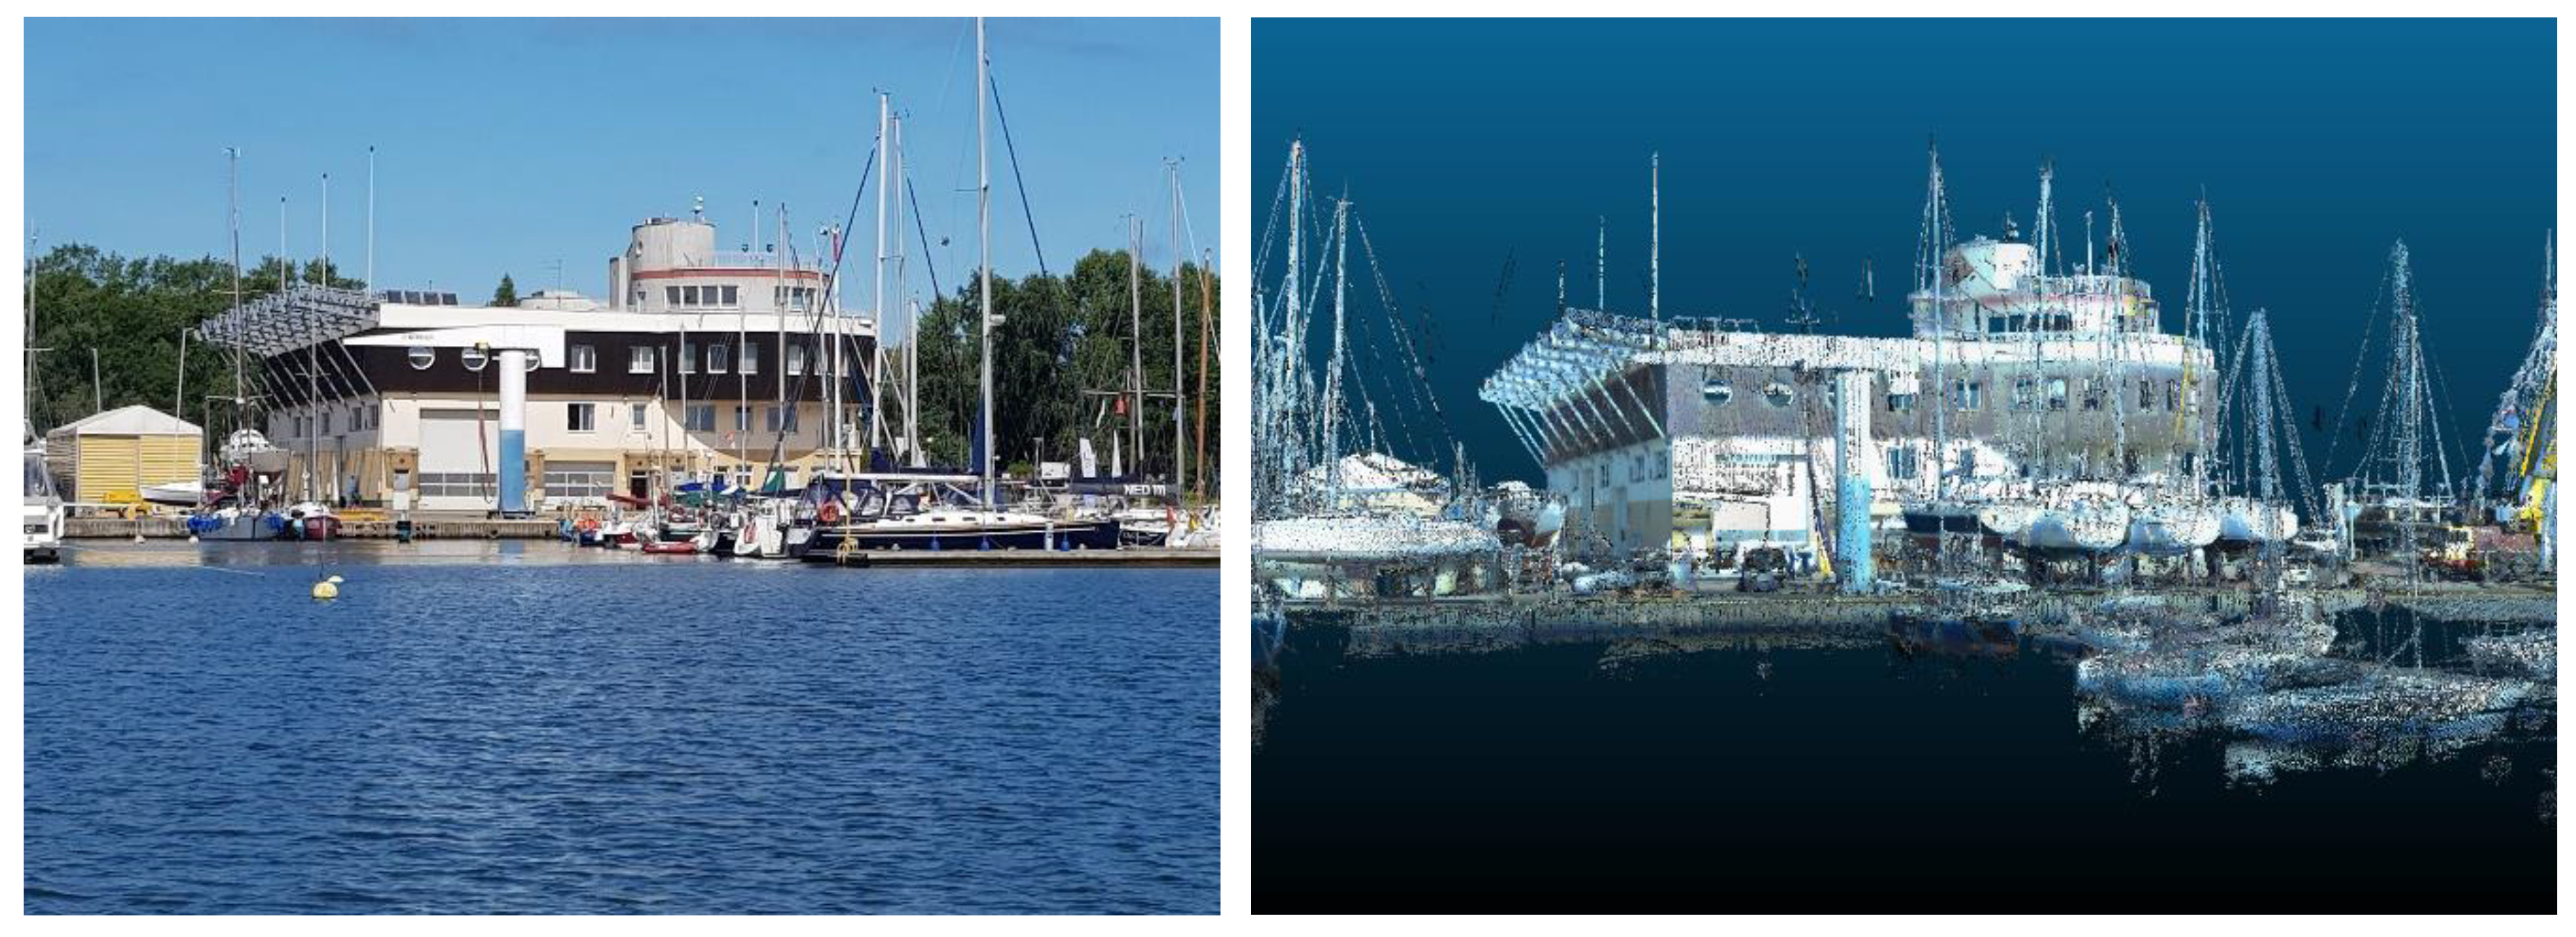
3.3. Laser Scanning
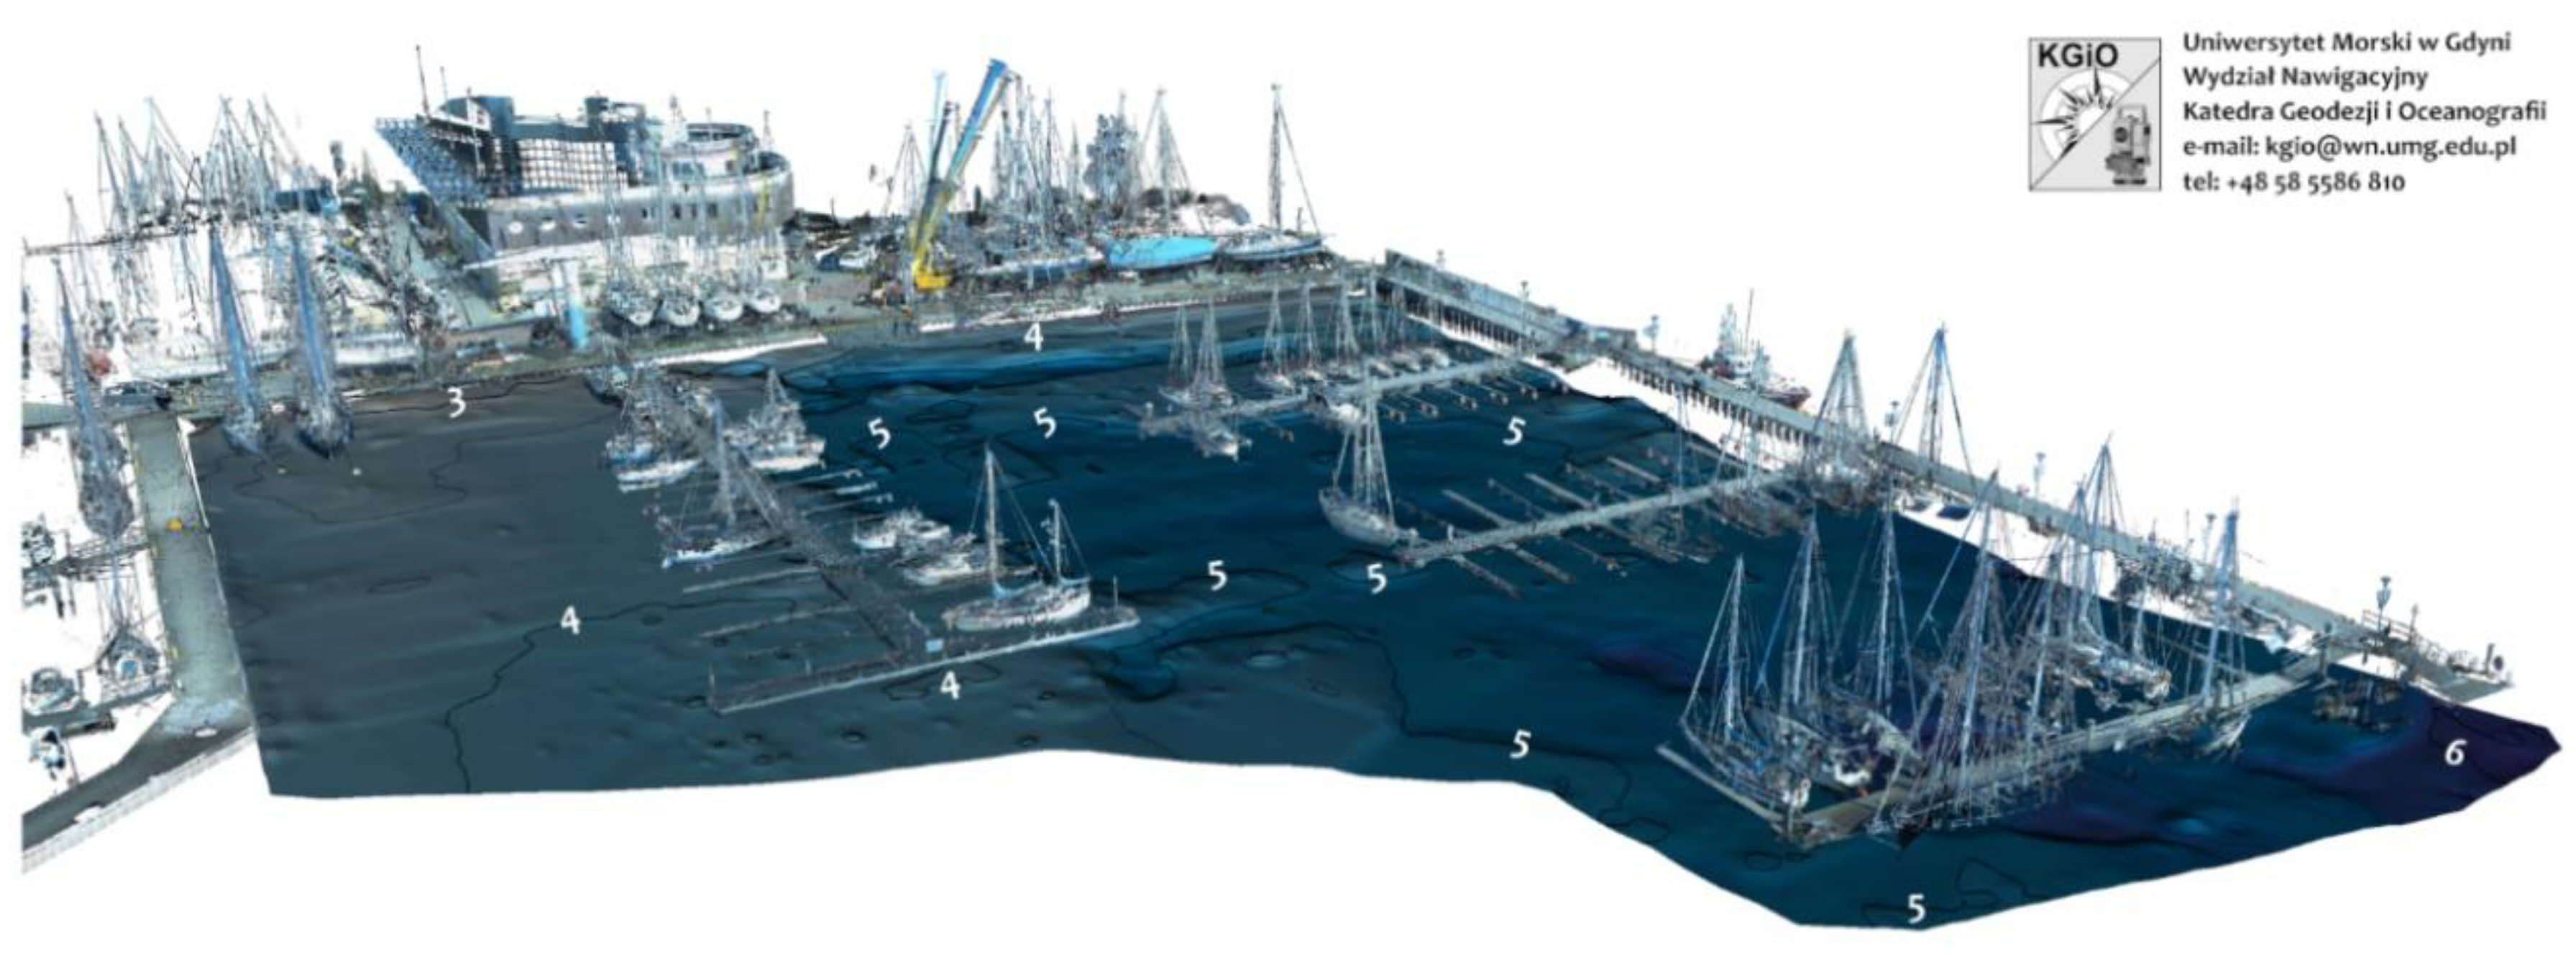
3.4. Dynamic Perspective Projection
4. Results
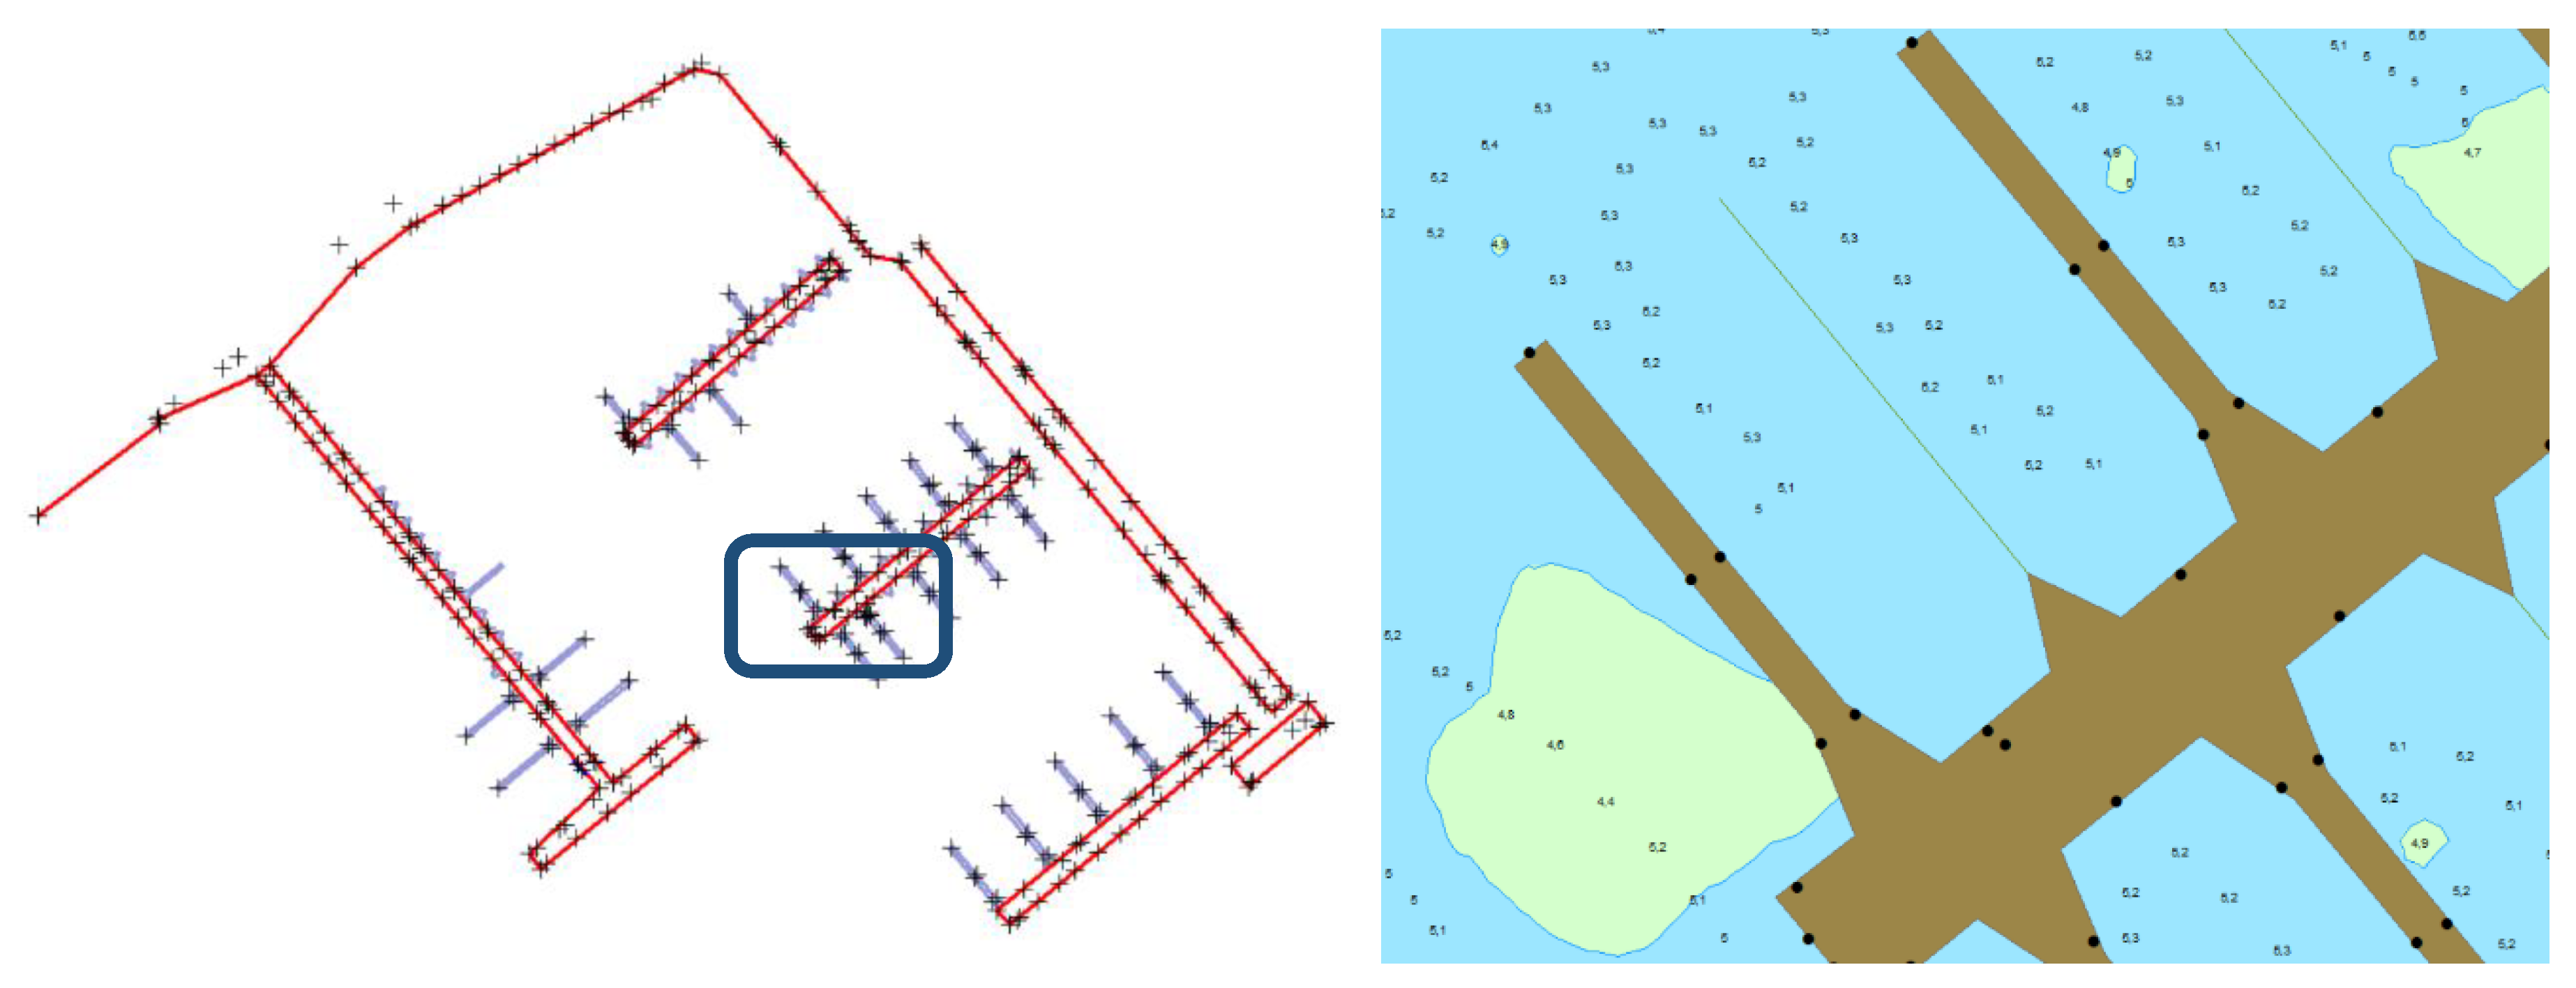
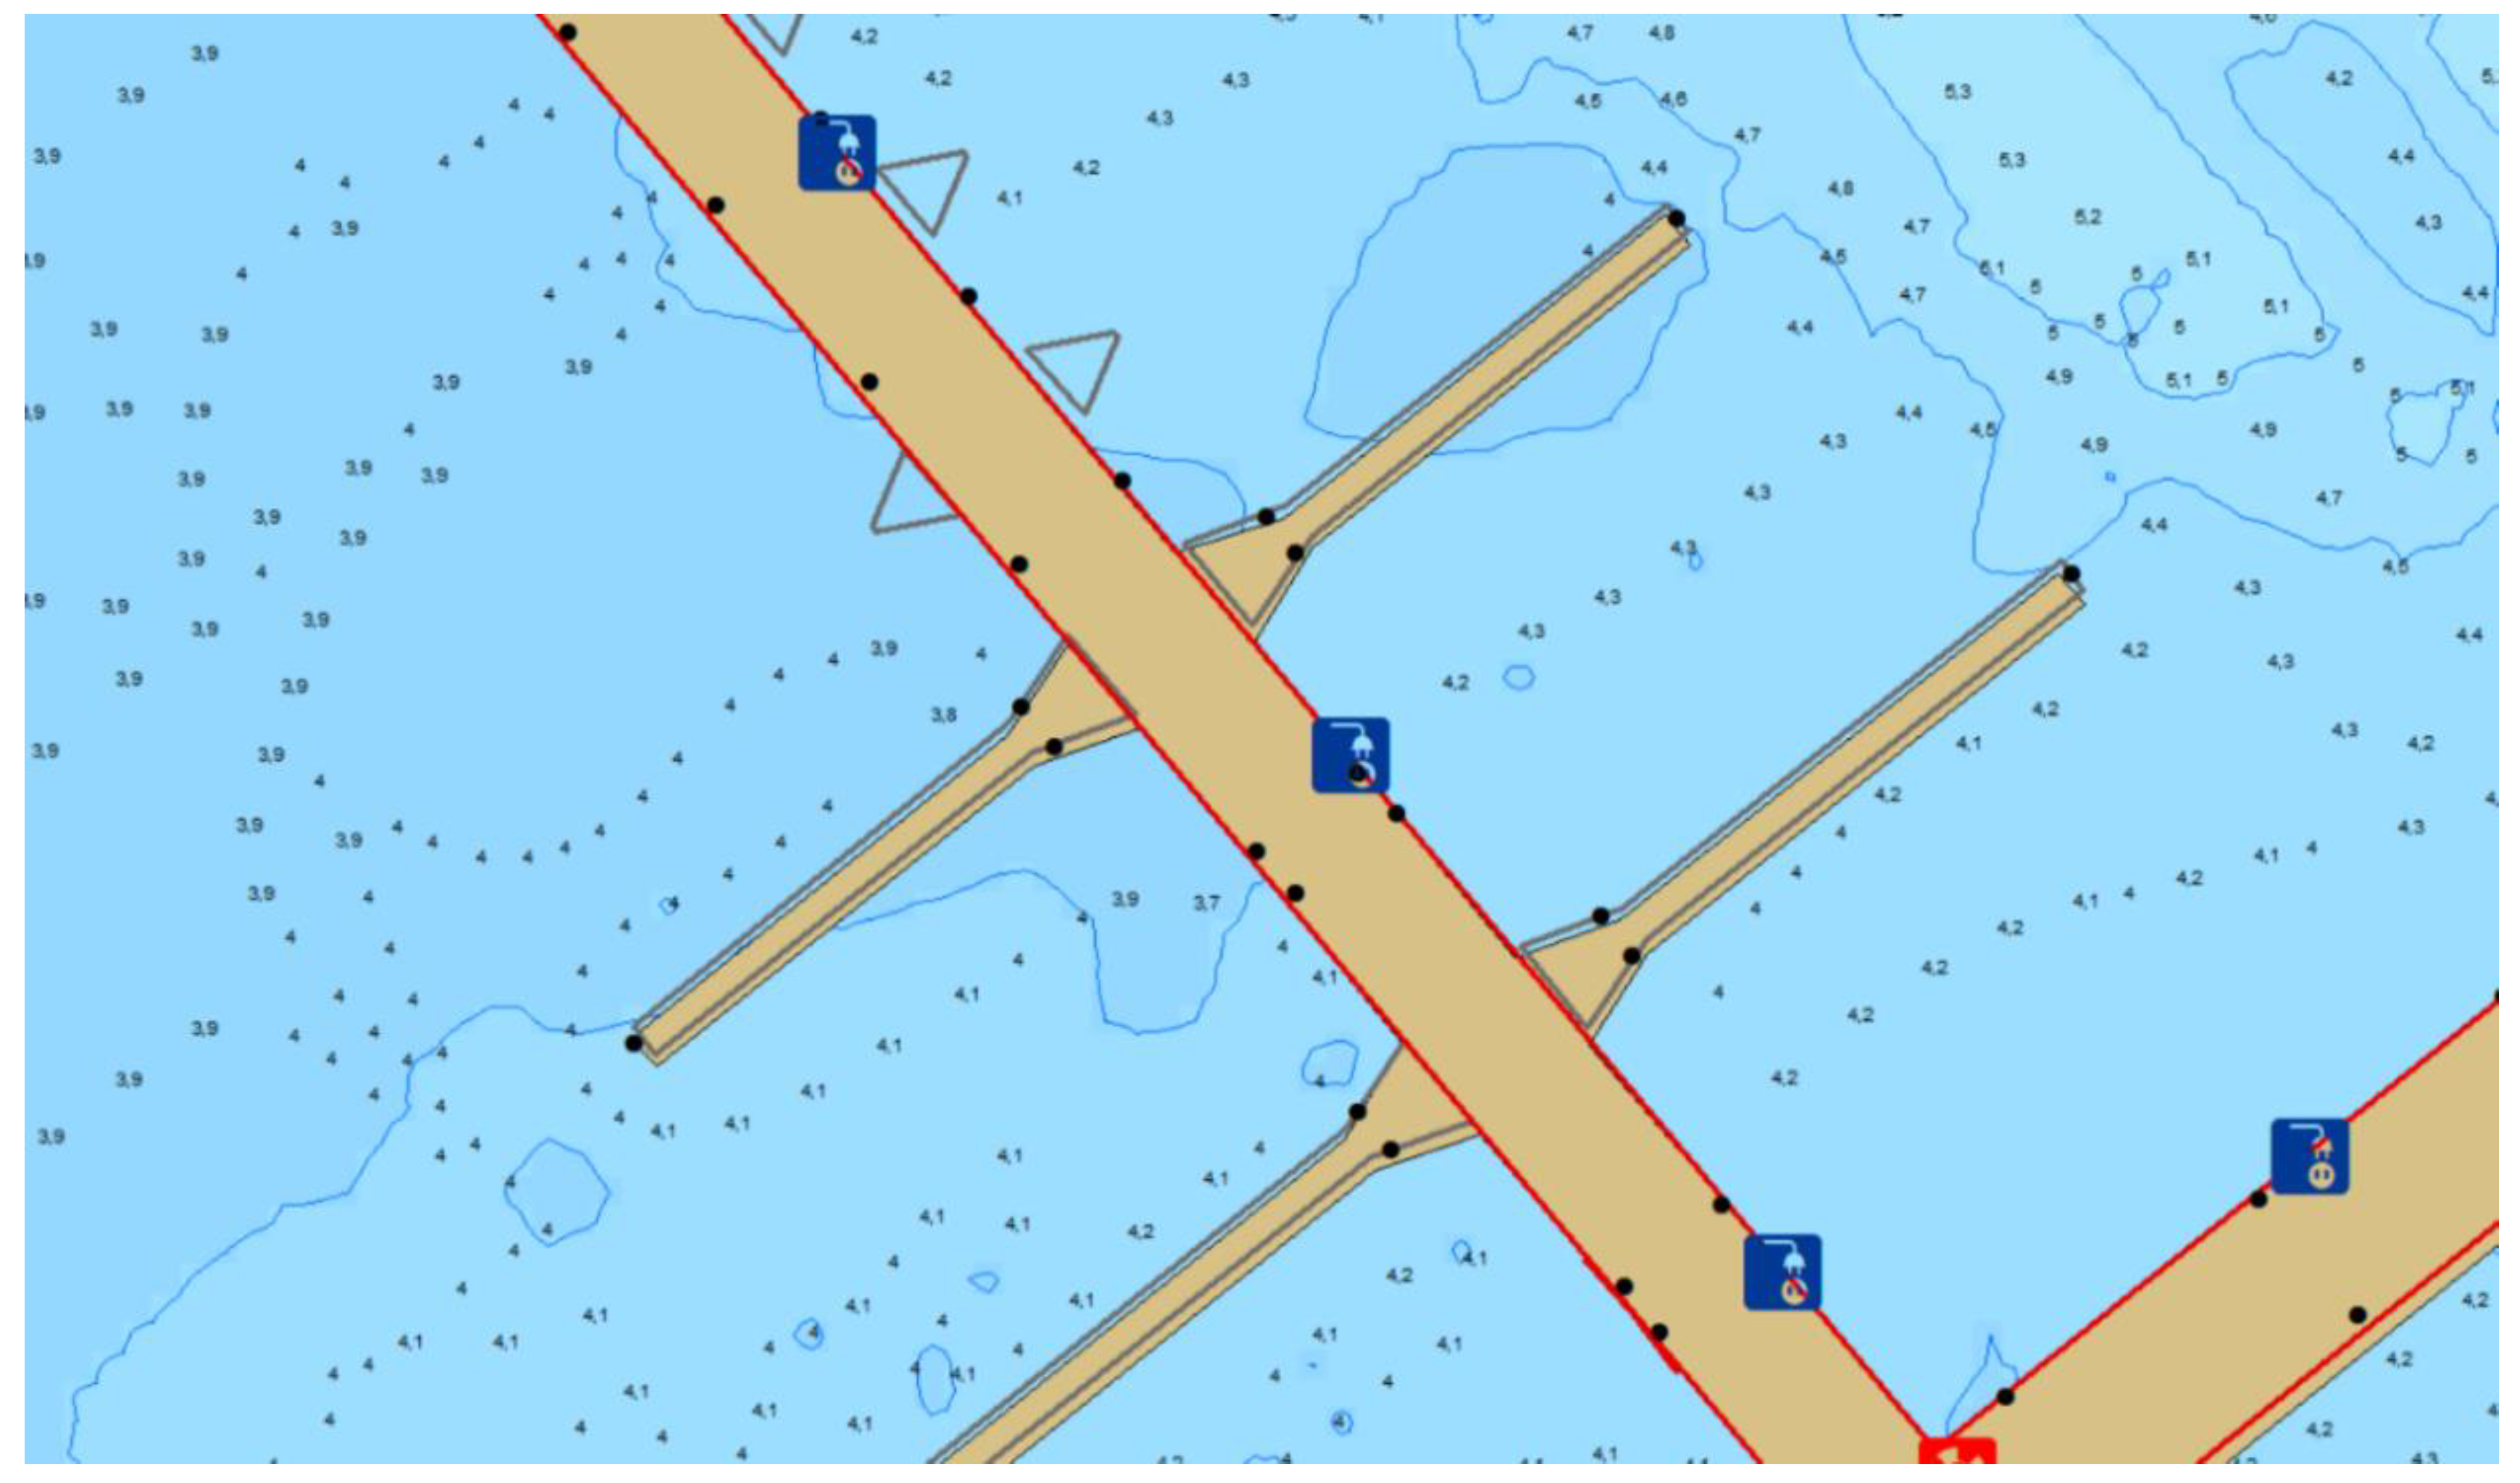
4.1. Hydrographic and Geodetic Measurements
4.2. Laser Scaning
5. Conclusions
Author Contributions
Funding
Conflicts of Interest
References
- Czaplewski, K.; Nitner, H. Navigational and Hydrographic Information in Navigational-Hydrographic Support Systems in Polish Exclusive Economic Zone. Sci. J. Pol. Navig. Acad. 2010, 4, 19–35. [Google Scholar]
- Dyrcz, C. Influence of Nautical Information on Safety at Sea. Sci. J. Pol. Navig. Acad. 2010, 4, 51–76. [Google Scholar]
- Kubicki, K. The role of maritime geospatial information for maritime activities’ protection. Hyd. Rev. 2007, 3. [Google Scholar]
- Ministry of Transport, Construction and Maritime Economy. Ordinance of the Minister of Transport, Construction and Maritime Economy of 1 June 1998 on the Technical Conditions That Should Be Met by Marine Hydraulic Structures and Their Location, 1998; Ministry of Transport, Construction and Maritime Economy: Warsaw, Poland, 1998. (In Polish)
- Ministry of Transport, Construction and Maritime Economy. Ordinance of the Minister of Transport, Construction and Maritime Economy of 23 October 2006 on the Technical Conditions for the Use of Marine Hydraulic Structures and the Detailed Scope of Inspections to Be Carried out on Such Structures, 2006; Ministry of Transport, Construction and Maritime Economy: Warsaw, Poland, 2006. (In Polish)
- Hydrographic Office of the Polish Navy. Maritime Hydrography—Organization and Research Rules; Hydrographic Office of the Polish Navy: Gdynia, Poland, 2009.
- Hydrographic Office of the Polish Navy. Maritime Hydrography—Rules of Data Collecting and Results Presentation; Hydrographic Office of the Polish Navy: Gdynia, Poland, 2009.
- Krueger, C.P.; de Souza, A.V. The Geodesy in the Hydography; 66/7 International Issue; Sociedade Brasileira de Cartografia, Geodésia, Fotogrametria e Sensoriamento Remoto: Rio de Janeiro, Brazil, 2014; pp. 1485–1493. [Google Scholar]
- Makar, A. Determination of Inland Areas Coastlines Volume 18. In Proceedings of the 18th International Multidisciplinary Scientific GeoConference SGEM, Albena, Bulgaria, 30 June–9 July 2018; Volume 18, pp. 701–708. [Google Scholar] [CrossRef]
- International Hydrographic Organization. Standards for Hydrographic Surveys, Special Publication No. 44, 5th ed.; International Hydrographic Organization: Monaco, Monaco, 2008. [Google Scholar]
- Canadian Hydrographic Service. Standards for Hydrographic Surveys, 2nd ed.; Canadian Hydrographic Service: Ottawa, ON, Canada.
- Specht, C.; Weintrit, A.; Specht, M. Determination of the Territorial Sea Baseline—Aspect of Using Unmanned Hydrographic Vessels. TransNav Int. J. Mar. Navig. Saf. Sea Transp. 2016, 4, 649–654. [Google Scholar] [CrossRef]
- Specht, C.; Specht, M.; Cywiński, P.; Skóra, M.; Marchel, Ł.; Szychowski, P. A New Method for Determining the Territorial Sea Baseline Using an Unmanned, Hydrographic Surface Vessel. J. Coast. Res. 2019, 35, 925–936. [Google Scholar] [CrossRef]
- Specht, M.; Specht, C.; Wąż, M.; Naus, K.; Grządziel, A.; Iwen, D. Methodology for Performing Territorial Sea Baseline Measurements in Selected Waterbodies of Poland. App. Sci. 2019, 9, 3053. [Google Scholar] [CrossRef]
- Stateczny, A.; Kazimierski, W.; Burdziakowski, P.; Motyl, W.; Wisniewska, M. Shore Construction Detection by Automotive Radar for the Needs of Autonomous Surface Vehicle Navigation. ISPRS Int. J. Geo-Inf. 2019, 8, 80. [Google Scholar] [CrossRef]
- Giordano, F.; Mattei, G.; Parente, C.; Peluso, F.; Santamaria, R. MicroVEGA (Micro Vessel for Geodetics Application): A Marine Drone for the Acquisition of Bathymetric Data for GIS Applications. Int. Arch. Photogramm. Remote Sens. Spat. Inf. Sci. 2015, 40, 123–130. [Google Scholar] [CrossRef]
- Giordano, F.; Mattei, G.; Parente, C.; Peluso, F.; Santamaria, R. Integrating Sensors into a Marine Drone for Bathymetric 3D Surveys in Shallow Waters. Sensors 2016, 16, 41. [Google Scholar] [CrossRef]
- Baptista, P.; Bastos, L.; Bernardes, C.; Cunha, T.; Dias, J. Monitoring Sandy Shores Morphologies by DGPS—A Practical Tool to Generate Digital Elevation Models. J. Coast. Res. 2008, 24, 1516–1528. [Google Scholar] [CrossRef]
- Specht, C.; Smolarek, L.; Pawelski, J.; Specht, M.; Dąbrowski, P. Polish DGPS System: 1995–2017—Study of Positioning Accuracy. Pol. Mar. Res. 2019, 26, 15–21. [Google Scholar] [CrossRef]
- Szot, T.; Specht, C.; Specht, M.; Dabrowski, P. Comparative analysis of positioning accuracy of Samsung Galaxy smartphones in stationary measurements. PLoS ONE 2019, 14, e0215562. [Google Scholar] [CrossRef] [PubMed]
- Stateczny, A.; Włodarczyk-Sielicka, M.; Grońska, D.; Motyl, W. Multibeam Echosounder and LiDAR in Process of 360-Degree Numerical Map Production for Restricted Waters with HydroDron. In Proceedings of the 2018 Baltic Geodetic Congress, Gdańsk, Poland, 21–23 June 2018; pp. 288–292. [Google Scholar]
- Sobott, R.J.G.; Heinzeb, T.; Neumeisterc, K.; Hildenhagend, J. Laser interaction with polychromy: Laboratory investigations and on-site observations. J. Cult. Herit. 2003, 4, 276–286. [Google Scholar] [CrossRef]
- Boehler, W.; Marbs, A. 3D scanning and photogrammetry for heritage recording: A comparison. In Proceedings of the 12th International Conference on Geoinformatics, Gavle, Sweden, 7–9 June 2004. [Google Scholar]
- Hodge, R.A. Using simulated Terrestrial Laser Scanning to analyse errors in high-resolution scan data of irregular surfaces. ISPRS J. Photogramm. Remote Sens. 2010, 65, 227–240. [Google Scholar] [CrossRef]
- Soudarissanane, S.; Lindenbergh, R.; Gorte, B. Reducing the error in terrestrial laser scanning by optimizing the measurement set-up. In XXI ISPRS Congress, Commission I–VIII, 3–11 July 2008, Beijing, China; International Society for Photogrammetry and Remote Sensing: Beijing, China, 2008; Volume XXXVII, pp. 615–620. [Google Scholar]
- Dąbrowski, P.; Specht, C. Spatial Expansion of the Symmetrical Objects Point Clouds to the Lateral Surface of the Cylinder–Mathematical Model. Measurement 2019, 134, 40–47. [Google Scholar] [CrossRef]
- Staiger, R. Terrestrial Laser Scanning—Technology, Systems and Applications. In Proceedings of the 2nd FIG Regional Conference, Marrakech, Morocco, 2–5 December 2003. [Google Scholar]
- Trebuňa, P.; Mizerák, M.; Rosocha, L. 3D Scanning—Technology and Reconstruction. Acta Simulatio 2018, 4, 1–6. [Google Scholar] [CrossRef]
- Tse, R.O.C.; Gold, C.; Kidner, D. 3D City Modelling from LIDAR Data. In Advances in 3D Geoinformation Systems; Lecture Notes in Geoinformation and Cartography; Springer: Berlin, Germany, 2008; pp. 161–175. [Google Scholar]
- Specht, C.; Makar, A.; Specht, M. Availability of the GNSS Geodetic Networks Position during the Hydrographic Surveys in the Ports. TransNav Int. J. Mar. Navig. Saf. Sea Transp. 2018, 4, 657–661. [Google Scholar] [CrossRef]
- Stateczny, A.; Łubczonek, J. Spatial Sea Chart—New Possibilities of Presenting Navigational Information. In Proceedings of the 1st International Congress of Seas and Oceans, Szczecin-Międzyzdroje, Poland, 18–22 September 2001; Volume 1. [Google Scholar]
- Łubczonek, J. Marine Electronic Chart with 3D Presentation of Navigational Information. Ann. Geom. 2005, 3, 107–116. [Google Scholar]
- Naus, K.; Makar, A. Mathematical Model of the Dynamic Perspective Projection with the Three Nonlinear Points Method. Sci. Bull. Tech. Univ. Radom Pol. Transp. 2002, 1, 429–434. [Google Scholar]
- Naus, K.; Makar, A. The Dynamic Perspective Projection for Presentation of the Geometrical Information about the Geographical Environment. In Proceedings of the XIII International Scientific and Technical Conference “The Part. of Navigation in Support. of Human Activity on the Sea”, Gdynia, Poland; Naval University of Gdynia: Gdynia, Poland, 14–15 November 2002; pp. 81–95. [Google Scholar]
- Naus, K.; Makar, A. Dynamic Perspective Projection—Methods of Connecting the Reference Plane and the Projection Centre with the Moving Vessel. Geodezja Kartografia 2003, 52, 99–110. [Google Scholar]
- Naus, K.; Makar, A. Mathematical Model of the Dynamic Perspective Projection for Presentation of ENC. Revista Instituto Navegacion Espana 2003, 19, 76–87. [Google Scholar]
- Ray, C.; Goralski, R.; Claramunt, C.; Gold, C. Real-Time 3D Monitoring of Marine Navigation. In Information Fusion and Geographic Information Systems; Springer: Berlin, Germany, 2011. [Google Scholar] [CrossRef]
- Makar, A. Dynamic Tests of ASG-EUPOS Receiver in Hydrographic Application. In Proceedings of the 18th International Multidisciplinary Scientific GeoConference SGEM, Albena, Bulgaria, 30 June–9 July 2018; Volume 18, pp. 743–750. [Google Scholar] [CrossRef]
- Petrie, G.; Toth, C.K. Introduction to Laser Ranging, Profiling and Scanning. In Topographic LASER Ranging and Scanning: Principles and Processing; CRC Press Taylor Francis Group: Boca Raton, FL, USA, 2009. [Google Scholar]
- Makar, A.; Naus, K. Conception of spatial presentation of ENC. In Proceedings of the XIV International Scientific and Technical Conference “The Part of Navigation in Support of Human Activity on the Sea“; Institute of Navigation and Hydrography: Gdynia, Poland; Gdynia, Poland, 18–19 November 2004; pp. 130–141. [Google Scholar]
- Makar, A.; Naus, K. Possibilities Analysis of Using ENC for Creating Digital Sea Bottom Model. Sci. Bull. Tech. Univ. Radom Pol. Transp. 2004, 2, 622–631. [Google Scholar]
- Makar, A. Modeling of Sea Bottom Using Bézier Pieces. Hydroacoustics 2010, 13, 183–190. [Google Scholar]
- Makar, A. Modeling of Sea Bottom Using Uniform Rectangular Bézier Pieces. Hydroacoustics 2011, 14, 143–148. [Google Scholar]
- Makar, A.; Sassais, R. Methods to Generate Numerical Models of Terrain for Spatial ENC Presentation. Ann. Navig. 2011, 18, 69–81. [Google Scholar]
- Makar, A. The Sea Bottom Surface Described by Coons Pieces. Sci. J. Marit. Univ. Szczecin 2016, 45, 187–190. [Google Scholar] [CrossRef]
- International Hydrographic Organization. Regulations of the IHO for International (INT) Charts and Chart Specifications of the IHO, 4.8.0 ed.; International Hydrographic Organization: Monaco, Monaco, 2018. [Google Scholar]
- Council of Ministers of the Republic of Poland. Act of 4 March 2010 on the Infrastructures for Spatial Information, 2010; Council of Ministers of the Republic of Poland: Warsaw, Poland, 2010. (In Polish) [Google Scholar]


| Scanning speed | 1 million pts/sec |
| Max. standard range | 120 m on 18–90% reflectivity 100 m on very low reflectivity (5%) |
| Extended range | 340 m |
| Range noise | <2 mm on most surfaces with Standard scan modes |
| Field of view | 360° × 317° |
| Angular accuracy | 80 µrad |
| Integrated HDR camera | 10 megapixel resolution, full field of view |
© 2020 by the authors. Licensee MDPI, Basel, Switzerland. This article is an open access article distributed under the terms and conditions of the Creative Commons Attribution (CC BY) license (http://creativecommons.org/licenses/by/4.0/).
Share and Cite
Makar, A.; Specht, C.; Specht, M.; Dąbrowski, P.; Szafran, M. Integrated Geodetic and Hydrographic Measurements of the Yacht Port for Nautical Charts and Dynamic Spatial Presentation. Geosciences 2020, 10, 203. https://doi.org/10.3390/geosciences10050203
Makar A, Specht C, Specht M, Dąbrowski P, Szafran M. Integrated Geodetic and Hydrographic Measurements of the Yacht Port for Nautical Charts and Dynamic Spatial Presentation. Geosciences. 2020; 10(5):203. https://doi.org/10.3390/geosciences10050203
Chicago/Turabian StyleMakar, Artur, Cezary Specht, Mariusz Specht, Paweł Dąbrowski, and Maciej Szafran. 2020. "Integrated Geodetic and Hydrographic Measurements of the Yacht Port for Nautical Charts and Dynamic Spatial Presentation" Geosciences 10, no. 5: 203. https://doi.org/10.3390/geosciences10050203
APA StyleMakar, A., Specht, C., Specht, M., Dąbrowski, P., & Szafran, M. (2020). Integrated Geodetic and Hydrographic Measurements of the Yacht Port for Nautical Charts and Dynamic Spatial Presentation. Geosciences, 10(5), 203. https://doi.org/10.3390/geosciences10050203