Abstract
The use of geodetic and hydrographic systems, methods and measuring devices to obtain geospatial data enables integrated modeling of 3D space and related objects. Factors such as the seafloor relief of the marina and land infrastructure need to be considered to ensure safe stay of vessels in the marina. The article presents the results of bathymetric and geodetic measurements of the yacht port of the National Sailing Centre in Gdańsk. They were made with the use of several measuring methods such as a hydrographic unmanned surface vessel, GNSS positioning, enabling geodetic inventory of hydrotechnical structures and port infrastructure, as well as laser scanning that resulted in three-dimensional presentation of land objects. As a result of research and analysis, a two-dimensional bathymetric chart of the yacht port was made. Thanks to the integration of geodetic and hydrographic data, three-dimensional visualization of the marina area was obtained. The charts can be used to ensure ship navigation safety when maneuvering in port and mooring at quays.
1. Introduction
An important aspect of the infrastructure safety of a yacht port is bathymetric information. It is part of a broader term, i.e. navigational information [1,2]. In order for this information to be useful, it needs to satisfy a number of basic conditions. Apart from the substantive (thematic) content, the information needs to have features that facilitate its verification and proper use, for example through an assessment of its reliability [3]. Moreover, the information should meet certain general requirements arising from users’ needs. To meet these requirements, the information should be relevant, complete, accessible, timely, up-to-date, easy to use (to image), easy to store, and correctable. In order to ensure that it is up to date, periodic bathymetric plans for a water area are devised every two years for irregular use of water areas and marine structures [4,5].
Hydrographic surveys which provide a basis for the creation of a navigational chart comprise [6,7] bathymetric surveys of the sea bottom and onshore surveys [8,9] of quays and bitts with an accuracy specified in [10,11] depending on the sounding (water area) category.
As the port is approaching and the water area limitations are taken into account, bathymetric surveys are carried out using ever-smaller sounding vessels. Hydrographic ships and vessels carry out bathymetric surveys in open water areas, at great depths and in the 24/7 system. In the coastal area and in major harbour basins, surveys are carried out using hydrographic cutters and motor boats whose size prevents them from maneuvering within a marina, particularly where vessels are at berth. For this reason, depth measurements in small yacht harbours are taken on an irregular basis, which is why such marinas often have no up-to-date information of the seabed surface. In recent years, unmanned maritime vessels have been developing very rapidly. Unmanned surface vessels (USVs) are a variety of design solutions in the construction of the hull and the boat propulsion: single hull, double hull, with a screw or screwless propulsion with a small draft [12]. Due to the unprecedented functionalities, they found a wide application in many measurement applications in the second decade of the 21st century. One of the most important of these applications are hydrographic measurements: port basins, lakes, rivers and small reservoirs, where their aim is to measure the seafloor relief with the appropriate accuracy [13,14]. In addition, USVs are increasingly used for tasks related to supporting the navigation process [15], in underwater photogrammetry [16], or in geological works [17]. Owing to the significant increase in accuracy of GNSS (Global Navigation Satellite System) systems’ position, unmanned hydrographic vessels no longer have to use expensive GNSS RTN (Real Time Network) systems (accuracy of 2–3 cm, p = 0.95) but can successfully use DGPS (Differential Global Positioning System) [18,19] and EGNOS (European Geostationary Navigation Overlay Service) [19] systems (accuracy of 2 m, p = 0.95) or even multi-system multi-GNSS receivers (accuracy of 3–5 m, p = 0.95) [20]. An equally important aspect of progress has been the emergence of miniature multibeam echosounders which have helped to significantly increase the efficiency of AUV (Autonomous Underwater Vehicle) hydrographic work [21].
The onshore part of hydrographic surveys includes geodetic inventory of quays and hydro-engineering devices. Nowadays, the most effective method of taking an inventory is the use of laser scanning. It ensures cloud point accuracy at a level of 2–5 cm [22,23,24]. Thanks to advanced error-reduction methods [25], cartographic imaging algorithms [26] and the effective processing of a large amount of data reduction [27], it is possible to precisely represent the 3D shape of objects from single objects [28] to that of an entire city [29]. An alternative to laser scanning is the method of quay inventory using GNSS networks with a measurement accuracy of 2–5 cm, p = 0.95 [30]; however, its limitation is the lack of the option of 3D modelling of objects.
The acquired geospatial data is usually presented in the form of two-dimensional cartographic products, such as geodetic maps, nautical and bathymetric charts. Digital data is also used to present in SENC (System of Electronic Navigational Chart) onboard vessels. The 3D capability can be utilised in laboratory as well as operational use. A chart, which depicts three-dimensional data, is the best vehicle to visualise real world [31,32]. Dynamic perspective projection [33,34,35,36] can be particularly useful when presenting the surroundings during the movement of a floating vessel [37].
Geodetic and hydrographic surveys were carried out in the yacht port of the National Sailing Centre at the Gdańsk University of Physical Education and Sport. It is located at the mouth of the Śmiała Wisła river (Figure 1) naturally surrounded by a landscape park, several kilometres to the east of the TriCity agglomeration. The port has 51 berths at the quay and floating landing stage. On land, there are lecture and seminar rooms, a shed, a biological regeneration complex with a sauna, a navigation and meteorological office with a look-out tower, a sailmaker’s workshop with sail sewing machines, and a boatbuilding and mechanical workshop. In 2015, the marina was reconstructed. In addition to infrastructure upgrading, the basin was deepened to a minimum depth of 4.5 m. Prior the reconstruction, the depths shallow by 50 cm.
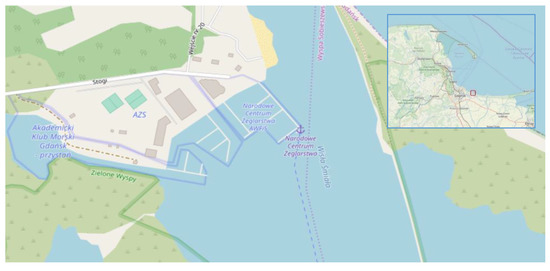
Figure 1.
The area of the National Sailing Centre surrounded by neighbouring quay users.
In the research: scanning method for hydrography, multisensory bathymetry, 3D visualization for navigation, USV surveys in restricted area and surveys between vessels and yachts are advances in bathymetry.
2. Materials
The project was carried out using measuring instruments and systems in three areas: a hydrographic system to investigate the shape of the sea bottom, a GNSS system receiver for measurements of the coastline, platforms and bitts, and a laser scanner for the measurement of a geospatial point cloud of the onshore infrastructure.
Hydrographic surveys were carried out using an unmanned hydrographic vessel which enabled the performance of surveys in both manual and autonomous mode. The study used two operating modes: autonomous in the open space of the marina along parallel profiles, and manual in areas difficult to access. The hydrographic equipment of the vessel included a SonarMite hydrographic singlebeam echosounder operating at a frequency of 200 kHz, and a Trimble R10 geodetic receiver operating in the VRS Net at a frequency of 10 Hz. On shallow water (a depth of up to 6 m) and on quiet water, an MRU (Motion Reference Unit) sensor was not used for the HPR (heave, pitch, roll) compensation.
Geodetic surveys of quays, platforms and bitts were carried out using a Topcon Hyper II receiver operating in the TPI NetPro network with NET RTCM 3.0 which ensures positioning with a horizontal accuracy better than 3 cm [9,38]. They were conducted in the PL-2000 system with the EVRF2007 geoid model determined with 0.0001 m vertical resolution.
The surveys of port infrastructure were carried out using a Trimble TX8 laser scanner without the photo-taking option. Hence, the obtained point clouds only had colours resulting from the calculated laser beam reflection intensity. Basic parameters of Trimble TX8 laser scanner are presented in Table 1.

Table 1.
Basic parameters of Trimble TX8 laser scanner.
3. Methods
3.1. Hydrography
Where there is enough time to take measurements freely, and where there is no limitation resulting from a contract or a task assigned, hydrometeorological conditions should be used as a guideline. As regards hydrographic surveys, the implementation is significantly affected by waving, water level and acoustic properties of water. Although waving hinders the control of a sounding unit which, in this case was a small unmanned vessel, it also affects the accuracy of determining the seabed shape. AUV rolls cause the deflection of the positioning system antenna to one side, and of the echosounder beam to another when measuring the sloping distance. The second factor, i.e., the water level, is offset in postprocessing based on water gauge observations accessible on an Internet to the nearest station(s). Where a few stations are used, the water level is interpolated based on the position in relation to them. Changes in the speed of sound in the water are long-term (seasonal) and short-term (daily) in nature. The smallest changes in the speed of sound in water are observed in the winter and, from a hydrographic perspective, this is the best period.
When carrying out a sounding using a singlebeam echosounder, the profiles are planned in a parallel system, perpendicular to the contour lines. On open water, when bathymetry (contour lines system) is known, the location of profiles is obvious. Regulations [4,5], which describe in detail the distances between profiles and their lengths, are applied in port basins, at the time of inspections of quays and bathymetric surveys in the areas where vessels are stationed. When no risk to the stability of a marine structure has been identified, or where no such obligation has been found to have been imposed by a specialised construction supervision authority, parallel profiles are positioned perpendicular to the quay at a distance of 10 m over a length of three depths, however no less than 20 m. In addition, a survey needs to be carried out in the immediate vicinity of a hydraulic structure, at a distance of 1 m away from it, another at a distance of 2 m from the previous one, and the next ones every 5 m. This is achieved by taking measurements on profiles parallel to the quay.
On this basis, it was undertaken to plan profiles in an area unoccupied by yachts by using the photographs taken by a UAV (Unmanned Aerial Vehicle) at the time of reconnaissance. Given the movement of vessels in the marina, the dynamics of the situation need to be taken into consideration. Each photograph is only up-to-date at the time when it is taken. Therefore, the best period for carrying out surveys is outside of the sailing season, when a proportion of the yachts have not yet been launched. Figure 2 presents an example of a sounding profile plan for the automatic mode.

Figure 2.
Sounding profile plan for USV operating in the automatic mode.
Bathymetric surveys aimed at obtaining geospatial data for the seabed within the yacht port area were carried out twice. In the first stage, in April 2019, basic surveys were carried out in the port, in view of the beginning of the sailing season, as many positions were not occupied by vessels. They were carried out in the port due to unfavourable navigation and hydrographic conditions outside the internal port zone. The second phase of surveys covering the external zone of the NSC (National Sailing Centre) yacht port and the entire external zone of the adjacent objects from the southern direction were carried out in the summer. The depth measurements, with account taken of the transducer draught, were related to the MSL (Mean Sea Level). Figure 3 shows a sounding vessel and its trajectory in the first stage of surveys.
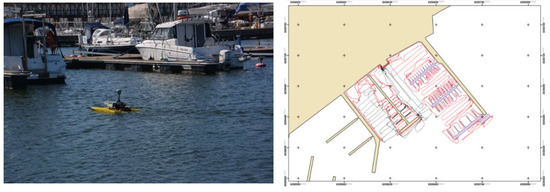
Figure 3.
USV during survey (left) and surveyed lines (right) at end of April surveys.
The singlebeam echosounder was calibrated using the bar check method, which involves adjusting the average speed of sound in water at known depths to echosounder indications. The basic method for measuring the speed of sound is the use of a CTD/STD meter or an SVP probe. An alternative is a measurement of water temperature and the determination of the speed of sound based on an empirical equation when the salinity is known. Some echosounders determine the speed of sound in water based on the temperature by means of a sensor located in the transducer.
3.2. GNSS Surveying
As part of the measurement campaign, measurements of 680 points were taken: 160–quays, 310–platforms and berth moorings, and 310–bitts and electricity intake points. A Topcon HyPer II receiver with a Sokkia SHC-25 controller operating in the TPI NETpro network with the NET RTCM 3.0 with a virtual reference station were used. This ensured obtaining the accuracy of the determination of position coordinates: horizontal of 0.5–1.8 cm, and vertical of 0.6–2.1 cm.
Overall, 160 characteristic points of the permanent quay were used for comparison with the Electronic Navigational Chart (Figure 4) contained in the PL5WISLA.000 cell along with six (the latest in January of 2018) updates taking into account the port reconstruction and bathymetry.

Figure 4.
A sketch of geodetic surveys (on the left) and field surveys plotted on ENC.
In general, geodetic surveys of the main structure of platforms (red colour) coincide with the ENC imaging. A small difference (approx. 13 cm) was found on the components marked in Figure 5 in grey colour and presented in Figure 6 (on the left). Out of 265 points, 208 supplement the 57 points that describe the mooring equipment contained in the ENC under the acronym of MORFAC (Mooring/Warping facility). An ENC cell contains only bitts located on the permanent quay.
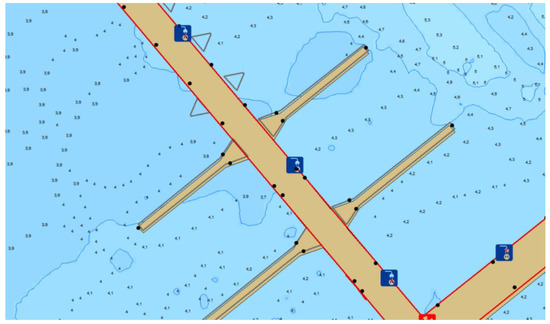
Figure 5.
Supplementing the ENC to include missing platforms.
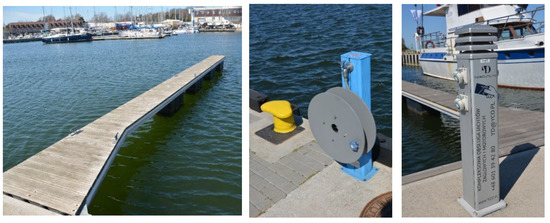
Figure 6.
A platform and components of infrastructure: a hydrant and an electrical container.
Figure 6 shows a view of the platform along with bitts (on the left), a bitt with a water take-off point (in the centre), and an electricity intake point (on the right).
3.3. Laser Scanning
Laser scanning, frequently used in open spaces, is also determined by atmospheric conditions. In particular, the devices are adversely affected by negative temperatures. Situations in which the difference in ambient temperature and the temperature inside the device are significantly different should be avoided. Specific values are determined by the particular scanner model. However, solar rays may cause interference with the receiver in terms of the returning laser beam, and thus errors when taking a measurement of distance. When taking measurements, one should also avoid rainfall as rain drops can act as lenses, which may cause laser beam deflection. Dust and water particles found in the air increase the risk of beam dispersion, and thus the emitted signal strength is reduced [39].
The three-dimensional presentation of infrastructural components of the marina of the National Sailing Centre at the Gdańsk University of Physical Education and Sport was a significant supplement to bathymetric data. This task was performed using terrestrial laser scanning technology. The instrument that was used (a Trimble TX8 scanner) is equipped with a module that enables taking photographs of the surroundings and then assigning a colour to particular surveyed points. Within the marine area, 16 scanner measurement stands were established, at which a distance between the target and the device as well as horizontal and vertical angles were measured for each of the cloud points.
Based on the above geodetic observations, the coordinates of particular points in the local coordinate system of the stand were calculated. It is worth noting that each measuring stand had a separate coordinate system with a starting point in the emission-receiving centre of the laser scanner. The angular orientation of the coordinate system resulted from the way (direction) of mounting the instrument on a tripod. In order to create a uniform spatial set for the entire marina in one (global) coordinate system, transformation parameters for particular point clouds with local coordinated systems were determined. The effect of the registration (matching) process is a geometrically and logically consistent set of spatial data that present the surveyed object. In the registration, the matching points were the coordinates of spherical centres of tags (styrofoam balls) placed prior to the laser measurement at locations ensuring the best possible visibility from the neighbouring measurement stands. The registration error for 16 (part of them presented in Figure 7) point clouds did not exceed 1 cm. The resulting set is a digital representation of the marina (Figure 8) that can be displayed, viewed and processed in software dedicated (e.g., CloudCompare) to this purpose.
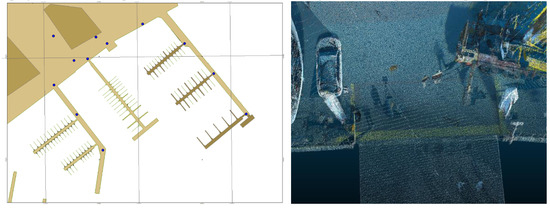
Figure 7.
A part of TLS stations (left) and visualization of one of them close to slipway (right).
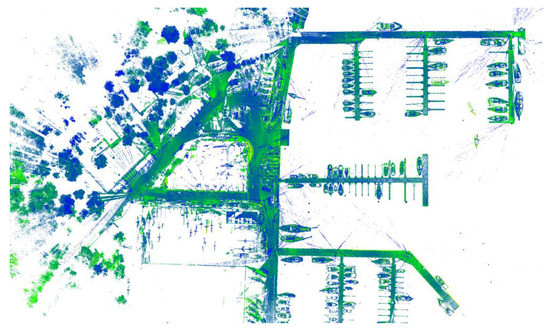
Figure 8.
2D imaging of the point cloud resulting from laser scanning of the NSC yacht port.
3.4. Dynamic Perspective Projection
The perspective projection belongs to the class of geometrical planar projections. The projection is made on the plane, however, linear projection beams are used. Visual effect of the single-point perspective projection is similar to the effect occurring in the human optic system. In the perspective projection the real image of an observed 3D object originates as a result of projection of each point by projection beams radiated from the projection centre and crossing the projection plane.
Assuming that a chart should be prepared for observer’s position (for vessel’s position), it is suggested that the projection plane Π and reference system ℑΠ are given with respect to ℑ’ in the following way [33,34,35,36]:
The reference system ℑ = {O, (e1, e2, e3)} (called the geocentrical) is connected with the Earth in this way, that its versors e1, e2, e3 determine the axes X, Y, Z of this system. The reference system ℑ’ = {O’, (e1’, e2’, e3’)} (called the observer’s) is connected with the position of the vessel and its beginning and the base is determined with respect to the reference system ℑ. It follows that the projection is made in the observer reference system ℑ’. However, before projection, the base (e1’, e2’, e3’) transformation and the centre O of the geocentrical reference system ℑ in relation to the base (e1’, e2’, e3’) and the centre O’ of the observer reference system ℑ’, should be made.
The transformation, which consists of translation of the point O to the point O’ and rotation of the base (e1, e2, e3) with respect to the base (e1’, e2’, e3’), is done using the following transformation matrix [33,34,35,36]:
where
When location of vectors e1’, e2’, e3’ with respect to the geocentrical reference system ℑ of the observer reference system ℑ’ in the location space Eℑ3 are functions of the time variable t (t∈τ), then the system ℑ’ is in movement °ℑ with respect to the reference system ℑ in the time range τ.
There is assumed, that the system ℑ’ is in rigid (Euclidean) movement with respect to the system ℑ in the time range τ. °ℑ unambiguously describes movement of the location space Eℑ3 with respect to the reference system ℑ [33,34,35,36]:
for t∈τ.
This method was used for dynamic visualisation of the surroundings built on the basis of the geospatial data included in the ENC [40,41]. In this model it was assumed that: the land surface is flat, all buildings are of equal height, and the sea bottom model is built on the basis of objects including the geospatial data: LNDARE (land area), DEPCNT (depth contour) and SOUNDG (sounding) [40,41]. Spatial presentation of the NSC area is shown in Figure 9.
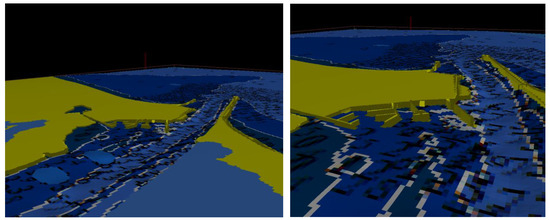
Figure 9.
Spatial presentations of the NSC on the basis of the ENC PL5WISLA cell.
4. Results
4.1. Hydrographic and Geodetic Measurements
A bathymetric chart, as one of the reporting documents from bathymetric surveys, was prepared in accordance with the rules adopted in hydrography and presented in Figure 10. The basic components include: scale, frame, coastline, contour lines and (depth) soundings.

Figure 10.
A bathymetric chart as a 2D model in basic (main view) and extended (small view) presentations.
The map scale applied in most bathymetric studies is usually 1:500 or 1:1000. Where surveys are carried out in accordance with [4,5], the map scale is 1:100, 1:500 or 1:1000. It is selected to the printout format, in order to maintain its cartometric properties. The frame contains coordinates in which the study was carried out. This is usually in the UTM system, although this study was prepared in the PL-2000 system because of integration of the hydrographic and geodetic data for land management. The grid of crosses is enriched with lines of the grid of geographical coordinates.
Among the methods for creating the Digital SeaBottom Model [42,43,44,45], the IDW (Inverse Distance Weighted) model with separation every 0.5 m was applied to determine the contour lines. The size of the uniform (rectangular) grid cell was set at 0.5 m × 0.5 m. A matrix of 689 × 781 cells covering the NSC area and the adjacent water regions was created in this way (Figure 10). DSBM—Digital SeaBottom Model can also be used for its spatial presentation. The (depth) soundings were plotted with a resolution of 0.1 m in accordance with [46] for a shallow water region with depths of up to 31 m. The study was carried out in the ArcGIS 10.5 environment using the ENC PL5WISLA cell.
4.2. Laser Scaning
The three-dimensional presentation of infrastructural components of the marina of the National Sailing Centre at the Gdańsk University of Physical Education and Sport was a significant supplement to bathymetric data. This task was performed using the terrestrial laser scanning technology. An image of infrastructure and the platform from TLS cloud are presented in Figure 11.

Figure 11.
An image of infrastructure and the platform from TLS cloud.
Where work is carried out on spatial information sets originating from various surveying instruments, it is recommended that data harmonisation (understood as the adjustment of coordinate systems and reference systems) should be carried out to reliably conclude and compare both elements [47]. In the case under consideration, it could be assumed that both spatial references are identical.
Using dynamic perspective projection on the basis of following parameters: vessel’s position, course, height of the observer, and inclination angle, the image seen by the navigator and that created on the basis of geospatial data from TLS cloud are similar (Figure 12).

Figure 12.
The image seen by the navigator and its construction on the basis of geospatial data from TLS cloud.
Synthetic presentation of the geospatial data from bathymetric sounding and laser scanning in perspective projection is shown in Figure 13. In addition to static objects, such as berths, piers and buildings, it includes mobile objects, such as: yachts and boats, cranes and cars, captured during laser scanning.
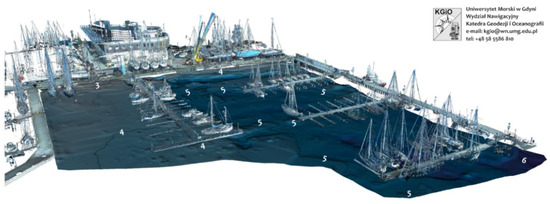
Figure 13.
Synthesis of geospatial data from bathymetric sounding and laser scanning.
5. Conclusions
Bathymetric surveys of ports and yacht marinas are extremely difficult due to the limited maneuverability between berths and moored vessels. Autonomous measuring units that carry measuring equipment, i.e., a positioning system receiver and a depth measuring device, are perfect for this task. Precise positioning in dynamics is already possible thanks to the use of geodetic system satellite receivers that enable positioning in real time at a high frequency. A depth measurement is usually taken using a singlebeam echosounder due to its small size and weight. This helps the user plan a system of surveying profiles while taking account of the estimated seabed shape and the detail level of the sounding.
Geospatial data of the upper hemisphere which present an image of quays, platforms and harbour infrastructure provide more detail to the image of the yacht harbour. They can be obtained by laser scanning or aerial photogrammetry which can currently be done with a UAV (Unmanned Aerial Vehicle). The first method is more labour-intensive and time-consuming due to the need for carrying out surveys from multiple stands.
The article presents the synthesis of bathymetric surveys carried out using a singlebeam echosounder mounted on an autonomous vessel, with measurements taken with a laser scanner. Thanks to the use of a highly accurate hydrographic echosounder and a GNSS receiver with RTK corrections, echosounder calibration, and the consideration of changes in water level, an autonomous surveying unit enabled the determination of the seabed topography with an accuracy of single centimeters. The information is supplemented by a point cloud obtained by the laser scanning method with a millimeter accuracy of the coordinates being determined. Thanks to harmonisation, the coordinates were presented in a uniform rectangular coordinate system and the depths were referred to the average sea (North Sea) level determined for the automatic tide gauge in Amsterdam. Integrated GNSS, laser and hydrographic data can be used in visualization systems, such as ECS, ECDIS and navigational simulator for dynamic, spatial presentation. On the basis of the observer’s position, the image generated and presented on the display is similar to the image seen by the navigator.
Author Contributions
Conceptualization, A.M., C.S. and M.S.; Data curation, M.S. and P.D.; Investigation, M.S., P.D. and M.S.; Methodology, A.M., C.S. and M.S.; Resources, A.M., M.S. and M.S.; Software, A.M. and P.D.; Supervision, C.S. and M.S.; Validation, A.M., M.S. and P.D.; Visualization, A.M. and P.D.; Writing—original draft, A.M. and C.S.; Writing—review & editing, A.M., C.S. and M.S. All authors have read and agreed to the published version of the manuscript.
Funding
This research received no external funding.
Conflicts of Interest
The authors declare no conflict of interest.
References
- Czaplewski, K.; Nitner, H. Navigational and Hydrographic Information in Navigational-Hydrographic Support Systems in Polish Exclusive Economic Zone. Sci. J. Pol. Navig. Acad. 2010, 4, 19–35. [Google Scholar]
- Dyrcz, C. Influence of Nautical Information on Safety at Sea. Sci. J. Pol. Navig. Acad. 2010, 4, 51–76. [Google Scholar]
- Kubicki, K. The role of maritime geospatial information for maritime activities’ protection. Hyd. Rev. 2007, 3. [Google Scholar]
- Ministry of Transport, Construction and Maritime Economy. Ordinance of the Minister of Transport, Construction and Maritime Economy of 1 June 1998 on the Technical Conditions That Should Be Met by Marine Hydraulic Structures and Their Location, 1998; Ministry of Transport, Construction and Maritime Economy: Warsaw, Poland, 1998. (In Polish)
- Ministry of Transport, Construction and Maritime Economy. Ordinance of the Minister of Transport, Construction and Maritime Economy of 23 October 2006 on the Technical Conditions for the Use of Marine Hydraulic Structures and the Detailed Scope of Inspections to Be Carried out on Such Structures, 2006; Ministry of Transport, Construction and Maritime Economy: Warsaw, Poland, 2006. (In Polish)
- Hydrographic Office of the Polish Navy. Maritime Hydrography—Organization and Research Rules; Hydrographic Office of the Polish Navy: Gdynia, Poland, 2009.
- Hydrographic Office of the Polish Navy. Maritime Hydrography—Rules of Data Collecting and Results Presentation; Hydrographic Office of the Polish Navy: Gdynia, Poland, 2009.
- Krueger, C.P.; de Souza, A.V. The Geodesy in the Hydography; 66/7 International Issue; Sociedade Brasileira de Cartografia, Geodésia, Fotogrametria e Sensoriamento Remoto: Rio de Janeiro, Brazil, 2014; pp. 1485–1493. [Google Scholar]
- Makar, A. Determination of Inland Areas Coastlines Volume 18. In Proceedings of the 18th International Multidisciplinary Scientific GeoConference SGEM, Albena, Bulgaria, 30 June–9 July 2018; Volume 18, pp. 701–708. [Google Scholar] [CrossRef]
- International Hydrographic Organization. Standards for Hydrographic Surveys, Special Publication No. 44, 5th ed.; International Hydrographic Organization: Monaco, Monaco, 2008. [Google Scholar]
- Canadian Hydrographic Service. Standards for Hydrographic Surveys, 2nd ed.; Canadian Hydrographic Service: Ottawa, ON, Canada.
- Specht, C.; Weintrit, A.; Specht, M. Determination of the Territorial Sea Baseline—Aspect of Using Unmanned Hydrographic Vessels. TransNav Int. J. Mar. Navig. Saf. Sea Transp. 2016, 4, 649–654. [Google Scholar] [CrossRef]
- Specht, C.; Specht, M.; Cywiński, P.; Skóra, M.; Marchel, Ł.; Szychowski, P. A New Method for Determining the Territorial Sea Baseline Using an Unmanned, Hydrographic Surface Vessel. J. Coast. Res. 2019, 35, 925–936. [Google Scholar] [CrossRef]
- Specht, M.; Specht, C.; Wąż, M.; Naus, K.; Grządziel, A.; Iwen, D. Methodology for Performing Territorial Sea Baseline Measurements in Selected Waterbodies of Poland. App. Sci. 2019, 9, 3053. [Google Scholar] [CrossRef]
- Stateczny, A.; Kazimierski, W.; Burdziakowski, P.; Motyl, W.; Wisniewska, M. Shore Construction Detection by Automotive Radar for the Needs of Autonomous Surface Vehicle Navigation. ISPRS Int. J. Geo-Inf. 2019, 8, 80. [Google Scholar] [CrossRef]
- Giordano, F.; Mattei, G.; Parente, C.; Peluso, F.; Santamaria, R. MicroVEGA (Micro Vessel for Geodetics Application): A Marine Drone for the Acquisition of Bathymetric Data for GIS Applications. Int. Arch. Photogramm. Remote Sens. Spat. Inf. Sci. 2015, 40, 123–130. [Google Scholar] [CrossRef]
- Giordano, F.; Mattei, G.; Parente, C.; Peluso, F.; Santamaria, R. Integrating Sensors into a Marine Drone for Bathymetric 3D Surveys in Shallow Waters. Sensors 2016, 16, 41. [Google Scholar] [CrossRef]
- Baptista, P.; Bastos, L.; Bernardes, C.; Cunha, T.; Dias, J. Monitoring Sandy Shores Morphologies by DGPS—A Practical Tool to Generate Digital Elevation Models. J. Coast. Res. 2008, 24, 1516–1528. [Google Scholar] [CrossRef]
- Specht, C.; Smolarek, L.; Pawelski, J.; Specht, M.; Dąbrowski, P. Polish DGPS System: 1995–2017—Study of Positioning Accuracy. Pol. Mar. Res. 2019, 26, 15–21. [Google Scholar] [CrossRef]
- Szot, T.; Specht, C.; Specht, M.; Dabrowski, P. Comparative analysis of positioning accuracy of Samsung Galaxy smartphones in stationary measurements. PLoS ONE 2019, 14, e0215562. [Google Scholar] [CrossRef] [PubMed]
- Stateczny, A.; Włodarczyk-Sielicka, M.; Grońska, D.; Motyl, W. Multibeam Echosounder and LiDAR in Process of 360-Degree Numerical Map Production for Restricted Waters with HydroDron. In Proceedings of the 2018 Baltic Geodetic Congress, Gdańsk, Poland, 21–23 June 2018; pp. 288–292. [Google Scholar]
- Sobott, R.J.G.; Heinzeb, T.; Neumeisterc, K.; Hildenhagend, J. Laser interaction with polychromy: Laboratory investigations and on-site observations. J. Cult. Herit. 2003, 4, 276–286. [Google Scholar] [CrossRef]
- Boehler, W.; Marbs, A. 3D scanning and photogrammetry for heritage recording: A comparison. In Proceedings of the 12th International Conference on Geoinformatics, Gavle, Sweden, 7–9 June 2004. [Google Scholar]
- Hodge, R.A. Using simulated Terrestrial Laser Scanning to analyse errors in high-resolution scan data of irregular surfaces. ISPRS J. Photogramm. Remote Sens. 2010, 65, 227–240. [Google Scholar] [CrossRef]
- Soudarissanane, S.; Lindenbergh, R.; Gorte, B. Reducing the error in terrestrial laser scanning by optimizing the measurement set-up. In XXI ISPRS Congress, Commission I–VIII, 3–11 July 2008, Beijing, China; International Society for Photogrammetry and Remote Sensing: Beijing, China, 2008; Volume XXXVII, pp. 615–620. [Google Scholar]
- Dąbrowski, P.; Specht, C. Spatial Expansion of the Symmetrical Objects Point Clouds to the Lateral Surface of the Cylinder–Mathematical Model. Measurement 2019, 134, 40–47. [Google Scholar] [CrossRef]
- Staiger, R. Terrestrial Laser Scanning—Technology, Systems and Applications. In Proceedings of the 2nd FIG Regional Conference, Marrakech, Morocco, 2–5 December 2003. [Google Scholar]
- Trebuňa, P.; Mizerák, M.; Rosocha, L. 3D Scanning—Technology and Reconstruction. Acta Simulatio 2018, 4, 1–6. [Google Scholar] [CrossRef]
- Tse, R.O.C.; Gold, C.; Kidner, D. 3D City Modelling from LIDAR Data. In Advances in 3D Geoinformation Systems; Lecture Notes in Geoinformation and Cartography; Springer: Berlin, Germany, 2008; pp. 161–175. [Google Scholar]
- Specht, C.; Makar, A.; Specht, M. Availability of the GNSS Geodetic Networks Position during the Hydrographic Surveys in the Ports. TransNav Int. J. Mar. Navig. Saf. Sea Transp. 2018, 4, 657–661. [Google Scholar] [CrossRef]
- Stateczny, A.; Łubczonek, J. Spatial Sea Chart—New Possibilities of Presenting Navigational Information. In Proceedings of the 1st International Congress of Seas and Oceans, Szczecin-Międzyzdroje, Poland, 18–22 September 2001; Volume 1. [Google Scholar]
- Łubczonek, J. Marine Electronic Chart with 3D Presentation of Navigational Information. Ann. Geom. 2005, 3, 107–116. [Google Scholar]
- Naus, K.; Makar, A. Mathematical Model of the Dynamic Perspective Projection with the Three Nonlinear Points Method. Sci. Bull. Tech. Univ. Radom Pol. Transp. 2002, 1, 429–434. [Google Scholar]
- Naus, K.; Makar, A. The Dynamic Perspective Projection for Presentation of the Geometrical Information about the Geographical Environment. In Proceedings of the XIII International Scientific and Technical Conference “The Part. of Navigation in Support. of Human Activity on the Sea”, Gdynia, Poland; Naval University of Gdynia: Gdynia, Poland, 14–15 November 2002; pp. 81–95. [Google Scholar]
- Naus, K.; Makar, A. Dynamic Perspective Projection—Methods of Connecting the Reference Plane and the Projection Centre with the Moving Vessel. Geodezja Kartografia 2003, 52, 99–110. [Google Scholar]
- Naus, K.; Makar, A. Mathematical Model of the Dynamic Perspective Projection for Presentation of ENC. Revista Instituto Navegacion Espana 2003, 19, 76–87. [Google Scholar]
- Ray, C.; Goralski, R.; Claramunt, C.; Gold, C. Real-Time 3D Monitoring of Marine Navigation. In Information Fusion and Geographic Information Systems; Springer: Berlin, Germany, 2011. [Google Scholar] [CrossRef]
- Makar, A. Dynamic Tests of ASG-EUPOS Receiver in Hydrographic Application. In Proceedings of the 18th International Multidisciplinary Scientific GeoConference SGEM, Albena, Bulgaria, 30 June–9 July 2018; Volume 18, pp. 743–750. [Google Scholar] [CrossRef]
- Petrie, G.; Toth, C.K. Introduction to Laser Ranging, Profiling and Scanning. In Topographic LASER Ranging and Scanning: Principles and Processing; CRC Press Taylor Francis Group: Boca Raton, FL, USA, 2009. [Google Scholar]
- Makar, A.; Naus, K. Conception of spatial presentation of ENC. In Proceedings of the XIV International Scientific and Technical Conference “The Part of Navigation in Support of Human Activity on the Sea“; Institute of Navigation and Hydrography: Gdynia, Poland; Gdynia, Poland, 18–19 November 2004; pp. 130–141. [Google Scholar]
- Makar, A.; Naus, K. Possibilities Analysis of Using ENC for Creating Digital Sea Bottom Model. Sci. Bull. Tech. Univ. Radom Pol. Transp. 2004, 2, 622–631. [Google Scholar]
- Makar, A. Modeling of Sea Bottom Using Bézier Pieces. Hydroacoustics 2010, 13, 183–190. [Google Scholar]
- Makar, A. Modeling of Sea Bottom Using Uniform Rectangular Bézier Pieces. Hydroacoustics 2011, 14, 143–148. [Google Scholar]
- Makar, A.; Sassais, R. Methods to Generate Numerical Models of Terrain for Spatial ENC Presentation. Ann. Navig. 2011, 18, 69–81. [Google Scholar]
- Makar, A. The Sea Bottom Surface Described by Coons Pieces. Sci. J. Marit. Univ. Szczecin 2016, 45, 187–190. [Google Scholar] [CrossRef]
- International Hydrographic Organization. Regulations of the IHO for International (INT) Charts and Chart Specifications of the IHO, 4.8.0 ed.; International Hydrographic Organization: Monaco, Monaco, 2018. [Google Scholar]
- Council of Ministers of the Republic of Poland. Act of 4 March 2010 on the Infrastructures for Spatial Information, 2010; Council of Ministers of the Republic of Poland: Warsaw, Poland, 2010. (In Polish) [Google Scholar]
© 2020 by the authors. Licensee MDPI, Basel, Switzerland. This article is an open access article distributed under the terms and conditions of the Creative Commons Attribution (CC BY) license (http://creativecommons.org/licenses/by/4.0/).