
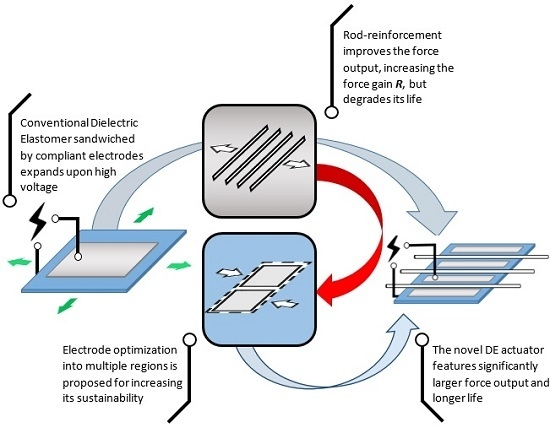
Novel Arrangements for High Performance and Durable Dielectric Elastomer Actuation


Abstract
:
1. Introduction
1.1. DEA Failure and Durability
- A1.
- Dielectric strength limitation
- A2.
- Mechanical strength limitation
- A3.
- Pull-in instability
1.2. Pre-Strain and Motion Constraining
- B1.
- Reducing the thickness of the film
- B2.
- Making the structure extend preferably in the actuation direction
- B3.
- Shifting the stress–strain curve of the elastomer
1.3. Motivation and Approach
2. Theory
3. Experimental Methodology
3.1. DEA Configurations
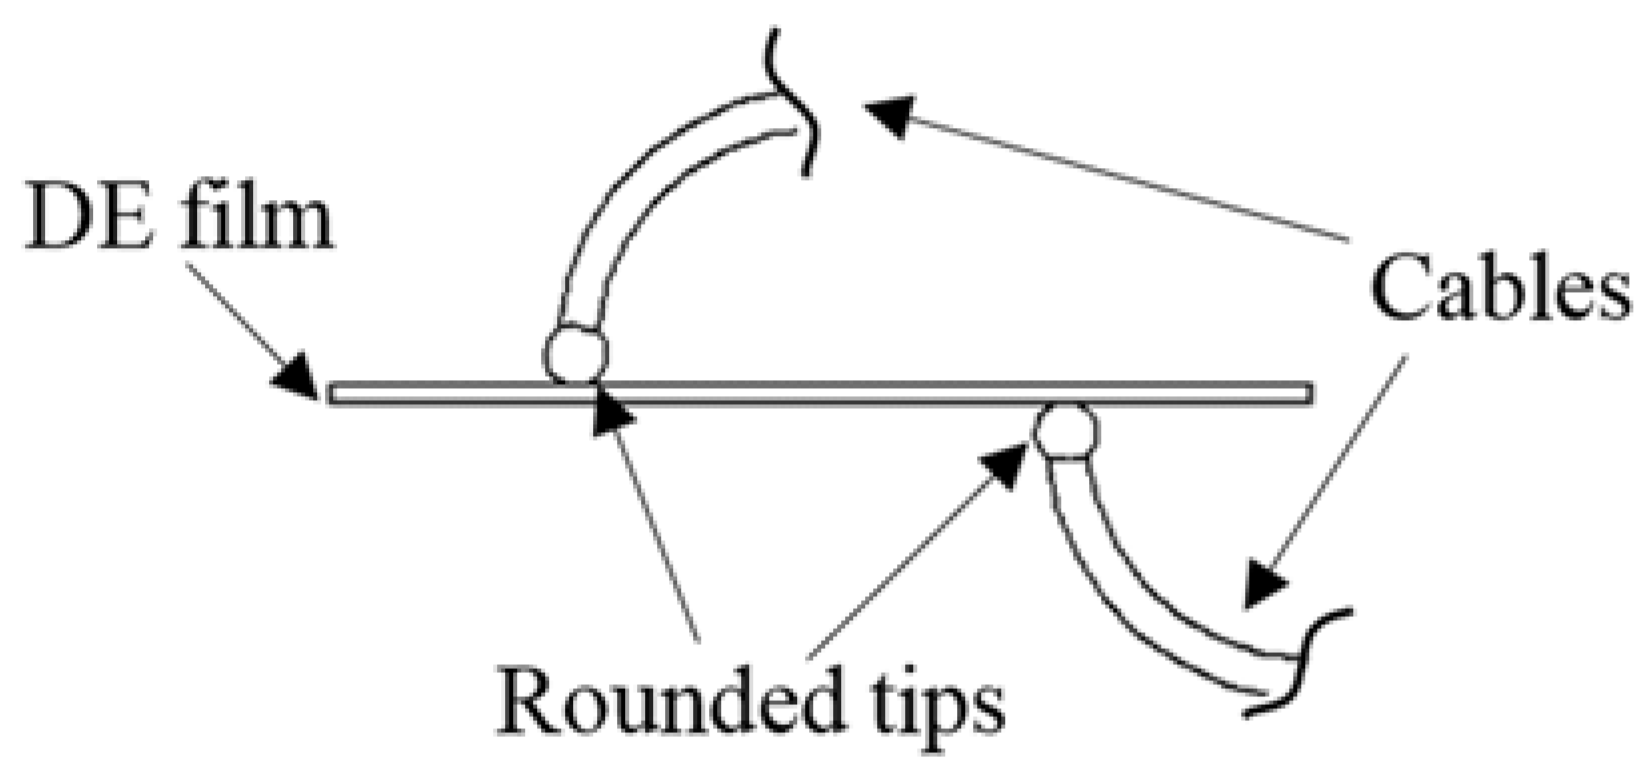
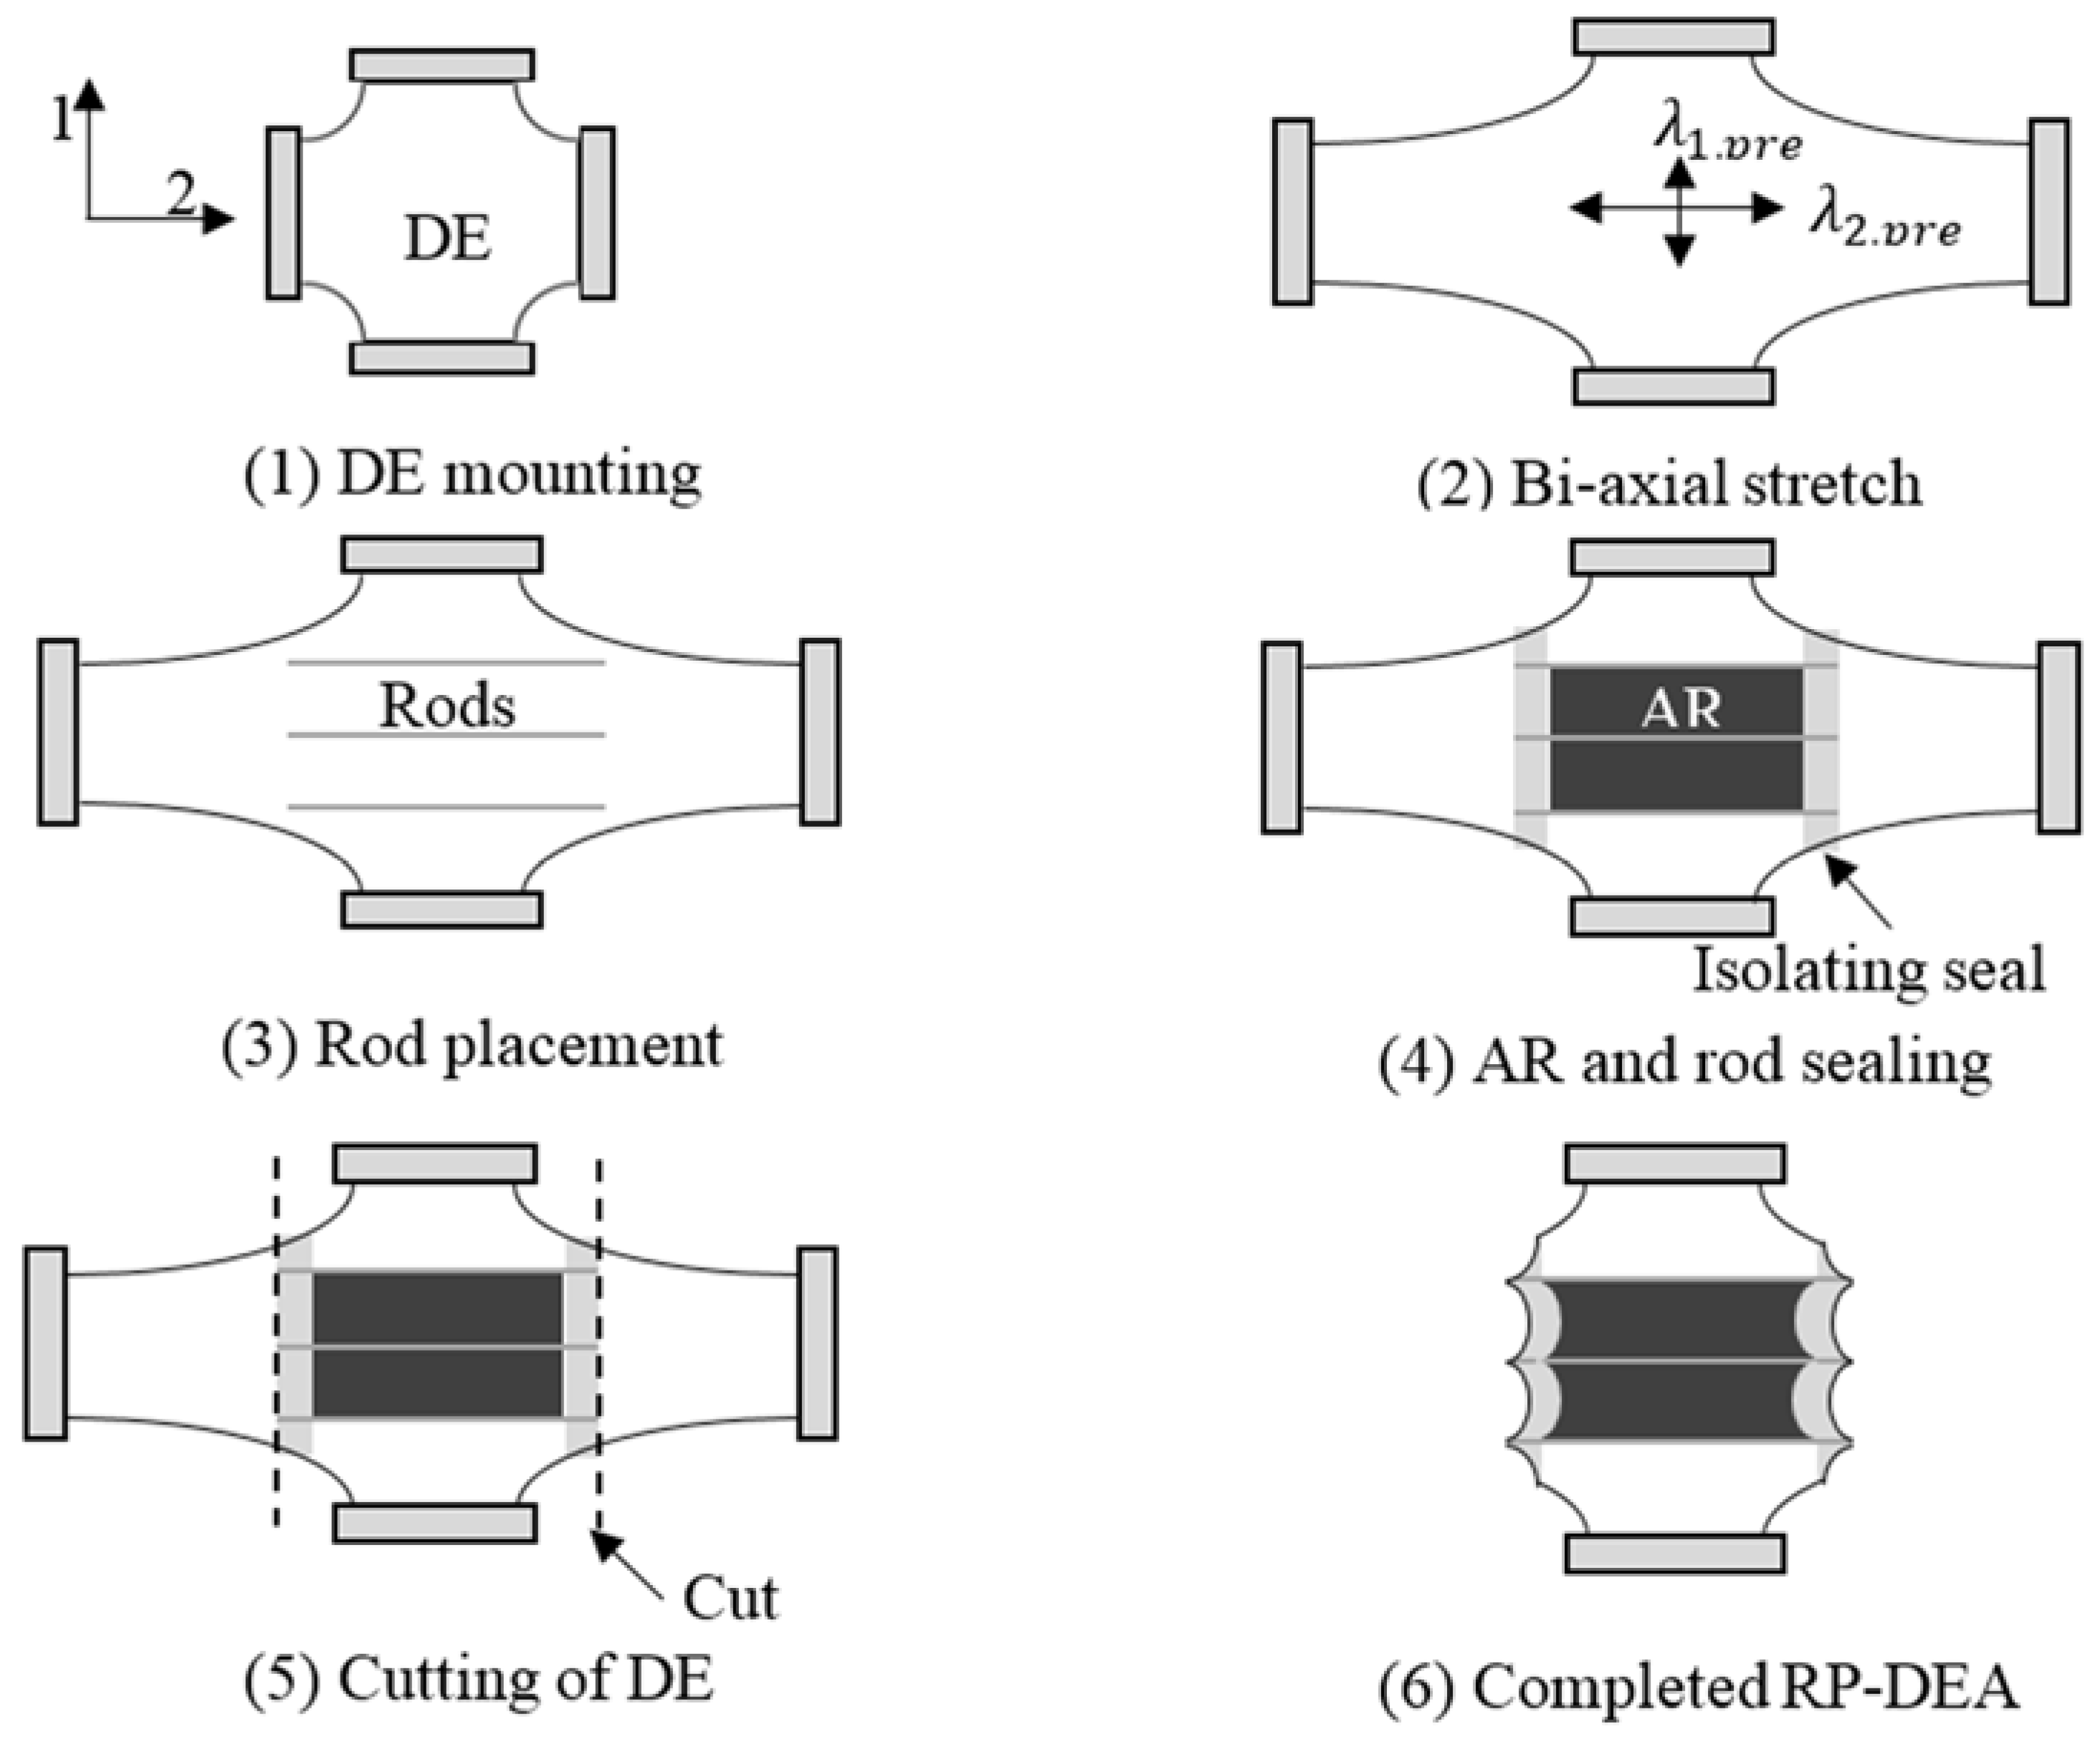
3.2. DEA Fabrication
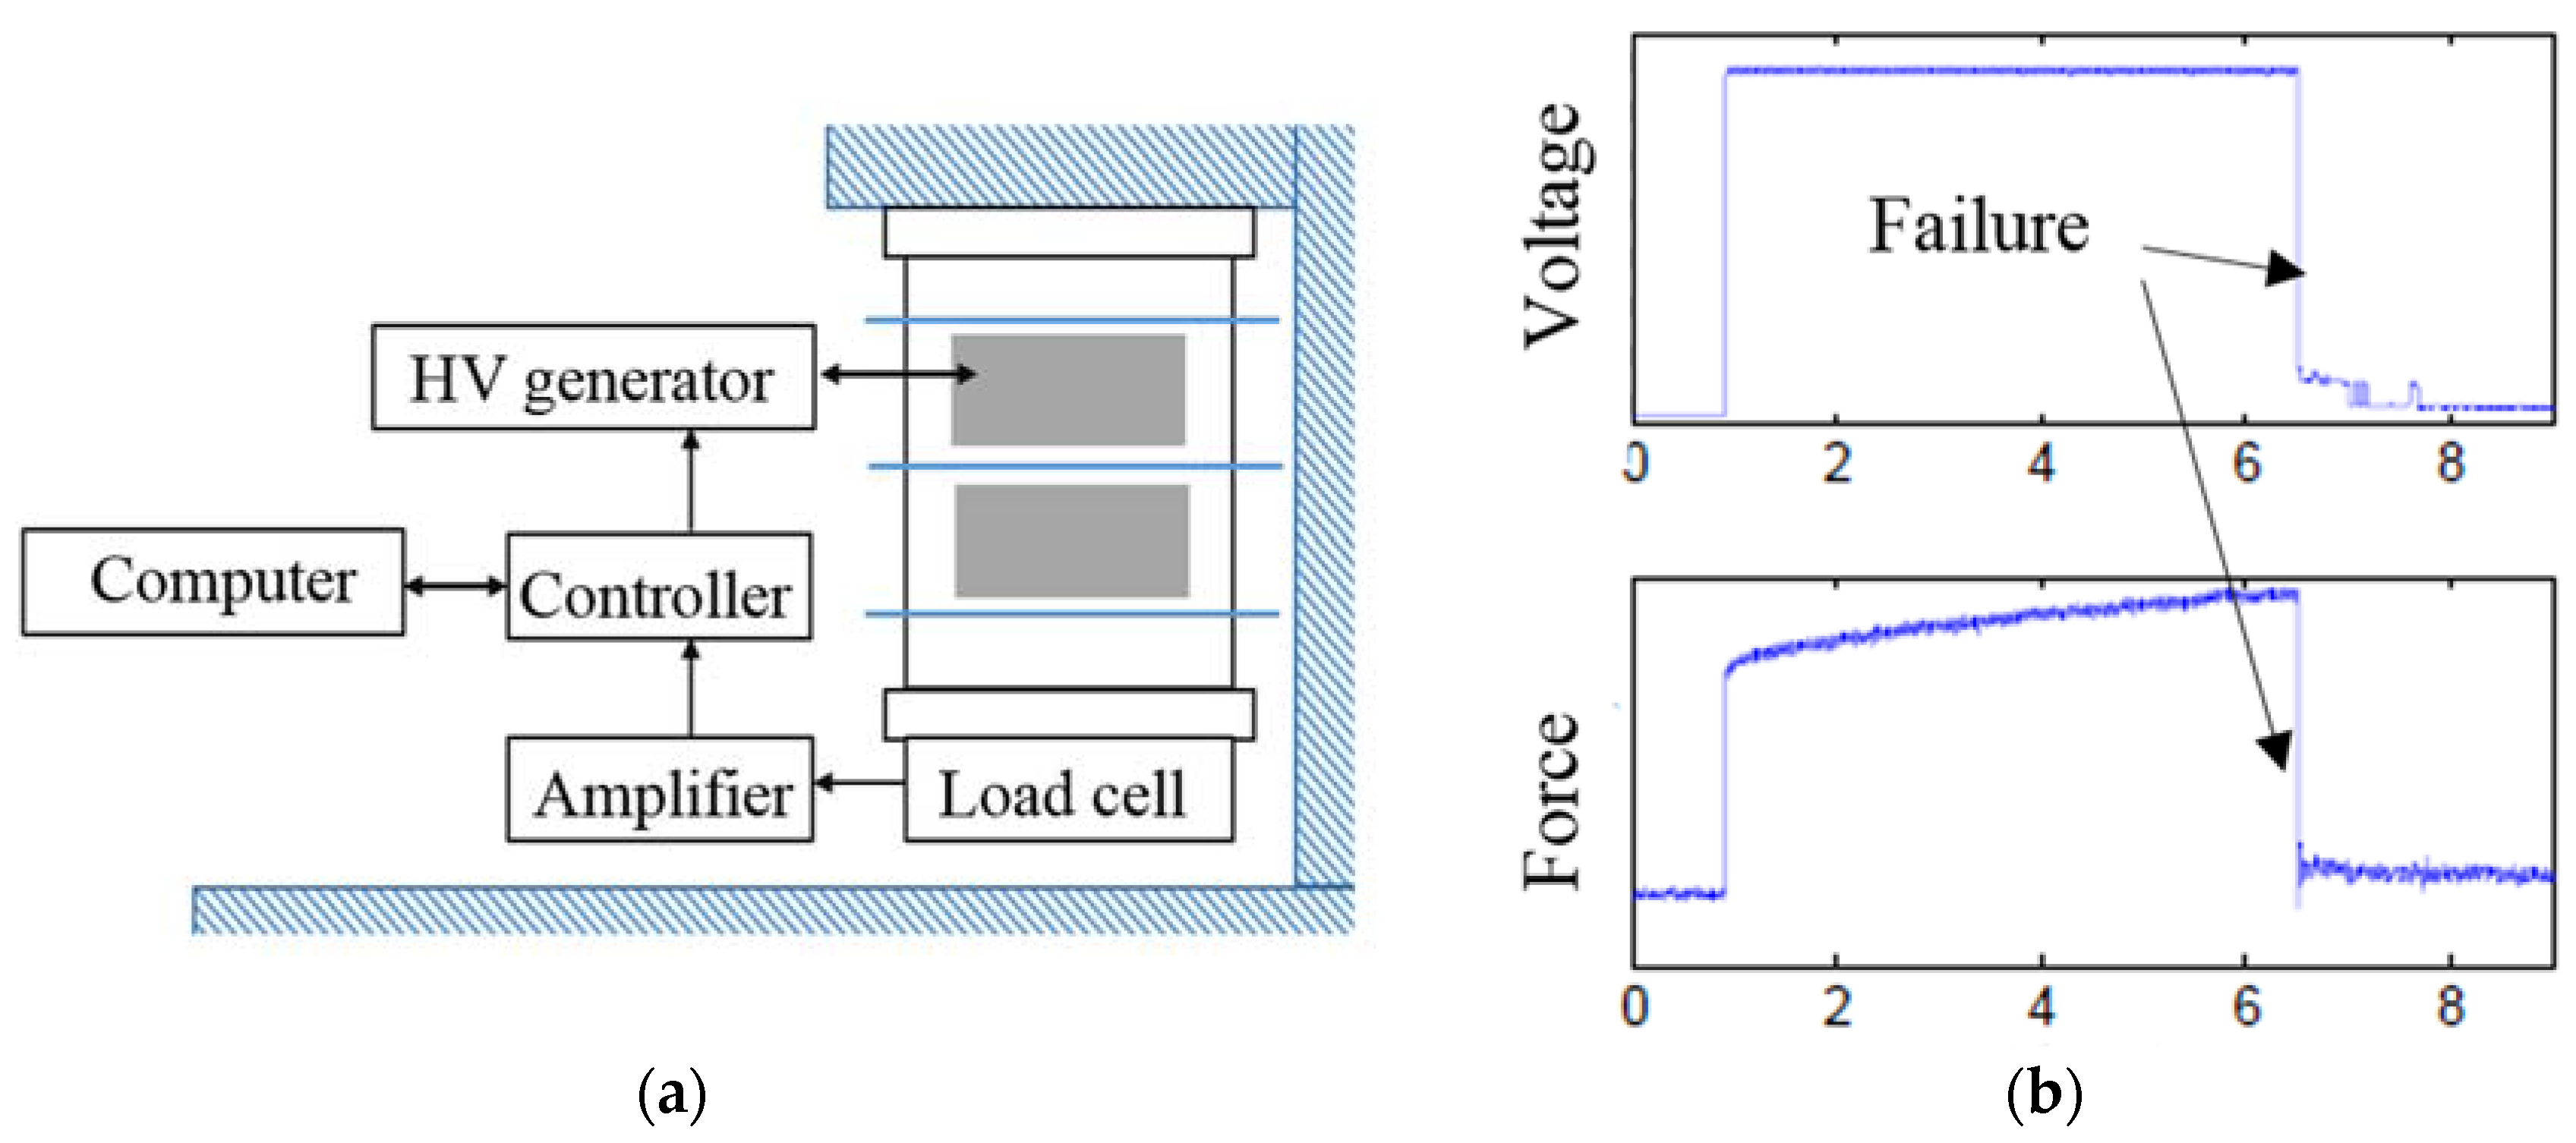
3.3. Experimental Setup and Measurements
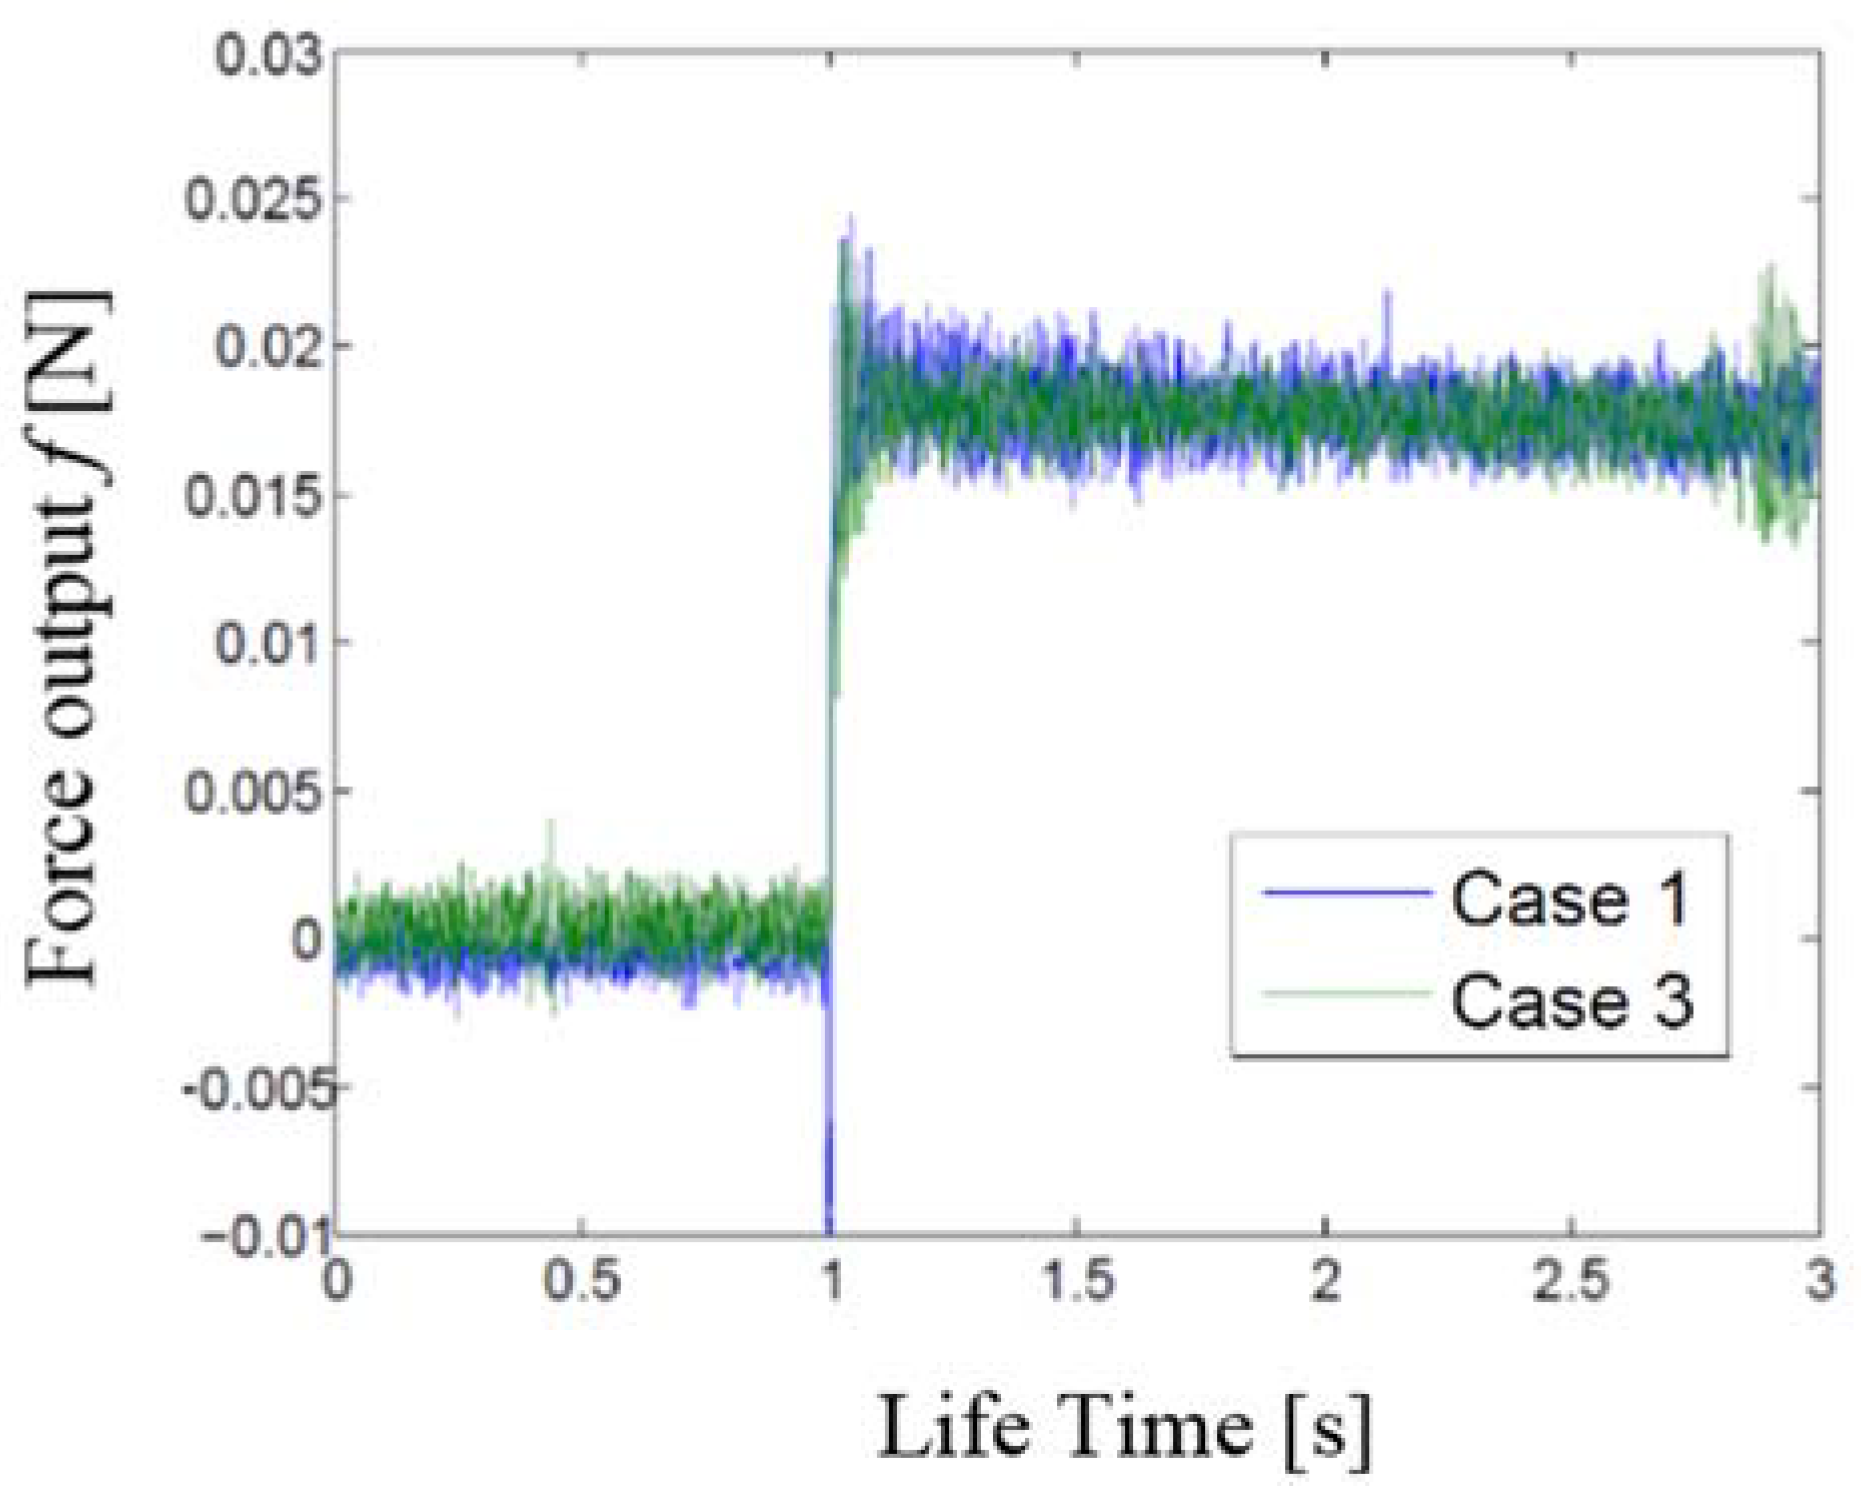
- Case 1.
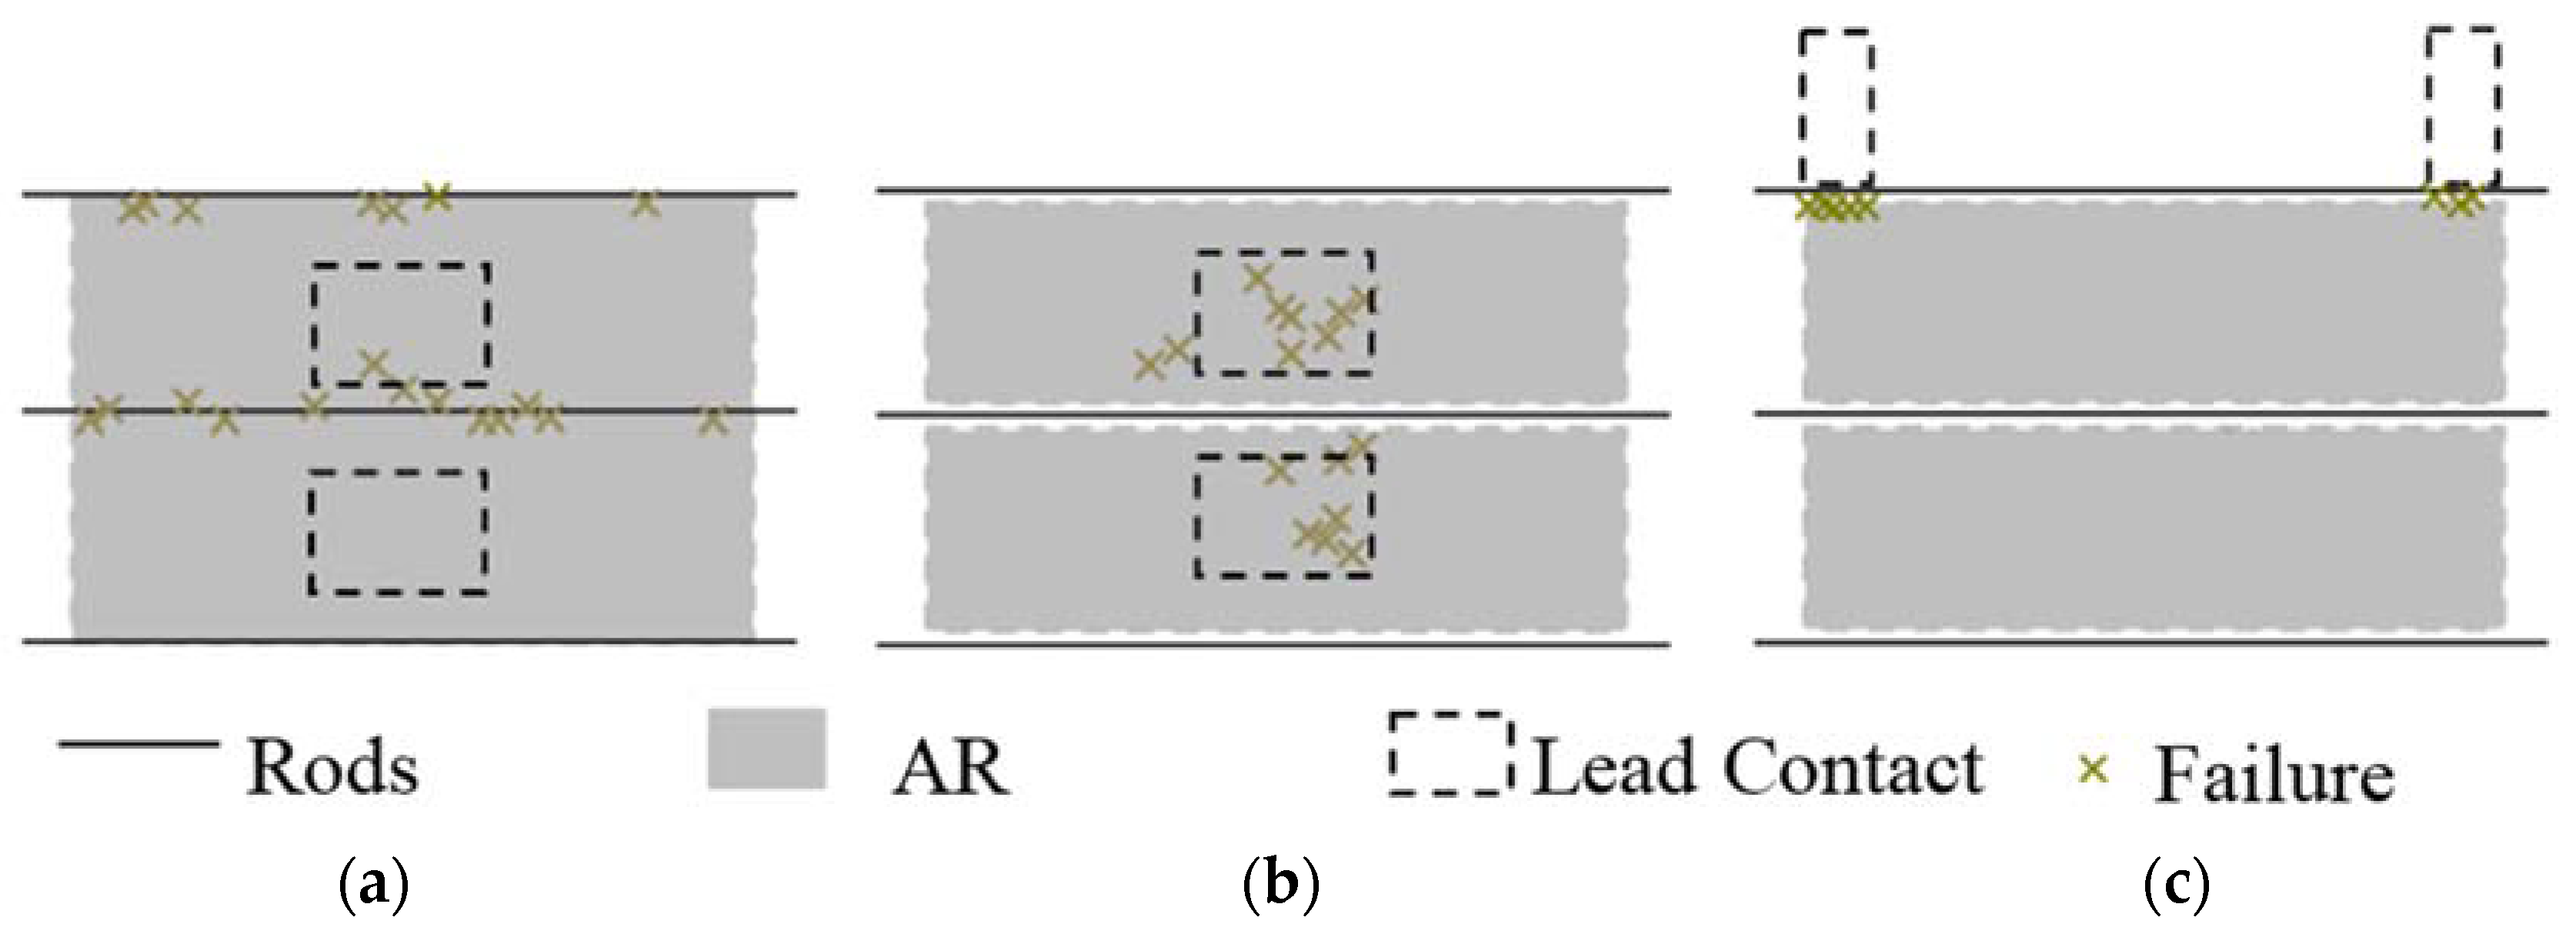
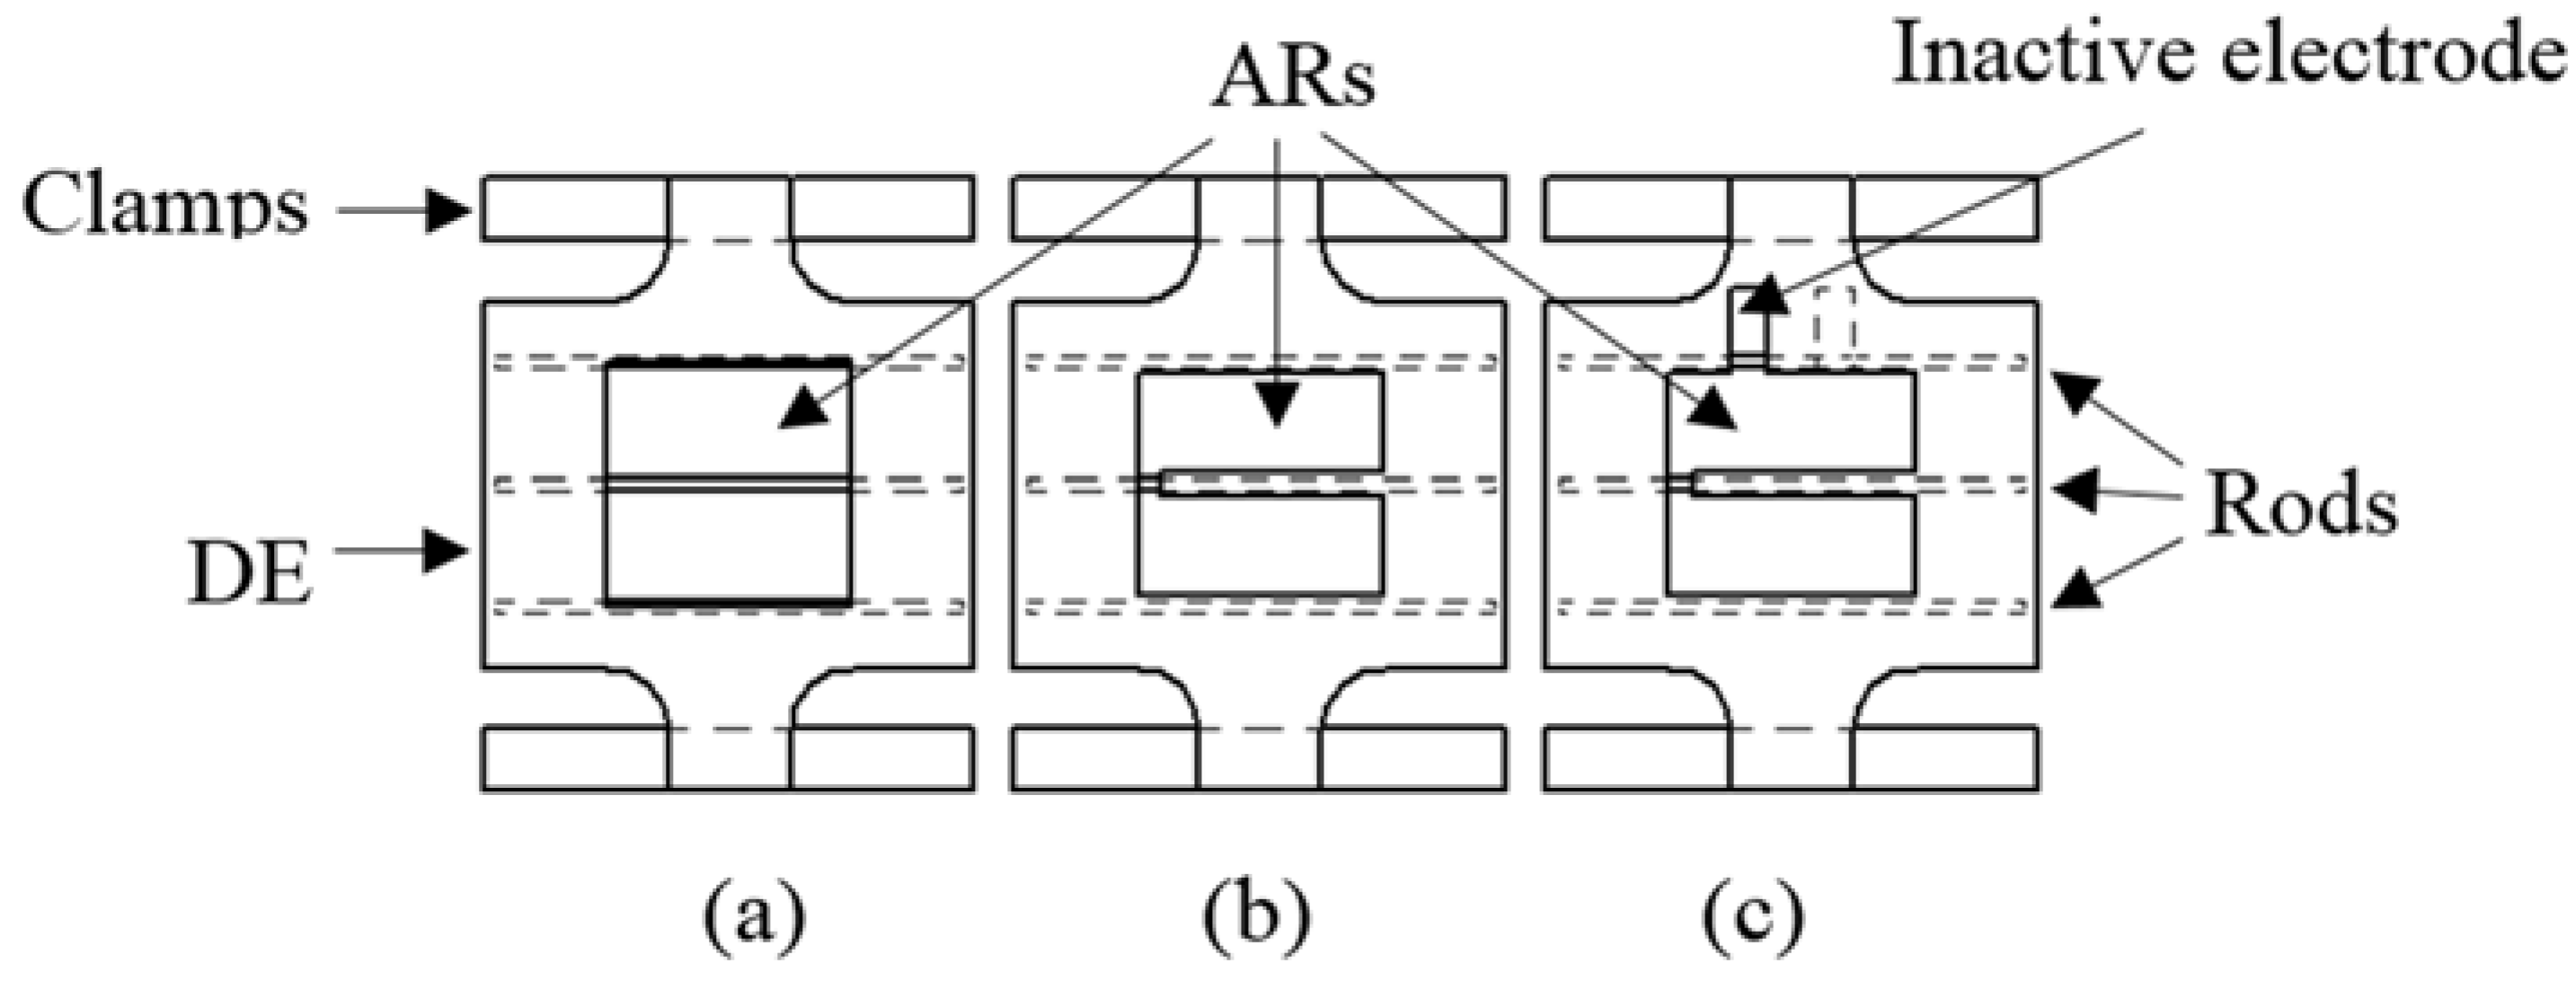
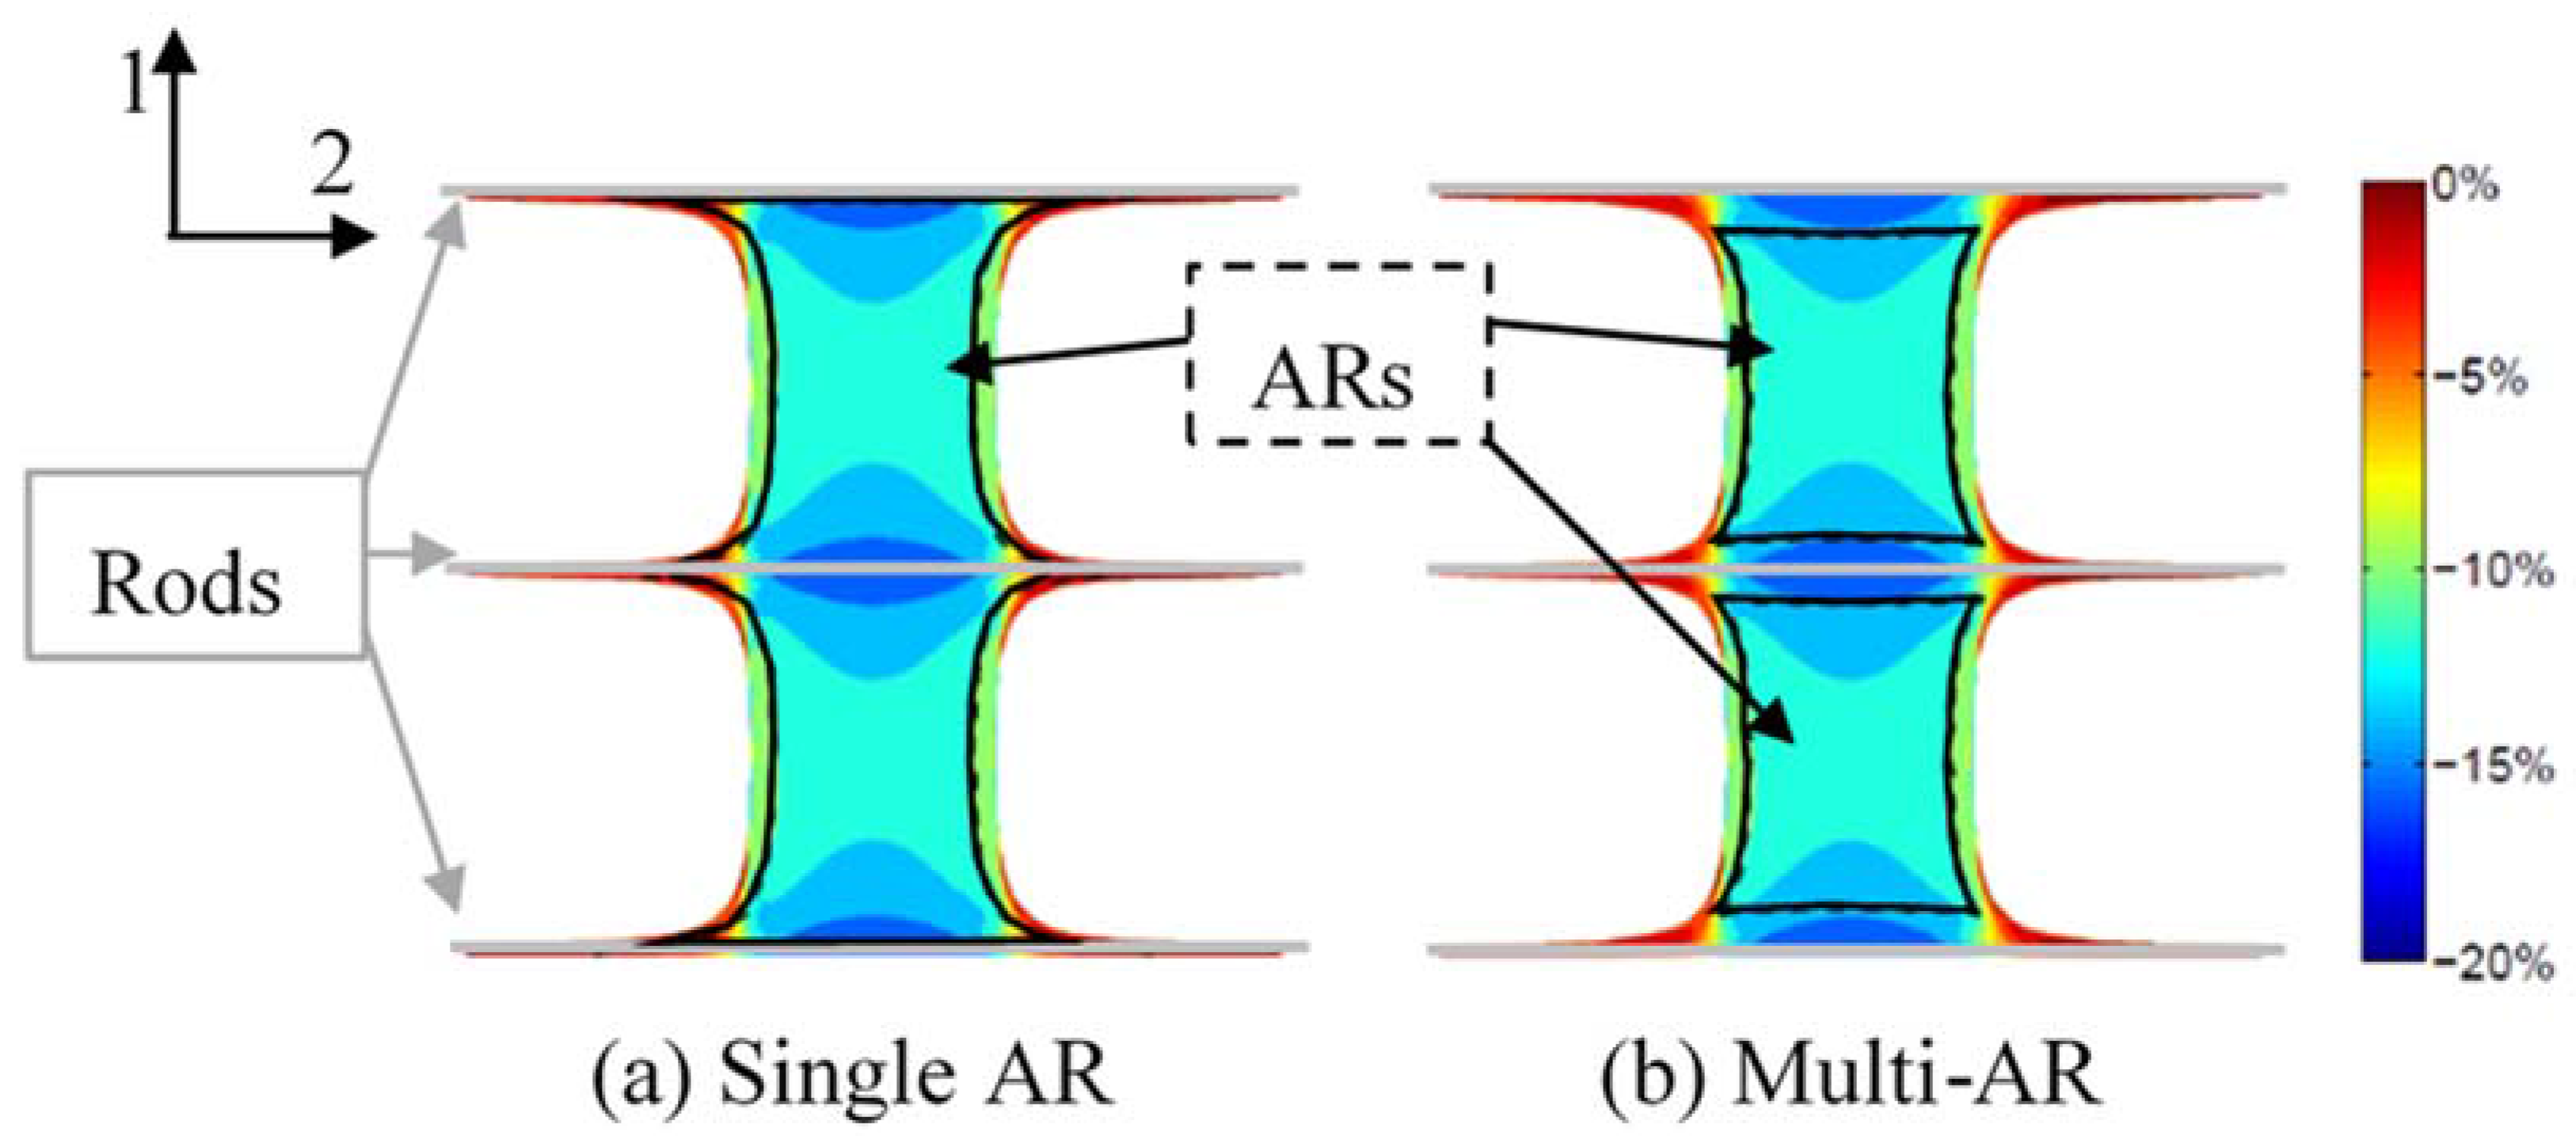
- The RP-DEA with a single AR as in Figure 2a, over 20 samples
- Case 2.
- The RP-DEA with multiple ARs, which exclude the regions associated with rods and have in-AR lead contact as in Figure 2b, over 20 samples
- Case 3.
- The RP-DEA with multiple ARs and an off-AR lead contact as shown in Figure 2c, over 10 samples
4. Results and Discussion
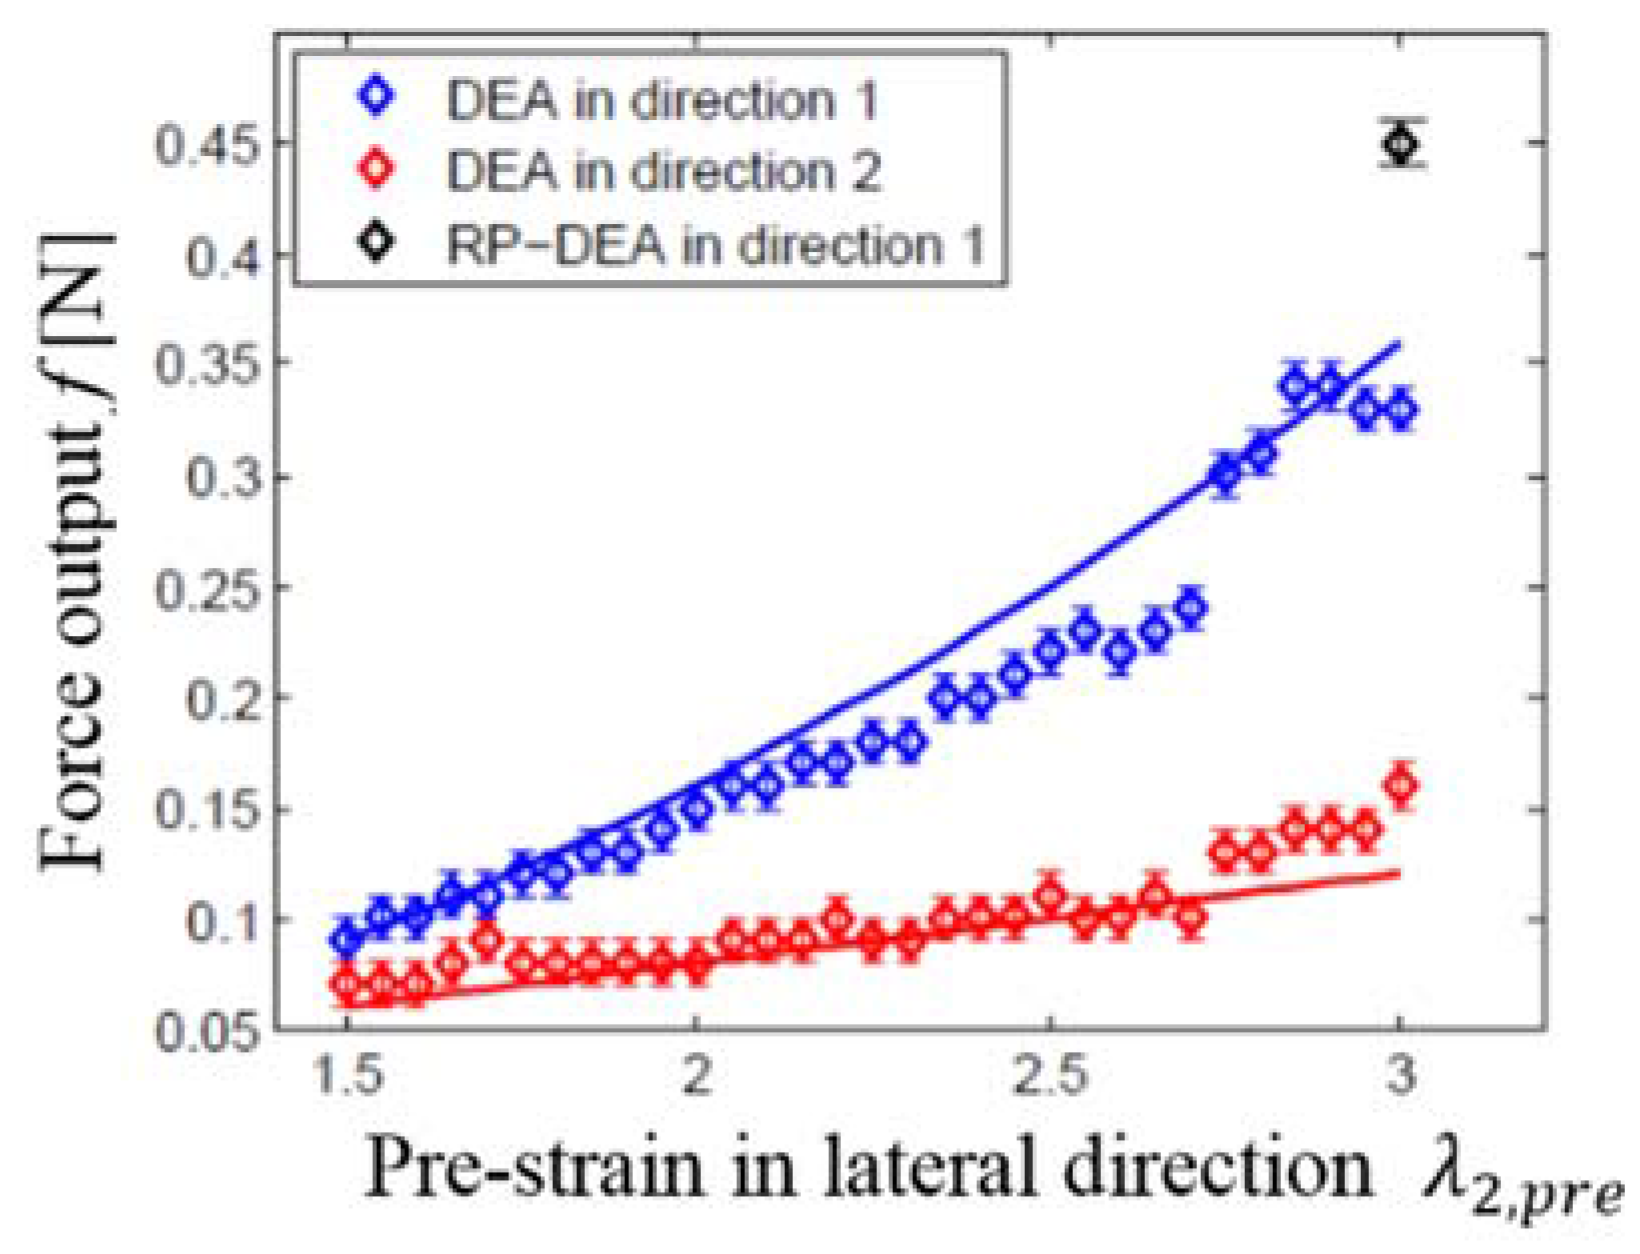
4.1. Force Measurement Results
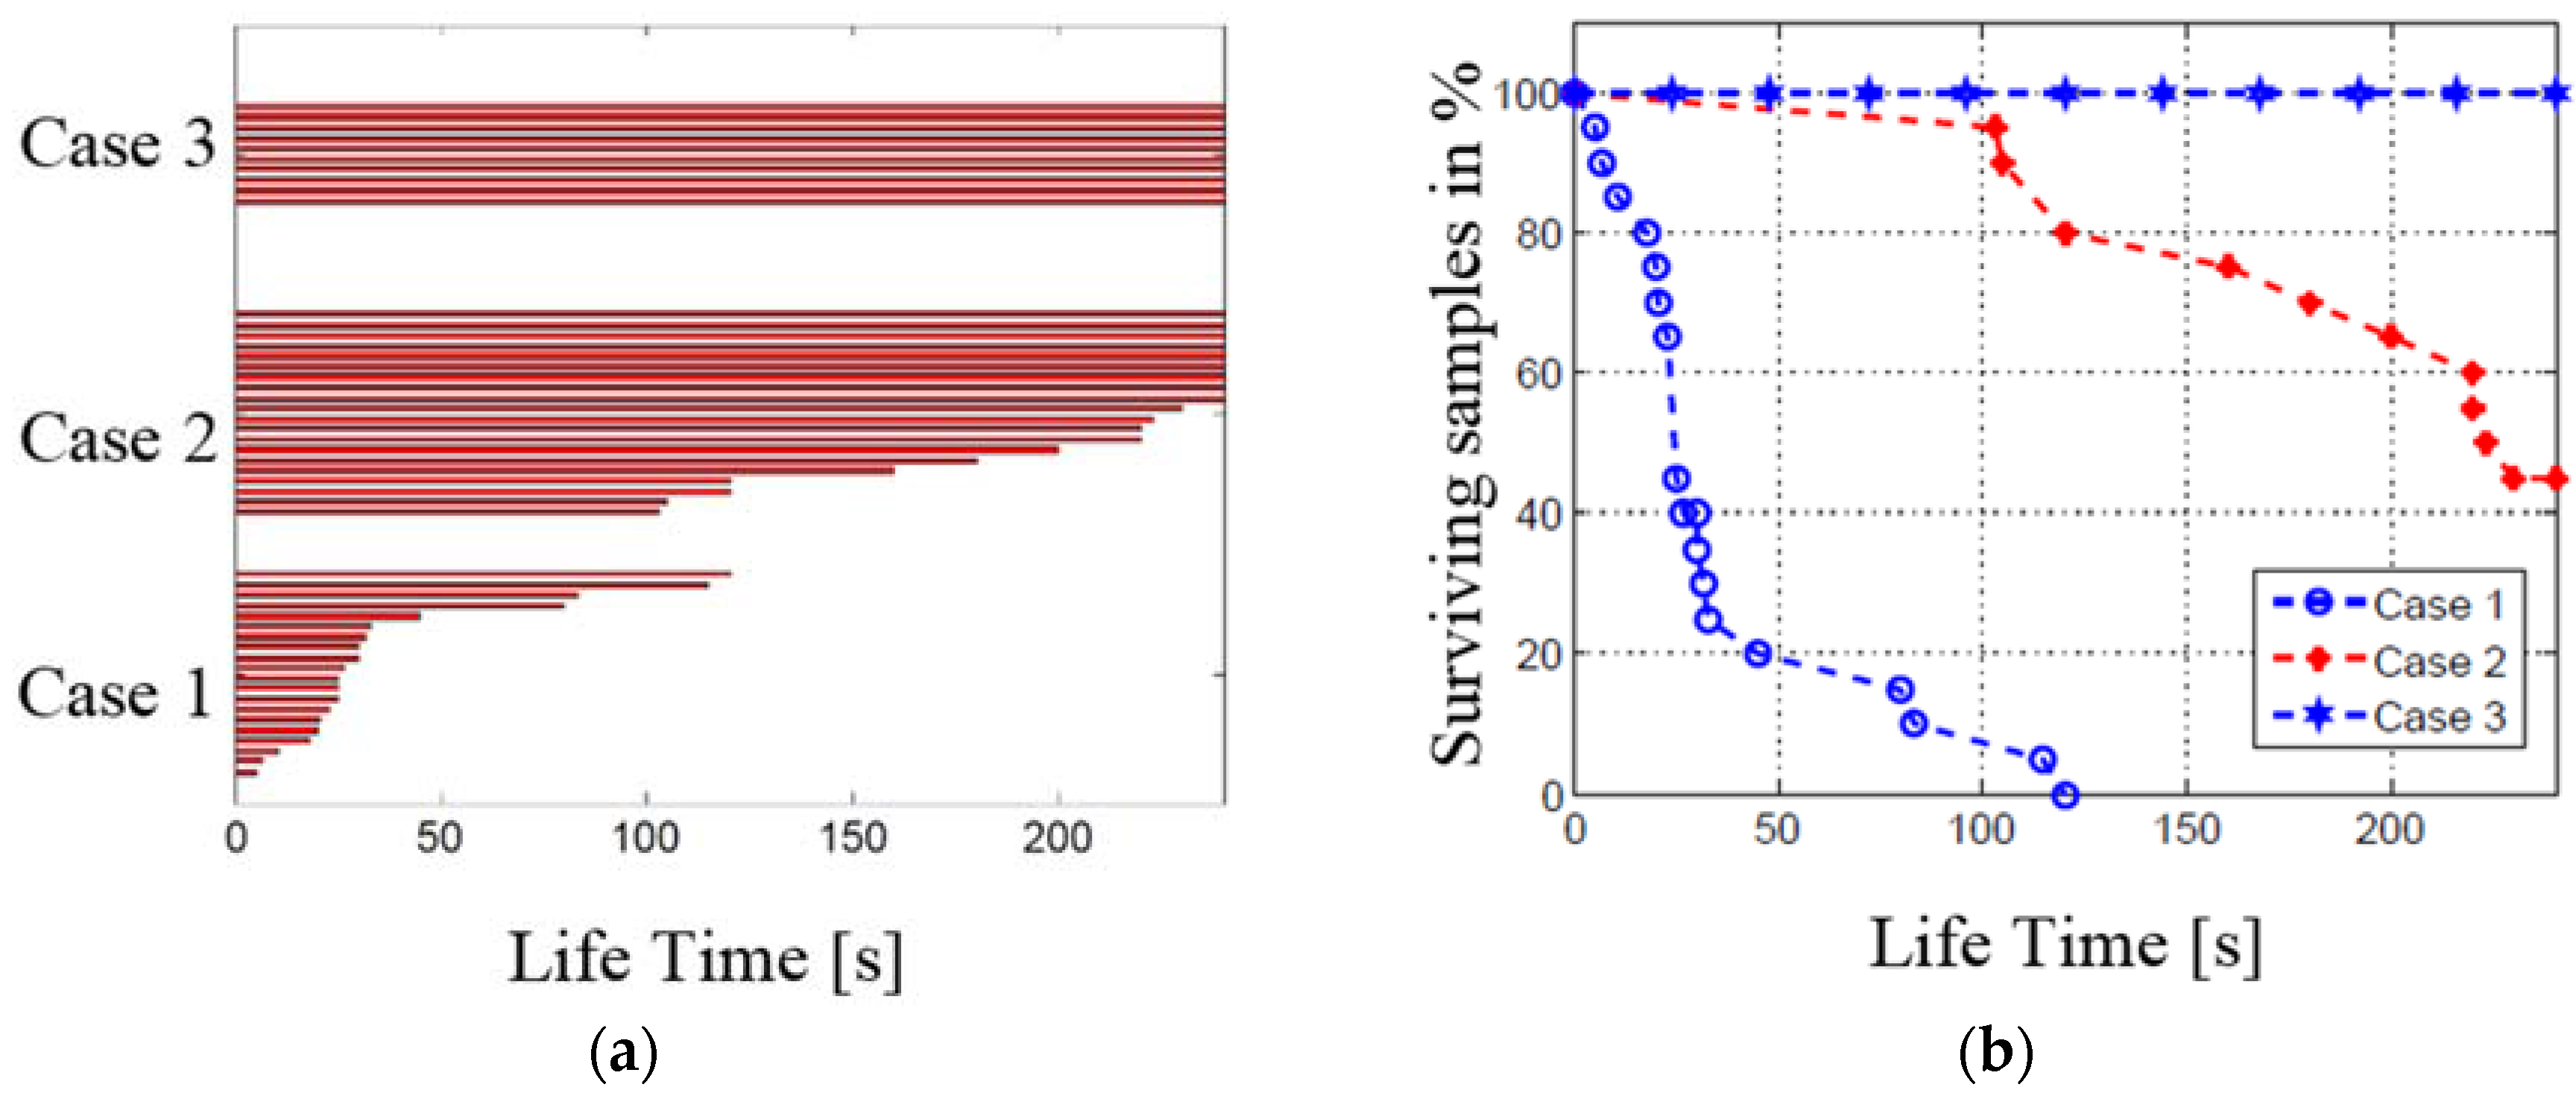
4.2. Lifetime Assessment Results
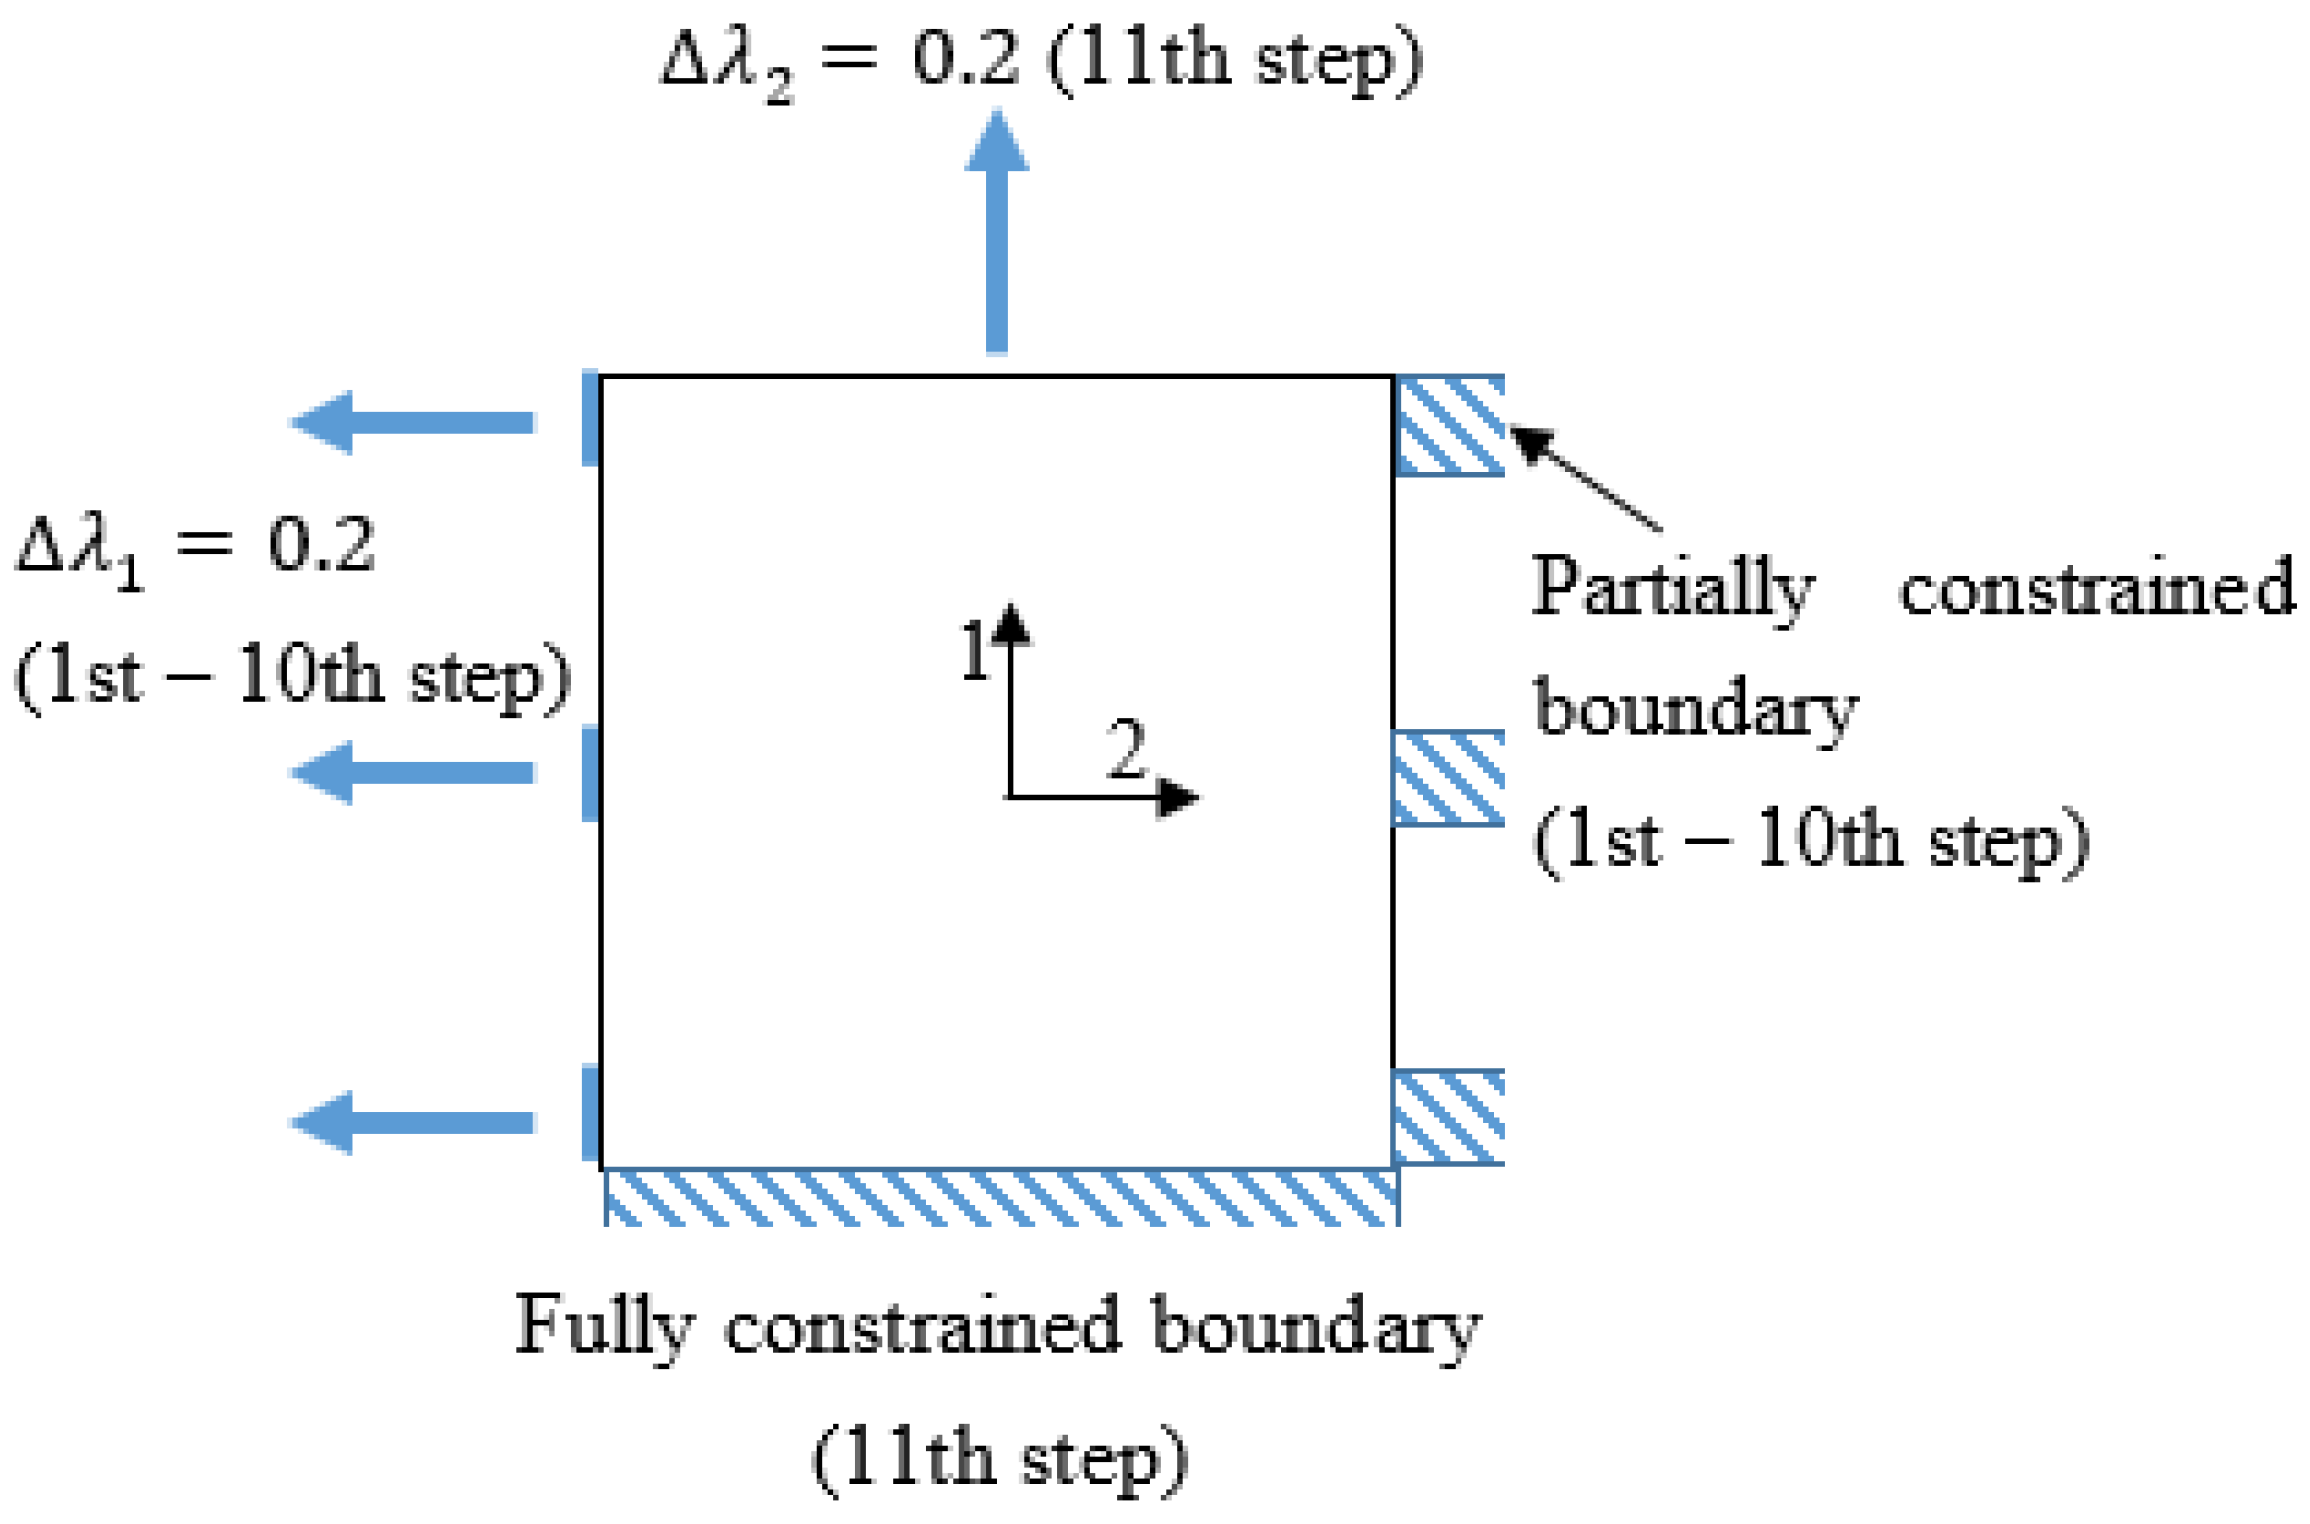
4.3. Finite Element (FE) Simulation Configuration
- C1.
- The solid is anisotropic due to bi-axial loading
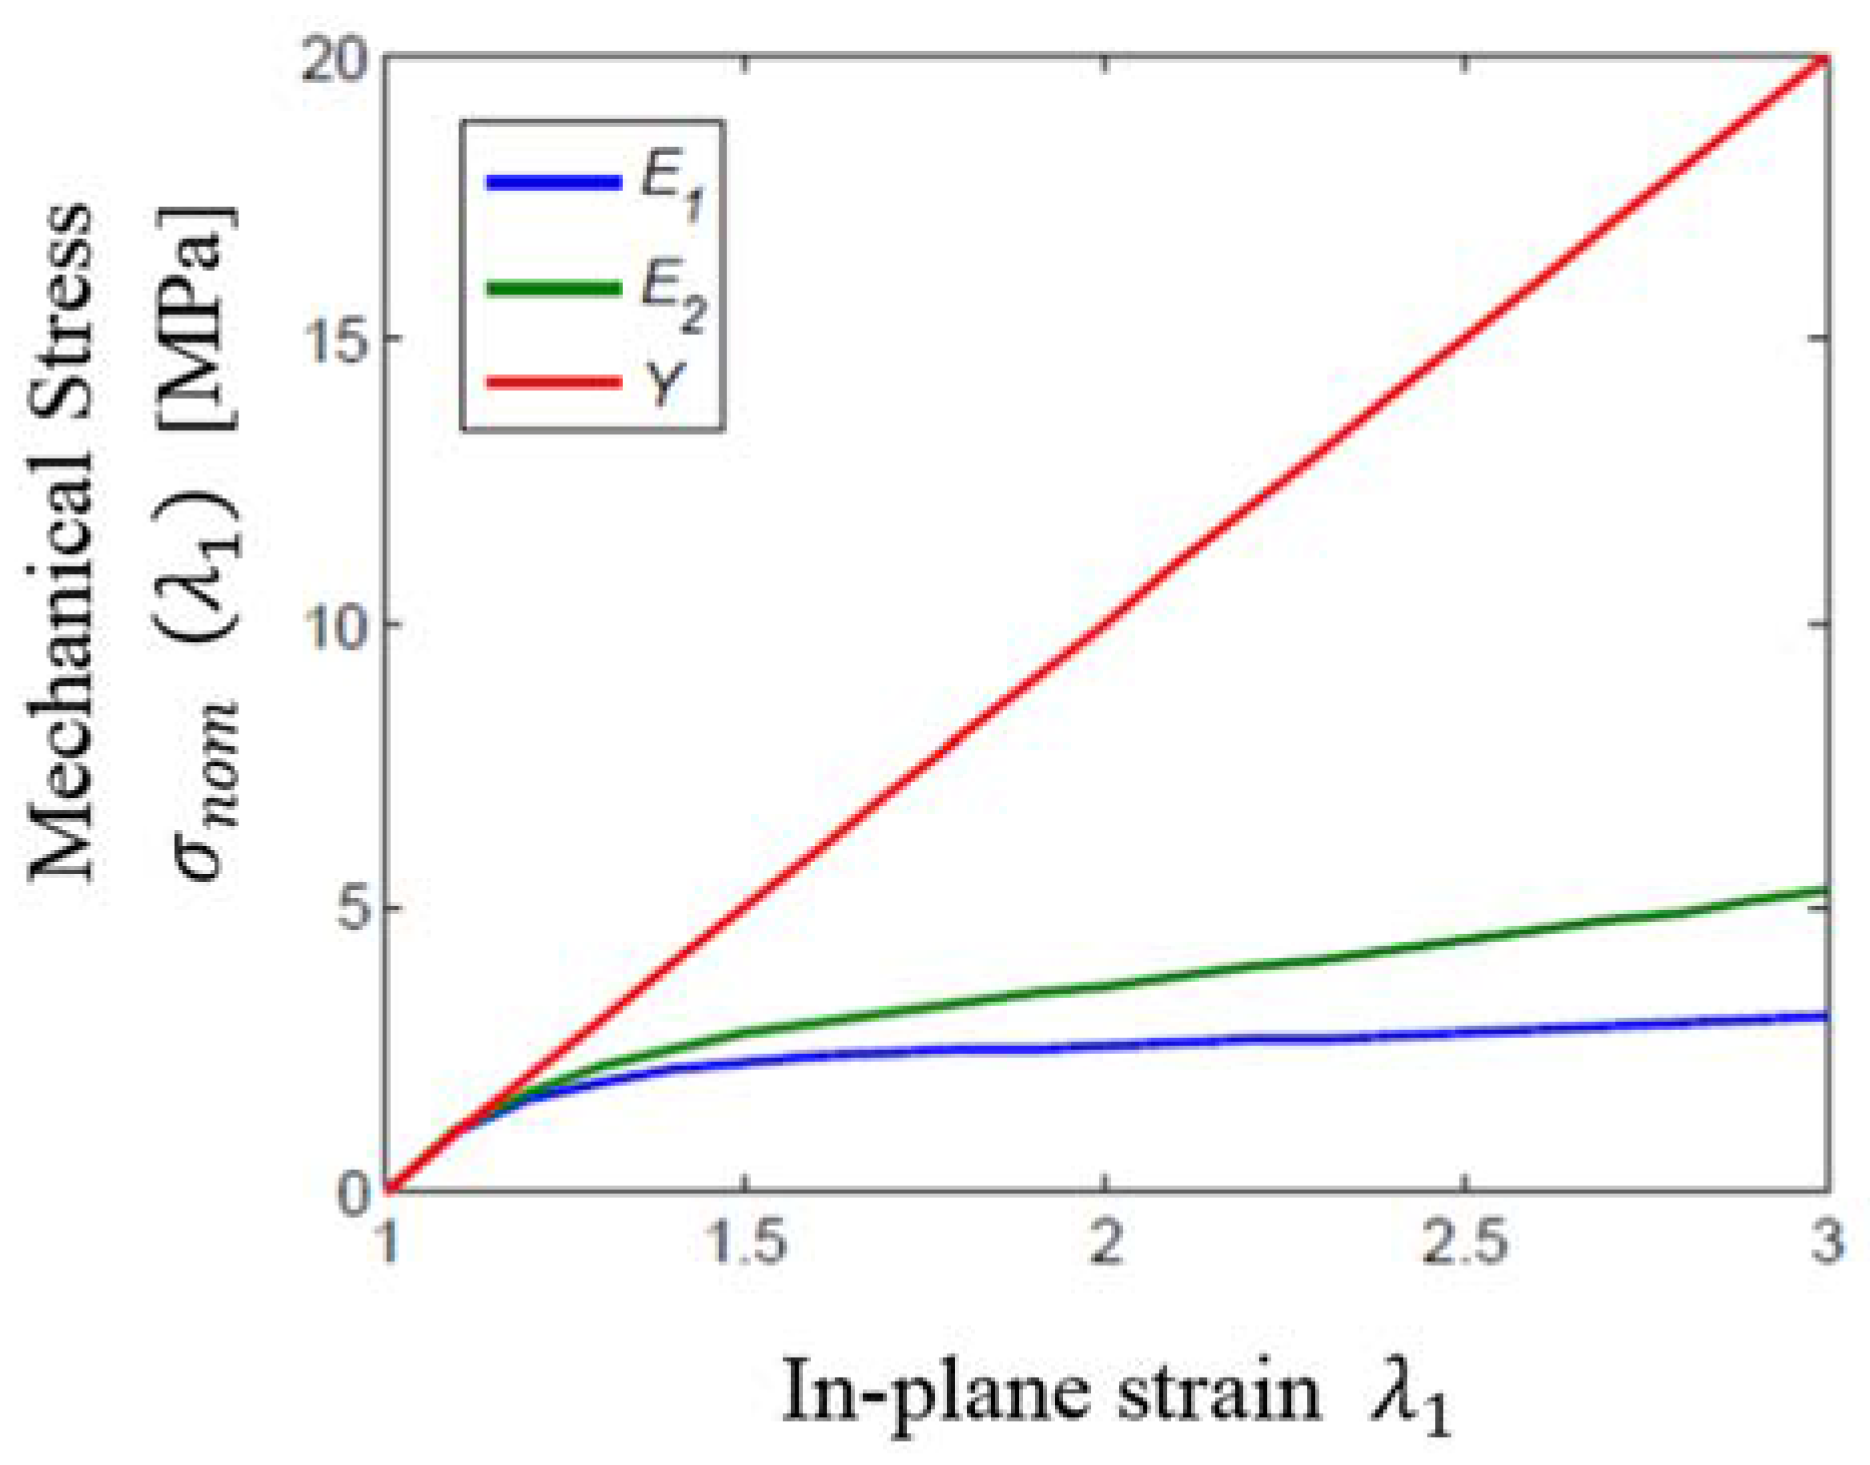
- C2.
- The elastic moduli, and , of the DE in the in-plane directions become functions of strains instead of remaining at the constant,
4.4. FE Simulation Results
- (i)
- Dielectric strength failure: The failure occurs because the resultant local electrical field exceeds the dielectric strength of the film. A 7.5 kV actuation voltage was found to be close to the breakdown voltage of VHB 4910 in agreement with Plante’s work at the same pre-strain condition (, [27]. Because the DE in the RP-DEA is deformed non-uniformly, the thinnest regions in the film or “weak” regions are close to the dielectric limit. All other relatively thicker regions have the smaller values of local pre-strain and higher breakdown voltages.
- (ii)
- Mechanical strength failure: For VHB 4910, it has been shown that the film can be stretched up to the pre-strain of 600% [27], which is well beyond the pre-strain configuration in this work. Therefore the mechanical strength is unlikely to be a source of failure.
- (iii)
- Pull-in instability failure: This failure mode of the RP-DEA is less likely because: (1) no wrinkling was observed prior to the failure; and (2) the RP-DEAs were pre-strained with high stretch rate (0.01 s−1). In this case, the viscosity “stiffens” the elastomer and makes it resistant against the pull-in instability [27].
5. Conclusions
Acknowledgments
Author Contributions
Conflicts of Interest
Abbreviations
| DE | Dielectric Elastomer |
| DEA | Dielectric Elastomer Actuator |
| RP-DEA | Rod Pre-strain Dielectric Elastomer Actuator |
| AR | Electro-Active Region |
References
- Carpi, F.; De Rossi, D.; Kornbluh, R.; Pelrine, R. Dielectric Elastomers as Electromechanical Transducers; Elsvier: Oxford, UK, 2008. [Google Scholar]
- Li, T.; Zou, Z.; Mao, G.; Qu, S. Electromechanical bistable behavior of a novel dielectric elastomer actuator. J. Appl. Mech. Trans. ASME 2014, 81. [Google Scholar] [CrossRef]
- Li, T.; Li, C.; Mao, G.; Zou, Z.; Xie, Y.; Qu, S. Novel dielectric elastomer structures with electromechanical instability. Proc. SPIE 2014, 9056. [Google Scholar] [CrossRef]
- Li, T.; Li, W.; Zou, Z.; Hong, Z.; Qu, S. Effects of stretching rate and size on the rupture of acrylic dielectric elastomer. Int. J. Appl. Mech. 2014, 6. [Google Scholar] [CrossRef]
- Mao, G.; Li, T.; Zou, Z.; Qu, S.; Shi, M. Prestretch effect on snap-through instability of short-length tubular elastomeric balloons under inflation. Int. J. Solids Struct. 2014, 51, 2109–2115. [Google Scholar] [CrossRef]
- Zou, Z.; Li, T.; Qu, S.; Yu, H. Active shape control and phase coexistence of dielectric elastomer membrane with patterned electrodes. J. Appl. Mech. Trans. ASME 2014, 81. [Google Scholar] [CrossRef]
- Li, T.; Keplinger, C.; Baumgartner, R.; Bauer, S.; Yang, W.; Suo, Z. Giant voltage-induced deformation in dielectric elastomers near the verge of snap-through instability. J. Mech. Phys. Solids 2013, 61, 611–628. [Google Scholar] [CrossRef]
- Li, T.; Qu, S.; Yang, W. Electromechanical and dynamic analyses of tunable dielectric elastomer resonator. Int. J. Solids Struct. 2012, 49, 3754–3761. [Google Scholar] [CrossRef]
- Li, T.; Qu, S.; Yang, W. Energy harvesting of dielectric elastomer generators concerning inhomogeneous fields and viscoelastic deformation. J. Appl. Phys. 2012, 112. [Google Scholar] [CrossRef]
- Li, T.; Qu, S.; Li, Z.; Tao, W.; Wang, M. Investigation of the mechanical properties of the ni-p-CNTs coated copper composite materials: Experiments and modeling. Mater. Sci. Eng. A 2009, 500, 182–187. [Google Scholar] [CrossRef]
- Shepherd, R.F.; Ilievski, F.; Choi, W.; Morin, S.A.; Stokes, A.A.; Mazzeo, A.D.; Chen, X.; Wang, M.; Whitesides, G.M. Multigait soft robot. Proc. Natl. Acad. Sci. USA 2011, 108, 20400–20403. [Google Scholar] [CrossRef] [PubMed]
- Morin, S.A.; Shepherd, R.F.; Kwok, S.W.; Stokes, A.A.; Nemiroski, A.; Whitesides, G.M. Camouflage and display for soft machines. Science 2012, 337, 828–832. [Google Scholar] [CrossRef] [PubMed]
- Stokes, A.; Shepherd, R.F.; Morin, S.A.; Ilievski, F.; Whitesides, G.M. A hybrid combining hard and soft robots. Soft Robot. 2013, 1, 70–74. [Google Scholar] [CrossRef]
- Martinez, R.V.; Branch, J.L.; Fish, C.R.; Jin, L.; Shepherd, R.F.; Nunes, R.M.D.; Suo, Z.; Whitesides, G.M. Robotic tentacles with three-dimensional mobility based on flexible elastomers. Adv. Mater. 2013, 25, 205–212. [Google Scholar] [CrossRef] [PubMed]
- Lin, H.T.; Leisk, G.G.; Trimmer, B. Goqbot: A caterpillar-inspired soft-bodied rolling robot. Bioinspir. Biomim. 2011, 6. [Google Scholar] [CrossRef] [PubMed]
- Ma, K.Y.; Chirarattananon, P.; Fuller, S.B.; Wood, R.J. Controlled flight of a biologically inspired, insect-scale robot. Science 2013, 340, 603–607. [Google Scholar] [CrossRef] [PubMed]
- Mannsfeld, S.C.B.; Tee, B.C.K.; Stoltenberg, R.M.; Chen, C.V.H.H.; Barman, S.; Muir, B.V.O.; Sokolov, A.N.; Reese, C.; Bao, Z. Highly sensitive flexible pressure sensors with microstructured rubber dielectric layers. Nat. Mater. 2010, 9, 859–864. [Google Scholar] [CrossRef] [PubMed]
- Jung, K.; Kim, K.J.; Choi, H.R. A self-sensing dielectric elastomer actuator. Sens. Actuators A Phys. 2008, 143, 343–351. [Google Scholar] [CrossRef]
- Anderson, I.A.; Gisby, T.A.; McKay, T.G.; O’Brien, B.M.; Calius, E.P. Multi-functional dielectric elastomer artificial muscles for soft and smart machines. J. Appl. Phys. 2012, 112. [Google Scholar] [CrossRef]
- Anderson, I.A.; Hale, T.; Gisby, T.; Inamura, T.; McKay, T.; O’Brien, B.; Walbran, S.; Calius, E.P. A thin membrane artificial muscle rotary motor. Appl. Phys. A Mater. Sci. Process. 2010, 98, 75–83. [Google Scholar] [CrossRef]
- Brochu, P.; Pei, Q. Advances in dielectric elastomers for actuators and artificial muscles. Macromol. Rapid Commun. 2010, 31, 10–36. [Google Scholar] [CrossRef] [PubMed]
- Liu, Y.; Liu, L.; Zhang, Z.; Jiao, Y.; Sun, S.; Leng, J. Analysis and manufacture of an energy harvester based on a mooney-rivlin-type dielectric elastomer. EPL 2010, 90. [Google Scholar] [CrossRef]
- Liu, L.; Luo, X.; Liu, Y.; Leng, J. Dielectric elastomer energy harvesting undergoing polarization saturation. Proc. SPIE 2012, 8340. [Google Scholar] [CrossRef]
- Pelrine, R.E.; Kornbluh, R.D.; Joseph, J.P. Electrostriction of polymer dielectrics with compliant electrodes as a means of actuation. Sens. Actuators A Phys. 1998, 64, 77–85. [Google Scholar] [CrossRef]
- Koh, S.J.A.; Li, T.; Zhou, J.; Zhao, X.; Hong, W.; Zhu, J.; Suo, Z. Mechanisms of large actuation strain in dielectric elastomers. J. Polym. Sci. Part B Polym. Phys. 2011, 49, 504–515. [Google Scholar] [CrossRef]
- Lucking Bigué, J.; Chouinard, P.; Proulx, S.; Miron, G.; Plante, J.S. Preliminary assessment of manufacturing impacts on dielectric elastomer actuators reliability. In Proceedings of the CANSMART 2009—International Workshop Smart Materials & Structures, Montreal, QC, Canada, 22–23 October 2009.
- Plante, J.S.; Dubowsky, S. Large-scale failure modes of dielectric elastomer actuators. Int. J. Solids Struct. 2006, 43, 7727–7751. [Google Scholar] [CrossRef]
- Yuan, W.; Lam, T.; Pei, Q. Durable dielectric elastomer actuators via self-clearable compliant electrode materials. In Proceedings of the Materials Research Society Symposium, Boston, MA, USA, 1–4 December 2008; pp. 183–190.
- Lu, T.; Huang, J.; Jordi, C.; Kovacs, G.; Huang, R.; Clarke, D.R.; Suo, Z. Dielectric elastomer actuators under equal-biaxial forces, uniaxial forces, and uniaxial constraint of stiff fibers. Soft Matter 2012, 8, 6167–6173. [Google Scholar] [CrossRef]
- Huang, J.; Lu, T.; Zhu, J.; Clarke, D.R.; Suo, Z. Large, uni-directional actuation in dielectric elastomers achieved by fiber stiffening. Appl. Phys. Lett. 2012, 100. [Google Scholar] [CrossRef]
- Ahmadi, S.; Gooyers, M.; Soleimani, M.; Menon, C. Fabrication and electromechanical examination of a spherical dielectric elastomer actuator. Smart Mater. Struct. 2013, 22. [Google Scholar] [CrossRef]
- Heydt, R.; Pelrine, R.; Joseph, J.; Eckerle, J.; Kornbluh, R. Acoustical performance of an electrostrictive polymer film loudspeaker. J. Acoust. Soc. Am. 2000, 107, 833–839. [Google Scholar] [CrossRef] [PubMed]
- Cakmak, E.; Fang, X.; Yildiz, O.; Bradford, P.D.; Ghosh, T.K. Carbon nanotube sheet electrodes for anisotropic actuation of dielectric elastomers. Carbon 2015, 89, 113–120. [Google Scholar] [CrossRef]
- Subramani, K.B.; Cakmak, E.; Spontak, R.J.; Ghosh, T.K. Enhanced electroactive response of unidirectional elastomeric composites with high-dielectric-constant fibers. Adv. Mater. 2014, 26, 2949–2953. [Google Scholar] [CrossRef] [PubMed]
- Bolzmacher, C.; Biggs, J.; Srinivasan, M. Flexible dielectric elastomer actuators for wearable human-machine interfaces. Proc. SPIE 2006, 6168. [Google Scholar] [CrossRef]
- Goulbourne, N.; Mockensturm, E.; Frecker, M. A nonlinear model for dielectric elastomer membranes. J. Appl. Mech. Trans. ASME 2005, 72, 899–906. [Google Scholar] [CrossRef]
- Carpi, F.; Gei, M. Predictive stress-stretch models of elastomers up to the characteristic flex. Smart Mater. Struct. 2013, 22. [Google Scholar] [CrossRef]


© 2016 by the authors; licensee MDPI, Basel, Switzerland. This article is an open access article distributed under the terms and conditions of the Creative Commons Attribution (CC-BY) license (http://creativecommons.org/licenses/by/4.0/).
Share and Cite
Zhang, R.; Huang, X.; Li, T.; Iravani, P.; Keogh, P. Novel Arrangements for High Performance and Durable Dielectric Elastomer Actuation. Actuators 2016, 5, 20. https://doi.org/10.3390/act5030020
Zhang R, Huang X, Li T, Iravani P, Keogh P. Novel Arrangements for High Performance and Durable Dielectric Elastomer Actuation. Actuators. 2016; 5(3):20. https://doi.org/10.3390/act5030020
Chicago/Turabian StyleZhang, Runan, Xiaoqiang Huang, Tiefeng Li, Pejman Iravani, and Patrick Keogh. 2016. "Novel Arrangements for High Performance and Durable Dielectric Elastomer Actuation" Actuators 5, no. 3: 20. https://doi.org/10.3390/act5030020
APA StyleZhang, R., Huang, X., Li, T., Iravani, P., & Keogh, P. (2016). Novel Arrangements for High Performance and Durable Dielectric Elastomer Actuation. Actuators, 5(3), 20. https://doi.org/10.3390/act5030020