Abstract
To improve the starting performance of the P2.5 plug-in hybrid electric vehicles with a wet dual-clutch transmission, an adaptive starting control strategy is presented in this paper, which controls the two clutches simultaneously involved in the starting process. A fuzzy controller is designed to identify the starting intention and determine the target torque under different working conditions. The starting process is divided into five periods, and linear quadratic optimal control is adopted to obtain the reference torque trajectory for the third period, while the others are determined by adaptive control by changing the adjustment coefficients according to the starting conditions. The combined pressure feedback controller based on the PID algorithm is proposed to control the wet clutch torque to follow the reference torque trajectory. The MATLAB/Simulink software platform is used to simulate the control strategy. The results show that the proposed strategy can shorten the starting time and reduce the level of jerk. Moreover, with the first-gear starting, the friction work of the whole process and clutch C1 is, respectively, reduced by 1.68% and 4.62% for slowly starting and 23.37% and 23.6% for quickly starting, which can significantly prolong the service lifetime of the clutch compared with the traditional single-clutch starting strategy.
1. Introduction
The P2.5 plug-in hybrid electric vehicles (P2.5-PHEVs) equipped with a wet dual-clutch transmission require different driving torques under different starting conditions, which can easily lead to driving impacts and energy wastage with improper control. Meanwhile, the starting process of the vehicle is an important part of the dynamic operation of the whole vehicle, which is complex for DCT control due to complex working conditions [1]. Improper control can easily lead to irregular phenomena [2], such as shift shocks [3], engine vibrations [4] and noise [5] during the starting process. In severe cases, it may even cause the engine to stall, which directly affects the passengers’ comfort [6]. The starting process also affects the performance of the whole vehicle such as energy loss [7,8] and pollution emission [9]. Therefore, starting control has always been one of the pivotal points and difficulties in the process of vehicle control strategy development.
The control objective of the starting process is to minimize the friction work loss generated by the clutch on the premise of ensuring the smooth engagement of the clutch. In some studies, the friction work and the level of jerk are considered comprehensively as an evaluation index of the performance functions. By formulating an appropriate control strategy, the performance function can achieve an extreme value [10]. Zhao et al. [11,12] proposed an optimal control based on the minimum principle for the five-speed dry-dual-clutch transmission during the starting process. The core was to make the control parameters follow the target trajectory, which had good performance theoretically [13]. The simulation and hardware-in-the-loop (HIL) test results showed that the proposed methods were useful. Feng et al. [14] presented a dual-clutch transmission start control strategy based on pseudo-spectral optimization and data-driven control, which could adapt to the uncertainty and nonlinear characteristics of the system.
For the P2.5-PHEVs equipped with a wet dual-clutch transmission, the motor is positioned between the clutch and the transmission, and the motor is directly coupled to the inside of the transmission [15]. The engine torque is transmitted to the wheels through the transmission mechanism by controlling the oil pressure in the hydraulic pipeline of the wet dual clutch when the vehicle starts [16,17]. The goal of the wet clutch control is primarily to control the speed of the combined oil pressure, which directly affects the transmitted torque, as it not only reflects the driving intention under different demands but also ensures the stable and reliable starting of the vehicle. Hao et al. [18] presented the torque characteristic adaptive method by a combination of the estimator with the improved least square method, which reduced the sliding friction work and clutch judder. Yang et al. [19] suggested a state-dependent autoregressive with exogenous variables model to describe the dynamic characteristics of the starting process of DCT vehicles and it was simulated, realistically, by a real vehicle test. Zhao et al. [20] developed a data-driven control method for the DCT starting process based on an adaptive neural fuzzy inference system to achieve the clutch torque optimal control for different launching intentions. There are also many analyses of the influence factors of the coupling characteristics and the transmitted torque from the perspective of the structural mechanism of the wet clutch [21,22]. Oh et al. [23] built a robust observer to estimate the transmitted torque on individual clutch online and verified the validity of the estimator through relevant experiments on an actual vehicle. Wang et al. [24] analyzed the self-excited vibration and stick-slip phenomenon during the wet clutch engagement and found that the relative speed threshold value, the shaft stiffness, system damping, and inertia of each component would affect the stick-slip phenomenon during the vehicle starting. Kim et al. [25] established an observer using multiple adaptation laws to estimate the clutch parameters that cannot be measured, such as the clutch friction coefficient and transfer torque. Simulations and experiments in various driving scenarios showed good performance.
The wet dual-clutch shift control based on optimal control is a research hotspot focused on precise control of the two clutches [26,27]. Better shift performance is obtained by controlling the clutch torque to accurately follow the clutch optimal engagement curve obtained. Deng et al. [28] analyzed the thermal equilibrium of clutches and proposed the combined starting control strategy for dual clutches to reduce temperature rise of clutch. Li et al. [29] proposed a finite-time linear quadratic regulator for the optimal control of the two friction clutches and designed an observer to track the immeasurable variables for feedback control. Li et al. [30] presented an adaptive control strategy for DCT shifting based on estimating online the dynamic friction coefficient of a wet clutch, which could adapt to the friction changes caused by clutch abrasion and oil temperatures. Liu et al. [31] proposed a novel control strategy by optimizing the relationship between the two clutches in the downshift process to obtain the highest system efficiency. Wang et al. [32] presented a control strategy that controls the rising rate of on-coming clutch pressure and threshold of the micro-slip coordinately to attenuate the side effects caused by the degradation of a clutch’s frictional characteristics on the driveline during the shifting process.
The DCT starting process is, currently, mainly controlled by a single clutch, which is likely to cause serious wear of the single clutch with less wear of the other [33,34]. The service lifetime of a DCT is determined by the clutch that wears out and fails first, which leads to wastage as there is still a working clutch that is not about to fail, even to the extent that it still has a long lifetime. Therefore, the simultaneous participation of both clutches in the starting process is considered and treated as a special shifting process in this paper. The reference torque trajectory of the two clutch engagement processes is obtained using optimal control methods [35], such as minimum principle [27], linear quadratic optimal control [36,37], etc. With effective control, both clutches can slide at the same time and transmit the same driving total torque compared to the single-clutch starting. This can appropriately distribute the sliding friction work between the two clutches, as well as reduce the rapid wear on a single clutch and effectively prolong the service lifetime of the DCT.
The paper is organized as follows. Section 2 establishes the dynamic model of the transmission system and the corresponding models for the wet clutch oil pressure and transmitted torque. Section 3 presents the adaptive starting control strategy, which consists of identifying the driver’s intention to estimate the demand torque, analyzing the starting process, designing the optimal trajectory for dual-clutch torque control by using linear quadratic optimal control and adaptive control, and establishing the clutch control strategy. In Section 4, simulations are carried out with the proposed adaptive starting control strategy under the designed starting conditions such as slowly starting and quickly starting. The starting response of the P2.5-PHEVs is compared with the traditional single-clutch starting strategy. Section 5 discusses the simulation results and summarizes the full text for more in-depth research.
2. Dynamic Model
The P2.5-PHEVs has the advantages of easy control and smooth connection between oil and electricity, which can improve power output efficiency and good driving comfort [17]. The power system of the P2.5-PHEVs includes not only the engine, wet dual clutch, motor, transmission, main reducer, differential, and other conventional fuel vehicle components but also the electric motor and other electric components. The motor is integrated into the input shaft of the transmission. The structure diagram of the P2.5-PHEVs system is shown in Figure 1.

Figure 1.
The structure diagram of the P2.5-PHEVs system (The numbers indicate the gears).
2.1. Powertrain System Model
During the starting process of the P2.5-PHEVs, the motor is used for starting if the battery SOC (state of charge) value is greater than the set value and the motor can provide enough torque to drive the vehicle. Otherwise, the engine is required as the starting power source and the transmission process is complex and has strong nonlinearity at this time. This paper mainly studies the situation when the engine is used as the starting power source. In the case of ignoring the elasticity and radial vibration of the transmission shaft, the elasticity of the bearing seat of the bearing, the meshing characteristics of the gear, and the system clearance and partial damping, the powertrain system is simplified into a multi-degree of freedom dynamics system, as shown in Figure 2.

Figure 2.
The simplified dynamics system model.
In the control strategy designed in this paper, clutch 1 and clutch 2 are combined during the starting process. In this situation, the dynamics model of the system is:
where , , , and , respectively, represent the moment of inertia of the engine, clutch drum, transmission system, and vehicle; , , , and , respectively, represent equivalent damping coefficients; and , respectively, represent equivalent torsional stiffness coefficients; and , , , and correspond to the corners of , , , and . Their first-order derivative and second-order derivative correspond to the angular velocity and angular acceleration, respectively. , , and , respectively, represent the gears connected to clutch c1, clutch c2, and the transmission ratio of the final drive; , , , and , respectively, correspond to the torque of the engine, torque of the clutch c1, torque of the clutch c2, and torque at the wheel end.
The torque at the wheel end represents the torque when the force impeding the vehicle motion is transferred to the wheel end during the vehicle starting process, and its specific expression is:
where is the driving resistance, is the vehicle mass, is the gravity acceleration, is the rolling resistance coefficient, is the road slope, is the aerodynamic drag coefficient, is the effective frontal area, is the vehicle velocity (km/h), and is the wheel radius.
2.2. Wet Clutch Model
The wet clutch changes the combination state under the action of the actuator and transmits the motor torque to the gearbox. Due to the complexity of friction, lubrication, and other characteristics, the combined process of the wet clutch has a strong nonlinearity [38]. During the starting process of the P2.5-PHEVs, both clutches are in the slip phase; thus, the torque transport properties of the clutches in the slip phase are mainly analyzed in this paper. According to existing research, in the process of clutch sliding [21], the friction plate moves under the joint action of actuator force, oil film pressure, and friction plate contact pressure. While the transport torque of the clutch is composed of the viscous torque of the oil and the friction torque of the friction plate.
2.2.1. Oil Film Pressure
Due to the effect of lubricating oil, the oil film pressure mainly exists when there is a large gap between the master and slave discs of the clutch. It is assumed that the lubricating oil is a Newtonian fluid, and the lubricating oil between friction discs flows in both radial and tangential directions. At this time, the oil unit is selected for force analysis, as shown in Figure 3.

Figure 3.
The oil unit force analysis.
The relationship between the oil pressure and shear force and at the location of the unit satisfies:
where is the very small length along the gap direction, is the very small length along the radius direction, is the lubricant density, is the distance of the circle from the center of the rotation axis, is the high level of oil unit body, and is the rotational speed.
According to Newton’s internal friction law, the tangential and radial shear forces of fluid are expressed as the relationship between the dynamic viscosity and the relative velocity and in the corresponding direction. As follows:
Based on Equations (4) and (5):
Since the change rate of oil pressure does not change with the position in the z direction, Equation (6) can be integrated with the z direction, considering the relevant boundary conditions. The expression of and can be expressed as:
where indicates the clutch clearance, and is the speed of the clutch master and slave plate, and is the lubricant Density.
Integrating the oil velocity in the z direction, the oil flow and can be obtained in the corresponding direction:
The rough surface of the clutch friction plate affects the above flow. The improved Patir–Cheng Reynolds equation after introducing the flow factor , , and is as follows:
where is the surface permeability coefficient of the friction plate, is the thickness of the material in the permeable part of the friction plate, and is the change rate of average oil film thickness. When the friction pair surface is regarded as a Gaussian probability density distribution with a mean value of zero, the relationship between the average oil film thickness change rate and the clutch nominal clearance is as follows:
where is the error function and is the joint roughness of the friction pair surface, which is calculated by the roughness and on both sides of the friction pair:
Integrating Equation (9) in the r direction, the average clutch oil film pressure can be obtained:
where .
2.2.2. Positive Pressure of Friction Plate
When the friction plate starts to contact, the micro convex part will undergo elastic or plastic deformation. According to the general elastic mechanics model, the friction pair surface is distributed according to Gaussian distribution. The effective area of elastic contact is:
where is the elastoplastic contact coefficient, is the nominal contact area, is the peak density of the rough surface on the friction plate, is the radius of curvature of the micro convex body, is the joint roughness of the joint surface, and is the film thickness ratio .
According to the elastic model, the approximate relationship between the effective pressure and is:
where .
2.2.3. Calculation of Viscous Torque and Friction Torque
The clutch lubricating oil pressure and contact pressure are integrated into their respective effective areas, thus:
where is the oil film pressure, is the contact pressure, is the effective area ratio of the rough friction surface, and is the percentage of the actual contact area of the clutch.
The clutch viscous torque is related to the clutch clearance and speed difference. According to Newton’s internal friction theorem and the correction of the Patir–Cheng flow factor and , the viscous torque can be calculated by the following formula:
The friction torque of the clutch is related to the positive pressure of the clutch. When the sliding friction or static friction coefficient of the friction plate is constant, the unit friction torque is obtained by integrating with the cylindrical coordinate system:
3. Starting Control
Adaptive control is a method that intelligently adjusts its control characteristics in response to changes in the environment so that the system can work in the optimal state. During the starting process of the P2.5-PHEVs, the starting conditions present strong uncertainty and are susceptible to environmental effects due to the complexity of the starting scenarios and the differences in the driving styles of different drivers. If the starting control strategy fails to adjust the control parameters according to different working conditions, the vehicle will be affected rather than stabilized. In this paper, the adjustment coefficients are designed to correspond to the starting requirements under different starting conditions, which can effectively distinguish different requirements and facilitate the implementation of the adaptive control strategy. The proposed starting control strategy is shown in Figure 4.

Figure 4.
Block diagram of the starting control strategy.
3.1. Starting Demand Identification
Accurate recognition of the driver’s intentions is important for the development of DCT control strategies [39]. One of the keys to dual-clutch starting is identifying the driver’s starting intention in a short time and controlling the clutch oil pressure to respond. The traditional driver models using PID control cannot identify the driving intention, which is difficult to meet the requirements because the accurate driver prediction model has a very obvious impact on the starting quality. Now, many studies use fuzzy control strategies to identify the starting intentions, which are accurate and respond quickly. Therefore, the driver’s starting intention fuzzy controller is designed to identify the starting demand in this paper.
With different starting scenarios, such as downhill or low-adhesion road starting, the driver adjusts the vehicle’s starting status by controlling the accelerator pedal. Therefore, the driver’s starting intention can be measured by the opening of the accelerator pedal and the change rate in the opening of the pedal. In practice, the driver operates the accelerator pedal differently under different starting conditions and the corresponding correction is required in case of misoperation. In this paper, the fuzzy language of the accelerator pedal opening is set as very slow (NB), slow (NM), relatively slow (NS), medium (ZO), relatively fast (PS), fast (PM), quick (PB), and the basic domain is [0, 1]. The fuzzy language of the change rate of accelerator pedal opening is set as negative big (NB), negative middle (NM), negative small (NS), zero (ZO), positive small (PS), positive middle (PM), positive big (PB), and the basic universe is [−100%, 100%]. The fuzzy language of the electronic throttle is set as very slow (NB), slow (NM), relatively slow (NS), medium (ZO), relatively fast (PS), fast (PM), quick (PB), and the basic domain is [0, 1]. The opening and changing rate of the accelerator pedal pressed by the driver are used to formulate fuzzy inference rules based on the driver’s starting experience to obtain the electronic throttle opening signal, as shown in Figure 5.

Figure 5.
The fuzzy controller for driver intention recognition.
The electronic throttle opening signal can be positively correlated with the starting demand torque and clutch pressure control rate. The greater the electronic throttle opening, the stronger the driver’s demand for engine torque. The larger the opening change rate, the faster the vehicle response is expected to be. From the control logic, a faster clutch oil pressure control rate response is required to meet the starting requirements. By accurately identifying the starting demand, the trends in the demand torque and clutch pressure control demand rate in the control strategy can be determined.
According to the partial load characteristic curve of the engine, as shown in Figure 6, when the electronic throttle opening signal is taken as the input, the point where the engine torque is at the maximum torque under its opening is initially selected as the target point. The torque and speed at the target point correspond to the target torque and target speed in the starting process, respectively. To reduce the total starting time, the synchronization speed at the end of the starting process cannot be set too high. Meanwhile, the engine’s speed and torque vary rapidly and are prone to fluctuations. Therefore, the target point needs to be moved forward at the large throttle opening. In the control strategy, the degree of forwarding movement of the target point is determined by the target speed adjustment coefficient according to the rules established by the actual situation, as shown in Table 1.

Figure 6.
The partial load characteristic curve of the engine.

Table 1.
The amended rules of the target speed adjustment coefficient.
3.2. Adaptive Starting Control Strategy
The evaluation index of the starting process is usually expressed by the level of jerk and the friction work. The level of jerk is the derivative of the longitudinal acceleration of the vehicle, which reflects the dynamic essence of the vehicle starting process and the real feeling of human comfort from a quantitative perspective. The German standard limits the level of jerk to less than 10 m/s3, which has been widely adopted [40,41,42]. Since the starting process of the vehicle takes a short time and the velocity is low, it can be assumed that the road conditions and wind speed are essentially constant and the rate of change is zero. The level of jerk of the vehicle starting neglecting the flexibility of the shaft can be approximately expressed as follows:
where is the conversion coefficient of vehicle rotating mass, and is the mechanical efficiency of the transmission system.
The magnitude of the friction work of the DCT is related to the frictional torque, the sliding time, the speed differences between the driving and driven discs, and other parameters. The sliding friction work is considered a measure of the wear degree of the clutch. In the vehicle starting process, the greater the sliding friction work, the more serious the wear of the clutch. For the dual-clutch parallel starting, the mathematical expression of the friction work is:
where is the time when the clutch starts to combine and transmit torque, and is the time when the clutch is fully combined.
For the strategy developed in this paper, the dual-clutch simultaneous starting process can be analyzed from the clutch transmission torque, as shown in Figure 7.

Figure 7.
Schematic diagram of clutch torque during the starting process.
- 0–t1
This defines the moment when the transport torque of the clutch is equal to the resistance torque as the torque balance point one, and this time slot represents the time from starting control to reaching the torque balance point one. During this process, the torque transmitted by the clutch is mainly used to overcome the resistance torque at the wheel end. First, the target gear during the starting process is chosen based on the target torque identified by the driver’s starting intention, which also determines the final engagement clutch. Then, whether the vehicle has a velocity when starting is determined to decide the clutch engagement speed. If the vehicle starts at a standstill, the engagement speed does not affect the level of jerk since the vehicle velocity is zero. To further shorten the engagement time, the final engagement clutch is controlled to engage at the designed fastest engagement rate to reach the torque balance point one. When the vehicle starts with speed, such as going downhill, it is required to engage at the maximum engagement rate under conditions less than the maximum impact.
- t1–t2
This period represents the time from t1 to the point that the total transmitted torque of the two clutches is equal to times of the target engagement torque . The torque transmitted to the wheel end meets:
where is the torque adjustment coefficient.
The change rate of the transport torque of the clutch directly corresponds to the engagement speed of the clutch. It can be expressed as:
where and are, respectively, the change rate of the transport torque of clutch c1 and clutch c2, and are, respectively, the maximum change rate of the transport torque of clutch c1 and clutch c2, which is determined by the performance of the hardware control system of the clutch, and and are, respectively, the engagement speed adjustment coefficient of clutch c1 and clutch c2.
According to Equations (19), (21) and (22), to ensure that the level of jerk of the vehicle is within the proper range, the change rate of the transport torque and of the two clutches need to be limited by adjusting the engagement speed adjustment coefficient to meet the following requirements:
where .
The engagement torque adjustment coefficient needs to be designed according to the starting intention. When the starting torque demand is large, the coefficient is smaller, and the final clutch engagement speed is designed to be higher to prepare for the clutch engagement for the next stage. Meanwhile, due to the large damping of the system, the engagement speed is also subject to relevant constraints to avoid shocks. In the control strategy, , , and are capable of adaptive adjustment based on the rules in Table 2. It is important to mention that these adjustment coefficients vary, mainly according to the opening of the electronic throttle, and are calculated by interpolation according to the given design values, which come from actual experimental calibrations. The data in Table 1 and Table 2 are only the reference values used for the simulation. Under the condition of satisfying the level of jerk, the total torque transmitted by the synchronous engagement of two clutches does not change compared to the engagement of the single clutch, and the driving torque obtained by the vehicle is also the same. Therefore, the time consumption of this process is not different from that of the single-clutch engagement.
Table 2.
The amended rules of the adjustment coefficient.
- t2–t3
When the transmitted torque of the clutch is the same as the engine torque, it is defined as the torque balance point two. This time slot represents the time taken from t2 to the torque balance point two. Since both clutches are simultaneously engaged, the initial state of the process is that both clutches have some degree of slip. The process is similar to that of a dual-clutch shift, in that the final control will make the torque transmitted by one clutch is equal to the engine torque and the torque transmitted by the other clutch equal to 0. Linear quadratic forms are easily implemented for closed-loop optimal control and are widely used. In this paper, linear quadratic form optimal control is used to design the control strategy, which will be described in detail in Section 3.3.
- t3–t4
At this stage, the unengaged clutch is fully released and the transmitted torque is zero. Based on the transmitted torque of the clutch to be engaged calculated with the linear quadratic, it is controlled to engage at the maximum bonding speed that satisfies the shock degree until the engine torque can be transmitted.
- t4–t5
This period represents the time taken to speed synchronization from t3. At this time, the final clutch is still sliding, and the velocity of the vehicle is also increasing. Finally, the clutch is locked and does not slip when the speed of the master and slave discs of the clutch is close to the same. Additionally, the starting process is completely completed.
3.3. Linear Quadratic Optimal Control
Considering the short t2–t3 process, the moment of inertia can be combined and Equation (1) can be further simplified as:
where , is the speed of the engine and is the speed of the wheel.
The use of linear quadratic optimal control requires the expression of the relevant state space to be rewritten into a form that satisfies the requirements in order to be solved [37]. For the control design, the state variables can be chosen as:
and the control variables as:
With Equations (24)–(26), the powertrain dynamic model can be written as
or more compact as the linear time-invariant state equation:
where
The level of jerk can be derived as:
where .
The friction work of the DCT can be derived as:
When the torque balance point two is reached, the transmitted torque of the unengaged clutch is zero while the engaged clutch transmits the same torque as the engine torque. The linear part of the output variables can be considered as:
where , .
The cost function for the LQR design needs to be minimized is:
Based on this, the non-linear part is added to form a new function:
where , , , , , , and .
According to the principles related to linear-quadratic optimal control, the optimal regulation action satisfies state feedback of the following form:
where satisfies the matrix Riccati differential equation:
Additionally, it is the symmetric solution at the boundary conditions:
3.4. Clutch Control
It is clear from the previous analysis that the developed starting adaptive control strategy specifies the amount of torque that needs to be transmitted by each clutch during the starting process, and it is a theoretical demand value. However, the actual transmission torque of the clutch is directly related to the positive pressure of the clutch control mechanism and has a strong nonlinear, according to Section 2.2. In the actual control process, it is easy to have too much or too little positive pressure, which can cause fluctuations in the clutch transmitted torque and produces undesirable phenomena such as whole vehicle shocks.
Therefore, the combined pressure feedback controller based on the PID algorithm is designed to control the wet clutch bonding positive pressure and its engagement speed. The target positive pressure is set as , and the positive pressure correction amount is:
where , , and are, respectively, the proportional coefficient, integral coefficient, and differential coefficient.
Based on the accurate wet clutch model and the correspondence between the clutch positive pressure and the transmitted torque, the actual transmitted torque at different positive pressures is compared to the demand torque obtained from the control strategy. Additionally, the positive pressure value is adjusted by real-time correction so that the actual friction torque can respond to follow the optimal torque control trajectory.
4. Simulation Results
Based on the established DCT dynamics model and the wet clutch control model, simulation scenarios were designed for the proposed starting adaptive control strategy. The MATLAB/Simulink platform was used to simulate the dual-clutch starting control model of the P2.5-PHEVs equipped with a wet dual-clutch transmission. The simulation parameters used for the simulations were mainly shown in Table 3 and Table 4, which were counted in the process of abstracting the model from the actual physical objects.
Table 3.
Parameters of the wet dual-clutch transmission.
Table 4.
Parameters of the P2.5-PHEVs.
To verify the effectiveness of the proposed control strategy, this paper also designed the corresponding traditional control strategy based on a typical single-clutch starting control with the same simulation parameters. Since the second-gear starting and the first-gear starting were similar, the analysis was based on the first-gear starting.
The influence of the value of the correlation coefficient matrix in linear quadratic optimal control on the overall results was discussed. The comparative analysis was carried out from two aspects, one was from two simulation scenarios of slowly starting and quickly starting, while the other was the comparison of the proposed dual-clutch start control strategy carried out for both scenarios. Both comparisons were analyzed in detail and accurately.
4.1. Analysis of the Influence of the Coefficient Matrix
In linear quadratic optimal control, the choice of different coefficient matrices implies different requirements on the control and observation quantities, which are related to the actual demand. The emphasis on the term is stronger when the relevant weight coefficients are selected to be larger. In this paper, the main consideration was to integrate the effects of the friction work and the level of jerk during t2–t3, corresponding to the values of matrix and parameter s, respectively. Taking the throttle opening at 25% as an example, four sets of parameters were selected for comparison, as shown in Figure 8.

Figure 8.
The influence of different values of the coefficient matrix on the control process with the opening of the throttle at 25%. (a) ; (b) ; (c) ; (d) .
Since the output of the terminal was already limited by the matrix and took a large value, it would control the transfer torque of the clutch c2 and the vehicle’s level of jerk to be as zero as possible at the end of the whole control process. The results of all four sets of parameters were good and, essentially, zero. The level of jerk and the friction work were contradictory expressions, where the smaller level of jerk generally implied the larger friction work. As shown in Figure 8b, when the value of s was larger, the system control would focus more on the control of the friction work, while the intensity of the control of the level of jerk was slightly weaker. Thus, the level of jerk was larger, close to −6.38 m/s3. When the correlation coefficient of the matrix was large, as shown in Figure 8c, it indicated that the level of jerk of the control system was desired to be as small as possible, while the control intensity of the friction work was slightly weaker, where the maximum jerk was only about −0.022 m/s3. For large values of both s and matrix , the system would equilibrate to synthetically control the friction work and the level of jerk, so that the cost function for the LQR achieved the optimal value.
4.2. Analysis of Simulation Results of Slowly Starting
In the scenario of slowly starting, the simulated driver’s opening of the accelerator pedal and its rate of change were, respectively, 20% and 35%. The opening of the throttle obtained according to the fuzzy controller was 25%. Figure 9 showed the simulation results of slowly starting of the traditional control strategy and the proposed improved control strategy.
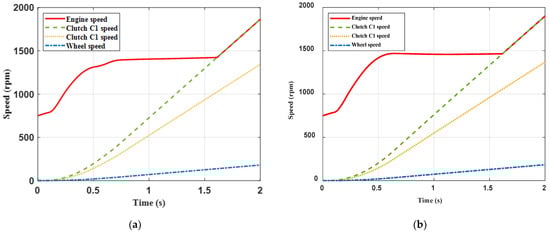

Figure 9.
The simulation results of slowly starting of the traditional control strategy and the proposed control strategy. (a) The speed of main components with the improved control strategy; (b) The speed of main components with the traditional control strategy; (c) The target and actual torque of the clutch with the improved control strategy; (d) The target and actual torque of the clutch with the traditional control strategy; (e) Level of jerk with different control strategy; (f) Friction work with different control strategies.
As shown in Figure 9a,b, the torque transmitted by DCT was relatively small at the beginning of starting. With the increase in the throttle opening, the engine speed rose rapidly. According to the designed control strategy, the maximum engine torque under the throttle opening was selected as the target torque when the throttle was lower. Whether it was with single-clutch starting or dual-clutch parallel starting, the developed control strategy would control the rapid engagement of the clutch to deliver the target torque. The simulation results showed that the starting time was essentially the same for both cases, respectively, 1.611 s and 1.617 s for the dual-clutch starting and the single-clutch starting, with the former being slightly faster. The main reason was that the two control strategies only control the torque transmitted by the DCT during the t2–t3 period differently, which made the acceleration at the wheel end essentially not very different as a whole. When the engine speed and the speed of clutch C1 were synchronized, clutch C1 was locked. At this time, its master and slave discs had the same speed and the transmitted torque was the same as the engine output torque.
According to Equations (22) and (23), the single-clutch starting had to limit the rate of change of its transmission torque to meet the jerk requirement like the dual-clutch starting. However, the clutch-transmitted torque variation exhibited intense nonlinearity due to the nonlinear characteristics of the wet clutch. According to the model of the wet clutch established, the vicious torque exists when there is a speed difference between the clutch master and slave discs due to the action of the oil, which gradually remains stable after the control pressure is released. When the PID control of the clutch pressure was performed, the actual control still did not exactly fit the target trajectory of the control, and there were some transient errors, as shown in Figure 9c,d. Meanwhile, there were some oscillations in the level of jerk due to the damping of the system, thus the relevant safety thresholds were appropriately adjusted when designing the control strategy, which made the level of jerk not be around 10 m/s3.
The torque delivered by the DCT was used to overcome the vehicle’s static rolling resistance moment when the vehicle speed was zero. The level of jerk of the dual-clutch starting had a weakening effect due to the regulating action of the two clutches, while the single-clutch starting had already reached 9.87 m/s3, which had almost exceeded the specified range for comfort. As shown in Figure 9e, when the time reached 0.518 s, the dual-clutch starting had entered the linear-quadratic optimal control zone. The selected weight coefficient of the level of jerk had a larger weight, which indicated a relatively severe requirement for the level of jerk. Therefore, the overall jerk dropped rapidly and oscillated slightly. When the transmitted torque of clutch C2 was zero, the engagement speed of clutch C1, again, accelerated rapidly, and the level of jerk was, again, raised to the same level as the single-clutch starting. From the overall point of view, the performance of the level of jerk of the dual-clutch starting was slightly better than that of the single-clutch starting.
As shown in Figure 9f, the friction work of clutch C2 was not changed when the transmitted torque was no longer during the dual-clutch starting, which was much smaller than that of clutch C1. The clutch C2 acted primarily as a regulator, similar to a dam, which could supply water during dry periods and store water during floods. Since the acceleration of the single-clutch starting and the dual-clutch starting was, essentially, the same, the tendency of the slip work of clutch C1 in the two starting control strategies was relatively synchronized but different in magnitude. During the process of the single-clutch starting, the slipping work of clutch C1 and clutch C2 were, respectively, 21.22 kJ and 0.81 kJ, and the total friction work was 22.03 kJ. While in the process of the dual-clutch starting, the slipping work was, respectively, 16.26 kJ and 5.4 kJ, and the entire process was 21.66 kJ. From the perspective of overall energy loss, the dual-clutch starting lost 0.37 kJ less than the single-clutch starting, equivalent to saving 1.68% of the energy lost from the single-clutch starting. From the perspective of the engaged clutch C1, the dual-clutch starting lost 4.96 kJ less, equivalent to saving 23.37%, which could significantly extend the service lifetime of the DCT. The simulation results showed that dual-clutch starting can significantly reduce the overall vehicle slip work at slow starting. The data of the simulation results of slowly starting are shown in Table 5.
Table 5.
The data of the simulation results of slowly starting.
4.3. Analysis of Simulation Results of Quickly Starting
In the scenario of quickly starting, the simulated driver’s opening of the accelerator pedal and its rate of change were, respectively, 80% and 65%. The opening of the throttle obtained according to the fuzzy controller was 75%. Figure 10 showed the simulation results of quickly starting.
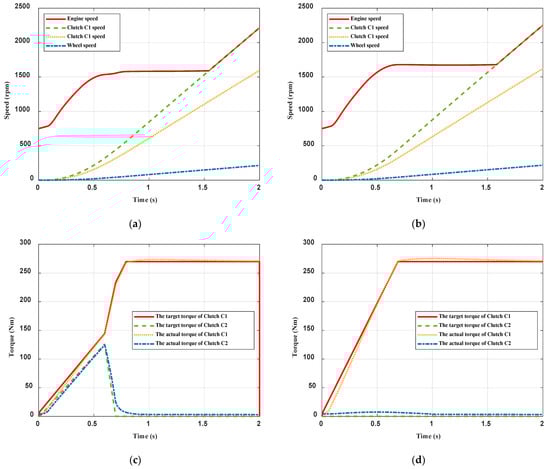

Figure 10.
The simulation results of quickly starting of the traditional control strategy and the proposed control strategy. (a) The speed of main components with the improved control strategy; (b) The speed of main components with the traditional control strategy; (c) The target and actual torque of the clutch with the improved control strategy; (d) The target and actual torque of the clutch with the traditional control strategy; (e) Level of jerk with different control strategy; (f) Friction work with different control strategies.
As shown in Figure 10, the synchronization times of the single-clutch starting and the dual-clutch starting were 1.581 s and 1.546 s, respectively. The latter was faster due to the fast response to clutch torque in the dual-clutch starting control strategy, which made the transmitted torque approach the engine torque faster. As a result, the engine speed changed relatively smaller than that of the single-clutch starting. The level of jerk of the dual-clutch starting met the comfort requirement and was better than that of the single-clutch starting in general. The friction work of the single-clutch starting and the entire process was, respectively, 27.41 kJ and 28.37 kJ. While the dual-clutch starting and the friction work of both clutches was, respectively, 20.94 kJ and 6.12 kJ, and the whole work was 27.06 kJ. Similarly, it was clarified that the less energy consumption of the dual-clutch starting was 1.31 kJ, equivalent to saving 4.62% of the energy lost from the single-clutch starting. While, for clutch C1, the friction work decreased by 6.47 kJ, equivalent to saving 23.6%, which would as well as extend the lifetime. The dual-clutch starting had a better performance in reducing the friction work loss compared with the single-clutch starting. The data of the simulation results of quickly starting are shown in Table 6.
Table 6.
The data of the simulation results of quickly starting.
From the comparison analysis of slowly starting and quickly starting, the condition of quickly starting required a faster increase in the vehicle’s velocity and the demand acceleration of the vehicle was greater. Because the engine’s output torque was larger at a large throttle opening, its speed increased more quickly. If the engine speed with the maximum output torque was still selected as the target engagement speed at a large throttle opening, then the speed was generally higher, which would prolong the synchronization time. Therefore, the target engagement speed was, appropriately, lowered in the control strategy to relatively shorten the synchronization time. Compared with slowly starting, the synchronization times of single-clutch starting and dual-clutch starting were, respectively, shortened by 0.036 s and 0.065 s. Meanwhile, as shown in Figure 11, the vehicle velocities at the end of the starting process were, respectively, 16.58 km/h and 18.62 km/h with the improved control and 17.07 km/h and 19.56 km/h with the traditional. The velocities of the quickly starting increased by 2.04 km/h and 2.49 km/h, which indicated that the starting acceleration of the vehicle was greater at a large throttle opening. By comparing the friction work of the two scenarios, the friction work of quickly starting increased by, respectively, 5.4 kJ and 6.34 kJ, due to the increase of the synchronization time and the transfer torque. However, the dual-clutch starting performed better in both scenarios in terms of synchronization time and friction work depletion compared with the single-clutch starting.

Figure 11.
The vehicle velocity with different control methods. (a) Slowly starting; (b) Quickly starting.
By comparing and analyzing the simulation results, it could be found that the proposed dual-clutch starting control strategy has better performance than the traditional single-clutch starting strategy, which verified the effectiveness of the proposed control strategy.
5. Conclusions
We proposed an adaptive starting control strategy based on the dual clutch simultaneously involved in the starting process in this paper to improve the starting performance of the P2.5-PHEVs when the engine is the starting power source. Depending on the opening of the accelerator pedal and its rate of change, a fuzzy controller was used to accurately identify the driver’s starting intention and then determine the required torque during the starting process under different working conditions. During the third period of the whole starting process, linear quadratic optimal control was used to obtain the reference torque trajectory, which considered the effects of the level of jerk and the friction work by adjusting the coefficient matrix. While adaptive control is implemented by changing the adjustment coefficients according to the different working conditions in the other periods. For the nonlinear characteristics of the wet clutch, an accurate clutch model is developed and a PID controller is proposed to follow the actual torque to the target torque. MATLAB/Simulink is used to establish and simulate the starting dynamics model of the P2.5-PHEVs with two simulation scenarios of slowly starting and quickly starting. The simulation results showed that the proposed adaptive control strategy could appropriately shorten the starting time and reduce the level of jerk. Moreover, the friction work of the whole process and clutch C1 under the first gear slowly starting and quickly starting were reduced by 1.68% and 4.62%, and 23.37% and 23.6%, which prolonged the service lifetime of the DCT system compared to the traditional single-clutch starting strategy and realized the adaptive starting of the P2.5-PHEVs under different starting conditions.
Author Contributions
Conceptualization, J.G., Y.Z.; methodology, J.G.; validation, J.G.; formal analysis, J.G.; visualization, J.G.; supervision, Y.Z.; funding acquisition, Y.Z. All authors have read and agreed to the published version of the manuscript.
Funding
This research is supported by the National Natural Science Foundation of China (12272141, 12272142). This financial support is gratefully acknowledged.
Institutional Review Board Statement
Not applicable.
Informed Consent Statement
Not applicable.
Data Availability Statement
Data sharing not applicable.
Conflicts of Interest
The authors declare no conflict of interest.
References
- Dong, Y.; Jiao, X.; Chen, D. Adaptive control for clutch engagement on starting up of vehicle. In Proceedings of the 10th World Congress on Intelligent Control and Automation, Beijing, China, 6–8 July 2012; pp. 1230–1234. [Google Scholar]
- Tang, X.; Zhang, D.; Liu, T.; Khajepour, A.; Yu, H.; Wang, H. Research on the energy control of a dual-motor hybrid vehicle during engine start-stop process. Energy 2019, 166, 1181–1193. [Google Scholar] [CrossRef]
- Kim, J.; Choi, S.B. Control of dry clutch engagement for vehicle launches via a shaft torque observer. In Proceedings of the 2010 American Control Conference, Baltimore, MD, USA, 30 June–2 July 2010; pp. 676–681. [Google Scholar]
- Song, D.; Wang, S.; Zeng, X.; Gao, F.; Li, X.; Du, S. Coordinated Control of Continuously Variable Transmission Speed Ratio in Engine Starting-Up for Hybrid Electric Vehicle; SAE Technical Paper 2021-01-5003; SAE: Warrendale, PA, USA, 2021. [Google Scholar]
- Sharifzadeh, M.; Pisaturo, M.; Senatore, A. Real-time identification of dry-clutch frictional torque in automated transmissions at launch condition. Proc. Inst. Mech. Eng. Part D J. Automob. Eng. 2020, 234, 586–598. [Google Scholar] [CrossRef]
- Wu, M.; Zhang, J.; Liu, T.; Ni, C. Research on optimal control for dry dual-clutch engagement during launch. Proc. Inst. Mech. Eng. Part D J. Automob. Eng. 2010, 224, 749–763. [Google Scholar] [CrossRef]
- Della Gatta, A.; Iannelli, L.; Pisaturo, M.; Senatore, A.; Vasca, F. A survey on modeling and engagement control for automotive dry clutch. Mechatronics 2018, 55, 63–75. [Google Scholar] [CrossRef]
- Sun, G.; Sun, D.; Ma, K.; Kan, Y.; Shi, J. Analysis and control of engine starting process based on a novel single-motor power-reflux hybrid electric vehicle. Mech. Mach. Theory 2022, 168, 104616. [Google Scholar] [CrossRef]
- Mahdi Teymoori, M.; Chitsaz, I.; Zarei, A.; Kashani, N.; Emami, M. Conceptualizing and evaluating a novel method to reduce gasoline-powered vehicles’ cold-start emissions. Transp. Res. Part D Transp. Environ. 2022, 111, 103444. [Google Scholar] [CrossRef]
- Li, Y.; Wang, Z. Motion characteristics of a clutch actuator for heavy-duty vehicles with automated mechanical transmission. Actuators 2021, 10, 179. [Google Scholar] [CrossRef]
- Zhao, Z.; Chen, H.; Wang, Q. Sliding mode variable structure control and real-time optimization of dry dual clutch transmission during the vehicle’s launch. Math. Probl. Eng. 2014, 2014, 494731. [Google Scholar] [CrossRef]
- Zhao, Z.; He, L.; Zheng, Z.; Yang, Y.; Wu, C. Self-adaptive optimal control of dry dual clutch transmission (DCT) during starting process. Mech. Syst. Signal Process. 2016, 68–69, 504–522. [Google Scholar] [CrossRef]
- Zhao, Z.; Li, X.; He, L.; Wu, C.; Karl Hedrick, J. Estimation of torques transmitted by twin-clutch of dry dual-clutch transmission during vehicle’s launching process. IEEE Trans. Veh. Technol. 2017, 66, 4727–4741. [Google Scholar] [CrossRef]
- Feng, J.; Qin, D.; Liu, Y.; Wang, X.; Lu, H. Pseudo-spectral optimization and data-driven control of vehicle start process with dual-clutch transmission. Mech. Mach. Theory 2022, 172, 104814. [Google Scholar] [CrossRef]
- Luo, Y.; Wei, Y.; Kan, Y.; Ren, L.; Xu, L.; Shen, F.; Chen, G. Control strategy for electric startup of P2.5-PHEV based on slope memory and driver’s startup intention. IEEE Access 2021, 9, 77044–77057. [Google Scholar] [CrossRef]
- Jeoung, H.; Lee, K.; Kim, N. Methodology for finding maximum performance and improvement possibility of rule-based control for parallel type-2 hybrid electric vehicles. Energies 2019, 12, 1924. [Google Scholar] [CrossRef]
- Liu, Y.; Jing, J.; Wu, J.; Wang, Y.; Huang, W.; Yu, X. Research on vehicle mode control in P2.5 hybrid system. Energy Rep. 2021, 7, 72–85. [Google Scholar] [CrossRef]
- Hao, H.; Lu, T.; Zhang, J.; Ding, W. Investigation on adaptive method of torque characteristic in dual clutch transmission during launch phase. Proc. Inst. Mech. Eng. Part K J. Multi-Body Dyn. 2020, 234, 568–584. [Google Scholar] [CrossRef]
- Yang, Y.; Wang, M.; Xia, F.; Qin, D.; Feng, J. Modeling and control approach for dual clutch transmission vehicles starting process based on state-dependent autoregressive with exogenous model. IEEE Access 2020, 8, 158712–158726. [Google Scholar] [CrossRef]
- Zhao, G.; Liu, Y.; Zhai, K.; Jiang, F.; Huang, Q.; Chen, Z. Research on intelligent launching control of dual clutch transmissions based on adaptive neural fuzzy inference system. J. Mech. Sci. Technol. 2022, 36, 3227–3237. [Google Scholar] [CrossRef]
- Lu, T.; Li, H.; Zhang, J.; Hao, H. Supervisor control strategy of synchronizer for wet DCT based on online estimation of clutch drag torque. Mech. Syst. Signal Process. 2016, 66–67, 840–861. [Google Scholar] [CrossRef]
- Kim, S.; Choi, S. Control-oriented modeling and torque estimations for vehicle driveline with dual-clutch transmission. Mech. Mach. Theory 2018, 121, 633–649. [Google Scholar] [CrossRef]
- Oh, J.; Choi, S. Real-time estimation of transmitted torque on each clutch for ground vehicles with dual clutch transmission. IEEE/ASME Trans. Mechatron. 2015, 20, 24–36. [Google Scholar] [CrossRef]
- Wang, D.; Hu, M.; Li, B.; Qin, D.; Sun, D. Study on the influence factors upon the propensity to stick-slip phenomenon during vehicle start-up process. IEEE Access 2020, 8, 12343–12353. [Google Scholar] [CrossRef]
- Kim, S.; Oh, J.; Choi, S. Driveline torque estimations for a ground vehicle with dual-clutch transmission. IEEE Trans. Veh. Technol. 2018, 67, 1977–1989. [Google Scholar] [CrossRef]
- Oh, J.; Choi, S.; Kim, J. Driveline modeling and estimation of individual clutch torque during gear shifts for dual clutch transmission. Mechatronics 2014, 24, 449–463. [Google Scholar] [CrossRef]
- Lin, S.; Li, B. Shift force optimization and trajectory tracking control for a novel gearshift system equipped with electromagnetic linear actuators. IEEE/ASME Trans. Mechatron. 2019, 24, 1640–1650. [Google Scholar] [CrossRef]
- Deng, T.; Hu, F.; He, Z.; Yin, Y. Simulation, experimental testing and optimization of starting and shifting control strategies of DCT wet dual clutches with respect to sliding friction. Iran. J. Sci. Technol. Trans. Mech. Eng. 2019, 43, 693–705. [Google Scholar] [CrossRef]
- Li, G.; Görges, D. Optimal control of the gear shifting process for shift smoothness in dual-clutch transmissions. Mech. Syst. Signal Process. 2018, 103, 23–38. [Google Scholar] [CrossRef]
- Li, A.; Qin, D. Adaptive model predictive control of dual clutch transmission shift based on dynamic friction coefficient estimation. Mech. Mach. Theory 2022, 173, 104804. [Google Scholar] [CrossRef]
- Liu, J.; Ma, B.; Li, H.; Chen, M.; Li, G. Control strategy optimization for a dual-clutch transmission downshift with a single slipping clutch during the torque phase. Proc. Inst. Mech. Eng. Part D J. Automob. Eng. 2018, 232, 651–666. [Google Scholar] [CrossRef]
- Wang, D.; Hu, M.; Qin, D. Cooperative effect of controllable parameters on the dynamic characteristics of dual-clutch transmission during the shift process. SAE Int. J. Veh. Dyn. Stab. NVH 2021, 5, 489–510. [Google Scholar] [CrossRef]
- Guo, J.; Wu, J.; Zhang, Y. Adaptive Control Strategy for Complex Starting Conditions of Vehicles with Dry Dual Clutch Transmission; SAE Technical Paper 2022-01-0284; SAE: Detroit, MI, USA, 2022. [Google Scholar]
- Wu, Y.; Xu, Y.; Zhou, J.; Wang, Z.; Wang, H. Research on starting control method of new-energy vehicle based on state machine. Energies 2020, 13, 6249. [Google Scholar] [CrossRef]
- Sebastian, K.; Dieter, B. Optimal shift control for automatic transmission. Mech. Based Des. Struct. Mach. 2013, 41, 259–273. [Google Scholar]
- Raigoza, K.; Sands, T. Autonomous trajectory generation comparison for de-orbiting with multiple collision avoidance. Sensors 2022, 22, 7066. [Google Scholar] [CrossRef]
- Szabo, T.; Buchholz, M.; Dietmayer, K. Optimal control of a gearshift with a dual-clutch transmission. In Proceedings of the ASME 2011 Dynamic Systems and Control Conference, Arlington, VA, USA, 31 October–2 November 2011; pp. 1–6. [Google Scholar]
- Guan, H.; Song, H.; Xu, L.; Lu, P. Friction model for real-time simulation of powertrain dynamics. SAE Int. J. Veh. Dyn. Stab. NVH 2018, 2, 41–54. [Google Scholar] [CrossRef]
- Wu, G.; Lyu, Z.; Wang, C. Predictive shift strategy of dual-clutch transmission for driving safety on the curve road combined with an electronic map. SAE Int. J. Veh. Dyn. Stab. NVH 2023, 7, 3–21. [Google Scholar] [CrossRef]
- Ma, K.; Sun, D.; Sun, G.; Wang, D. Wet dual clutch launching adaptive control considering service time. J. Mech. Sci. Technol. 2022, 36, 2759–2773. [Google Scholar] [CrossRef]
- Wu, J.; Zhang, N. Driving mode shift control for planetary gear based dual motor powertrain in electric vehicles. Mech. Mach. Theory 2021, 158, 104217. [Google Scholar] [CrossRef]
- Zeng, X.; Cui, H.; Song, D.; Yang, N.; Liu, T.; Chen, H.; Wang, Y.; Lei, Y. Jerk analysis of a power-split hybrid electric vehicle based on a data-driven vehicle dynamics model. Energies 2018, 11, 1537. [Google Scholar] [CrossRef]
Disclaimer/Publisher’s Note: The statements, opinions and data contained in all publications are solely those of the individual author(s) and contributor(s) and not of MDPI and/or the editor(s). MDPI and/or the editor(s) disclaim responsibility for any injury to people or property resulting from any ideas, methods, instructions or products referred to in the content. |
© 2023 by the authors. Licensee MDPI, Basel, Switzerland. This article is an open access article distributed under the terms and conditions of the Creative Commons Attribution (CC BY) license (https://creativecommons.org/licenses/by/4.0/).