Abstract
Flight control electro-mechanical actuators (EMAs) are among the primary onboard systems that significantly influence the reliability and safety of unmanned aerial vehicles. Recent reliability studies have shown that the ball-screw element of a flight control EMA is subject to oscillating operating conditions that may initiate rapid degradation, such as fatigue spall defects. Accordingly, detecting and quantifying such faults are crucial for developing efficient fault prognostic and remaining useful life estimation capabilities. In this study, a vibration-based fault quantification method is developed to quantify the fatigue faults of a ball-screw mechanism of an EMA. The method is based on identifying the ball passing instants through a localized surface defect on the vibrational jerk rather than the vibrational acceleration measurement. The jerk is numerically determined from conventional accelerometers using a Savitzky–Golay differentiator. This method was successfully tested for ball bearings and it is adjusted in this paper for ball-screw faults. The experimental validation is investigated on a set of fault-seeded samples on NASA’s Ames Research Center Flyable Electro-Mechanical Actuator test stand.
1. Introduction
There are many growing civil and military applications for unmanned aerial vehicles (UAVs) due to their low acquisition and operating costs. However, the reliability of in-service UAVs does not match the superior levels of general aviation [1,2] signaling that the root causes should be identified and mitigated by health monitoring systems. In this paper, the focus is on flight control electro-mechanical actuators (EMAs) because their failures have a significant impact on the total system failures of in-service UAVs, according to US Office of the Secretary of Defense [3]. An example of a flight control EMA assembly comprising a variable-speed electric motor, a power-drive unit, displacement sensor, and a ball-screw mechanism is illustrated in Figure 1. Several reliability studies have been conducted to identify the potential components and failure modes for health monitoring systems. The study in [4] emphasized that ball-screw failures are responsible for 16% of the total mechanical failures during accelerated run-to-failure tests for flight control EMAs.
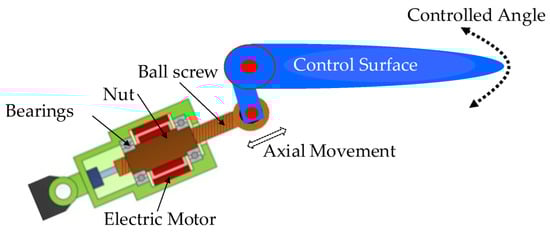
Figure 1.
Illustration of a direct-drive EMA for actuating a flight control surface.
Health monitoring methods for ball-screw faults of flight control EMA were deeply investigated by [5,6,7,8]. In [5], Balaban et al. investigated a neural network method for detecting two ball-screw faults: a partial jam and spalls for a flight control actuator. Several diagnostic features were utilized, including temperature, vibration sensors, and a load profile indicator from an additional load sensor. The false diagnosis rate was influenced by different load profiles (i.e., triangle and sinusoidal). The separation between the spall and jam relied only on the vibration sensors.
Garinei and Marsili in [6] developed a statistical diagnosis method for monitoring a damaged ball and return channel of a ball-screw actuator. A Hall effect sensor was mounted on the ball return channel for monitoring the motion’s smoothness of the balls. The statistical distributions of the Hall sensor data were estimated for different fault conditions in order to decide the health status.
Chirico and Kolodziej in [7] investigated a vibration-based fault detection and classification method for ball-screw spalls in EMAs. Power spectral density (PSD) features from vibration sensors were extracted and processed by a Bayesian classifier. Chirico and Kolodziej showed that vibration sensors for spall faults significantly outperform the efficiency of using electrical current sensors using the same processing approach.
In [8], a variant of a particle filter algorithm and an extended Kalman filter were utilized for detecting ball-screw faults for flight control EMAs. A data model for each fault scenario was identified as a pre-learning stage. Diagnosis decisions were made by matching the actuator current and load torque to the pre-identified models.
The health monitoring methods in the above studies were based on machine learning techniques that require a pre-learning stage to capture fault signatures and different severity levels. Despite the fact that these methods can attain a good diagnostic performance, they are dependent on how the machine learning technique captures the underlying physical disturbances introduced by the fault. This could be affected by the training dataset size, efficiency of selected data features, and sensor measurement artifacts.
This paper investigates a physical-originated method for quantifying spall faults in an EMA ball-screw mechanism. The method is based on identifying the geometrical features of a fatigue defect using a first-time derivative of the acceleration response, i.e., the jerk. The acceleration response is measured by conventional accelerometers. No machine learning techniques are used because the target application has a limited number of sensors and data size. The paper is organized into five sections. Section 2 describes the principles of using vibrational jerk for quantifying ball-screw spalls. The EMA actuator test stand and the fault scenarios are provided in Section 3. Experimental work and the fault quantification performance are discussed in Section 4. Significant findings are presented in Section 5.
2. Jerk Based Spall Quantification Method
2.1. Physical Principles
A basic ball-screw assembly consists of four main elements: the screw, the nut, the balls, and the recirculation channel, as shown in Figure 2. Mechanical components that have rolling contacts, e.g., ball bearings and ball-screws, are subjected to normal degradation due to rolling-contact fatigue (RCF). RCF can be defined as a mechanism of crack initiation and propagation caused by the near surface alternating stress (i.e., cyclic loading forces) within rolling contact, which eventually leads to material removal, such as spall and pit defects [9].
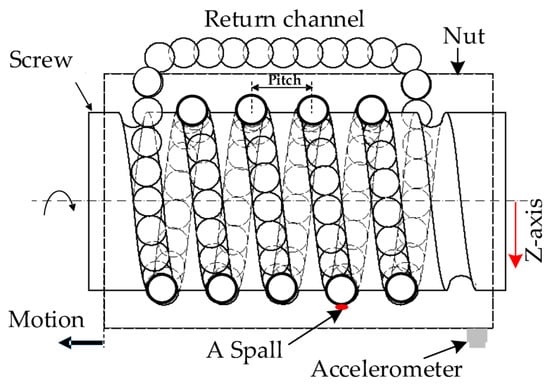
Figure 2.
Illustration of a ball-screw mechanism within an EMA and the acceleration sensor mounted on the nut.
The mechanisms of inducing vibration transients due to the rolling element movement within ball-screw assembly are discussed in [10]. When a spall fault is initiated, a radial clearance at the spall zone (i.e., between the rolling element and the defective nut or screw races) causes impulsive disturbances at the instant of entry into the spall zone, followed by a second disturbance at the instant of exit from the spall zone, as shown in Figure 3.
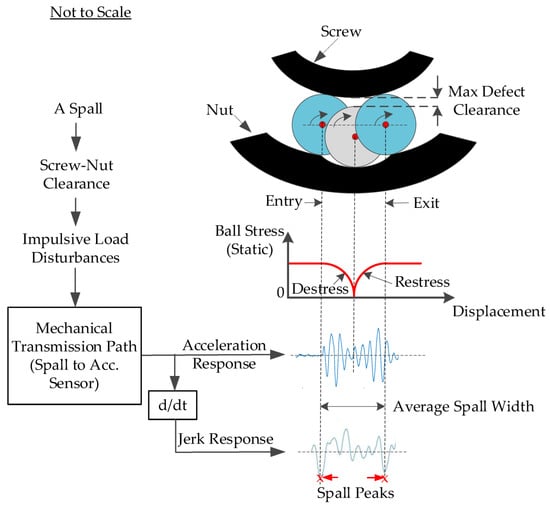
Figure 3.
Illustrated example of a ball-spall excitation mechanism and the vibrational acceleration and jerk responses.
The time difference between these two instants can be mapped into the average spall width as in (Equation (1)) [11]:
where T is the passing interval of a rolling element between the entry and the exit in seconds, L is the spall width in mm, fr is the screw speed in number of rotations per seconds, Dp is the screw pitch diameter in mm, and d is the ball diameter in mm. However, the instants of entry and exit are nearly smeared by a strong background noise that makes them hard to identify.
In this paper, a method was developed based on a first-time derivative of the vibration acceleration response, or the vibration jerk. It was empirically proven that the jerk response provides a better unified representation of a ball crossing a spall zone than the direct acceleration response for ball bearings [12], as shown in Figure 3. This is because the jerk calculates the rate of acceleration changes that are significantly disturbed at the entry and exit instants.
2.2. Modified Savitzky–Golay Differentiator
A Savitzky–Golay differentiator (SGD) was utilized to numerically estimate the jerk response because it provides adjustable smoothing and differentiating for highly noisy data. The SGD involves a polynomial p(n) of order N that is estimated through a set of noisy data points x[n] of length 2M + 1 as in (Equation (2)) [13]:
where Ck and K denote the polynomial coefficients and order, respectively. The coefficients are estimated by a moving data window of length F = 2M + 1. The SGD derivatives can be computed directly through the coefficients Ck, as in Equations (3) and (4):
The frequency response for the SGD involves two parts (Figure 4a). The first is an ideal differentiator to the input signal and it is denoted as the useful differentiation bandwidth (BW). The second is a noise amplification band for the high frequencies beyond the BW. The SGD parameters (K, F) can be tuned to select a specific BW, as shown in Figure 4b. This tuning is crucial for separating a certain BW that is most likely excited by the fault features (i.e., entry/exit instances). A procedure for such a tuning is provided in Section 2.3. A basic characteristic of SGD is that the evolution of F is identical for all K and (K + 1), as investigated in [14]. The selection K is a tradeoff between two performance metrics, namely, the BW searching range and its resolution. A larger searching range, by increasing K, is necessary for the consideration of a wider frequency spectrum for the vibration signal, while a smaller BW resolution (dBW), by decreasing K, is useful for incorporating smaller changes in the spectrum due to fault entry/exit instants. The dBW in Figure 4b describes the BW step-change in terms of F. Based on several numerical simulations, the setting K = 3 provides the best balance between the searching range and the bandwidth resolution.
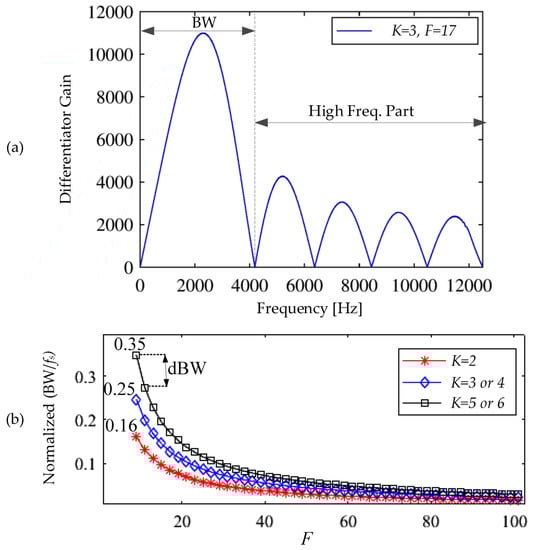
Figure 4.
(a) Typical frequency response of an SGD sampled at 25 kHz, for F = 25 samples and a cubic polynomial, K = 3. (b) The influence of changing SGD parameters (K, F) on the BW and dBW.
The SGD tuning can be used to adjust the useful differentiation bandwidth. However, the high frequencies of the input signal are always subjected to significant amplification as they are located outside the BW. In order to overcome this deficiency, a modified, narrow-bandwidth SGD (MSGD) is proposed in this paper. A typical SGD is cascaded with a low-pass filter to eliminate all high frequencies outside the BW, as shown in Figure 5. This filter can be effectively realized by using a fast Fourier transform (FFT)-based low-pass filter (LP-FFT), as described in [15]. The cut-off frequency for the low pass filter equals to the useful differentiation bandwidth, the BW value.
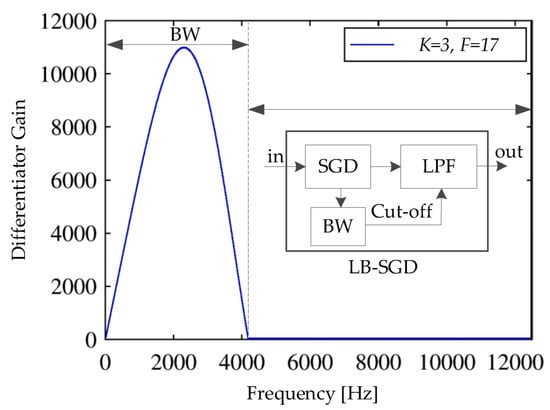
Figure 5.
The signal flow of a MSGD and the subsequent frequency response.
2.3. Paramter Estimation for Differentiator
Jerk quantification involves a method to estimate MSGD differentiator parameters. This method should be performed for short-time acceleration measurements, corresponding to one or a few revolutions of the ball-screw, to match the short strokes by flight control EMAs. An empirical method for automatically selecting differentiator parameters (K, F) is proposed as follows:
- A spalled ball-screw typically generates high frequency transients (e.g., impulsive) on the acceleration response (Figure 6a) when a ball crosses a spalled zone. These transients are separated by the ball pass frequency (BPF), as described in [10].
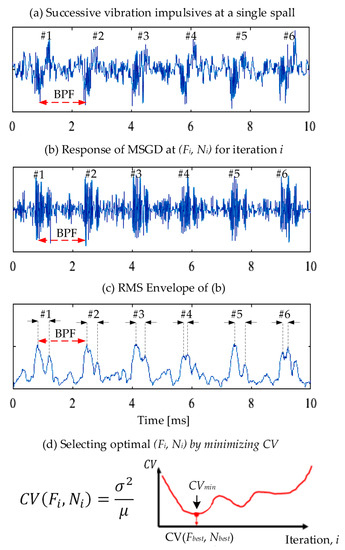 Figure 6. A tuning method for selecting MSGD parameters.
 - The acceleration response is subjected to an MSGD defined by a pair of (Ki, Fi), as shown in Figure 6b.
- The RMS envelope is used to detect the maximum jerk peaks within every individual impulse, as shown in Figure 6c. The passing interval between the two highest peaks (i.e., the significant rates of acceleration response change) is assumed to approximate the entry–exit interval.
- For a given (Ki, Fi) iteration, the coefficient of variation (CV) is estimated between the variance and the mean of the aforementioned elapsed times. The best pair (Kbest, Fbest), which also achieves the best quantification results, is the one that corresponds to the minimum CV, as shown in Figure 6d.
The principle of using CV is based on the passage of the balls over the same spall zone. As the speed rate is constant for each case (1–2 screw revolutions), the elapsed times between the entry and exit instants are mainly due to the spall width. The best (Ki, Fi) parameters should lead to consistent intervals for individual entry and exit instants. The CV measures how a group of samples are consistent.
3. Experimental Setup
The Flyable Electro-mechanical Actuator (FLEA) test stand was designed and manufactured by the Diagnostics & Prognostics Group, NASA Ames Research Center (Balaban, 2009). The test stand (Figure 7) consists of three identical electro-mechanical actuators: one nominal, one injected with faults, and the third providing dynamic load. Initially, the nominal actuator is connected to the load through a magnetic coupling mechanism. The actuator model is an Ultra Motion Bug, including a ball-screw as described in Table 1. The data acquisition system consists of two National Instruments 6259 cards, a Galil DMC 4030 motor controller, and the sensor suite described in [10]. The acceleration data were acquired at 20 kHz. The spall fault was injected by introducing cuts of various geometries by a precise electro-static discharge process, as shown in Figure 8. Experimental scenarios were designed to cover a variety of motion and load profiles, spanning the range of the test actuator capabilities. The applied load varied from −44 N in the tensile direction to 44 N in the compressive direction.
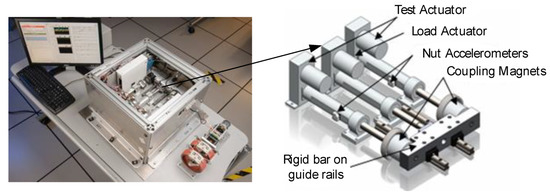
Figure 7.
The FLEA test stand.

Table 1.
Ball-screw geometry data.
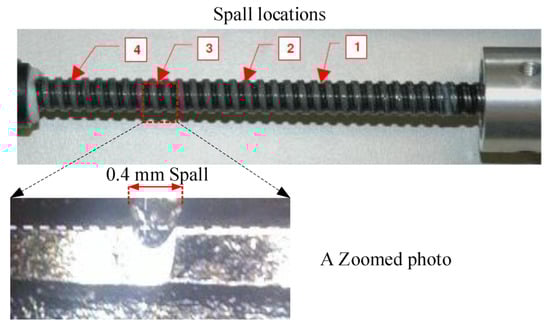
Figure 8.
Spall injection on EMA’s ball-screw.
The initial size and subsequent growth of these cuts were confirmed by optical inspection as follows:
- There are six threads between adjacent cuts, as described in Table 2;
Table 2. Spall injection locations.
- Cuts alternate between the left and right sides of the thread (right is the mount side, left is the piston side), and the depth of all cuts is 0.3 mm;
- There are five datasets for the different speeds and loads in Table 3.
Table 3. EMA datasets used in the experiments.
4. Results and Discussion
4.1. Fault Detection and Classification
A dedicated study for detecting and classifying actuator jam and spall faults has been previously published in [10]. Unique frequency domain vibration signatures were successfully assigned to classify a healthy actuator, partial jam, and screw spalls. In this paper, time domain vibration signatures for spalls were further utilized for fault quantification.
4.2. Detailed Quantification Example
The following quantification example is for dataset no. 2, as shown in Figure 9. The quantification processing is shown in Figure 10. Figure 10a shows the parameter search based on the minimum CV at K = 3 and F = 1:105. The search result (Figure 10b,c) indicates F = 35 at (CV = 5.93% and BW = 1240 Hz), which corresponds to an average entry–exit length of 0.29 mm with 3.3% error level. Figure 11 shows an example of short time acceleration transients that are subjected to numerical differentiation, MSGD signal, and its RMS envelope. More detailed quantification conditions and examples are described in [16].
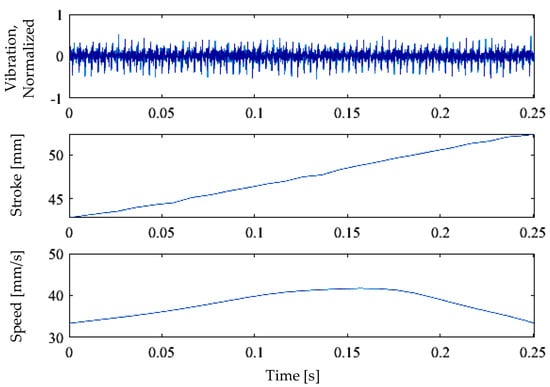
Figure 9.
Measurements from dataset ID 2 and spall ID 1.
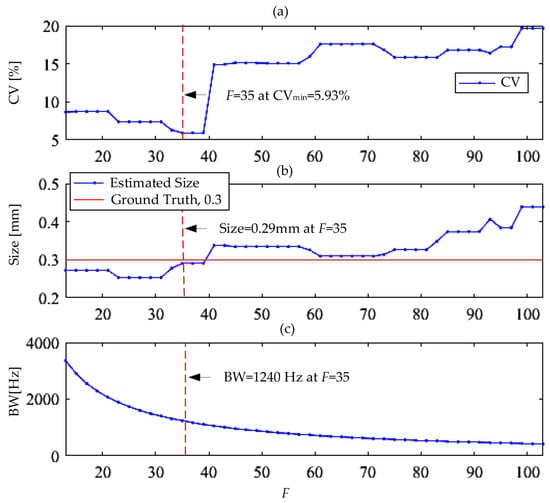
Figure 10.
Example of jerk-based quantification for dataset ID 2 and spall ID 1.
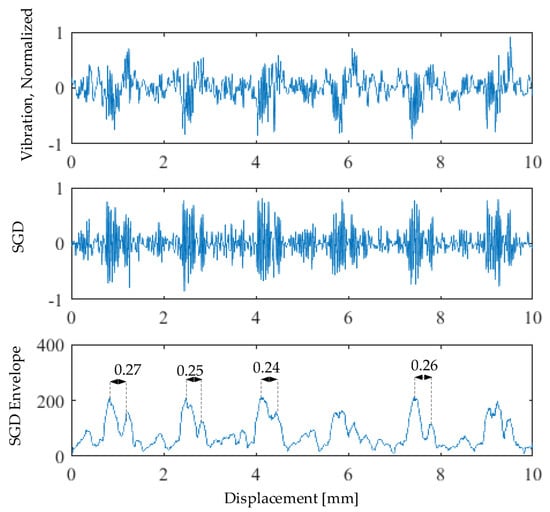
Figure 11.
Quantification example for dataset ID 2 and spall ID 1.
4.3. Overall Quantification Results
The overall quantification results for the spalled FLEA datasets are shown in Figure 12. The average and maximum errors are 11% and 15%, respectively. The worst quantification observed for the maximum load and speed levels were applied.
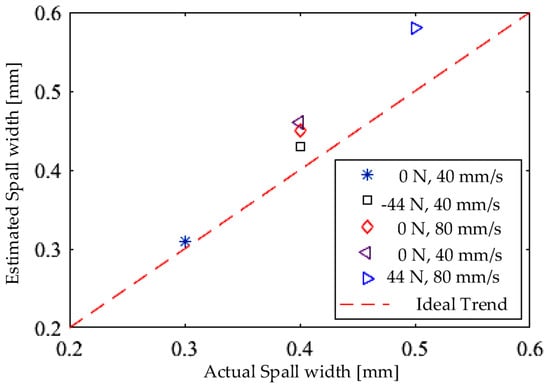
Figure 12.
Overall quantification results for FLEA data for 5 datasets.
Excluding loaded datasets, the average and maximum errors are 10% and 15%, respectively, which support the efficient quantifying of ball-screw spalls at no-load as pre-flight tests. Table 4 presents the detailed quantification results for the FLEA datasets. Based on these results and a former study for fault detection and quantification [10], a health monitoring scenario is introduced. Once an emerging fault is detected and identified, a fault quantification method is then triggered to monitor the growth of the fault and to enable an extended service life beyond the initial fault detection stage. Such an extended time may be beneficial for optimizing aircraft dispatch and maintenance planning.
Table 4.
Overall quantification results.
5. Conclusions
A vibration method was developed for quantifying spall fatigue faults for ball-screw based flight control EMAs. When a spall fault is initiated, a radial clearance at the spall zone induces impulsive vibration transients that are encoded by the geometrical features of the spall, including the spall edges. However, these transients are almost smeared by the background noise that makes them hard to identify on the vibration response. In this study, a method was developed based on a first-time derivative of the vibration acceleration response, the vibration jerk. The jerk response provides a better unified representation of spall-related transients than does the direct acceleration response. The jerk calculates the rate of acceleration changes that are significantly disturbed at the spall edges. Spall size estimations with 89% average accuracy were achieved using short-time vibration measurements that correspond to realistic small angular displacements for flight control surfaces.
Author Contributions
Fault quantification method, M.A.A.I.; preparation of fault samples and conducting fault diagnosis tests, E.B.; results analysis and co-interpretation, J.W. All authors have read and agreed to the published version of the manuscript.
Funding
This research received a financial support from DLR QSP ConMon project.
Institutional Review Board Statement
Not applicable.
Informed Consent Statement
Not applicable.
Data Availability Statement
Not applicable.
Acknowledgments
We thank the research staff of the Diagnostics & Prognostics Group, NASA Ames Research Center for help in acquiring and preparing the datasets used in this study. We appreciate valuable comments from our DLR colleague, Robert Kowalski.
Conflicts of Interest
The authors declare that there are no conflict of interests.
References
- Ismail, M.A.A.; Bosch, C.; Wiedemann, S.; Bierig, A. Fault-tolerant actuation architectures for unmanned aerial vehicles. In Advances in Condition Monitoring and Structural Health Monitoring. Lecture Notes in Mechanical Engineering; Gelman, L., Martin, N., Malcolm, A.A., Liew, C.K., Eds.; Springer: Singapore, 2021; pp. 345–354. [Google Scholar]
- Sadeghzadeh, I.; Zhang, Y. A Review on Fault—Tolerant Control for Unmanned Aerial Vehicles (UAVs); Infotech@Aerospace: St. Louis, MI, USA, 2007. [Google Scholar]
- US Office of the Secretary of Defense. Unmanned Aircraft Systems Roadmap 2005–2030. 2005. Available online: https://fas.org/irp/program/collect/uav_roadmap2005.pdf (accessed on 18 December 2020).
- Bodden, D.S.; Clements, N.S.; Schley, B. Seeded failure testing and analysis of an electro-mechanical actuator. In Proceedings of the 2007 IEEE Aerospace Conference, Big Sky, MT, USA, 3–10 March 2007. [Google Scholar]
- Balaban, E.; Bansal, P.; Stoelting, P.; Saxena, A.; Goebel, K.F.; Curran, S. A diagnostic approach for electro-mechanical actuators in aerospace systems. In Proceedings of the 2009 IEEE Aerospace Conference, Big Sky, MT, USA, 7–14 March 2009. [Google Scholar]
- Garinei, A.; Marsili, R. A new diagnostic technique for ball screw actuators. Measurement 2021, 45, 819–828. [Google Scholar] [CrossRef]
- Chirico, A.; Kolodziej, J.R. Fault detection and isolation for electro mechanical actuators using a data-driven Bayesian classification. SAE Int. J. Aerosp. 2012, 5, 494–502. [Google Scholar] [CrossRef]
- Mazzoleni, M.; Maroni, G.; Maccarana, Y. Fault detection in airliner electro-mechanical actuators via hybrid particle filtering. IFAC-PapersOnLine 2017, 50, 2860–2865. [Google Scholar] [CrossRef]
- Ahmed, R. Rolling contact fatigue. In ASM Handbook; ASM International: Materials Park, OH, USA, 2002; Volume 11, pp. 941–956. ISBN 978-087-170-704-8. [Google Scholar]
- Ismail, M.A.A.; Balaban, E.; Spangenberg, H. Fault detection and classification for flight control electro-mechanical actuators. In Proceedings of the IEEE Aerospace Conference, Big Sky, MT, USA, 5–12 March 2016. [Google Scholar]
- Sawalhi, N.; Randall, R. Vibration response of spalled rolling element bearings: Observations, simulations and signal processing techniques to track the spall size. Mech. Syst. Signal Processing 2011, 25, 846–870. [Google Scholar] [CrossRef]
- Ismail, M.A.A.; Bierig, A.; Sawalhi, N. Automated vibration-based fault size estimation for ball bearings using Savitzky–Golay differentiators. J. Vib. Control. 2018, 24, 4297–4315. [Google Scholar] [CrossRef]
- Schafer, R. What is a Savitzky-Golay filter? IEEE Signal Processing Mag. 2011, 28, 111–117. [Google Scholar] [CrossRef]
- Orfanidis, S. Introduction to Signal Processing; Prentice Hall Inc.: Hoboken, NJ, USA, 2010; pp. 427–466. ISBN 978-013-209-172-5. [Google Scholar]
- Shmuel, B. FFT Filter—Clean Your Signals and Display Results. Available online: https://ww2.mathworks.cn/matlabcentral/fileexchange/25017-fft-filter-clean-your-signals-and-display-results?s_tid=FX_rc2_behav (accessed on 25 January 2019).
- Ismail, M.A.A. Bearing Fault Detection and Quantification for Flight Control Electro-Mechanical Actuators. Ph.D. Thesis, Faculty of Mechanical Engineering, Technical University of Braunschweig, Braunschweig, Germany, January 2021. [Google Scholar]
Publisher’s Note: MDPI stays neutral with regard to jurisdictional claims in published maps and institutional affiliations. |
© 2022 by the authors. Licensee MDPI, Basel, Switzerland. This article is an open access article distributed under the terms and conditions of the Creative Commons Attribution (CC BY) license (https://creativecommons.org/licenses/by/4.0/).