Abstract
The prediction mechanism is very crucial in a smart factory as they widely help in improving the product quality and customer’s experience based on learnings from past trends. The implementation of analytics tools to predict the production and consumer patterns plays a vital rule. In this paper, we put our efforts to find integrated solutions for smart factory concerns by proposing an efficient task management mechanism based on learning to scheduling in a smart factory. The learning to prediction mechanism aims to predict the machine utilization for machines involved in the smart factory, in order to efficiently use the machine resources. The prediction algorithm used is artificial neural network (ANN) and the learning to prediction algorithm used is particle swarm optimization (PSO). The proposed task management mechanism is evaluated based on multiple scenario simulations and performance analysis. The comparisons analysis shows that proposed task management system significantly improves the machine utilization rate and drastically drops the tasks instances missing rate and tasks starvation rate.
1. Introduction
The virtual objects are contained in a virtual network, which replicates the physical representation, dependencies and context of the physical world objects. The internet of things (IoT) enabled smart factory solutions help achieving the real-time production visualization with the identification of manufacturing objects. The technologies such as radio frequency identification (RFID) are used to interpret the real-world object into smart factory’s virtual objects along with their behaviors and interactions. The development of such a system facilitates in the smart factory production process, intelligent decision making and automated control process and other operations [1].
The smart machines participate in generating huge volumes of data known as big data. Big data can be used and analyzed to aid the smart factory production. Artificial intelligence (AI) and machine learning mechanisms are used to interpret the big data into useful information to be applicable. The right use of big data can help a smart factory to optimize the production by maximizing the production output, maximizing the machine utilization, minimizing the energy consumption, minimizing the production cost and minimizing the production time. The application of AI and machine learning into big data can result into application scenarios such as predictive maintenance, fault detection, product’s quality detection, production cost predictions, etc.
The smart factory has interconnected supply chains and autonomous control of vehicles, machines and robots resulting in efficient production tasks management such as getting shipments ready based on tracking of arrivals and departures and avoiding delays with the help of self-driving vehicles and self-delivering robots. The goal of a smart factory is to deliver smart solutions to the customers of a smart factory.
Customers play a vital role in the smart factory. In order to assure the customers’ satisfaction and growth, it is very crucial for the smart factory to perform the production process efficiently and effectively in real-time by meeting all constraints [2]. This task can be performed with the help of following two factors set at the right place. The first is the automated feedback of the production processes and second is the implementation of analytics tools to accurately predict the production and consumers’ patterns [3]. Smart factory control tasks scheduling can greatly benefit from the history learnings of customers’ patterns data, production processes data, and tasks completion data. Hence, the predictive learning based scheduling is very crucial for the smart factory’s timely task management. The contribution of this paper can be given as following.
- Enhancing the smart factory control tasks scheduling mechanisms by integrating the learning to prediction module.
- Efficient tasks allocation, efficient tasks dispatching and efficient tasks scheduling; in order to improve the overall productivity of the manufacturing process.
- Improved control task management based on the predictive learning module.
The rest of the paper is divided as follows. Section 2 presents the related works; Section 3 presents the proposed learning to prediction based scheduling mechanism. In Section 4, we provide the tasks modeling simulation of the proposed system. In Section 5, we present the implementation setup. The results analysis is presented in Section 6; Section 7 concludes the paper with discussions.
2. Related Work
The prediction mechanism is very crucial in a smart factory as they widely help in improving the product quality and customers experience based on learnings from past trends. The implementation of analytics tools to predict the production and consumer patterns plays a vital rule. Figure 1 shows the framework for the predictive manufacturing system [3].
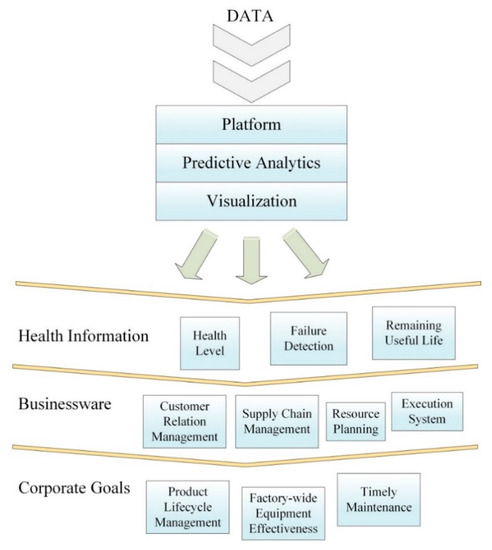
Figure 1.
Predictive analytics in a smart factory [2].
Algorithms that focus on finding efficient and quick solutions (approximate solutions) to a problem by forfeiting the accuracy and optimality are known as heuristic algorithms. Algorithms that create a statistical or probability based model for the input data are known as statistical algorithms. Table 1 shows the list of heuristic and statistical algorithms.

Table 1.
Heuristic and statistical algorithms.
The prediction mechanism is used at multiple levels in the smart manufacturing. It is used for performance predictions of the system [4]. Prediction approaches are also used to predict the health conditions of smart factory tools such as a study in [5] uses artificial neural networks (ANNs) based predictions, support vector machine based predictions and random forests based predictions for the tool wear predictions in the smart manufacturing. One of the major roles of prediction approaches in the smart manufacturing is of predictive maintenance [6]. Predictive maintenance refers to the timely predictions for the smart factory’s equipment downtime and failure in order to improve the productivity and minimize the production cost (Figure 2). The study in [7], presents a baseline predictive maintenance solution, which consists of components such as a target device (TD), device health index (DHI) and remaining-useful-life (RUL) predictive model. The system gets related process data and target device data as input and outputs the device health index and device’s remaining useful life indicating whether the device is in a safe state or risk state.
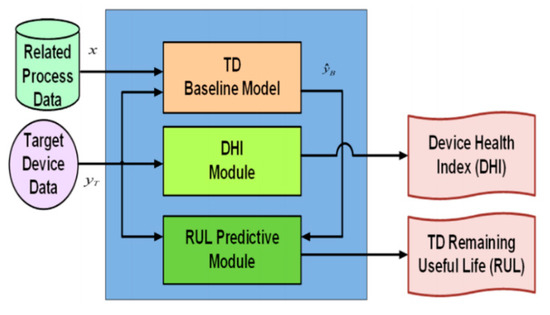
Figure 2.
Baseline predictive maintenance [6].
The work presented in [8] combines the baseline predictive scheme with a cyber-physical agent and adds an advanced manufacturing based on a cloud of things to implement a system that provides factory-wide equipment maintenance with hundreds of machines active in the smart factory. The goal is to provide a factory-wide predictive maintenance system. The study presented in [9] also proposes a cloud based predictive maintenance solution to aid the smart factory production.
After skimming the related works on smart factory scheduling, we can divide the scheduling solutions in smart factory as optimized scheduling, dynamic scheduling, distributed scheduling and learning based scheduling. In optimized scheduling, an objective function to optimize the resources is implemented where at one end the optimizer struggles to maximize the production output and at the other end it aims to minimize the cost oriented resources. The objective function defined for optimization module varies based on the smart factory scenario in hand. In dynamic scheduling, the system is enabled to deal with the variations in the production process by rearranging the existing resources. In distributed scheduling, the production process is chained to different machines/cores in a coordinated manner. In learning based scheduling, the production process is benefited from the learning modules such as predictive learning module or optimization leaning modules. The learning modules aim to improve the system with each new iteration based on learnings from the system’s history data and decisions. The category of self-aware/self-adaptive scheduling systems and reinforcement learning based scheduling systems also come under the learning based scheduling category. Many prediction mechanisms focused on task completion, time management, self-adaptive task scheduling, task replication, low-power task scheduling, etc., presented in other related studies [10,11,12,13,14,15,16,17,18,19,20,21,22,23,24,25,26,27,28,29,30,31,32]. In Table 2, we present a comparison analysis of the related scheduling works based on defined categories.

Table 2.
Comparison analysis of scheduling related works.
Predictive learning is one of the most vital aspects of the production chain in a smart factory. In this work, we proposed a predictive learning module for improving control tasks scheduling. The proposed module can be integrated with an existing scheduling tasks scheme to improve its performance, as presented in the performance analysis section.
3. Proposed Learning to the Optimization Mechanism
In this section, we present the prediction and learning to prediction mechanism for scheduling in a smart factory.
3.1. Neural Networks for Prediction
The computational model (named as threshold logic) proposed in 1943 by McCulloch and Pitts led to the research of artificial intelligence-based neural networks [33]. Artificial neural networks started to flourish once the processing power of computers increased dramatically, as computation power was one of the key issues faced in the progress of ANNs at the initial stages [34].
Biologically inspired ANNs are known to produce most accurate prediction results [35]. ANN learning has two operational modes of training and testing, the system has a set of inputs, weights associated with the inputs, hidden layers and a number of outputs. In training, the neuron learns to decide whether to fire an output for a specific pattern or not, while in the testing mode the accuracy of the learned model is determined.
The structure of a three-layer neural network is shown in the Figure 3, where we have five inputs, six hidden layers and three outputs. The working of a simple neuron can be explained by Equation (1) [36], whereby a typical neuron computes the output in the following manner:
where, is the output of kth neuron. ,are the inputs to the neuron. wk1, wk2, …, wkn are the weights associated to each input. f is the activation function, which incorporates flexibility in the neural networks.
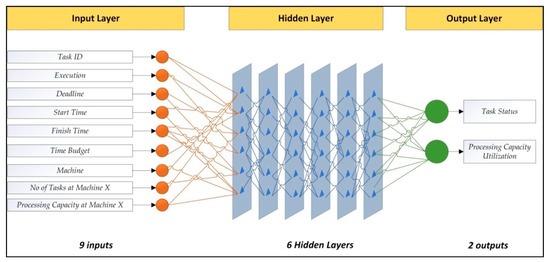
Figure 3.
Neural network (NN) layers.
The prediction model as shown in Figure 4 has nine inputs, six hidden layers and two output layers. The system takes tasks data of the time stamp, execution time, deadline time, start time, finish time, time budget, machine ID, machine load and machine capacity as input. The data is first preprocessed and then passed onto the training module where training is done based on ANN with six hidden layers. The output is prediction accuracy computed for the task status prediction and machine utilization prediction.
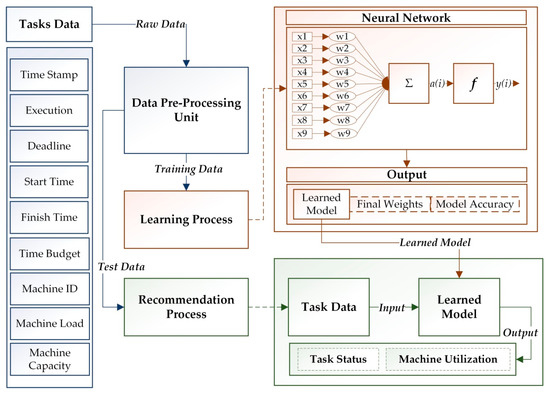
Figure 4.
Prediction model using artificial neural networks (ANNs).
3.2. Learning to Prediction Mechanism Based Control Tasks Scheduling
In this section, we describe the learning to prediction mechanism for smart factory tasks scheduling and management.
In learning to prediction, the ANN prediction algorithm’s weights are learned using PSO (Particle Swarm Optimization) algorithm, which is an optimization algorithm. Figure 5 shows the learning to prediction configurations. Initially the input is given to the ANN learning module based on six hidden layers. The PSO algorithm is applied at ANN learning iterations for learning ANN weights. PSO algorithm takes the neural networks in ANN iterations and struggles to optimize the neural weights to achieve the high accuracy.
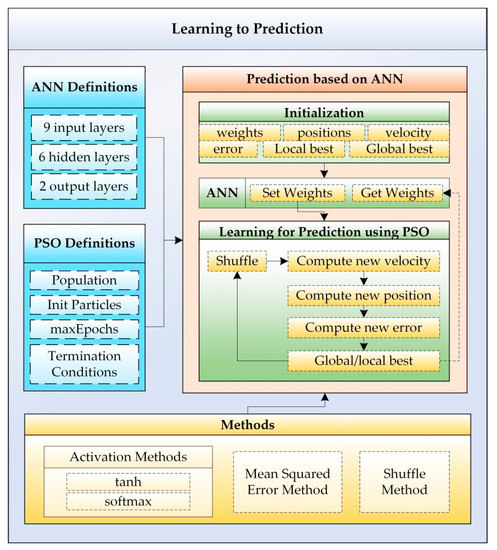
Figure 5.
Learning to prediction model based on ANN.
The learning algorithm used to learn ANN weights is an optimization algorithm named as particle swarm optimization (PSO). In PSO, a number of particles populations (typically between 12 and 20 numbers of particles) are generated. Each particle in the PSO population contains two parameters as particle position (present) and particle velocity (v). Initially the particle velocity and positions are initialized. In PSO iteration, the particle velocity and position are updated (Equations (2) and (3)). Each particle maintains two values local best as Pbest, and global best as Gbest. The Pbest is the particles own best position achieved, and the Gbest is the global best values achieved by any particle in the population. Each particle position represents the ANN weights and the Gbest is the best weights found by PSO.
We used the two variations of PSO named as regeneration based PSO (R-PSO) and velocity boost PSO (VB-PSO) [37]. The R-PSO involves a regeneration threshold (RT). In R-PSO if no improvement in the Gbest is seen after a number of iterations, define by RT, then particles found in close clusters are regenerated to new random locations; in order to fasten the solution search process. The distance between particles is examined (Equation (4)) and particles found relatively closed are regenerated to new random positions. In VB-PSO, a velocity boost threshold is maintained as VBT, and if no progress in the value of particle’s Pbest is observed until reaching VBT then particle’s velocity is boosted using the velocity change equation with new inertia weight proposed for VB-PSO (Equation (5)).
where, is the minimum distance threshold between two particles and is a constant value for limiting set as 0.15. The value for = 0.801.
The prediction results are passed onto the scheduler, where the FEF (fair emergency first) [38] scheduling algorithm is implemented for control tasks execution. The overall flow of the system is shown in the Figure 6. In FEF, first the scheduler extracts the tasks arriving at the system based on arrival times. If the current task is an urgent event driven task, it is executed right away. If the task is a normal event driven task, then urgency measure (UM) is checked to see whether the machine slot can be used for any low priority starving tasks or not. If not, then the current task is executed or else the starving task is given the slot. Next, the priority periodic task is checked, where failure measure (FM) is checked to see if the priority periodic tasks can wait and slot can be allocated to the starving low priority task or not.
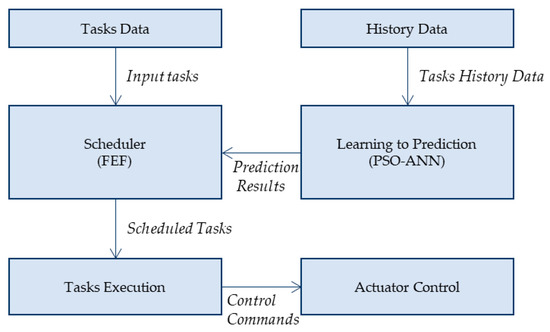
Figure 6.
Control tasks scheduling based on learning to prediction.
4. Input Tasks Modeling and Simulation for Smart Factory
In this subsection we present the tasks simulation and performance analysis for the candy box factory use case scenario.
4.1. Candy Box Factory
The execution time for sensing tasks was set to be 20 milliseconds (ms) and the priority was set to be normal periodic tasks. The execution time for system tasks was set to be 300 milliseconds (ms) and the priority for the order placement task was set to be an urgent event driven task and the priority for the inference rule execution task was set to be a priority periodic task. The execution times for all the control tasks were set to be 520 milliseconds (ms) and the priorities for environmental conditions control actuator (heater, chiller, humidifier and dehumidifier) were set to be urgent event driven. The priorities for control tasks of manufacturing machines (AM1, AM2, AM3, AM4, PM1, PM2, PM3 and PM4) were set based on the priority set at customers’ order time and deadline. It can be either a normal event driven or urgent event driven task.
The candy box factory scenario has three main types of tasks as sensing tasks, system tasks and control tasks. In sensing tasks, we have three tasks as temperature sensing task, humidity sensing task and occupancy sensing task. In system tasks we have two main tasks as the order placement system task and inference rule execution task. In control tasks we have four actuator control tasks as the heater control task, chiller control task, humidifier control task and dehumidifier control task. Additionally, in the control task for each machine is the control AM1 task, control AM2 task, control AM3 task, control AM4 task, control PM1, control PM2 task, control PM3 task and control PM4 task.
4.2. Simulated Tasks Dataset
In this subsection, we present the input tasks modeling for simulated tasks dataset. The input tasks for simulated tasks dataset were randomly generated based on user inputs and system thresholds to generate tasks set to be simulated. The tasks generated had initial parameters as tasks ID, execution time and deadline and machine ID. Next the system computed the tasks parameters as the start time, finish time and time budget time based on initially generated parameters.
At first, the number of tasks to be generated was taken as input from the user. Next the tasks generation interval was taken as input from the user. The generated tasks were sensing tasks with different sensing intervals as 5 s, 10 s, 15 s, 20 s, 30 s, 40 s and 60 s. For each task, task id were generated, arrival time was the time at which the task arrived at the system, next the execution times were randomly generated between a given range, task deadline were generated between the given threshold of being greater than zero and less than the tasks deadline, machine id was initialized as zero and later set to the scheduled machine, start times were set to the scheduled start times at machine, finish time was set to the scheduled finish time at machine.
In the first step for tasks generation, the sensing tasks were generated based on the initial parameters for task id, execution time and deadline and machine id. In the next step the tasks parameter values generation function for start times assignment, finish time assignment and time budget assignment were called where these parameters were initialized. Using these parameters, the tasks were ready to be run at the scheduler at their scheduled time following scheduling mechanism. In parallel to tasks scheduling at the scheduler, the scheduler kept maintaining the history logs with tasks detailed parameters and additional parameters of task completion status, total number tasks at each machine with machine id, processing capacity of each machine with machine id and total processing capacity required by each machine based on current load.
4.3. Machine Cluster Dataset
In this section, we used the Google cloud task scheduling dataset [39] for the simulations and performance evaluations of our system. The dataset compromised of 500 sets of tasks instances executed at multiple machines.
The dataset had two main data as machine data and tasks data. Each task comprised of multiple jobs and included jobs data. The machine data had two main tables as machine events table and machine attributes table. The machine events table contained timestamp, machine ID, event type, platform ID, machine processing capacity and machine memory capacity. Machine attributes table contained the timestamp, machine ID and attribute name, value and deletion status. The tasks data had the tasks events table, tasks constraints table and jobs events table. The jobs events table contained the time stamp, missing information, job ID, event type, user name, scheduling class and job name. The tasks event table contained the timestamp, missing information, job ID, task index for job, machine ID, event type, scheduling class, priority, resources for CPU, RAM and memory and machine constraints. The tasks constraints table contained the timestamp job ID, task index, attribute name and value.
5. Implementation Environment
We used python for implementing the core programming logic of the task scheduling algorithms. The development environment for the system is shown in Table 3.

Table 3.
Development environment.
6. Performance Analysis
In this we present the simulation and performance analysis. In Section 6.1, we present the simulations and performance analysis for the candy box factory tasks dataset. In Section 6.2, we present the simulations and performance analysis for the simulated tasks dataset. In Section 6.3, we present the simulations analysis for the machine cluster tasks dataset.
6.1. Simulations and Performance Analysis of Candy Box Factory
Figure 7 presents the prediction accuracy comparisons using the ANN prediction algorithm and PSO based ANN (PSO-ANN) prediction algorithm. The results show a significant improvement in terms of minimized number of epochs and increased prediction accuracy. The maximum prediction accuracy achieved using ANN was 99.02% in 600 iterations and the maximum prediction accuracy achieved using PSO-NN was 99.39% in 700 iterations. At 600 iterations, the PSO-NN gets to the prediction accuracy of 99.27%, which was still greater than ANN at 600 iterations.
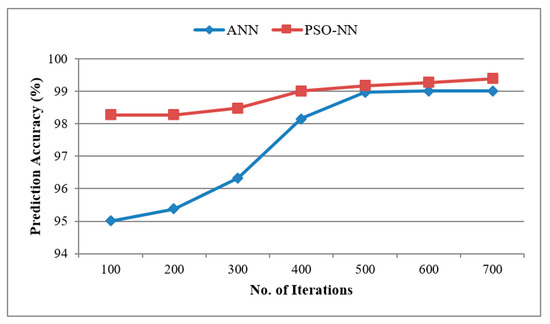
Figure 7.
Prediction accuracy comparisons for ANN and particle swarm optimization (PSO)-NN for the candy box factory.
In Figure 8, we present the comparisons of prediction accuracy based on PSO based ANN along with the variations of PSO based ANN as R-PSO-NN and VB-PSO-NN. The results show the prediction accuracy of R-PSO-NN and VB-PSO-NN is further improved from PSO-NN. In candy box factory predictions, VB-PSO-NN gives maximum prediction accuracy with the least number of iterations. The VB-PSO-NN performance is followed by R-PSO-NN, which gave slightly less prediction accuracy. The maximum prediction accuracy achieved using PSO-NN was 99.39% in 700 iterations while the maximum prediction accuracy achieved using R-PSO-NN was 99.53% in 700 iterations and the maximum prediction accuracy achieved using VB-PSO-NN was 99.53% in 500 iterations.
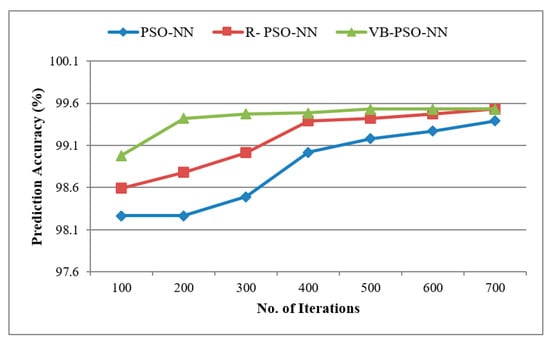
Figure 8.
Prediction accuracy comparisons for regeneration based PSO (R-PSO)-NN and velocity boost PSO (VB-PSO)-NN for the candy box factory.
In Figure 9, we present the comparisons of basic FEF with the learned prediction FEF with an aim to demonstrate the effect of learning to prediction in the scheduling algorithm. The comparisons were performed on the candy box factory data. The results show the percentage of task starvation rate and average instances missing rate in the simulations. It can be clearly observed that learned predictive FEF had a smaller number of starved tasks rate and a smaller number of tasks instances missing rate. The FEF scheduling algorithm had around 22.12% of tasks starved and 29.75% of tasks instances missed whereas the learned predictive FEF scheduling had around 8% of tasks starved and 16% of tasks instances missed. The learning of prediction module in learning to scheduling mechanism increased the overall performance of the scheduler as it enabled the scheduler to make informed and learned decisions.
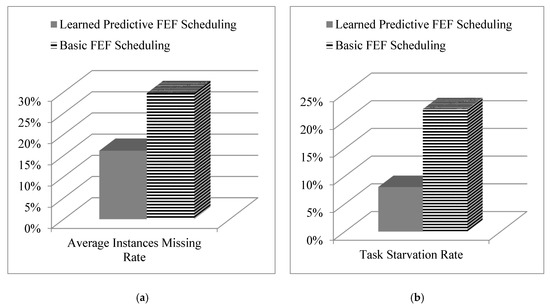
Figure 9.
Proposed scheduling comparisons with prediction and without prediction for the candy box factory: (a) average instances missing rate in percentage and (b) average task starvation rate in percentage.
In Figure 10, we present the comparisons among predictive FEF scheduling and learned predictive FEF scheduling. The graph shows the tasks average response times at the y-axis and test iterations at the x-axis. A significant decrease in the tasks’ response time is observed with the addition of learning of module. The average response time for tasks set using predictive FEF scheduling was 2191.39 milliseconds and the average response time for tasks set using learned predictive FEF scheduling was 1954.13 milliseconds.
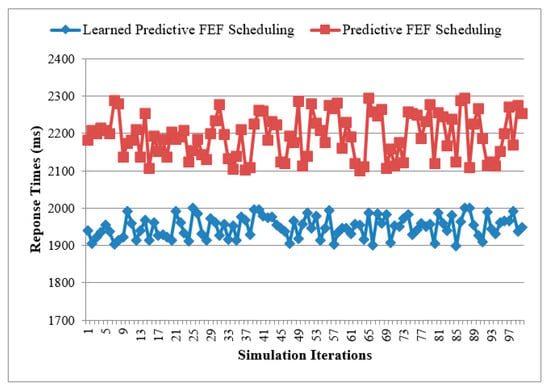
Figure 10.
Response time comparisons with and without learned prediction for the candy box factory.
6.2. Simulations and Performance Analysis of Simulated Tasks Dataset
Next, we compared the prediction accuracy results with prediction learning based on the proposed variations of the PSO algorithm as R-PSO and VB-PSO. The Figure 11 shows the output results for learned prediction with optimized weights of ANN based on PSO and its variations ad R-PSO and VB-PSO. The results show that R-PSO and VB-PSO, both achieved higher accuracy within less iterations in comparison to the PSO so both variations were considered fruitful improvements in PSO. In comparing R-PSO and VB-PSO, we can observe that initially R-PSO-NN achieved higher prediction accuracy than VB-PSO but within the next 100 iterations the VB-PSO-NN’s prediction accuracy shot higher and stayed at 99.54% from 200 iterations onwards. Whereas, though R-PSO-NN took 600 iterations to achieve prediction accuracy of 99.51% and reached 99.69% of prediction accuracy 700 iterations and gave higher prediction accuracy eventually.
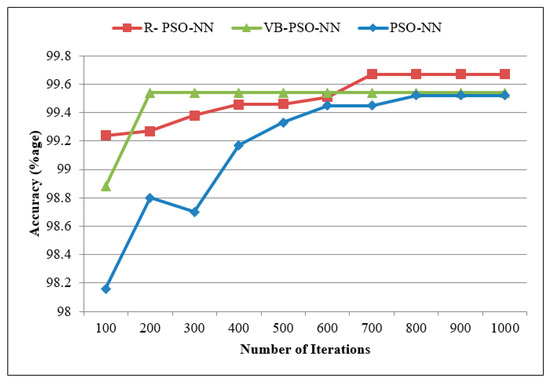
Figure 11.
Prediction accuracy comparisons based on PSO-NN, R-PSO-NN and VB-PSO-NN in the simulated tasks dataset.
In Figure 12, we present the comparison of baseline FEF with learned prediction FEF with the aim to demonstrate the effect of learning to prediction in the scheduling algorithm. The figure shows the results for the tasks starvation rate and average instances missing rate. We can observe that the learned predictive FEF reduced the tasks starvation rate and also reduced the average instances missing rate. The average instances missing rate for predictive FEF scheduling 33.49% and that for learned predictive and optimized hybrid scheduling was 19%. The tasks starvation rate for predictive FEF scheduling 25% and that for learned predictive and optimized hybrid scheduling was 9.19%. The learned predictive FEF decreased the tasks starvation rate with wisely allocating the free machine slots. Hence, the learning to prediction module increased the overall performance of the scheduler.
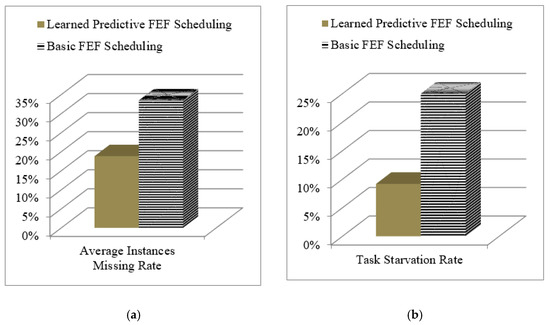
Figure 12.
Comparisons for learned predictive fair emergency first (FEF) and basic FEF scheduling for the simulated tasks dataset: (a) average instances missing rate in percentage and (b) average tasks starvation rate in percentage.
6.3. Simulations and Performance Analysis of the Machine Cluster Data
First of all, the machine cluster data was used to train the prediction model. The predictions were made using ANNs where ANNs’ weights were tuned using PSO variations. In the Figure 13 below, we show the prediction accuracy achieved and comparisons of the accuracy among implementations of PSO based ANN predictions, R-PSO based ANN predictions and VB-PSO based ANN predictions. In the graph, we observe that VB-PSO achieved the highest prediction accuracy within the least number of epochs, whereas though R-PSO-NN also achieved the same accuracy as VB-PSO-NN but with a higher number of epochs. The prediction accuracy of 98.42% was achieved by R-PSO-NN in 800 iterations while VB-PSO-NN achieved the same within 300 iterations.
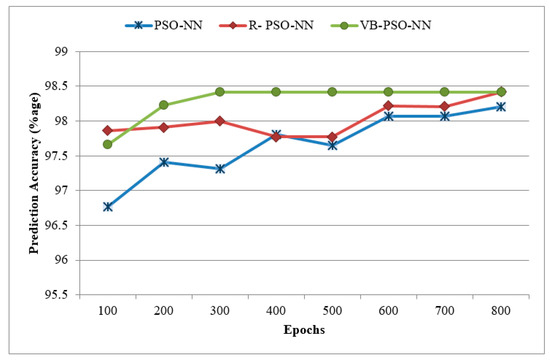
Figure 13.
Prediction accuracy comparisons based on PSO-NN, R-PSO-NN and VB-PSO-NN in the machine cluster dataset.
In Figure 14, we present the comparison of basic FEF scheduling and learned prediction FEF scheduling. The learned predictive FEF scheduling had an addition prediction module based on ANN, which was learned using PSO. The learned prediction enhanced the scheduling performance using history data learning and optimization of prediction results using PSO to tune ANN’s weights. Hence, we can observe in the graph that learned predictive FEF had less number of tasks starved and less number of instances missed in comparison to basic FEF scheduling. The average instances missing rate for basic FEF scheduling was 24% and for learned predictive FEF scheduling was 11%. The average tasks starvation rate for basic FEF scheduling was 18.28% and for learned predictive FEF scheduling was 5.35%.
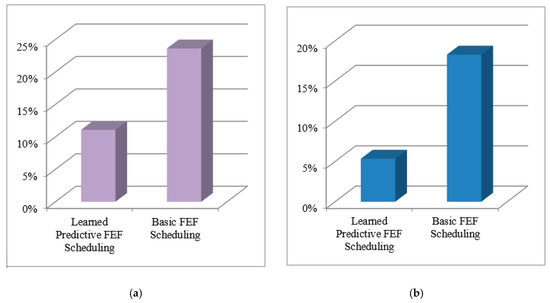
Figure 14.
Comparisons for learned predictive FEF and basic FEF scheduling in the machine cluster dataset: (a) average instances missing rate in percentage and (b) average tasks starvation rate in percentage.
7. Discussion
The learning to prediction mechanism predicts the tasks execution status and machine utilization under a given load of the machines/tasks based on history decisions. The variations of PSO are used in the learning to prediction mechanism as VB-PSO-NN and R-PSO-NN. In the learning to optimization mechanism, an objective function was proposed for enhancing machine utilization and to seek the optimal results based on PSO algorithm. Additionally, we used the proposed improved variations of PSO (VB-PSO and R-PSO) in the optimization module. We further implemented the ANN learning based VB-PSO and R-PSO; where ANN was used to tune the PSO particles’ positions for efficiently finding optimal solution.
The simulations were performed under overloaded tasks load at the machines to examine worst case scenarios. In the simulations, as the tasks grow more than the total machine capacity, some of the tasks’ instances must drop out. The PSO based ANN predictions gives higher accuracy and the modification proposed for PSO improve the performance of PSO in the prediction module. In the performance analysis for the candy box factory tasks dataset, we observe that prediction accuracy achieved by PSO-NN was 99.39% in 700 iterations while the prediction accuracy achieved by R-PSO-NN was 99.53 in 700 iterations and the prediction accuracy achieved by VB-PSO-NN was 99.53% in 500 iterations. In the performance analysis for the simulated tasks dataset, we observe that prediction accuracy achieved by PSO-NN was 99.42% in 800 iterations while the prediction accuracy achieved by R-PSO-NN was 99.69 in 700 iterations and the prediction accuracy achieved by VB-PSO-NN was 99.54% in 200 iterations. In the performance analysis for the machine cluster tasks dataset, we observe that prediction accuracy achieved by PSO-NN was 98.21% in 800 iterations while the prediction accuracy achieved by R-PSO-NN was 98.42% in 800 iterations and the prediction accuracy achieved by VB-PSO-NN was 98.42% in 300 iterations.
In the comparisons’ analysis for the candy box factory, we observed the following improvements. The learned predictive FEF scheduling in comparison to basic FEF scheduling scheme shows an average of 50% reduction in the tasks starvation rate and an average of 63.64% reduction in the tasks instances missing rate. In the comparisons’ analysis for the simulated tasks dataset, we observed the following improvements. The learned predictive FEF scheduling in comparison to the basic FEF scheduling scheme shows an average of 77.78% reduction in the tasks starvation rate and an average of 78.26% reduction in the tasks instances missing rate. In the comparisons’ analysis for the machine cluster tasks dataset, we observed the following improvements. The learned predictive FEF scheduling in comparison to basic FEF scheduling scheme showed an average of 72.23% reduction in the tasks starvation rate and an average of 54.17% reduction in the tasks instances missing rate. Overall, we observe that the learned predictive FEF scheduling in comparison to basic FEF scheduling scheme showed an average of 72.23% reduction in the tasks starvation rate and an average of 54.17% reduction in the tasks instances missing rate.
In future directions, alternative prediction mechanisms can be adopted and tested for the prediction learning module. A comparison analysis of various prediction algorithms to highlight the best performing prediction algorithms can be a useful study for future implementation frameworks.
Author Contributions
Data curation, S.M.; Formal analysis, S.M.; Funding acquisition, D.K.; Investigation, S.M.; Methodology, S.M.; Resources, D.K.; Software, S.M.; Supervision, D.K.; Validation, S.M.; Visualization, S.M.; Writing—original draft, S.M.; Writing—review and editing, S.M. and D.K. All authors have read and agreed to the published version of the manuscript.
Funding
This research was funded by Basic Science Research Program through the National Research Foundation of Korea(NRF) funded by the Ministry of Education(2018R1D1A1A09082919), and this research was supported by Energy Cloud R&D Program through the National Research Foundation of Korea(NRF) funded by the Ministry of Science, ICT (2019M3F2A1073387).
Institutional Review Board Statement
Not applicable.
Informed Consent Statement
Not applicable.
Data Availability Statement
The data for google cluster data can be downloaded from https://github.com/google/cluster-data/blob/master/ClusterData2011_2.md.
Acknowledgments
Any correspondence related to this paper should be addressed to DoHyeun Kim.
Conflicts of Interest
The authors declare no conflict of interest.
References
- Industry 4.0: The Fourth Industrial Revolution. Available online: http://www.lgcnsblog.com/features/industry-4-0-the-fourth-industrial-revolution-with-it-and-the-manufacturing-industry-sgs-platform-2/#sthash.T1sgnNZk.dpbs (accessed on 14 December 2020).
- Nauck, D.; Ruta, D.; Spott, M.; Azvine, B. Predictive Customer Analytics and Real-Time Business Intelligence. In Service Chain Management; Voudouris, C., Lesaint, D., Owusu, G., Eds.; Springer: Berlin/Heidelberg, Germany, 2008; pp. 205–214. [Google Scholar]
- Saldivar, A.A.F.; Goh, C.; Chen, W.N.; Li, Y. Self-organizing tool for smart design with predictive customer needs and wants to realize Industry 4.0. In Proceedings of the 2016 IEEE Congress on Evolutionary Computation (CEC), Vancouver, BC, Canada, 24–29 July 2016; pp. 5317–5324. [Google Scholar]
- Kang, Y.S.; Park, I.H.; Youm, S. Performance prediction of a MongoDB-based traceability system in smart factory supply chains. Sensors 2016, 16, 2126. [Google Scholar] [CrossRef] [PubMed]
- Wu, D.; Jennings, C.; Terpenny, J.; Gao, R.X.; Kumara, S. A comparative study on machine learning algorithms for smart manufacturing: Tool wear prediction using random forests. J. Manuf. Sci. Eng. 2017, 139, 071018. [Google Scholar] [CrossRef]
- Yan, J.; Meng, Y.; Lu, L.; Li, L. Industrial big data in an industry 4.0 environment: Challenges, schemes, and applications for predictive maintenance. IEEE Access 2017, 5, 23484–23491. [Google Scholar] [CrossRef]
- Hsieh, Y.S.; Cheng, F.T.; Huang, H.C.; Wang, C.R.; Wang, S.C.; Yang, H.C. VM-based baseline predictive maintenance scheme. IEEE Trans. Semicond. Manuf. 2012, 26, 132–144. [Google Scholar] [CrossRef]
- Chiu, Y.C.; Cheng, F.T.; Huang, H.C. Developing a factory-wide intelligent predictive maintenance system based on Industry 4.0. J. Chin. Inst. Eng. 2017, 40, 562–571. [Google Scholar] [CrossRef]
- Wang, J.; Zhang, L.; Duan, L.; Gao, R.X. A new paradigm of cloud-based predictive maintenance for intelligent manufacturing. J. Intell. Manuf. 2017, 28, 1125–1137. [Google Scholar] [CrossRef]
- Li, J.; Ma, X.; Singh, K.; Schulz, M.; de Supinski, B.R.; McKee, S.A. Machine learning based online performance prediction for runtime parallelization and task scheduling. In Proceedings of the 2009 IEEE International Symposium on Performance Analysis of Systems and Software, Boston, MA, USA, 26–28 April 2009; pp. 89–100. [Google Scholar]
- Kong, X.; Lin, C.; Jiang, Y.; Yan, W.; Chu, X. Efficient dynamic task scheduling in virtualized data centers with fuzzy prediction. J. Netw. Comput. Appl. 2011, 34, 1068–1077. [Google Scholar] [CrossRef]
- Wang, L.; Von Laszewski, G.; Huang, F.; Dayal, J.; Frulani, T.; Fox, G. Task scheduling with ANN-based temperature prediction in a data center: A simulation-based study. Eng. Comput. 2011, 27, 381–391. [Google Scholar] [CrossRef]
- Daly, D.M.; Franaszek, P.A.; Lastras-Montano, L.A.; International Business Machines Corp. Prediction Based Priority Scheduling. U.S. Patent 8,185,899, 22 May 2012. [Google Scholar]
- Jiang, B.; Ravindran, B.; Cho, H. Probability-based prediction and sleep scheduling for energy-efficient target tracking in sensor networks. IEEE Trans. Mob. Comput. 2012, 12, 735–747. [Google Scholar] [CrossRef]
- Goryachev, A.; Kozhevnikov, S.; Kolbova, E.; Kuznetsov, O.; Simonova, E.; Skobelev, P.; Tsarev, A.; Shepilov, Y. ‘Smart Factory’: Intelligent system for workshop resource allocation, scheduling, optimization and controlling in real time. In Advanced Materials Research; Trans Tech Publications Ltd.: Bäch, Switzerland, 2013; Volume 630, pp. 508–513. [Google Scholar]
- Sokolov, B.; Ivanov, D. Integrated scheduling of material flows and information services in industry 4.0 supply networks. IFACPapersOnLine 2015, 48, 1533–1538. [Google Scholar] [CrossRef]
- Zhang, D.; Liu, Y.; Li, J.; Xue, C.J.; Li, X.; Wang, Y.; Yang, H. Solar power prediction assisted intra-task scheduling for nonvolatile sensor nodes. IEEE Trans. Comput. Aided Des. Integr. Circuits Syst. 2016, 35, 724–737. [Google Scholar] [CrossRef]
- Kück, M.; Ehm, J.; Freitag, M.; Frazzon, E.M.; Pimentel, R. A datadriven simulation-based optimisation approach for adaptive scheduling and control of dynamic manufacturing systems. In Advanced Materials Research; Trans Tech Publications Ltd.: Bäch, Switzerland, 2016; Volume 1140, pp. 449–456. [Google Scholar]
- Ivanov, D.; Dolgui, A.; Sokolov, B.; Werner, F.; Ivanova, M. A dynamic model and an algorithm for short-term supply chain scheduling in the smart factory industry 4.0. Int. J. Prod. Res. 2016, 54, 386–402. [Google Scholar] [CrossRef]
- Zeng, F.; Zhang, R.; Cheng, X.; Yang, L. Channel prediction based scheduling for data dissemination in VANETs. IEEE Commun. Lett. 2017, 21, 1409–1412. [Google Scholar] [CrossRef]
- Jules, G.; Saadat, M. Agent cooperation mechanism for decentralized manufacturing scheduling. IEEE Trans. Syst. Man Cybern. Syst. 2017, 47, 3351–3362. [Google Scholar] [CrossRef]
- Wan, J.; Chen, B.; Wang, S.; Xia, M.; Li, D.; Liu, C. Fog computing for energy-aware load balancing and scheduling in smart factory. IEEE Trans. Ind. Informat. 2018, 14, 4548–4556. [Google Scholar] [CrossRef]
- Chekired, D.A.; Khoukhi, L.; Mouftah, H.T. Industrial IoT data scheduling based on hierarchical fog computing: A key for enabling smart factory. IEEE Trans. Ind. Informat. 2018, 14, 4590–4602. [Google Scholar] [CrossRef]
- Shiue, Y.-R.; Lee, K.-C.; Su, C.-T. Real-time scheduling for a smart factory using a reinforcement learning approach. Comput. Ind. Eng. 2018, 125, 604–614. [Google Scholar] [CrossRef]
- Leusin, M.; Frazzon, E.; Maldonado, M.U.; Kück, M.; Freitag, M. Solving the job-shop scheduling problem in the industry 4.0 era. Technologies 2018, 6, 107. [Google Scholar] [CrossRef]
- Fu, Y.; Ding, J.; Wang, H.; Wang, J. Two-objective stochastic flowshop scheduling with deteriorating and learning effect in industry 4.0- based manufacturing system. Appl. Soft Comput. 2018, 68, 847–855. [Google Scholar] [CrossRef]
- Ortíz, M.A.; Betancourt, L.E.; Negrete, K.P.; de Felice, F.; Petrillo, A. Dispatching algorithm for production programming of flexible job-shop systems in the smart factory industry. Ann. Oper. Res. 2018, 264, 409–433. [Google Scholar] [CrossRef]
- Zhao, S.; Dziurzanski, P.; Przewozniczek, M.; Komarnicki, M.; Indrusiak, L.S. Cloud-based dynamic distributed optimisation of integrated process planning and scheduling in smart factories. Proc. Genet. Evol. Comput. Conf. 2019, 1381–1389. [Google Scholar] [CrossRef]
- Kousi, N.; Koukas, S.; Michalos, G.; Makris, S. Scheduling of smart intra—Factory material supply operations using mobile robots. Int. J. Prod. Res. 2019, 57, 801–814. [Google Scholar] [CrossRef]
- Wan, J.; Yang, J.; Wang, S.; Li, D.; Li, P.; Xia, M. Cross-network fusion and scheduling for heterogeneous networks in smart factory. IEEE Trans. Ind. Informat. 2020, 16, 6059–6068. [Google Scholar] [CrossRef]
- Leng, J.; Jiang, P.; Xu, K.; Liu, Q.; Zhao, J.L.; Bian, Y.; Shi, R. Makerchain: A blockchain with chemical signature for self-organizing process in social manufacturing. J. Clean. Prod. 2019, 234, 767–778. [Google Scholar] [CrossRef]
- Leng, J.; Yan, D.; Liu, Q.; Xu, K.; Zhao, J.L.; Shi, R.; Wei, L.; Zhang, D.; Chen, X. ManuChain: Combining permissioned blockchain with a holistic optimization model as bi-level intelligence for smart manufacturing. IEEE Trans. Syst. Man Cybern. Syst. 2019, 50, 182–192. [Google Scholar] [CrossRef]
- McCulloch, W.; Walter, P. A Logical Calculus of Ideas Immanent in Nervous Activity. Bull. Math. Biophys. 1943, 5, 115–133. [Google Scholar] [CrossRef]
- Minsky, M.; Papert, S. Perceptrons: An Introduction to Computational Geometry; MIT Press: Cambridge, MA, USA, 1969. [Google Scholar]
- Artificial Neural Networks as Models of Neural Information Processing|Frontiers Research Topic. Available online: https://www.frontiersin.org/research-topics/4817/artificial-neural-networks-as-models-of-neural-information-processing (accessed on 30 March 2018).
- Artificial Neuron Output. Available online: https://en.wikipedia.org/wiki/Artificial_neuron (accessed on 4 May 2018).
- Malik, S.; Kim, D. Prediction-learning algorithm for efficient energy consumption in smart buildings based on particle regeneration and velocity boost in particle swarm optimization neural networks. Energies 2018, 11, 1289. [Google Scholar] [CrossRef]
- Malik, S.; Ahmad, S.; Ullah, I.; Park, D.H.; Kim, D. An Adaptive Emergency First Intelligent Scheduling Algorithm for Efficient Task Management and Scheduling in Hybrid of Hard Real-Time and Soft Real-Time Embedded IoT Systems. Sustainability 2019, 11, 2192. [Google Scholar] [CrossRef]
- Reiss, C.; Wilkes, J.; Hellerstein, J.L. Google Cluster-Usage Traces: Format+ Schema; White Paper; Google Inc.: Mountain View, CA, USA, 2011; pp. 1–14. [Google Scholar]
Publisher’s Note: MDPI stays neutral with regard to jurisdictional claims in published maps and institutional affiliations. |
© 2021 by the authors. Licensee MDPI, Basel, Switzerland. This article is an open access article distributed under the terms and conditions of the Creative Commons Attribution (CC BY) license (http://creativecommons.org/licenses/by/4.0/).