Abstract
Data now plays a central role in civic life and community practices. This has created a pressing need for new forms of translation and sense-making that can engage diverse publics. Research-based Theatre (RbT) has proven to be an effective approach to delivering qualitative data to community stakeholders. We extend this tradition by proposing “community-engaged data theatre”. This approach translates quantitative data into theatrical language to engage communities in deliberative conversations on relevant issues. Community-engaged data theatre requires bridging multiple disciplines and involves creating new definitions and shared vocabularies in discourses that formerly have had little overlap in meaning. In this article, we share key insights from our initial experiments in which we adapted quantitative and qualitative data to devise a pilot piece in collaboration with a local community partner. In this essay, we communicate our collaborative process in polyvocal, artistic form. We edit and adapt materials from our conversations and creative practices into scenes illustrating how we taught and learned from each other about data science, participatory modeling, material deliberation and Composition to pilot our lab’s first community-engaged data theatre prototype.
1. Introduction
People need access to quantitative data to advocate for their needs in civic spaces. However, many people do not have the specialized skills required for data literacy. This creates a pressing need for new ways of translating and making sense of data to engage diverse audiences (Arnold Mages 2019). Research-based Theatre (RbT) has proven to be an effective way to increase the public impact of qualitative research findings by helping people who the research is about and making meaning of those findings (Nichols et al. 2022). We extend this tradition by proposing “community-engaged data theatre”, which translates quantitative data into theatrical language to engage communities in deliberative conversations on relevant issues. Community-engaged data theatre involves bridging multiple disciplines, creating new definitions and shared vocabularies in discourses that formerly have had little overlap in meaning. In this article, we share key insights from our initial experiments in which we adapted quantitative and qualitative data to devise a pilot piece in collaboration with a local community partner.
We communicate our collaborative process and key learnings in polyvocal, artistic form—showing, rather than telling, how we learned from each other—by formatting this article in the form of a script. Following Vachon and Salvatore (2023), we use this form to push back against the narrative authority of a singular authorial voice, centering instead on the multiple voices and perspectives of the many collaborators contributing to the project. This is important to communicate the multiple overlapping goals, expectations, and concerns of our diverse team, as well as to illustrate our ensemble-oriented approach to collaborative inquiry. This approach makes transparent the ways undergraduates and faculty members teach and learn from each other in reciprocal ways through a process of inquiry rooted in Research-based Theatre methods.
The Research-based play we share here is designed to be read and not performed. Some moments are expressionistic, representing dynamics within the group and within the work in non-realistic ways to highlight the constructed nature of this written representation (Snyder-Young 2011). Other moments are more realistic, illustrating the details of real moments of artistic practice and collaborative negotiation. Throughout, we have edited and adapted materials from our conversations and creative practices into scenes illustrating how we taught and learned from each other about data science, participatory modeling, material deliberation, and Composition (Bogart and Landau 2005) to pilot our lab’s first community engaged data theatre prototype.
2. Dramatis Personae (in Order of Appearance)
2.1. Research Team and Community Partners
Dani: White woman, 40s, dramaturg and audience researcher.
Jonathan: White man, 40s, director.
Rahul: Brown man of Indian origin, 40s, data literacy researcher and artist.
Oliver: White man, 30s, theatre designer.
Michael: White man, 50s, design researcher, deliberative democracy facilitator.
Moira: White Hispanic woman, 50s, environmental planner, computational social scientist.
Laura: White woman, 40s, design researcher.
Victor: White man, 60s, experienced creator of community-centered documentary theatre projects.
George: White man, 50s, Director of University of British Columbia’s Research-based Theatre Lab.
Abby: White woman, 30s, Director of LivableStreets Alliance, a local community partner.
Angelique: Black and Native American woman, mid 20s, performance artist and PhD student who joins the team after the conclusion of the workshop.
2.2. Acting Ensemble
Halle: Black and White woman, early 20s, undergraduate theatre student.
Donovan: Black man, early 20s, undergraduate theatre student.
Finn: White man, early 20s, undergraduate theatre student.
Ren: White nonbinary person, early 20s, undergraduate theatre student.
Sydney: White woman, early 20s, undergraduate theatre student.
Zeke: White man, early 20s, undergraduate theatre student.
2.3. Setting
Time: Spring 2023, with an epilogue in Fall 2023.
Place: The laboratory theatre of a predominantly White research university in a large city in the northeastern United States.
3. Scene 1: Gathering an Ensemble
Dani: Our institution has particularly robust resources and infrastructure to support transdisciplinary collaborative research, and strategic institutional priorities focus on applied, community-partnered research. In the US, there’s precious little funding for the arts and humanities—the fields with the most access to resources tend to privilege quantification. Does anybody want to play with me to see if it is possible to make RbT from quantitative data?
Jonathan: This is an exercise which is a kind of shortcut to a lot of Viewpoints (Bogart and Landau 2005) principles, called The Flow. Start by just walking in the room. Begin to notice the bodies around you and consider the spaces between them. Let each space between two bodies be a series of doorways and see how many doorways you can pass through.
Rahul: Data literacy emerged from the domain of the sciences. But now data is used in a wide range of contexts outside of those settings. The norms from the science fields come into these new settings and cause harm. What tools or media from broader artistic forms can be used to inform data communication, that is, to help people understand the datafying world?
[Rahul walks quickly between Michael and Moira. Dani races through a doorway between Oliver and Victor. Rahul turns to approach another door, and Dani nearly crashes into him. Everyone freezes.]
Dani: Mixed-methods Research-based Theatre? Research-based Theatre, but with math?
Rahul: Data Theatre?
Everyone: Data Theatre!
[The Flow resumes].
Oliver (sits behind the light board, brings up a lighting look and turns off the work lights): That’s better. Aesthetics matter.
Michael: For my work, the difficult problem when giving people specialized data is a bad translation: they see it and it looks intimidating, and they mentally check out (Arnold Mages 2019). Can we use RbT to make complex city data more legible for our community partners? And do it in a way that helps them bring their lived experience to bear on “the problem”? By the way, I don’t think we’ve talked about the matter of concern (Latour 2004), or the people we are working with yet!
Moira: Participatory modeling (PM) is a collaborative approach to model building to make sense of a complex problem and to jointly design and test solutions for it. PM has mainly been applied to address environmental challenges such as climate change. In such cases, multiple actors and factors (socio-economic, policy, biophysical) interact with each other, obscuring the distribution and magnitude of responsibilities, benefits and burdens, making it hard to understand the problem and figure out solutions that are truly beneficial and fair. Not only is causal inference obscured, the diverse values around what is better or worse, or for whom, makes coordination around desirable courses for action hard to achieve. Engaging in PM can build on diverse sources of knowledge to collaboratively produce solutions, strengthening community-building, systems thinking, and collective action (Gray et al. 2018; Hedelin et al. 2021; Zellner and Campbell 2015, 2020). PM is an inherently situational and experiential practice, which makes it uncertain. The elucidation of causal connections doesn’t come easy within a complex web of interactions, adding to the uncertainty. Facilitation is a critical support of PM efforts, but the training in it is scarce and the skills are mostly built through practice—learning by doing. Ongoing work explores the role of improv techniques in building these skills (Zellner, in progress). How can theatre techniques enhance the visualization and representation of complex structures, sense-making of simulation outcomes, and the coordination of actions out of PM processes?
Laura: Even when graphs or other visual representations of data are designed to be easy to understand, working with information that way can be a very individual experience—it can be hard for groups to think about and talk about the information together. Can using movement to represent the data through our bodies help people have different discussions around the information? What happens when we start feeling out data instead of looking at it?
Victor: Integrating quantitative data in a narrative form could be a critical addition to the process of both creating and performing documentary theatre.
Dani: I don’t begin this project with that much expertise in RbT; can we bring in George from the University of British Columbia to help us figure out what we’re doing?
George: Hi. I’m happy to help.
The opening vamp to “I Wish” from Into The Woods begins to play.
Victor: (sings) I wish.
Jonathan: Wait, this is a musical? Does it have to be a musical? I kind of hate musicals.
Dani: Does anyone have a better idea than an “I want” song to introduce our goals?
Michael: Yes. Rolls out a portable white board with “GOALS” written at the top. Everybody grabs a stack of Post-its and a marker. Each team member scribbles their goal on a Post-it and sticks it to the white board.
Dani: Figure out how to render quantitative data into theatrical language, develop methods for capturing data from deliberative processes and using theatrical language to share it with stakeholders. Build relationships to sustain and expand the project.
Victor: Learn from and with George’s team at workshop.
Moira: Explore how the rendering of quantitative and qualitative data in theatrical language can support participants in deliberation processes and complex systems modeling to understand uncertainty, make sense of dissonance, understand emotionally the current trajectory of the status quo, and make decisions based on those understandings.
Michael: Explore the boundary of ludic space within deliberative spaces, particularly role play and perspective taking. In the longer term, learn how these things *work* in deliberative spaces. Also, is it ok to admit that I’m pre-tenure and so it’s important to me to evaluate this process in a rigorous way and write something documenting our learnings?
Jonathan: Make exciting theatre that surprises and enthralls.
Moira: Communicate uncertainty in ways people can understand. That doesn’t mean the status quo works; how can people grasp the trajectory of the system to make sense and accept dissonances and be able to make different decisions.
Laura: Explore ways to bring together different kinds of data and data representation in partnerships with communities. Explore the fuzzy boundaries around data through artistic practices and learn more about how theatre dovetails with dance and movement practices I’m more familiar with.
Oliver: I’m not totally sure how I plug in right now. We applied for a bigger grant that would include a workshop production, which I’d then production design. But we were awarded a smaller grant that isn’t big enough for a show, so… build on this pilot so we can do a full production?
Dani: What are your expectations as we head into this project?
Michael: I imagine some sort of role play in which participants can embody different perspectives.
Moira: And use improvisation—I’m already trying to use some improvisation in my classes, so I would love to learn how to do more of that.
Laura: Putting the data in their bodies.
Rahul: Thinking differently about the data they embody.
Rahul and Laura: We’ve already been playing with some data scene and data image making processes (Bhargava et al. 2022).
Jonathan: Um, I thought we were going to make a piece of theatre for an audience. I was hoping to use Viewpoints with an ensemble of advanced undergrads who have been studying it with me. That’s what I’m most excited to do.
Oliver: Yeah, I’m not sure how production design would fit into a participatory improv workshop.
Dani: I don’t think participatory drama and theatre performance are mutually exclusive. RbT projects have used participatory dramatic activities with stakeholders to generate material to inform community-partnered research projects (Belliveau and Lea 2016). And RbT has also been used to communicate the findings of community-partnered research projects back to those communities by making pieces of theatre for them to watch and respond to (Jarus et al. 2022). So let’s put those two pieces together. What if we do participatory workshops and then use material from those workshops—tableaux, stories people tell, that kind of thing—as source material for a piece of theatre Jonathan devises with students who have been trained using Viewpoints techniques, which Oliver can design. Then we can show the piece back to the people who participated in the workshops and close the loop.
(Everyone nods; this plan can meet their expectations and needs.)
Rahul: (snickering to himself) “Tableau”? That’s the name of some software that I teach for analyzing and visualizing data.
Victor: Really? That’s a theatre term for a stage picture.
Rahul: No way! We definitely need to use “Tableau” in the title of an article.
Moira: What do you mean by “devise”?
Jonathan: Devising is an act of collaboratively making a theatre piece from scratch.
Moira: How do you do that?
Victor: There are lots of ways to devise theatre.
Jonathan: I use Viewpoints as my primary method. It’s a training tool in which we approach the building blocks of performance with curiosity about how to make dynamic choices in each, and gradually integrate those tools as we improvise. We can use Viewpoints just to train, but when we start to keep moments from the improvisations and link them together into less ephemeral compositions, we are creating devised theatre.
Moira: What are those building blocks?
Jonathan: Think of them as basic elements—tempo, spatial relationship, kinesthetic response, repetition, shape, and more. I like this approach because it allows us to create shared language for how to see, how to build and respond to staging on a formal level. Artists who build really strong Viewpoints muscles make wonderful ensembles and the shared language we build really helps in the creation of new work (Bogart and Landau 2005).
Rahul (to Laura): The Viewpoints—the basic elements of performance—sounds like Bertin’s (1967) visual encodings, doesn’t it?
Laura: (to Rahul) Sure does! You want to tell them, or should I?
Rahul: (to Laura) I’ll handle it. (to all) This sounds a lot like the idea of “visual encodings” in data visualization. Designers can use different visual properties—like color, shape, or position—to show different pieces of the data.
Laura: So one visual encoding could be a designer’s choice to use the horizontal (left to right) position to show the year that a piece of data was collected, and another could be using size to show an amount measured in that year.
George: Engaging with Viewpoints as a methodological approach is a new and exciting contribution to RbT work, as most groups start with character-based scripts.
Michael: The work we want to do is community-partnered. Does anyone have an existing community partnership with a group that could come do some exploratory work with us?
Dead silence. Everyone stares at each other. Then everyone talks at once:
| Michael: I moved to this town right before COVID, so I haven’t made many friends yet! But if we want to work with folks in Pittsburgh… | Dani: My community partners are storytellers and I think we need to figure out how to do this with people who are not already making theatre. | Rahul: All my community partners are still 110% dealing with lingering social and economic impacts of COVID. | Laura: The impacts of COVID are still really pressing for all my community partners too. | Jonathan: I have an ensemble of advanced undergrads trained in Viewpoints technique, but that’s not what you’re asking for. | Oliver: I’ve never done that kind of work before. | Victor: My collaborators are all in California. |
Moira: (whistles loudly to get everyone to stop talking) Meet Abby from LivableStreets Alliance. Their organization advocates for the development of greenways in Boston.
Abby: Community-engaged theatre with data? This sounds so cool. We’re grappling with tensions between the development of green space and gentrification, and we would love to learn some new arts-based techniques we might be able to use for community engagement. We collected some survey data last year, and we’d love an excuse to dig into publicly available data that engages with this issue.
Laura: Here’s some relevant publicly available data for zip code 02121, which is about two miles from campus and is part of Roxbury, which is an historically Black neighborhood. LivableStreets does a lot of work there.
Dani: The Lab theatre is free once classes end for the semester. We could do a two-day standalone workshop.
Jonathan: Do we have the budget to pay some students who have been trained in Viewpoints to help with this? (Dani nods)
Dani: I’ll order some catering.
All: Let’s play with some data!
4. Interlude: Some Data to Play with
Everyone resumes the warm-up activity, The Flow, this time without instructions. An ensemble of six undergraduate theatre students enters and joins the others in The Flow: HALLE, DONOVAN, FINN, REN, ZEKE and SYDNEY. They move with the athleticism and dynamism of trained performers, and the technique they bring increases the aesthetic capacity of the entire group. As the full group executes The Flow, the data the group will use as source material (Figure 1, Figure 2 and Figure 3) is projected for the audience:
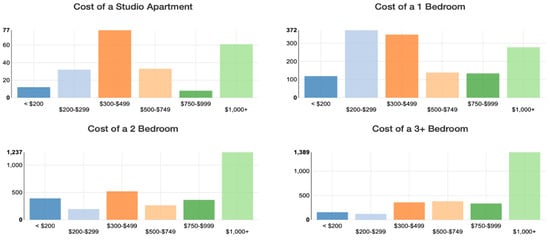
Figure 1.
Quantity and cost of various types of units in 02121 (unitedstateszipcodes.org (accessed on 18 April 2023)).

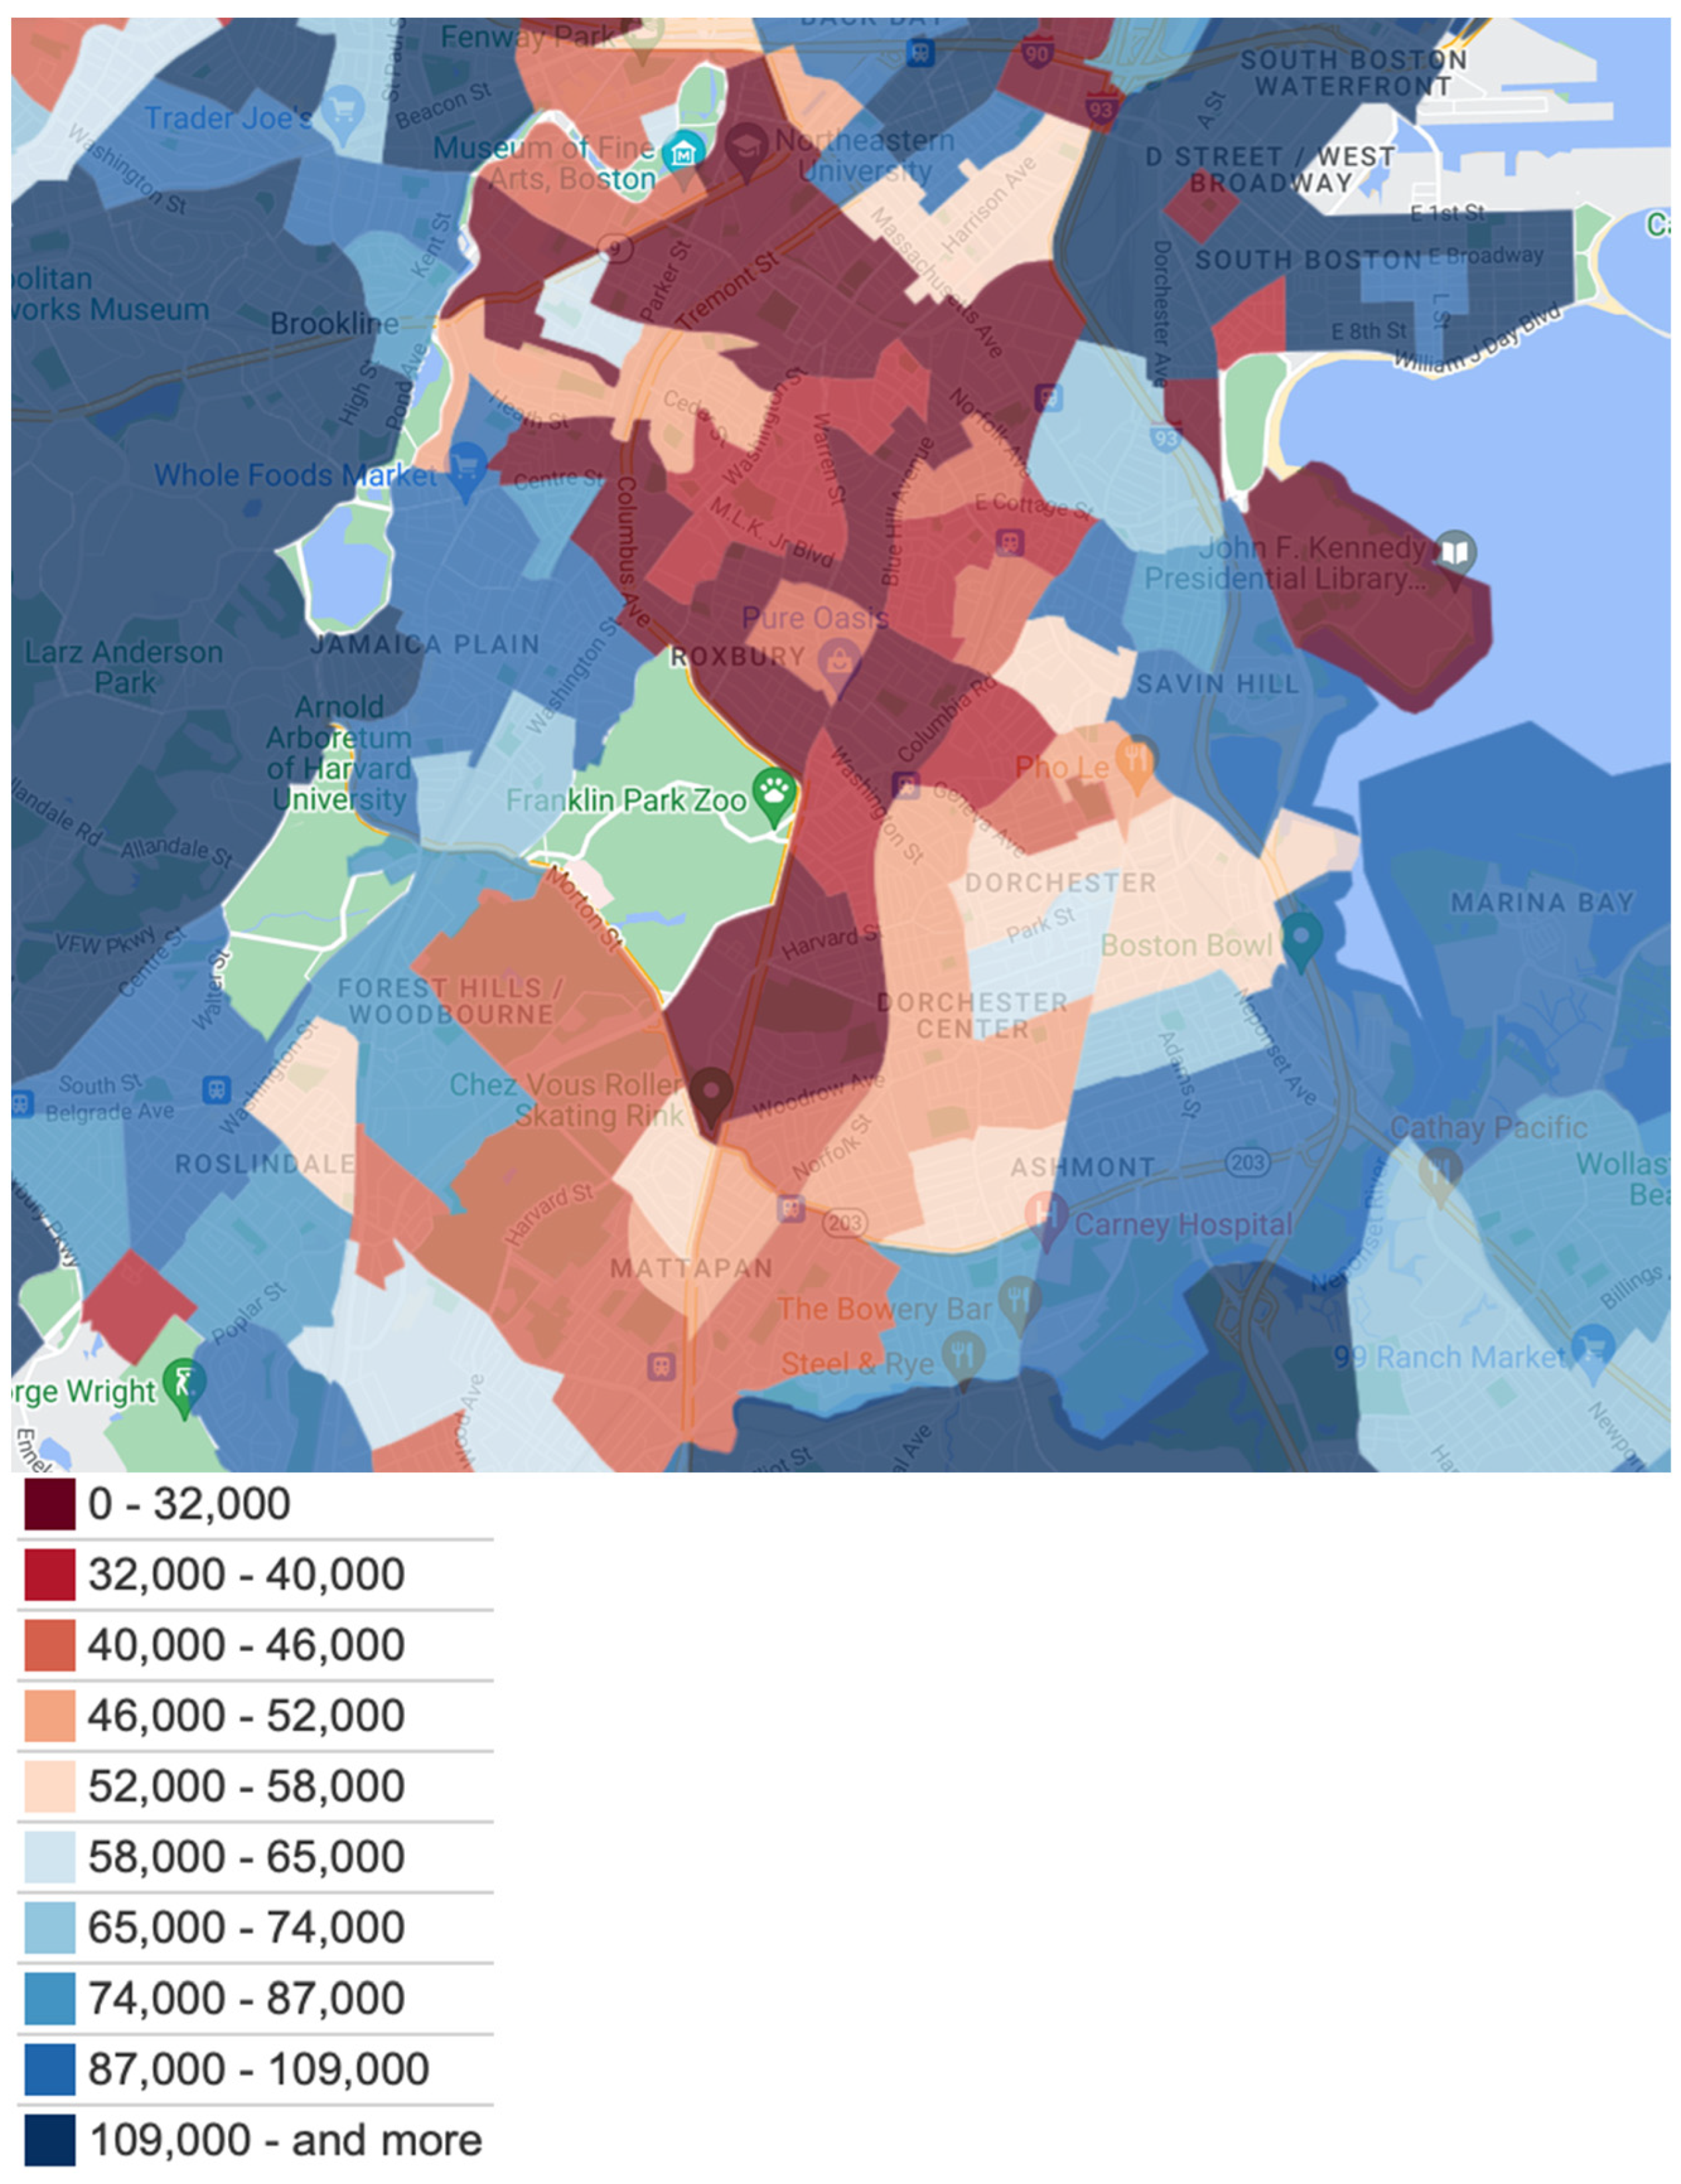
Figure 2.
Median household income of residents in 02121 and neighboring zip codes in 2020 (unitedstateszipcodes.org (accessed on 18 April 2023)).

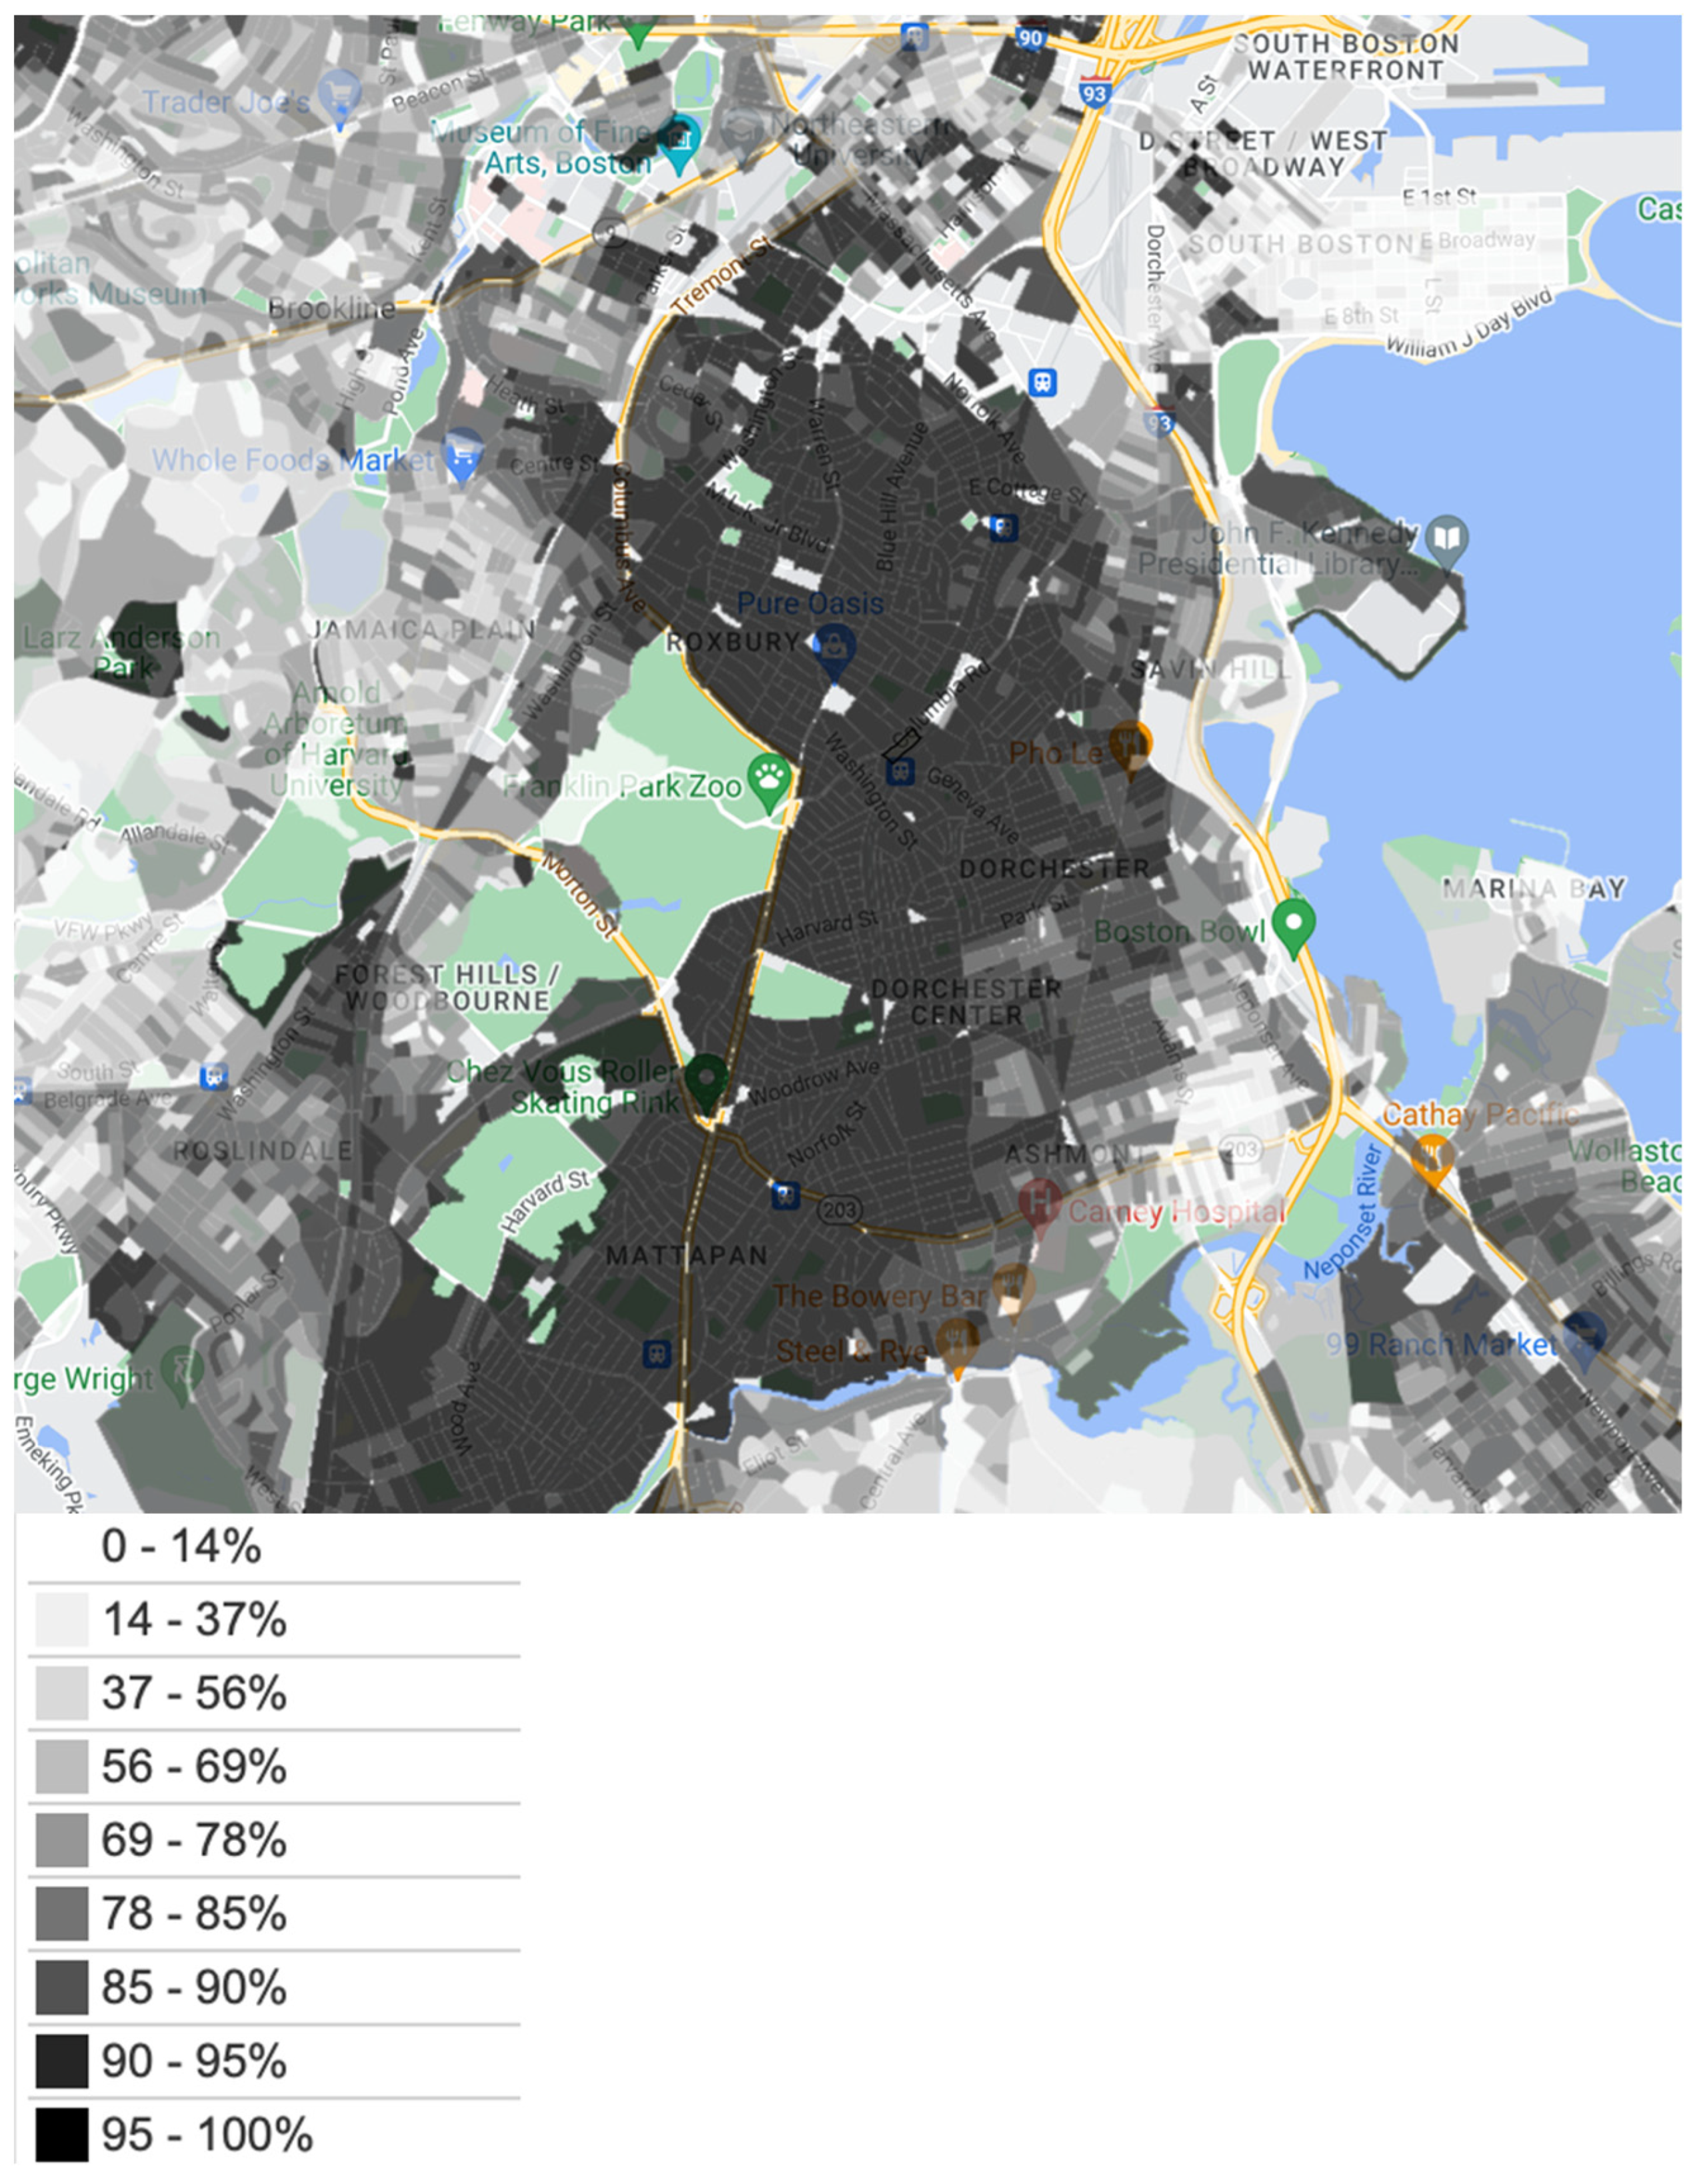
Figure 3.
Non-white population of residents in 02121 and neighboring zip codes in 2020 (source: Justicemap/Sunlight Foundation based on US Census 2020).
5. Scene 2: A Data Composition Process
Jonathan: I’m going to ask you to make a 3-minute piece using this data, with the following requirements: use all nine Viewpoints; five numbers spoken out loud; no visual representation of bar charts; and no fewer than 15 seconds of chaos. These are minimum requirements, so you can include anything else you want. You have 15 minutes to work. Go!
Undergraduate ensemble members HALLE, DONOVAN, and FINN sit on the floor with MICHAEL, who is serving as Data Dramaturg for their Composition. From a corner, DANI watches them and scribbles down everything they say. They stare at a handout with Figure 1 and Figure 2 printed on them.
Finn: That’s so cheap for a studio.
Halle: A studio costs $2000–2200 now; how is it possible that there’s a studio under $200?
Donovan: But we know from redlining that in Black neighborhoods it’s not like Beacon Hill.
Jonathan: You are six minutes into a fifteen-minute work session.
Donovan: There is a lot of low earnings in this area.
Halle: There is a lot of ambiguity in the data.
Donovan: Income 0 to 32,000; how many people are really at or close to 0? Those census tracts are 95% Black people.
Finn (pulling up a real estate website on his phone): Right now the cheapest available unit on websites is $1200.
Halle: Hang on, look at the “y” axis and the number of units. There are very few studios period. That doesn’t mean the ones that are affordable are ever actually available.
Donovan: Some studios might not ever be rented out through a website. Some people might just rent them to family.
Finn: If I had a $300 studio I’d never move out.
Michael: This is a pretty good representation of what a city would do, to give to people. It is hard to understand. That’s one of the reasons we’re doing this project, to communicate data to people so they immediately understand the relevance of the data to their lived experience.
Finn: Should we represent the confusion of figuring out what this means?
Jonathan: I recommend trying stuff.
Donovan: Let’s pick some numbers. Amount we can pay in rent? I’ll be zero.
Finn: 300.
Halle: I could be “over 1000”…
Finn: No, you’re right, the White man should be “over 1000”.
Halle: 300.
They stand up, staring at their handouts.
They look at each other and then get in a line.
Donovan (slumps over as if his spine has entirely collapsed): Zero.
Halle (slumps over partway, as if her spine has contracted): 300.
Finn (stands up tall): Over 1000.
Michael: Is that too much like a bar graph? How can we show the data so people can do something with it?
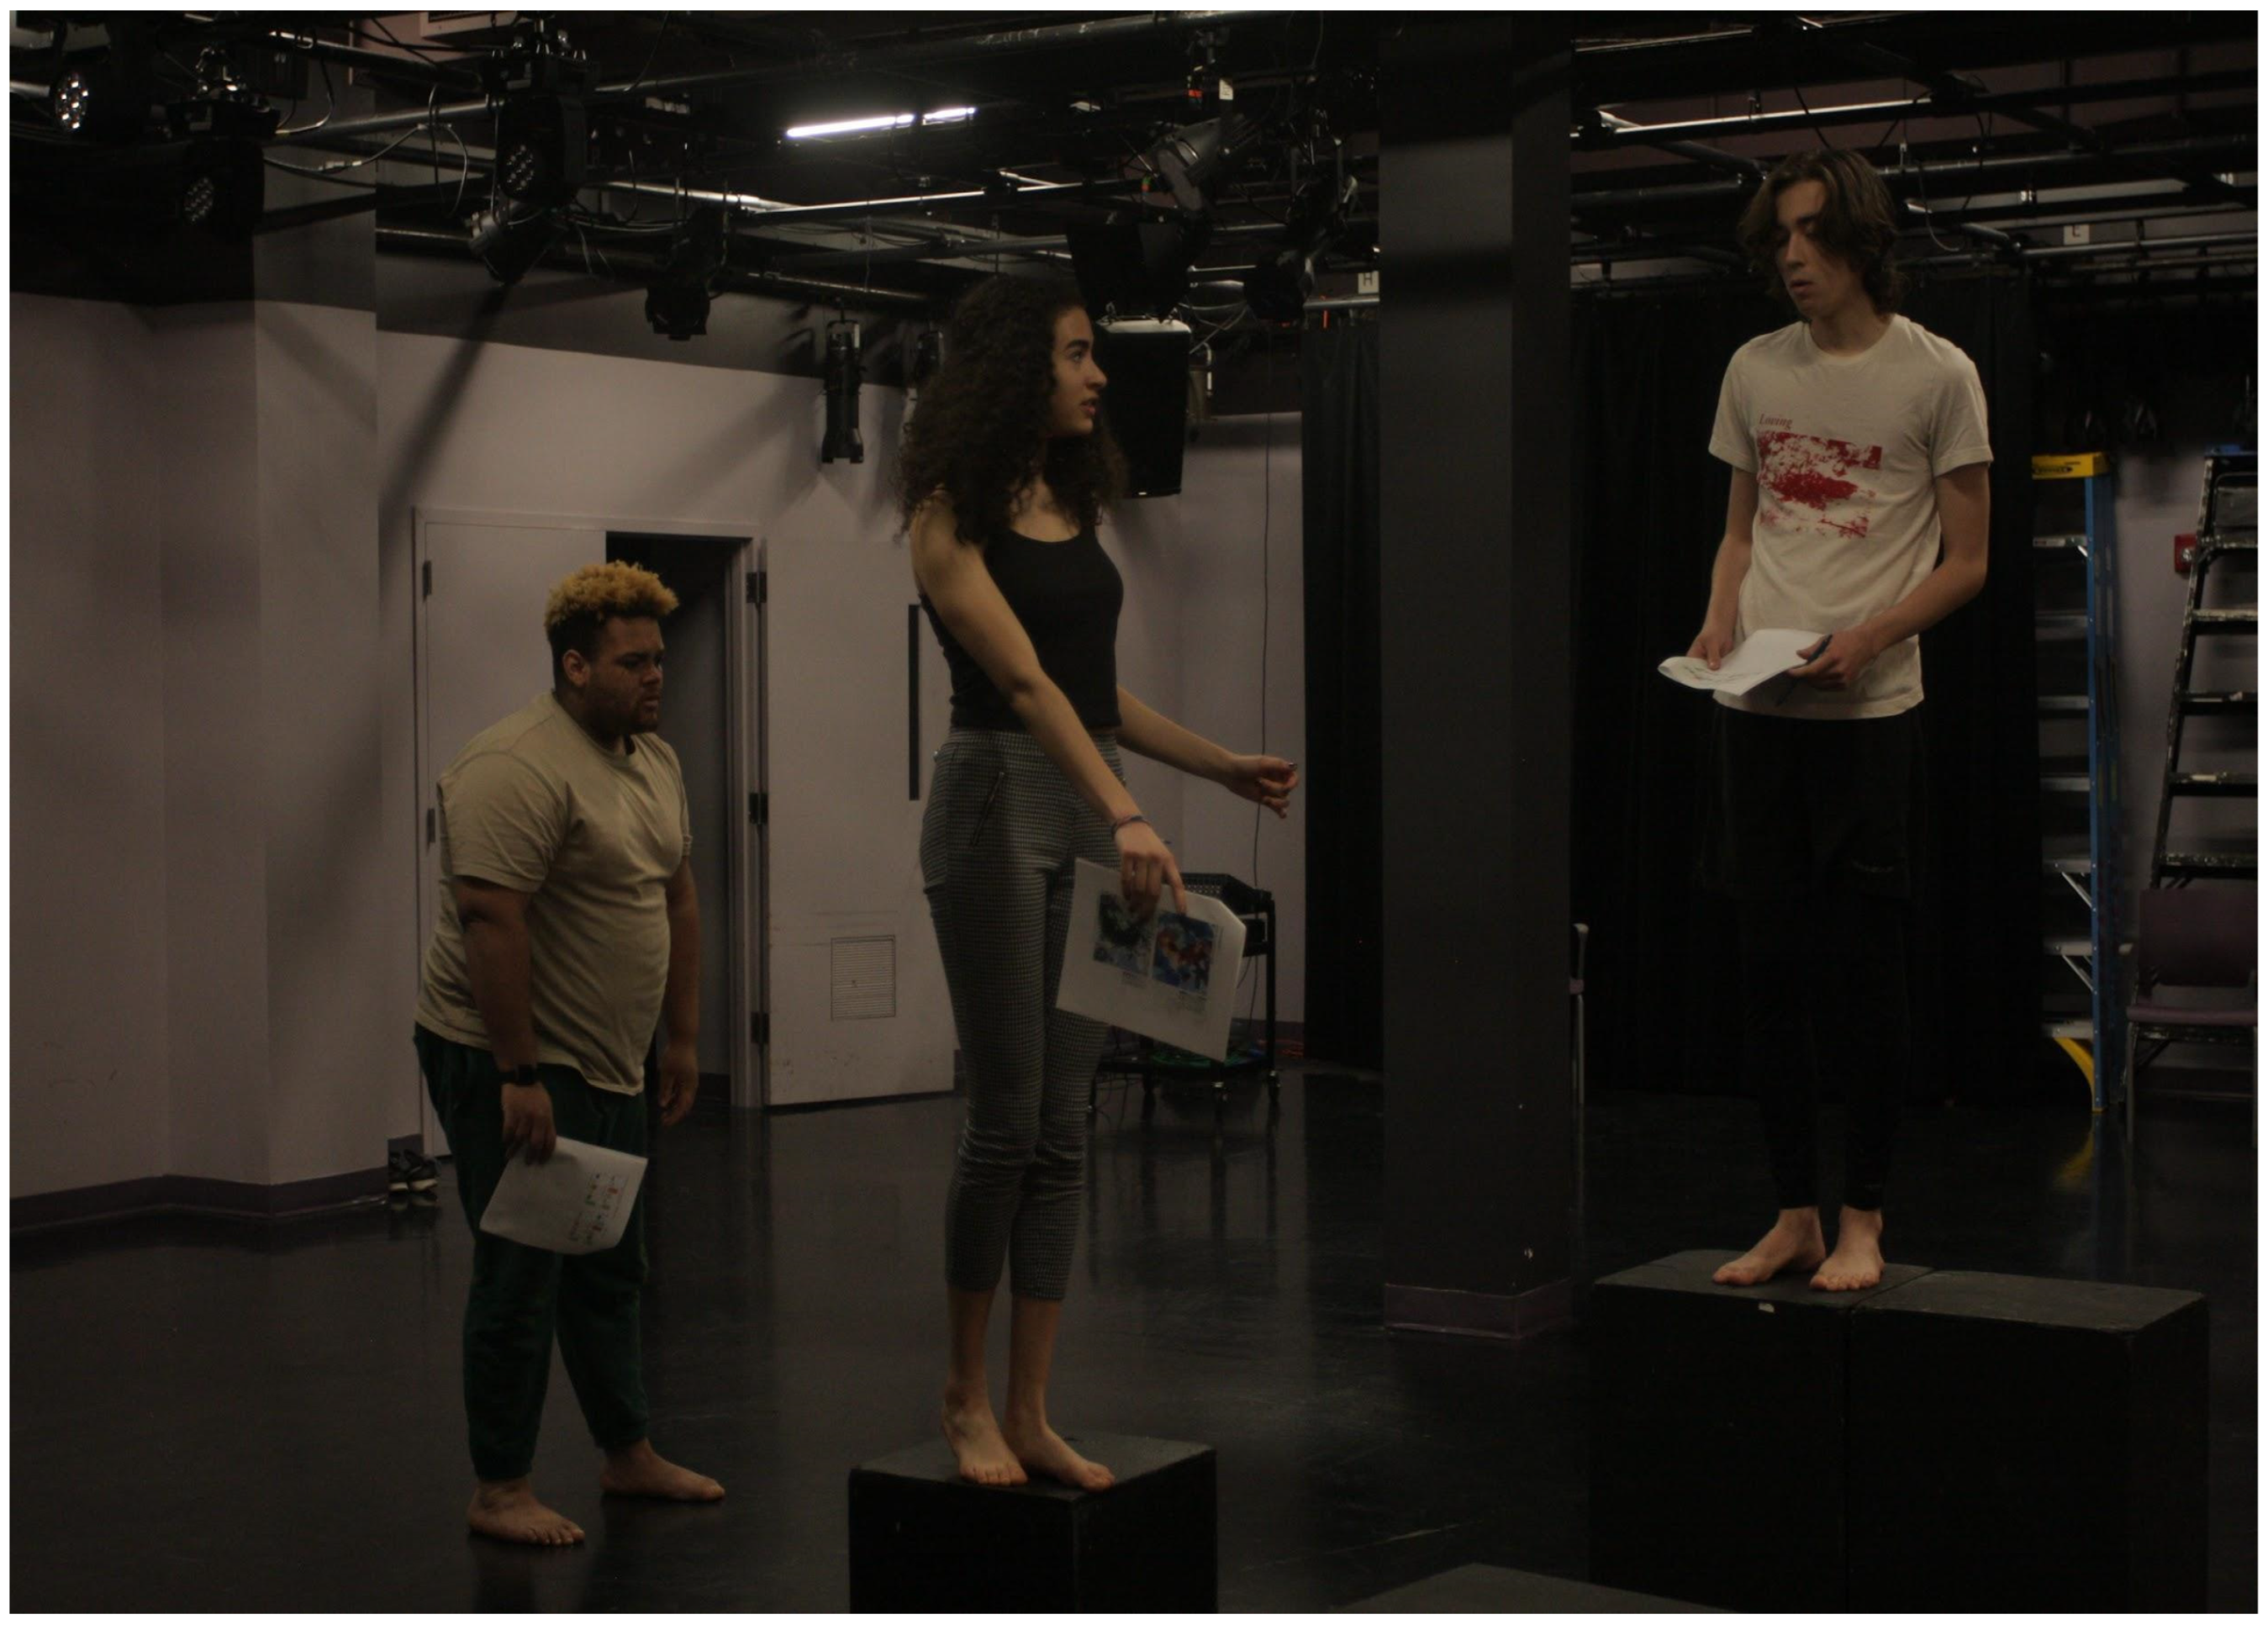
DONOVAN, FINN and HALLE pull out acting cubes (weight-bearing wooden boxes used in theatre classes and rehearsals) and build a structure they can climb on (Figure 4). After attempting and discarding several different configurations, they put the acting cubes in an arrangement that makes it impossible for DONOVAN to jump from one block to another.

Figure 4.
Donovan, Halle and Finn work on their data theatre composition, 25 April 2023. Photo credit: Dani Snyder-Young.
Donovan (attempting to jump and not making it): I can’t afford this.
Halle (climbs with difficulty onto the smallest block, attempts to move around and does not have enough room to move): I can’t afford this.
Finn (moves fluidly through the field in which the blocks are placed and climbs up onto one, then steps from one to the largest block): Over 1000.
Donovan: We’re getting somewhere.
Halle: What’s the best spatial relationship to reflect the inequality?
Jonathan: Are you ready? If I tell you to do it right now, can you do it right now?
Donovan: We can do it right now.
Halle: We’ll figure it out.
Finn: We’ll do something.
Jonathan: Amazing! Let’s do it now.
Halle: Audience is over there.
JONATHAN, OLIVER, VICTOR, DANI, RAHUL, MOIRA, MICHAEL, LAURA, GEORGE, REN, SYDNEY and ZEKE sit where HALLE tells them to and watch.
HALLE sits on the floor, and DONOVAN lays down on the floor next to her.
FINN walks a languid, confident walk winding in and around a small, a medium, and a large acting cube set up in a scalene triangle formation. He winds his way to HALLE and DONOVAN and looks down at them.
Finn: Hey, you feeling good, feeling ready for the day? No response. He crouches down to be closer to them. Let’s see what we have here. He pulls out a pen and paper as if looking down a list.
Donovan: Zero?
Halle: Three hundred?
Finn (sighs heavily, consults his paper and springs up): Three hundred! Let’s work with that. (He winds his way to the medium-sized acting cube. HALLE follows warily. Finn studies the cube, shakes his head and then winds his way to the smallest acting cube. He nods to HALLE, and HALLE stands on the cube. It is so small that she cannot take a step in any direction.)
Donovan: Zero?
FINN pointedly ignores DONOVAN. He reaches down to HALLE’s cube and shifts it a little, causing her to almost lose her balance and topple over.
Donovan: Ninety-five percent…
Halle studies the distance between her tiny cube and the medium-sized cube. She reaches out her foot to try to take a big step to reach it.
Finn (stopping her): Now this is one of the affordable options we have available. 300–400?
Halle: 300.
Donovan (stands up, insisting on FINN’s attention): Zero!
Finn: Options here? (He points to the medium sized cube, which is now the smallest one that is unoccupied.)
Donovan: I can’t afford that.
While FINN is paying attention to DONOVAN, HALLE quietly takes a really big step and gets herself over to the medium sized cube. FINN notices that the smallest cube is unoccupied. He kicks it away from the other two cubes with disdain. He looks at DONOVAN and points to the tiny cube. DONOVAN, who is a physically larger man, takes a breath and steps onto the tiny cube. He barely fits on it.
Finn: There you go! How are you feeling about that? Good? Good. (He clicks his pen.)
Donovan: I can’t afford that.
FINN gestures DONOVAN to get down from the cube, and then he moves the cube away. Finn shrugs, winds his way back through the field of cubes and stretches out in a comfortable-looking chair in a distant corner of the room, as if relaxing at the end of his workday.
Donovan: Zero. (He curls up in a ball in an opposite corner of the room from the one FINN retreated to.)
JONATHAN, OLIVER, VICTOR, DANI, RAHUL, MOIRA, MICHAEL, LAURA, GEORGE, REN, SYDNEY and ZEKE applaud. DONOVAN, FINN and HALLE join them.
6. Scene 3: Numbers Are People Too
Jonathan: What was it like to make the composition from the data?
Halle: The data that we had felt so incomplete. The data had one generalized category of $1000+ while the bulk of the represented data was under $1000, so it was hard to tell what that spread really looked like. Like we all—we’re coming with knowledge as people who have tried to rent in Boston. I mean, I haven’t, but people close to me have and we’ve seen that like… everything is pretty much in the over $1000 range. How do we represent the lower numbers when we know that like such a small percentage of the data we’re looking at is actually broken down?
Finn: Well also, any housing that is affordable is not going to be given up. And so, there is no housing. There’s just… if you’re trying to find it under $1000, it doesn’t exist.
Jonathan: I’m hearing you say, even though you were making something just from numbers, it was important for you to put something around the numbers.
Donovan: Yeah, for context.
Dani: And you filled that in from your own experience?
Finn, Halle and Donovan: Mm-hmm.
Dani: In a community workshop, we’d have people with us who were more closely connected to the data, who could supply context from their own experience. That’s ultimately what we’d want to be doing. But we can’t really do that until we understand how to make theatre from data, so today it’s just us trying to work out an approach. It’s imperfect.
Halle: We couldn’t just go off of the graph that was supposed to be for the piece; we had to also use the numbers from the maps in order to contextualize it. And even then, it didn’t feel accurate to us, but it’s what we had to work with.
Laura: A couple of weeks ago, we came to your Viewpoints class with data on food insecurity and asked you to do a composition like this one but you also had direct quotes—qualitative data—to incorporate. Speaking the quotes made people feel uncomfortable.
Ren: It felt unethical to represent people whose lived experiences we didn’t share. We didn’t know who the people were, what their lives are like, or what motivates them. We were just fabricating our own context based on stereotypes of food insecure individuals, which didn’t feel like it respected their actual experiences. Even if some of us do share these experiences, the direct quoting of someone else’s words without their explicit permission felt like a co-opting of their story and their self-autonomy to tell it themselves.
Sydney: We’re so conscious of culturally appropriate representation when we’re casting plays that have already been written, it also feels unethical to put my White body in a role representing the experiences of a person who is probably BIPOC, because that would misrepresent an important power dynamic in the data as well as appropriate their experience. The ethics of representation matter.
George: RbT has a number of commitments and a key one is ethics. Different from theatre for public consumption, RbT places care and ethical considerations of community partners it collaborates with at the forefront. Decisions on moving the process forward are done in collaboration with the community partners making sure they agree and are comfortable with the approaches used by the artists and researchers (Cox et al. 2022; Michalovich et al. 2022).
Jonathan: For us it’s become a kind of baseline rule not to slide seamlessly into the role of a character we could not honorably represent.
Moira: How was this different? Was this different?
Finn: I felt more like I was representing a power dynamic in the data more than a person person.
REN and SYDNEY nod vigorously in agreement.
Rahul: You were representing the impacts of the data on humans. Taking a step back, typically when other people are playing with this type of stuff, you see a representation of the chart in some physical manifestation. So, in this case it would be like, number of housing units. You made a representation of the impact of the data itself. It’s not captured in the data but the data makes you think about it.
Donovan: We still attached those impacts to our bodies, and we weren’t realistic characters, but to an audience we still seemed like characters, right?
Jonathan: This was emotionally powerful without having any overt characters. And there’s an ease—and therefore a danger—of attaching emotionality to an arbitrarily selected narrative. It brings up an important point—the responsibility to be rigorous and find something nuanced, because of that.
Laura: What does “rigor” look like in this context? I suspect data scientists and artists think about it differently.
Jonathan: We need to work deeply with a group and vet our efforts with them in an interactive way so that we are getting as close to something real as possible. We can make meaning so quickly and powerfully without really understanding it, so without rigorous accountability to the people the data represents, the meaning can run away from us and assert things that we don’t know, are misguided, and/or we can’t honorably represent with our bodies.
Donovan: We’re arbitrarily selecting a narrative because the quantitative data by itself doesn’t give us enough context.
Moira: Quantitative data is always an abstraction of human experience; every data point in a data set represents that number of humans who answered a question the same way. All of the lived experience, all of the relationships, all of the feelings, all of the stories that power the reasons the human answered that question in that way—that all gets stripped out in order to be able to aggregate, to be able to share a large volume of information.
Dani: I think you just helped me understand why we’re so skeptical of quantification in theatre and performance studies! We value the affective, the relational, the motivation powering human action. Like you just said, the quantitative strips all of that out. And what we’re trying to do with the data theatre is to put it back in. Most RbT works from qualitative data sets which are relatively small. But we can look at the patterns in the large data set, and then find the particular and the story in the pattern.
Michael: In this process, the transformations the data goes through really are incredible. The data acts as “freeze dried” representation of human thought that gets reconstituted in the workshop.
Rahul: It is amazing that theatre so quickly re-humanized the data. Numbers can be abstract and create distance between us and the people the numbers represent, especially in aggregate data. You brought it back to people.
Dani: The story functions as the subtext of the data.
Rahul: Every dataset contains a multitude of stories that can be told about it.
Moira: To do it ethically, we need to collaborate with the real people whose lived experience is represented in the data.
Jonathan: Numbers are people too.
7. Scene 4: Embodied Data Contextualization
The research team and acting ensemble gather in a circle around ABBY.
Abby: So the tension is now we’ve created this big green beautiful neighborhood asset and so now people want to come into the community and it drives up housing prices so people who have been the long-term stewards need to leave. It’s actually a lot of housing policy. What’s considered affordable, where things get built, how tall they can be, how many units they can have, generally the rents. You talk to a developer and it’s all about math. And so when you follow those links, greenways are actually all about math. The tensions are in telling that story and trying to pinpoint inflection moments of change.
Everyone nods.
Dani: Let’s try a series of participatory dramatic activities of the sort one could do with community members to solicit their stories, their input, their lived experiences in relation to the data. The actual material that will come from this group is material that will come from this group, which means that it will be less relevant to a community group. Because it won’t reflect their interests and experiences, it will reflect ours—and that’s because today we’re interested in developing a process, as opposed to having a product that is finished.
Everyone nods. Music plays, a montage of activities:
Jonathan: Find a way in your body to represent a piece of data as one member of this large team, as we build a data statue together about this bar chart entitled, “What stops you from visiting parks and open spaces near your home?”
ABBY throws her body into the center of the space with enthusiasm and puts her body into a yoga bridge pose. One at a time, everyone else adds their body into the statue she has initiated, until the full group is included.
Dani: Tell a story about a time you experienced an obstacle represented in this chart.
Everyone pairs off and makes a paired shape of storytelling and listening.
George: Start with an image of your organization as a bridge between community stakeholders and policymakers, and then we’ll build off of that and animate pieces of the image.
Half of the group makes an image representing “community members”, half of the group makes an image representing “policy makers”, and ABBY makes a shape between the two embodying the bridge (Figure 5).
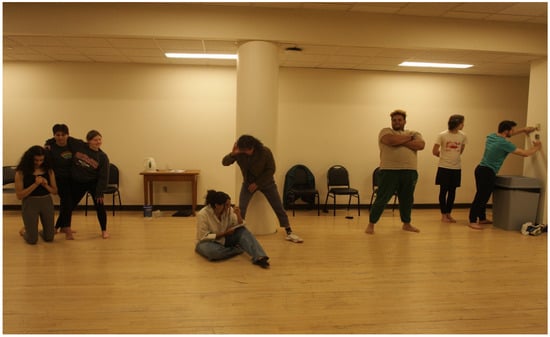
Figure 5.
Workshop participants in image theatre exercise, 25 April 2023. (Photo credit: Dani Snyder-Young.
Jonathan: I never expected that participatory theatre session to be creatively fruitful. Rather, I just expected it to be the engagement tool. Those exercises were both a way of breaking down barriers and a way of bringing people together, but also a pump for material that can be sourced into the more finished piece.
8. Scene 5: Data Dramaturgy
The lights shift and the space is awash in blue and green; hopeful, pastoral music begins. The acting ensemble enters, performing gestures as if in a public park. HALLE walks leisurely along a path; ZEKE jogs up from behind her and jogs around her, surprising her and continues blithely on across the stage. DONOVAN throws a ball and sits under a tree, watching the day go by; REN looks on the ground for a rock to add to their collection. ZEKE jogs back through the space, repeating his earlier route.
Dani (to Jonathan): Are you ready to integrate text? We pulled a bunch of relevant.
Rahul: qualitative data from published studies.
Victor: poetry, which is arts-based data.
Michael: housing policy language.
Dani: and a web form that feels like it wants to be a scene.
Jonathan: Hey team, come take a look at all these goodies. Find one or two pieces from all this text that you think should come out of your mouth.
The actors crowd around a table with printed source material. They sift through pages, highlight passages, and one by one peel off with a page and resume their physical score, integrating a line of qualitative data into their action:
HALLE enters, walking leisurely along a path; ZEKE jogs up from behind her and jogs around her, surprising her.
Halle: “I live in this neighborhood too!” (Holt et al. 2021).
ZEKE does not hear her and continues blithely across the stage.
Donovan (throws a ball and sits under a tree, watching the day go by): “I need the contact with the green (nature) to keep me balanced” (Viebrantz and Fernandes-Jesus 2021, p. 8).
Ren (enters and picks up a rock. They notice a sign and read it.): “Greenways are high quality active transportation, recreation & public space corridors that support walking, biking and rolling for people of all ages and abilities. The City is looking to expand and intensify the current network of greenways” (City of Vancouver 2023).
ZEKE jogs back through the space, repeating his earlier route.
Donovan (watching ZEKE): “So here we are, the long-awaited sequel to white flight. White return” (Harrison and Carrol 2017).
George: This is an unusual way of making Research-based Theatre. Usually, we start with text, use it to develop a character-based script, and then put the script on its feet. You’re building a movement-based piece of expressionistic composite characters and then fleshing them out by layering in text.
Jonathan: That’s a feature of Viewpoints as a methodological approach. It doesn’t start from character, it starts from a formal place, looking dance-y, and the human is what happens in the audience response and sense-making.
Dani: We’re instinctively gravitating towards qualitative data. Can we pull some of the quantitative data back in?
The actors return to the table of printed source material, take new pages and reorganize into a new scene. They read the scene:
Sydney: Everyone should have access to a home, regardless of their income or background. There’s lots of information about affordable rentals and homes in the City.
HALLE enters, with DONOVAN kneeling next to her on the floor, as if he is her child.
Sydney: How many people live in your household of any age?
Halle: Three.
Sydney: What is the total combined income of all three people who live in your household before taxes?
Halle: 300. (She stops the scene and looks at the research team) I’m just saying that because it’s from the composition we did yesterday. What number should I use?
Dani (hopping up to data dramaturg): Let’s look at the city’s table with affordable housing information (Boston Planning and Development Agency 2022). It lists income levels for different household sizes as a percentage of the area median income, and then housing that’s been set aside as “affordable” is only available to people under a certain percentage of that area median. Everything currently available, according to the website, is listed at 80%, so a family of three with an income of up to $100,000 is eligible.
Halle: So working-class families are just screwed.
Dani (gets out her phone and uses the calculator): If minimum wage is $15/h times 40 h/week times 52 weeks/year that’s $31,200/year. Times two earners is $62,400/year. Working-class families are just screwed.
Halle: I’ll round up to 63. Can we go back?
Sydney: How many people live in your household of any age?
Halle: Three.
Sydney: What is the total combined income of all three people who live in your household before taxes?
Halle: 63,000.
Sydney: Yearly or monthly?
Halle (physically responds to the idea that this could be anyone’s monthly income. She leans backward, and DONOVAN takes her weight on his shoulder and remains in this bent-over-backward position): Yearly.
Sydney: Given your income and household size, please search for homes listed at 65% AMI and above. Note that minimum income restrictions apply and are listed in the unit details. We have homes that fit your income. (HALLE stands back up tall in response.) We have a one bedroom for $1750/month in Natick (a suburb 17 miles west of the city).
Halle and Donovan: Natick!
Sydney: A one bedroom for $1660/month in Stoughton (a suburb 20 miles south of the city).
Halle: Stoughton! (takes a breath) Two bedrooms?
Sydney: A two bedroom for $2000/month in Plymouth (a town 40 miles southeast of the city).
HALLE sinks down, giving all her weight to DONOVAN in a shared shape of despair. Behind them, REN and ZEKE build a tower of acting cubes, a new housing development HALLE’s family can in no way afford.
Dani (approaches JONATHAN quietly): Right now we’re using the quantitative data mostly as background information. Can we see what happens if we make it more overt? What if we staged one of the bar charts?
Jonathan: That’s so funny. It’s the opposite of what we had them do in the compositions earlier, but let’s see what it could be. Which chart would be good?
Dani: How about this one (Figure 6): “I wish I had a place in my neighborhood to…”
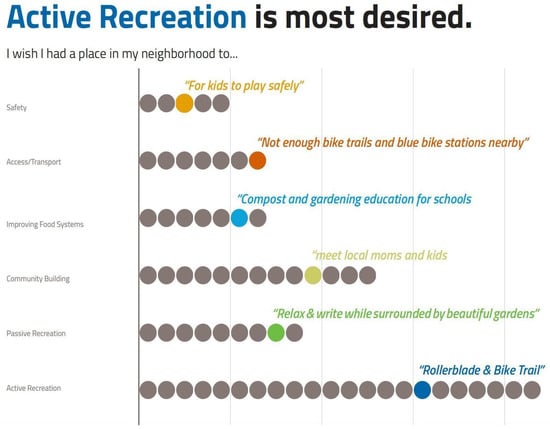
Figure 6.
Boston open streets data for DoT Greenway, [REDACTED], 2023.
Jonathan: Fantastic. That could help us get to an ending. (to the actors) Let’s have a group of you leave the rental scene and cross downstage. (as they start to assemble one at a time) And oh! Don’t all get there at the same time. The chart represents different numbers of people with a certain response, so can you arrive in groupings that reflect the numbers in the chart? (They get ready to try.) Halle, we’re focused on you, so can you break us out of the previous scene? Just step forward and announce the chart and we’ll try it from there.
Halle: I wish I had a place in my neighborhood…
Ren (taking the chart from HALLE and crossing downstage right): For kids to play safely.
Zeke (joining REN): Not enough bike trails and blue bikes stations nearby.
Halle (joins them, now three voices together): Compost and gardening education for schools.
Sydney (joining, now four voices together): Meet local moms and kids.
Jonathan: Let’s switch the order of them so the biggest one comes here, and then we’ll do the last one with a smaller group as some of you start to exit. Can you exit along the path, back the way you came?
Donovan (joining, now five voices together): Rollerblade and bike trail.
SYDNEY and ZEKE move away.
Ren, Halle and Donovan: Relax and write while surrounded by beautiful gardens.
Dani: It’s so great, because the number of people in the moment directly corresponds to the actual data in the chart.
Jonathan: It’s literally data theatre.
One by one, all of them begin to exit, with DONOVAN left strolling slowly and optimistically through the park as the lights and music fade.
Dani: In data theatre there’s a relationship between the theatrical artistry and the data. As we’ve been playing, we’ve sometimes been over on the artistic/interpretive end, making work inspired by the impacts of the data and the story running under the data, and at other times working really closely with the nitty gritty details of the data. We’re looking to find a kind of middle ground that has both enough theatre artistry and enough data. Right now, we’re pretty far on the artistic/interpretive end, and everything is data-inspired with some embedded data details. But integrating the data into the storytelling isn’t as strange as I thought it would be. The quantitative data works just like any other source material in the devising process.
9. Scene 6: What’s Next?
Dani: In our conversations over the past few months, again, the holy grail has been giving some kind of form to hard quantitative data. Do we feel we’ve come closer in that direction?
Rahul: I think that to me, the idea of treating a data set as input to the theatrical process and then as part of the performance, I think it’s definitely within the target that I had painted on the wall. But, I don’t think that has to be people up there saying, like, 25%, 35%. That’s not what data means to me in my head. It’s a span of things that go from narratives that were inspired by a finding that was found in data to somewhere in the middle that we saw now where there were elements of qualitative and quantitative data mixed into a performance and a narrative that came out of discussion with key stakeholders. The data that we’re looking at did not tell us that green space development is intentioned with displacement and gentrification. Our community partner did. So, we started with her narrative, which to me is totally the right thing to do. They have a point of view. We are in collaboration with them. Our piece should reflect their understanding of it.
Dani: Learning how to engage with the human story in the numbers helped me be less scared of the numbers. The numbers are less scary than I thought they were.
Michael: I’m still thinking about how we can demonstrate impact in the community. What would be outcomes that we would tie back to this activity? Would it be policy changes? Would it be changes of perception among community members who saw the piece? Durable changes of perception among community members who saw the piece?
Halle: It feels like we’re just scratching the surface. It was important to have long conversations with Abby about what the data meant, and to explore it with her yesterday in participatory dramatic activities. Because just seeing the data, we had a lot of questions. And, without talking to the people who made it, I don’t know if we ever would’ve gotten those answered.
Zeke: Doing many different activities with different pieces of data helped us see the nuance and the multi-faceted tension between different goals. Exploring how that is completing the space we actually see and observe in the survey responses, governmental agencies, and actions was really, really helpful.
Michael: This was really fun with a room full of theatre majors, but will community stakeholders be as enthusiastic about the drama activities?
Dani: Drama workshops with people who already don’t do a lot of theatre have a different vibe than workshops with theatre majors, but applied theatre has robust traditions for participatory drama work. We can build a scaffold of low-risk and low-focus activities that give people space to explore without putting them on the spot to “perform.”
Moira: Many people might feel intimidated by having to “perform.” This experiment is about providing different avenues to make sense of data, to fit with diverse stakeholders that may feel left out in more traditional planning processes, and in this way level the playing field across people with different skillsets and levels of comfort.
Rahul: I’d like to emphasize the fact that the more that the stakeholding participants are involved in the process, the better. And, I think we went a long way yesterday in doing that. But, I would love to have the opportunity to really involve and engage them in an increased integrated way. I think that’s really important and valued.
Michael: The people who have been missing from this process is the community. It’s great to work with the mid-level organization, but in our next iteration, I’d like to get beyond that to the people they serve.
Dani: I think any full production would need that. We’ve been talking about representational ethics a lot, and I think part of the representational ethics is having that iterative, that recursive community check be part of the process. Without it, this is just a classroom exercise.
Donovan: It’s important to make sure we’re not just using this for our own benefit and to continue informing about the people and the situations that are being affected.
Jonathan: I think the gift of these couple days to me has been people’s generosity with the fact that we’re going to show you something unfinished. That’s embarrassing, and I think you guys really received it in the spirit it was intended. The next step for me would be to create the conditions by which we can make a piece that is polished and intentional throughout the process and not just in the beginning stages of it.
Dani: I’m hearing some consensus about some next steps. There’s interest in moving forward to develop a more polished, fuller production that is community partnered in a fuller way, that is for an audience in a perhaps real run. And we also need a long enough artistic development process to really figure out how to integrate more hard data in a theatrically effective way. To do that, we need to come up with some money. And that’s not an impossible task. So, stay tuned.
10. Epilogue: Six Months Later
DANI and ANGELIQUE walk on a path through a public park adjacent to their university campus.
Dani: LivableStreets is giving us some options of community groups we could do the workshop with. We were hoping the Humanities Center would give us more money, but the funding is enough for one workshop, and that’s a start. The thought is to hook it into the project LivableStreets is doing to engage community members in the city’s plans to redevelop this park, and to do a bilingual workshop with a primarily Latinx-serving youth development organization in the neighborhood. The Public Art for Spatial Justice grant proposal is due in December, and if we get it we could do workshops with a couple more groups and then use the things we learn to do a scrappy site-specific production with deliberation sessions. That would at least let us see what a full iteration of the data theatre process looks like. Um, I think that catches you up. As the newest member of our team, what questions do you have?
Angelique: What do you feel like your big takeaway is from the workshop you did last spring?
Dani: For me as a theatre artist, that it is possible to make theatre out of quantitative source material. It’s not like we are usually trained in quantitative research, and I was really intimidated by quantitative data when we started the project. That said, the lack of formal training in quantitative data is nothing to be ashamed of! It opens up interdisciplinary research opportunities, making space for humans with strong data literacy who often don’t think to engage with theatre departments or projects. With a data dramaturg in the mix to help support quantitative interpretation, devising with quantitative data is not different from devising with qualitative or archival data.
Angelique: Interesting, how are you defining “data dramaturgy”?
Dani: Data dramaturgy is the practice of translating and contextualizing quantitative data for theatre-making purposes. In our workshop, the team members with strong quantitative skills did most of the data dramaturgy. But by the end, I had built enough data literacy and familiarity with the data we were devising to do some too.
Angelique: I am curious about how community members, who may not be used to theatrical engagement—will they feel comfortable to participate? I wouldn’t want to assume that everyone we plan to engage with will be comfortable interacting immediately.
Dani: I’m not super worried about that part; participatory drama work with community participants is pretty common applied theatre practice (Prentki and Preston 2009). The key with any new group is to scaffold a sequence of low-risk, low-focus activities that enable people to build trust in each other and with us, gradually working towards higher focus activities, and giving everyone a range of accessibility options to engage in the ways they can engage. When we get back to my office I can loan you Boal’s (1992) Games for Actors and Non Actors, which has tons of low-focus activities and scaffolded sequences we can adapt.
A bus passes by.
Angelique: Oh, okay; in that case, is it safe to assume that audience members will be familiar with non-narrative aesthetics? Since this work the team has done so far is heavily built upon postdramatic aesthetics, and drama work with community partners tends to center those partners’ aesthetic preferences.
Dani: That’s a really good question. I don’t really know the answer yet. There are community-based theatres like Albany Park Theater Project in Chicago that do gorgeous non-narrative work, but they work with participants for years on end and have built a loyal audience working in the same neighborhood for decades. I don’t want to assume too much about how community participants and audience members will respond to this work, so we will have to see what happens and be flexible to adapt and reimagine how we use data theatre processes to best serve our community.
Angelique: With that being said, the audience, spectators, and community members specifically, regardless of their knowledge of theatre and/or research-based, data-driven theatre, will make their own meanings and assumptions of the work- of the play, that is not a play, but lets people play. It is our job as researchers and creatives (in this work, the world blends together) to give our community members enough character-driven details to recognize the people we represent. We have to go beyond the status quo. We must be the reflection of our community. Our community is smart; we are not worried about them not being able to keep up with us or the work. We need to keep up with them!
Dani: That’s for sure!
Angelique: I believe in our community. The hope is that animating data in theatrical form enables community members to be able to deliberate over it and use it in ways that are helpful to them. In the future, we should look at the relations between data literacy and theatre and focus on supporting and uplifting community voices and bridge together both the arts and research fields.
Dani: I suspect there are applications of this work we haven’t thought of yet. There are limitations to what we can learn from a couple of hours playing with actors in a workshop. We’re going to learn a lot this winter from the data theatre workshop with community participants, and hopefully the grant will come through so that we can make a play and see how audience members use the data to deliberate.
Angelique: We can’t yet know what community participants and audience members are going to teach us. But I am excited to see where the work leads us.
Funding
This research was funded by a Northeastern University’s College of Arts Media and Design Seed Grant.
Data Availability Statement
The original contributions presented in the study are included in the article, further inquiries can be directed to the corresponding author.
Conflicts of Interest
The authors declare no conflict of interest.
References
- Arnold Mages, Michael. 2019. A Framework for Civic Conversations. Conference Proceedings of the Academy for Design Innovation Management 2: 238. [Google Scholar] [CrossRef]
- Belliveau, George, and Graham W. Lea, eds. 2016. Research-Based Theatre: An Artistic Methodology. Bristol: Intellect Ltd. [Google Scholar]
- Bertin, Bertin. 1967. Semiology of Graphics: Diagrams, Networks, Maps. Madison: University of Wisconsin Press. [Google Scholar]
- Bhargava, Rahul, Amanda Brea, Victoria Palacin, Laura Perovich, and Jesse Hinson. 2022. Data Theatre as an Entry Point to Data Literacy. Educational Technology & Society 25: 93–108. [Google Scholar]
- Boal, Augusto. 1992. Games for Actors and Non-Actors. London: Routledge. [Google Scholar]
- Bogart, Anne, and Tina Landau. 2005. The Viewpoints Book. New York: Theatre Communications Group. [Google Scholar]
- Boston Planning and Development Agency. 2022. BPDA Inclusionary Development Policy: 2022 Income Limits, Maximum Sales Prices & Maximum Affordable Rents Based on Area Median Income. Available online: https://www.bostonplans.org/getattachment/34a02540-18da-4eb1-8c0e-2d61575cb612 (accessed on 21 June 2023).
- City of Vancouver. 2023. “Greenways,” Vancouver Plan. Available online: https://vancouverplan.ca/greenways/ (accessed on 21 June 2023).
- Cox, Susan, Marilys Guillemin, Jennica Nichols, and Monica Prendergast. 2022. Ethics in Research-based Theater: Why stories matter. Qualitative Inquiry 29: 247–56. [Google Scholar] [CrossRef]
- Gray, Steven, Alexey Voinov, Michael Paolisso, Rebecca Jordan, Todd BenDor, Pierre Bommel, Pierre Glynn, Beatrice Hedelin, Klaus Hubacek, Josh Introne, and et al. 2018. Purpose, processes, partnerships, and products: Four Ps to advance participatory socio-environmental modeling. Ecological Applications 28: 46–61. [Google Scholar] [CrossRef] [PubMed]
- Harrison, Doin, and Kenny Carrol. 2017. Poem: Gentrification. Shelterforce: The Original Voice of Community Development. Available online: https://shelterforce.org/2017/10/17/poem-gentrification/ (accessed on 21 June 2023).
- Hedelin, Beatrice, Steven Gray, S. Woehlke, Todd K. BenDor, Alison Singer, Rebecca Jordan, Moira Zellner, P. Giabbanelli, P. Glynn, K. Jenni, and et al. 2021. What’s left before participatory modeling can fully support real-world environmental planning processes: A case study review. Environmental Modelling & Software 143: 105073. Available online: http://urn.kb.se/resolve?urn=urn:nbn:se:kau:diva-85356 (accessed on 21 June 2023).
- Holt, Sidney L., Ana María del Río-González, Jenné S. Massie, and Lisa Bowleg. 2021. “I Live in This Neighborhood Too, Though”: The Psychosocial Effects of Gentrification on Low-Income Black Men Living in Washington, D.C. Journal Racial and Ethnic Health Disparities 8: 1139–52. [Google Scholar] [CrossRef] [PubMed]
- Jarus, Tal, Yael Mayer, Elisabeth Gross, Christina Cook, Laura Yvonne Bulk, Laen A. D. Hershler, Jennica Nichols, Shahbano Zaman, and George Belliveau. 2022. Bringing disability experiences front stage: Research-based Theatre as a teaching approach to promote inclusive health education. Nurse Education Today 115: 105408. [Google Scholar] [CrossRef] [PubMed]
- Latour, Bruno. 2004. Why Has Critique Run out of Steam? From Matters of Fact to Matters of Concern. Critical Inquiry 30: 225–48. Available online: http://www.jstor.org/stable/10.1086/421123 (accessed on 10 December 2023). [CrossRef]
- Michalovich, Amir, Yael Mayer, Laen Avraham Dov Hershler, Laura Yvonne Bulk, Christina Cook, Hila Graf, Michael Lee, George Belliveau, and Tal Jarus. 2022. Through a glass brightly: Generative ethical tensions in Research-based Theatre. Qualitative Inquiry 29: 267–76. [Google Scholar] [CrossRef]
- Nichols, Jennica, Susan M. Cox, Christina Cook, Graham W. Lea, and George Belliveau. 2022. Research-based theatre about veterans transitioning home: A mixed methods evaluation of audience impacts. Social Science & Medicine 292: 114578. [Google Scholar] [CrossRef]
- Prentki, Tim, and Sheila Preston. 2009. The Applied Theatre Reader. London: Routledge. [Google Scholar]
- Snyder-Young, Dani. 2011. Beyond ‘an Aesthetic of Objectivity’: Performance Ethnography, Performance Texts, and Theatricality. Qualitative Inquiry 16: 883–93. [Google Scholar] [CrossRef]
- Vachon, Wolfgang, and Joe Salvatore. 2023. Wading the Quagmire: Aesthetics and ethics in verbatim theater Act 1. Qualitative Inquiry 29: 383–92. [Google Scholar] [CrossRef]
- Viebrantz, Petra, and Maria Fernandes-Jesus. 2021. Visitors’ Perceptions of Urban Green Spaces: A Study of Lisbon’s Alameda and Estrela Parks. Frontiers in Sustainable Cities 3: 755423. [Google Scholar] [CrossRef]
- Zellner, Moira, and Scott D. Campbell. 2015. Planning for Deep-Rooted Problems: What Can We Learn from Aligning Complex Systems and Wicked Problems? Planning Theory and Practice 16: 457–78. [Google Scholar] [CrossRef]
- Zellner, Moira, and Scott D. Campbell. 2020. Planning with(in) complexity: Pathways to extend planning with complex systems modeling. In Handbook on Planning and Complexity. Edited by Yamu De Roo and Christian Zuidema. Cheltenham: Edward Elgar Publisher. [Google Scholar]


Disclaimer/Publisher’s Note: The statements, opinions and data contained in all publications are solely those of the individual author(s) and contributor(s) and not of MDPI and/or the editor(s). MDPI and/or the editor(s) disclaim responsibility for any injury to people or property resulting from any ideas, methods, instructions or products referred to in the content. |
© 2024 by the authors. Licensee MDPI, Basel, Switzerland. This article is an open access article distributed under the terms and conditions of the Creative Commons Attribution (CC BY) license (https://creativecommons.org/licenses/by/4.0/).