
Gender Differences in Longitudinal Links between Neighborhood Fear, Parental Support, and Depression among African American Emerging Adults

 ,
, 
Abstract
:1. Introduction
1.1. Depression and African Americans
1.2. Developmental Risks for Depressive Symptoms among African Americans
1.3. Fear of Neighborhood Violence
1.4. Parental Support and Depression
2. Methods
2.1. Procedure
2.2. Measures
2.2.1. Covariates
2.2.2. Symptoms of Depression
2.2.3. Parental Support
2.2.4. Fear of Neighborhood Violence
2.3. Data Analysis Strategy
3. Results
3.1. Univariate Analysis

| Men | Women | |||||||||
|---|---|---|---|---|---|---|---|---|---|---|
| n | Min | Max | Mean | SD | n | Min | Max | Mean | SD | |
| Fear of violence in neighborhood at age 21 | 205 | 1.0 | 4.0 | 1.39 | 0.64 | 265 | 1.0 | 4.0 | 1.50 | 0.67 |
| Fear of violence in neighborhood at age 22 | 235 | 1.0 | 4.0 | 1.43 | 0.66 | 278 | 1.0 | 4.0 | 1.47 | 0.69 |
| Maternal Support at age 21 | 200 | 1.0 | 5.0 | 4.11 | 0.94 | 247 | 1.0 | 5.0 | 3.96 | 1.07 |
| Maternal Support at age 24 | 201 | 1.0 | 5.0 | 4.01 | 0.99 | 235 | 1.0 | 5.0 | 3.97 | 1.09 |
| Paternal Support at age 21 | 142 | 1.0 | 5.0 | 3.36 | 1.15 | 210 | 1.0 | 5.0 | 2.98 | 1.24 |
| Paternal Support at age 24 | 149 | 1.0 | 5.0 | 3.42 | 1.16 | 202 | 1.0 | 5.0 | 3.22 | 1.27 |
| Depressive Symptoms at age 23 | 197 | 1.0 | 5.0 | 1.59 | 0.61 | 262 | 1.0 | 4.3 | 1.84 | 0.75 |
| Depressive Symptoms at age 24 | 209 | 1.0 | 4.8 | 1.65 | 0.70 | 262 | 1.0 | 4.7 | 1.78 | 0.73 |
3.2. Bivariate Analysis
| 1 | 2 | 3 | 4 | 5 | 6 | 7 | 8 | 9 | 10 | 11 | |
|---|---|---|---|---|---|---|---|---|---|---|---|
| age | 1 | −0.1 | −0.099 | 0.022 | 0.062 | −0.123 | −0.152 * | −0.055 | −0.136 | 0.054 | −0.08 |
| Parent employment | −0.098 | 1 | 0.146 ** | 0.04 | 0.071 | 0.045 | 0.145 * | −0.004 | 0.07 | −0.233 ** | −0.124 |
| Intact family | −0.123 * | 0.128* | 1 | −0.012 | −0.03 | 0.192 ** | 0.181 * | 0.169 * | 0.273 ** | −0.146 * | −0.121 |
| Fear of violence in neighborhood | 0.055 | −0.105 | −0.003 | 1 | 0.384 ** | −0.128 | −0.054 | −0.155 | 0.129 | 0.006 | 0.196 * |
| Fear of violence in neighborhood | 0.04 | −0.05 | −0.092 | 0.369 ** | 1 | 0.035 | −0.005 | 0.011 | 0.043 | 0.019 | 0.221 ** |
| Support of mother in daily life | 0.015 | 0.016 | 0.044 | −0.111 | −0.015 | 1 | 0.657 ** | 0.361 ** | 0.298 ** | −0.056 | −0.116 |
| Support of mother in daily life | −0.014 | 0.077 | 0.11 | −0.083 | 0.006 | 0.660 ** | 1 | 0.217* | 0.329 ** | −0.195* | −0.290 ** |
| Support of father in daily life | −0.038 | 0.091 | 0.163* | −0.103 | −0.136 | 0.265 ** | 0.255 ** | 1 | 0.697 ** | −0.132 | −0.078 |
| Support of father in daily life | −0.027 | 0.036 | 0.147* | 0.032 | 0.051 | 0.04 | 0.221 ** | 0.452** | 1 | −0.199* | −0.13 |
| Depressive Symptoms | 0.089 | −0.086 | −0.104 | 0.126 | 0.078 | −0.302 ** | −0.343 ** | −0.204** | −0.153 * | 1 | 0.575 ** |
| Depressive Symptoms | −0.053 | −0.005 | 0.003 | 0.146* | 0.111 | −0.243 ** | −0.157 * | −0.069 | −0.042 | 0.539** | 1 |
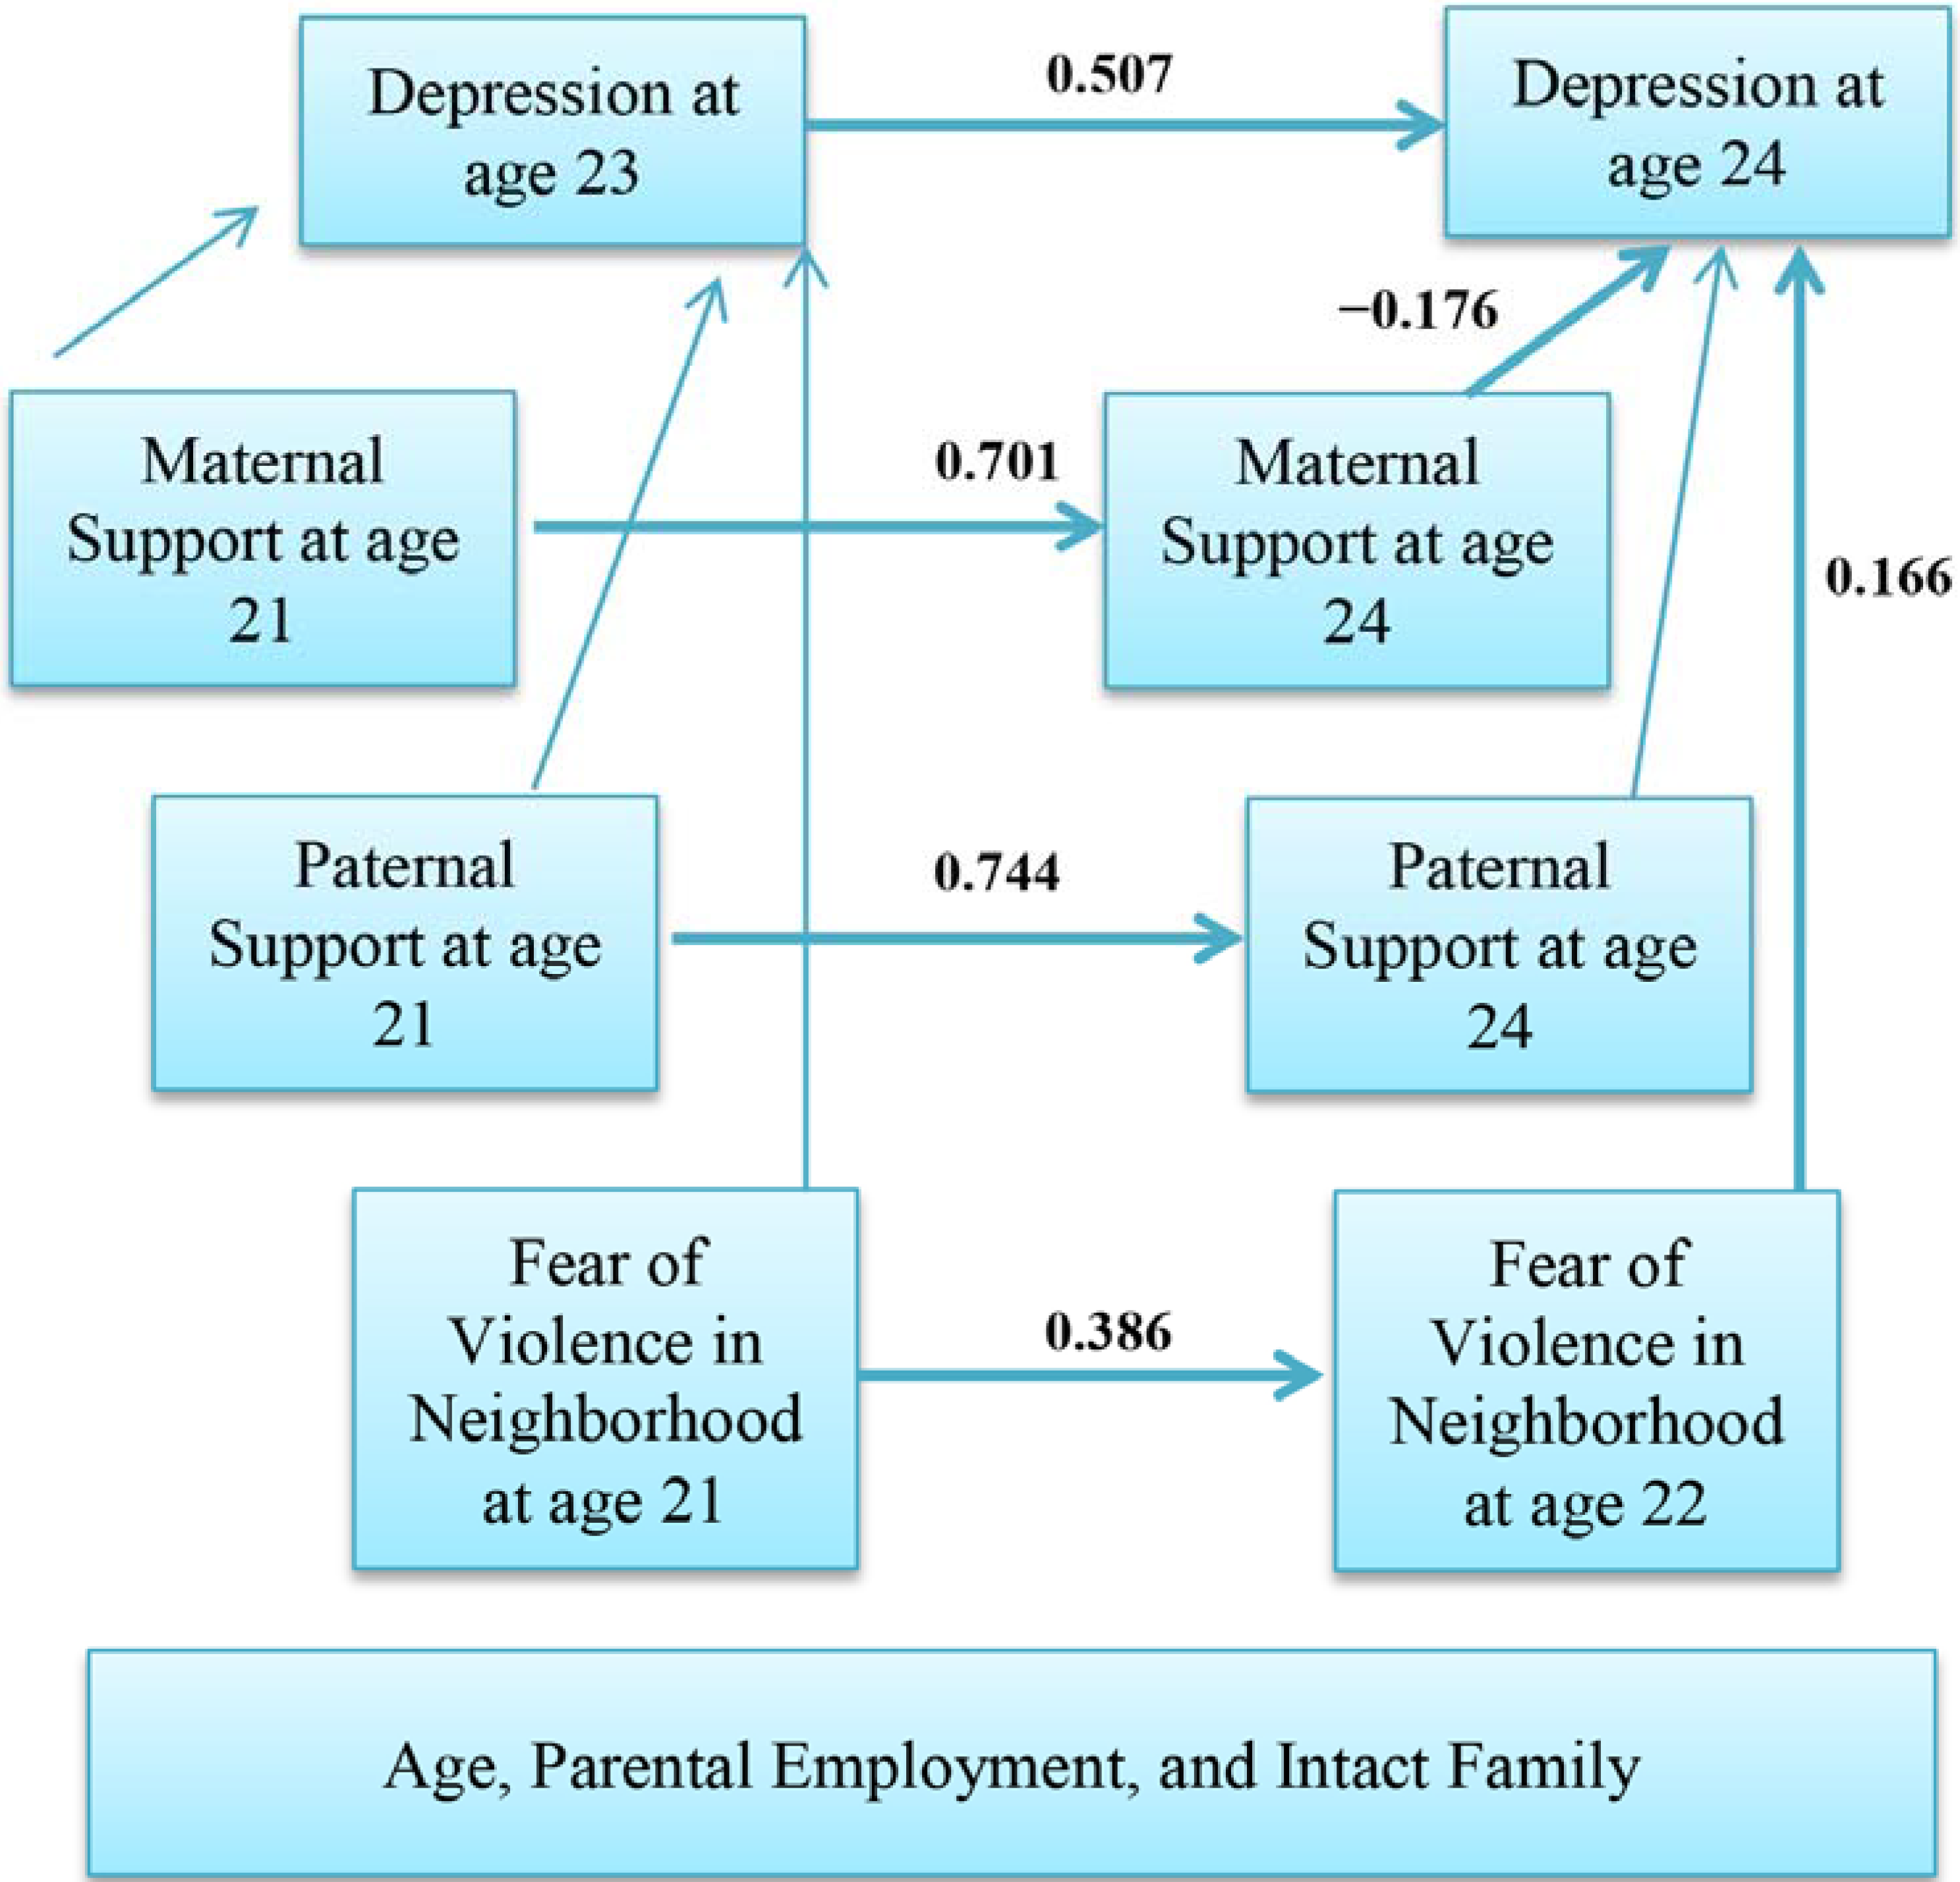
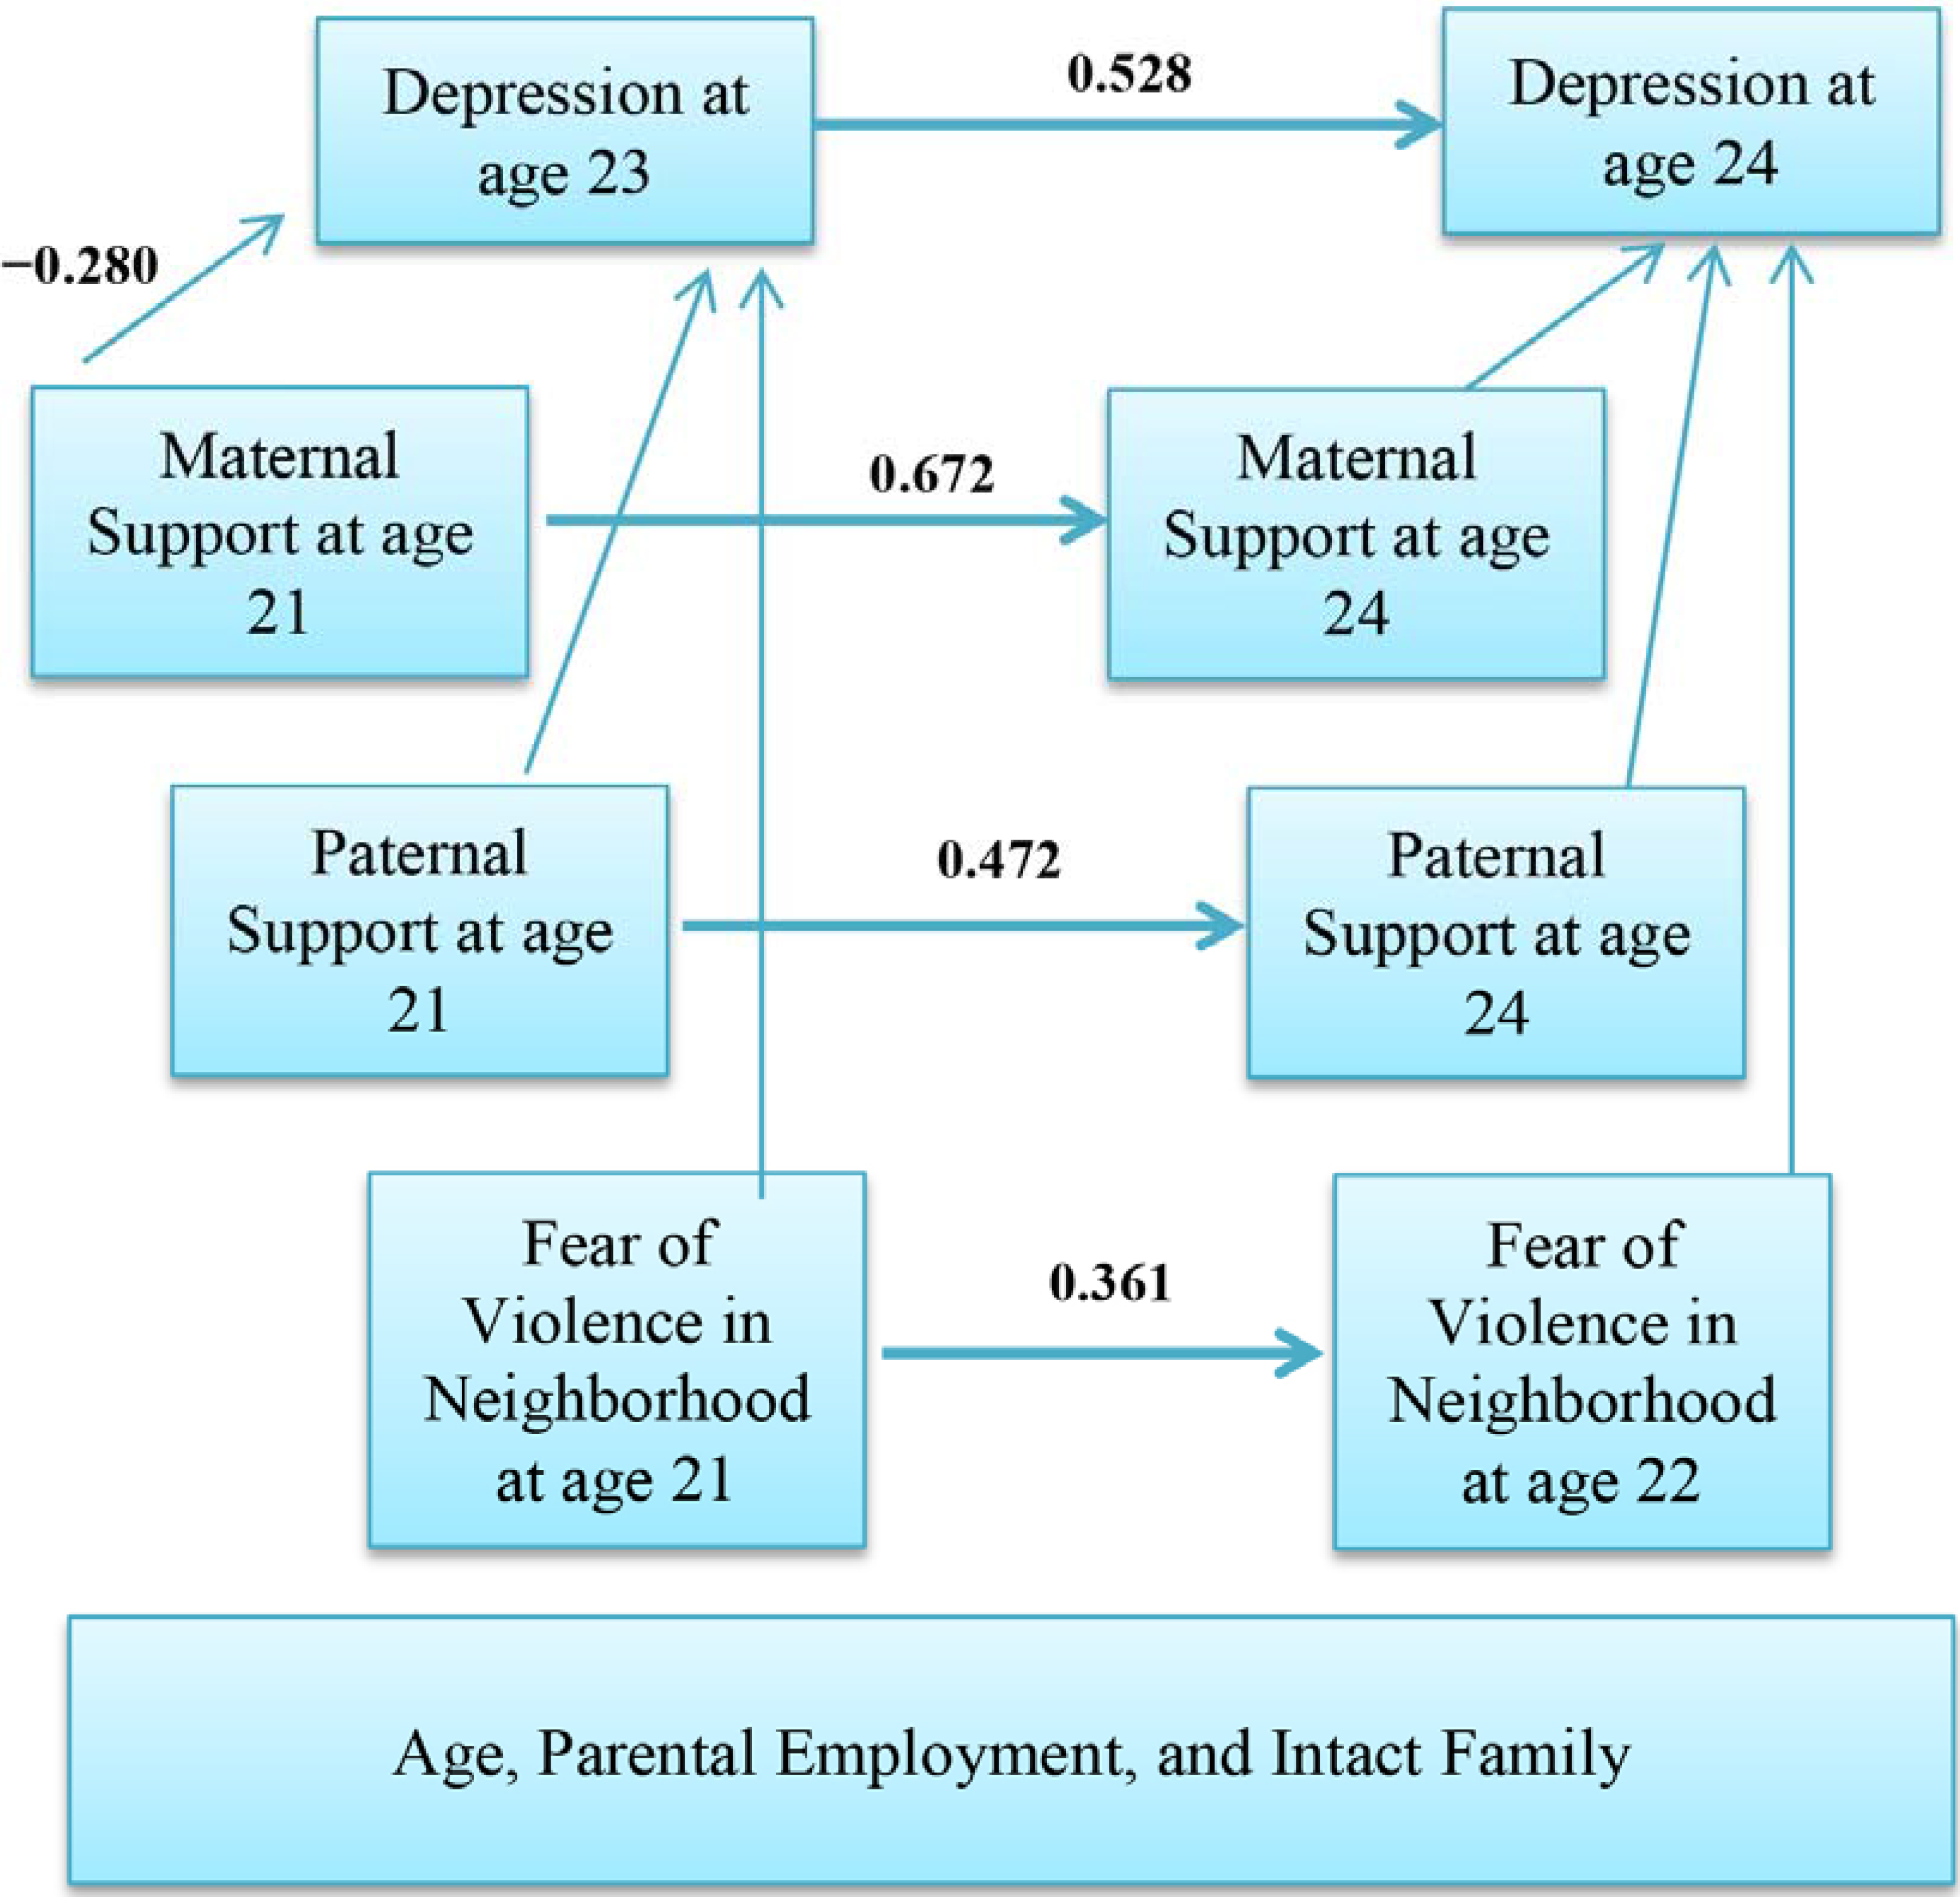
3.3. Multivariable Model
| Men | Women | |||||||
|---|---|---|---|---|---|---|---|---|
| Standardized B | SE | P | Standardized B | SE | P | |||
| Fear of violence in neighborhood at age 21 | → | Fear of violence in neighborhood at age 22 | 0.386 | 0.068 | <0.001 | 0.361 | 0.062 | <0.001 |
| Fear of violence in neighborhood at age 21 | → | Depressive Symptoms at age 23 | 0.016 | 0.072 | 0.836 | 0.062 | 0.07 | 0.321 |
| Maternal Support at age 21 | → | Maternal Support at age 24 | 0.701 | 0.052 | <0.001 | 0.672 | 0.05 | <0.001 |
| Maternal Support at age 21 | → | Depressive Symptoms at age 23 | −0.09 | 0.051 | 0.286 | −0.28 | 0.044 | <0.001 |
| Paternal Support at age 21 | → | Paternal Support at age 24 | 0.744 | 0.061 | <0.001 | 0.472 | 0.069 | <0.001 |
| Paternal Support at age 21 | → | Depressive Symptoms at age 23 | −0.036 | 0.048 | 0.699 | −0.098 | 0.043 | 0.167 |
| Age | → | Depressive Symptoms at age 23 | 0.007 | 0.062 | 0.921 | 0.044 | 0.07 | 0.447 |
| Parent employment | → | Depressive Symptoms at age 23 | −0.184 | 0.083 | 0.008 | −0.048 | 0.09 | 0.424 |
| Intact family | → | Depressive Symptoms at age 23 | −0.06 | 0.093 | 0.393 | −0.057 | 0.109 | 0.337 |
| Depressive Symptoms at age 23 | → | Depressive Symptoms at age 24 | 0.507 | 0.068 | <0.001 | 0.528 | 0.055 | <0.001 |
| Fear of violence in neighborhood at age 21 | → | Depressive Symptoms at age 22 | 0.166 | 0.069 | 0.013 | 0.054 | 0.063 | 0.365 |
| Fear of violence in neighborhood at age 22 | → | Depressive Symptoms at age 23 | 0.098 | 0.075 | 0.163 | 0.067 | 0.068 | 0.281 |
| Maternal Support at age 24 | → | Depressive Symptoms at age 24 | −0.176 | 0.042 | 0.003 | 0.018 | 0.038 | 0.758 |
| Paternal Support at age 24 | → | Depressive Symptoms at age 24 | −0.007 | 0.039 | 0.918 | 0.038 | 0.034 | 0.523 |
4. Discussion
4.1. Fear of Violence and Depressive Symptoms among African American Males
4.2. Parental Support and Depressive Symptoms during Emerging Adulthood
4.3. Implications, Recommendations, and Future Directions
Acknowledgments
Author Contributions
Appendix 1. Items Used for Measurement of Study Constructs.
| Maternal Support | |||||
| How often do you speak with or see your Mother? | |||||
| 1. Daily 2. Every 2–3 days 3. Every 4–6 days 4. Once a week 5. Two times/month | |||||
| 6. Once a month 7. More than 1 month ago 8. No contact 9 Never met 10. Deceased | |||||
| Please answer the following questions. | |||||
| Not True | Little True | Somewhat True | Pretty True | Very True | |
| My Mother enjoys hearing about what I think. | 1 | 2 | 3 | 4 | 5 |
| I rely on my Mother for emotional support. | 1 | 2 | 3 | 4 | 5 |
| My Mother is good at helping me solve problems. | 1 | 2 | 3 | 4 | 5 |
| I have a deep sharing relationship with my Mother. | 1 | 2 | 3 | 4 | 5 |
| I rely on my Mother for moral support. | 1 | 2 | 3 | 4 | 5 |
| Although I trust my Mother, sometimes I have my doubts. | 1 | 2 | 3 | 4 | 5 |
| My Mother understands me. | 1 | 2 | 3 | 4 | 5 |
| I wish I had a different Mother. | 1 | 2 | 3 | 4 | 5 |
| Paternal Support | |||||
| How often do you speak with or see your Father? | |||||
| 1. Daily 2. Every 2–3 days 3. Every 4–6 days 4. Once a week 5. Two times/month | |||||
| 6. Once a month 7. More than 1 month ago 8. No contact 9 Never met 10. Deceased | |||||
| Please answer the following questions. | |||||
| Not True | Little True | Somewhat True | Pretty True | Very True | |
| My Father enjoys hearing about what I think. | 1 | 2 | 3 | 4 | 5 |
| I rely on my Father for emotional support. | 1 | 2 | 3 | 4 | 5 |
| My Father is good at helping me solve problems. | 1 | 2 | 3 | 4 | 5 |
| I have a deep sharing relationship with my Father. | 1 | 2 | 3 | 4 | 5 |
| I rely on my Father for moral support. | 1 | 2 | 3 | 4 | 5 |
| Although I trust my Father, sometimes I have my doubts. | 1 | 2 | 3 | 4 | 5 |
| My Father understands me. | 1 | 2 | 3 | 4 | 5 |
| I wish I had a different Father. | 1 | 2 | 3 | 4 | 5 |
| Fear of Violence in the Neighborhood | |||||
| Using this 4-point scale, please tell me how much you agree with the following statements. | |||||
| Strongly Disagree | Strongly Agree | ||||
| I am afraid of the violence in my neighborhood. | 1 | 2 | 3 | 4 | |
| I worry that someone in my neighborhood will physically hurt me. | 1 | 2 | 3 | 4 | |
| Depressive Symptoms | |||||
| I am now going to read a list of problems and complaints that people sometimes have. During the past week, including today, please tell me how often you felt or thought that way. | |||||
| Never | Almost Never | Sometimes | Fairly Often | Very Often | |
| Thoughts of ending your life | 1 | 2 | 3 | 4 | 5 |
| Feeling lonely | 1 | 2 | 3 | 4 | 5 |
| Feeling blue (or sad) | 1 | 2 | 3 | 4 | 5 |
| Feeling no interest in things | 1 | 2 | 3 | 4 | 5 |
| Feeling hopeless about the future | 1 | 2 | 3 | 4 | 5 |
| Feelings of worthlessness | 1 | 2 | 3 | 4 | 5 |
Conflicts of Interest
References
- Lepine, J.P. Epidemiology, burden, and disability in depression and anxiety. J. Clin. Psychiatry 2001, 62 (Suppl. 13), 4–10. [Google Scholar] [PubMed]
- Lepine, J.P.; Briley, M. The increasing burden of depression. Neuropsychiatr. Dis. Treat. 2011, 7, 3–7. [Google Scholar] [PubMed]
- Shim, R.S.; Baltrus, P.; Ye, J.; Rust, G. Prevalence, treatment, and control of depressive symptoms in the United States: Results from the National Health and Nutrition Examination Survey (NHANES), 2005–2008. J. Am. Board Fam. Med. 2011, 24, 33–38. [Google Scholar] [CrossRef] [PubMed]
- Riolo, S.A.; Nguyen, T.A.; Greden, J.F.; King, C.A. Prevalence of depression by race/ethnicity: Findings from the National Health and Nutrition Examination Survey III. Am. J. Public Health 2005, 95, 998–1000. [Google Scholar] [CrossRef] [PubMed]
- Blazer, D.G.; Kessler, R.C.; McGonagle, K.A.; Swartz, M.S. The prevalence and distribution of major depression in a national community sample: The National Comorbidity Survey. Am. J. Psychiatry 1994, 151, 979–986. [Google Scholar] [CrossRef] [PubMed]
- Kessler, R.C.; McGonagle, K.A.; Zhao, S.; Nelson, C.B.; Hughes, M.; Eshleman, S.; Wittchen, H.U.; Kendler, K.S. Lifetime and 12-month prevalence of DSM-III-R psychiatric disorders in the United States. Results from the National Comorbidity Survey. Arch. Gen. Psychiatry 1994, 51, 8–19. [Google Scholar] [CrossRef] [PubMed]
- Williams, D.R.; Gonzalez, H.M.; Neighbors, H.; Nesse, R.; Abelson, J.M.; Sweetman, J.; Jackson, J.S. Prevalence and distribution of major depressive disorder in African Americans, Caribbean blacks, and non-Hispanic whites: Results from the National Survey of American Life. Arch. Gen. Psychiatry 2007, 64, 305–315. [Google Scholar] [CrossRef] [PubMed]
- Blazer, D.G.; Landerman, L.R.; Hays, J.C.; Simonsick, E.M.; Saunders, W.B. Symptoms of depression among community-dwelling elderly African-American and white older adults. Psychol. Med. 1998, 28, 1311–1320. [Google Scholar] [CrossRef] [PubMed]
- Jones-Webb, R.J.; Snowden, L.R. Symptoms of depression among blacks and whites. Am. J. Public Health 1993, 83, 240–244. [Google Scholar] [CrossRef] [PubMed]
- Ialongo, N.; McCreary, B.K.; Pearson, J.L.; Koenig, A.L.; Schmidt, N.B.; Poduska, J.; Kellam, S.G. Major depressive disorder in a population of urban, African-American young adults: prevalence, correlates, comorbidity and unmet mental health service need. J. Affect. Disord. 2004, 79, 127–136. [Google Scholar] [CrossRef] [PubMed]
- Gore, S.; Aseltine, R.H., Jr. Race and ethnic differences in depressed mood following the transition from high school. J. Health Soc. Behav. 2003, 44, 370–389. [Google Scholar] [CrossRef] [PubMed]
- Arnett, J. Emerging Adulthood: The Winding Road through the Late Teens and Twenties; Oxford University Press: New York, NY, USA, 2004. [Google Scholar]
- Settersten, R.A.; Ray, B. What’s going on with young people today? The long and twisting path to adulthood. Future Child. 2010, 20, 20–41. [Google Scholar]
- Estrada-Martinez, L.M.; Caldwell, C.H.; Bauermeister, J.A.; Zimmerman, M.A. Stressors in multiple life-domains and the risk for externalizing and internalizing behaviors among African Americans during emerging adulthood. J. Youth Adolesc. 2012, 41, 1600–1612. [Google Scholar] [CrossRef] [PubMed]
- Bell, C.C.; Jenkins, E.J. Community violence and children on Chicago’s southside. Psychiatry 1993, 56, 46–54. [Google Scholar] [PubMed]
- Buka, S.L.; Stichick, T.L.; Birdthistle, I.; Earls, F.J. Youth exposure to violence: Prevalence, risks, and consequences. Am. J. Orthopsychiatry 2001, 71, 298–310. [Google Scholar] [CrossRef] [PubMed]
- Cooley-Strickland, M.; Quille, T.J.; Griffin, R.S.; Stuart, E.A.; Bradshaw, C.P.; Furr-Holden, D. Community violence and youth: Affect, behavior, substance use, and academics. Clin. Child. Fam. Psychol. Rev. 2009, 12, 127–156. [Google Scholar] [CrossRef] [PubMed]
- Gorman-Smith, D.; Tolan, P. The role of exposure to violence and developmental problems among inner-city youth. Dev. Psychopathol. 1998, 10, 101–116. [Google Scholar] [CrossRef] [PubMed]
- Fitzpatrick, K.M. Exposure to violence and presence of depression among low-income, African-American youth. J. Consult. Clin. Psychol. 1993, 61, 528–531. [Google Scholar] [CrossRef] [PubMed]
- Fitzpatrick, K.M.; Piko, B.F.; Wright, D.R.; LaGory, M. Depressive symptomatology, exposure to violence, and the role of social capital among african american adolescents. Am. J. Orthopsychiatry 2005, 75, 262–274. [Google Scholar] [CrossRef] [PubMed]
- Jenkins, E.J.; Wang, E.; Turner, L. Traumatic events involving friends and family members in a sample of african american early adolescents. Am. J. Orthopsychiatry 2009, 79, 398–406. [Google Scholar] [CrossRef] [PubMed]
- Rasmussen, A.; Aber, M.S.; Bhana, A. Adolescent coping and neighborhood violence: Perceptions, exposure, and urban youths’ efforts to deal with danger. Am. J. Community Psychol. 2004, 33, 61–75. [Google Scholar] [CrossRef] [PubMed]
- Caldwell, C.H.; Zimmerman, M.A.; Bernat, D.H.; Sellers, R.M.; Notaro, P.C. Racial identity, maternal support, and psychological distress among african american adolescents. Child Dev. 2002, 73, 1322–1336. [Google Scholar] [CrossRef] [PubMed]
- Lambert, S.F.; Nylund-Gibson, K.; Copeland-Linder, N.; Ialongo, N.S. Patterns of community violence exposure during adolescence. Am. J. Community Psychol. 2010, 46, 289–302. [Google Scholar] [CrossRef] [PubMed]
- Aneshensel, C.S.; Sucoff, C.A. The neighborhood context of adolescent mental health. J. Health Soc. Behav. 1996, 37, 293–310. [Google Scholar] [CrossRef] [PubMed]
- Garbarino, J.; Kostelny, K.; Dubrow, N. What children can tell us about living in danger. Am. Psychol. 1991, 46, 376–383. [Google Scholar] [CrossRef] [PubMed]
- Ross, C.E.; Mirowsky, J. Neighborhood disorder, subjective alienation, and distress. J. Health Soc. Behav. 2009, 50, 49–64. [Google Scholar] [CrossRef] [PubMed]
- Latkin, C.A.; Curry, A.D. Stressful neighborhoods and depression: A prospective study of the impact of neighborhood disorder. J. Health Soc. Behav. 2003, 44, 34–44. [Google Scholar] [CrossRef] [PubMed]
- LaVeist, T.A. Disentangling race and socioeconomic status: A key to understanding health inequalities. J. Urban Health 2005, 82, iii26–iii34. [Google Scholar] [CrossRef] [PubMed]
- Bellair, P.E.; McNulty, T.L. Beyond the bell curve: Community disadvantage and the explanation of black-white differences in adolescent violence. Criminology 2005, 43, 1135–1168. [Google Scholar] [CrossRef]
- Copeland-Linder, N.; Lambert, S.F.; Chen, Y.F.; Ialongo, N.S. Contextual stress and health risk behaviors among african american adolescents. J. Youth Adolesc. 2011, 40, 158–173. [Google Scholar] [CrossRef] [PubMed]
- Squires, G.D.; Kubrin, C.E. Privileged places: Race, uneven development and the geography of opportunity in urban America. Urban Stud. 2005, 42, 47–68. [Google Scholar] [CrossRef]
- Dupéré, V.; Leventhal, T.; Vitaro, F. Neighborhood processes, self-efficacy, and adolescent mental health. J. Health Soc. Behav. 2012, 53, 183–198. [Google Scholar] [CrossRef] [PubMed]
- Theall, K.P.; Sterk, C.E.; Elifson, K.W. Perceived neighborhood fear and drug use among young adults. Am. J. Health Behav. 2009, 33, 353–365. [Google Scholar] [CrossRef] [PubMed]
- Miller, B.; Taylor, J. Racial and socioeconomic status differences in depressive symptoms among black and white youth: An examination of the mediating effects of family structure, stress and support. J. Youth Adolesc. 2012, 41, 426–437. [Google Scholar] [CrossRef] [PubMed]
- Elder, G.H.; Giele, J.Z. (Eds.) The Craft of Life Course Research; The Guildford Press: New York: NY, USA, 2009.
- Watkins, D.C. Depression over the adult life course for African American men: Toward a framework for research and practice. Am. J. Men’s Health 2012, 6, 194–210. [Google Scholar] [CrossRef]
- Bronfenbrenner, U.; Ceci, S.J. Nature-nurture reconceptualized in developmental perspective: A bioecological model. Psychol Rev 1994, 101, 568–586. [Google Scholar] [CrossRef] [PubMed]
- Aiyer, S.M.; Heinze, J.E.; Miller, A.L.; Stoddard, S.A.; Zimmerman, M.A. Exposure to violence predicting cortisol response during adolescence and early adulthood: understanding moderating factors. J. Youth Adolesc. 2014, 43, 1066–1079. [Google Scholar] [CrossRef] [PubMed]
- Assari, S.; Caldwell, C.H.; Zimmerman, M.A. Sex differences in the association between testosterone and violent behaviors. Trauma Mon. 2014, 19, e18040. [Google Scholar] [CrossRef] [PubMed]
- Derogatis, L.R.; Spencer, P.M. The Brief Symptom Inventory (BSI): Administration, Scoring and Procedures Manual–I; Johns Hopkins University School of Medicine, Clinical Psychometric Research Unit: Baltimore, MD, USA, 1982. [Google Scholar]
- Derogatis, L.R. SCL-90: Administration, Scoring, and Procedures Manual for the (R)evised Version and other Instruments of the Psychopathology Rating Scale Series; Johns Hopkins University Hospital: Baltimore, MD, USA, 1977. [Google Scholar]
- Connolly, M.B.; Crits-Christoph, P.; Shelton, R.C.; Hollon, S.; Kurtz, J.; Barber, J.P.; Butler, S.F.; Baker, S.; Thase, M.E. The reliability and validity of a measure of self-understanding of interpersonal patterns. J. Couns. Psychol. 1999, 46, 472–482. [Google Scholar] [CrossRef]
- Procidano, M.E.; Heller, K. Measures of perceived social support from friends and from family: Three validation studies. Am. J. Community Psychol. 1983, 11, 1–24. [Google Scholar] [CrossRef] [PubMed]
- Brenner, A.B.; Bauermeister, J.A.; Zimmerman, M.A. Neighborhood variation in adolescent alcohol use: Examination of socioecological and social disorganization theories. J. Stud. Alcohol Drugs 2011, 72, 651–659. [Google Scholar] [CrossRef] [PubMed]
- Alessi, P. Professional iOS Database Applications, and Programming, 2nd ed.; Taylor and Francis Group: New York, NY, USA, 2002. [Google Scholar]
- Arbuckle, J.L. Amos™ 18 User’s Guide; Amos Development Corporation: Crawfordville, FL, USA, 2009. [Google Scholar]
- Kline, R.B. Principles and Practice of Structural Equation Modeling; Guilford Press: New York, NY, USA, 2011. [Google Scholar]
- Hu, L.; Bentler, P.M. Cutoff criteria for fit indexes in covariance structure analysis: Conventional criteria versus new alternatives. Struct. Equ. Model. 1999, 6, 1–55. [Google Scholar] [CrossRef]
- Lei, M.; Lomax, R.G. The effect of varying degrees of nonnormality in structural equation modeling. Struct. Equ. Model. 2005, 12, 1–27. [Google Scholar] [CrossRef]
- Tabachnick, B.G.; Fidell, L.S. Using Multivariate Statistics, 3rd ed.; Harper Collins: New York, NY, USA, 1996. [Google Scholar]
- Hammond, W.P. Taking it like a man: Masculine role norms as moderators of the racial discrimination-depressive symptoms association among African American men. Am. J. Public Health 2012, 102 (Suppl 2), S232–S241. [Google Scholar] [CrossRef] [PubMed]
- O’Loughlin, R.E.; Duberstein, P.R.; Veazie, P.J.; Bell, R.A.; Rochlen, A.B.; Fernandez y Garcia, E.; Kravitz, R.L. Role of the gender-linked norm of toughness in the decision to engage in treatment for depression. Psychiatr. Serv. 2011, 62, 740–746. [Google Scholar] [CrossRef] [PubMed]
- Majors, R.; Billson, J.M. Cool Pose: The Dilemmas of Black Manhood in America; Lexington Books: New York, NY, USA, 1992. [Google Scholar]
- Tracy, M.; Zimmerman, F.J.; Galea, S.; McCauley, E.; Stoep, A.V. What explains the relation between family poverty and childhood depressive symptoms? J. Psychiatr. Res. 2008, 42, 1163–1175. [Google Scholar] [CrossRef] [PubMed]
- Zimmerman, A.; Ramirez-Valles, J.; Zapert, K.M.; Maton, K.I. A longitudinal study of stress-buffering effects for urban African-American male adolescent problem behaviors and mental health. J. Community Psychol. 2000, 28, 17–33. [Google Scholar] [CrossRef]
- Ellis, K.R.; Caldwell, C.H.; Assari, S.; de Loney, E.H. Nonresident African-American fathers’ influence on sons’ exercise intentions in the fathers and sons program. Am. J. Health Promot.: AJHP 2014, 29, 89–98. [Google Scholar] [CrossRef] [PubMed]
- Howard Caldwell, C.; Antonakos, C.L.; Assari, S.; Kruger, D.; de Loney, E.H.; Njai, R. Pathways to prevention: Improving nonresident african american fathers’ parenting skills and behaviors to reduce sons’ aggression. Child Dev. 2014, 85, 308–325. [Google Scholar]
- Klein, K. Socioemotional support in african american families coping with maternal HIV: An examination of mothers’ and children’s psychosocial adjustment. Behav. Ther. 2000, 31, 1–26. [Google Scholar] [CrossRef]
- Costello, D.M.; Swendsen, J.; Rose, J.S.; Dierker, L.C. Risk and protective factors associated with trajectories of depressed mood from adolescence to early adulthood. J. Consult. Clin. Psychol. 2008, 76, 173–183. [Google Scholar] [CrossRef] [PubMed]
- Assari, S. Race and ethnicity, religion involvement, church-based social support and subjective health in united states: A case of moderated mediation. Int. J. Prev. Med. 2013, 4, 208–217. [Google Scholar] [PubMed]
- Assari, S. Additive effects of anxiety and depression on body mass index among blacks: Role of ethnicity and gender. Int. Cardiovasc. Res. J. 2014, 8, 44–51. [Google Scholar] [PubMed]
- Assari, S.; Ahmadi, K.; Kazemi Saleh, D. Gender differences in the association between lipid profile and sexual function among patients with coronary artery disease. Int. Cardiovasc. Res. J. 2014, 8, 9–14. [Google Scholar] [PubMed]
- Assari, S.; Lankarani, M.M.; Lankarani, R.M. Ethnicity modifies the additive effects of anxiety and drug use disorders on suicidal ideation among black adults in the united states. Int. J. Prev. Med. 2013, 4, 1251–1257. [Google Scholar] [PubMed]
- Assari, S.; Moghani Lankarani, M.; Kazemi Saleh, D.; Ahmadi, K. Gender modifies the effects of education and income on sleep quality of the patients with coronary artery disease. Int. Cardiovasc. Res. J. 2013, 7, 141–146. [Google Scholar] [PubMed]
- Dejman, M.; Forouzan, A.; Assari, S.; Malekafzali, H.; Nohesara, S.; Khatibzadeh, N.; Falahat, K.; Ekblad, S. An Explanatory Model of Depression among Female Patients in Fars, Kurds, Turks Ethnic Groups of Iran. Iran. J. Public Health 2011, 40, 79–88. [Google Scholar] [PubMed]
- Dejman, M.; Forouzan, A.S.; Assari, S.; Rasoulian, M.; Jazayery, A.; Malekafzali, H.; Baradaran Eftekhari, M.; Falahat, K.; Ekblad, S. How iranian lay people in three ethnic groups conceptualize a case of a depressed woman: An explanatory model. Ethn. Health 2010, 15, 475–493. [Google Scholar] [CrossRef] [PubMed]
- Kazemi-Saleh, D.; Pishgou, B.; Farrokhi, F.; Assari, S.; Fotros, A.; Naseri, H. Gender impact on the correlation between sexuality and marital relation quality in patients with coronary artery disease. J. Sex. Med. 2008, 5, 2100–2106. [Google Scholar] [CrossRef] [PubMed]
- Khooshabi, K.; Ameneh-Forouzan, S.; Ghassabian, A.; Assari, S. Is there a gender difference in associates of adolescents’ lifetime illicit drug use in Tehran, Iran? Arch. Med. Sci.: AMS 2010, 6, 399–406. [Google Scholar] [CrossRef] [PubMed]
- Mohammadkhani, P.; Forouzan, A.S.; Khooshabi, K.S.; Assari, S.; Lankarani, M.M. Are the predictors of sexual violence the same as those of nonsexual violence? A gender analysis. J. Sex. Med. 2009, 6, 2215–2223. [Google Scholar] [CrossRef] [PubMed]
- Tavallaii, S.A.; Fathi-Ashtiani, A.; Nasiri, M.; Assari, S.; Maleki, P.; Einollahi, B. Correlation between sexual function and postrenal transplant quality of life: does gender matter? J. Sex Med. 2007, 4, 1610–1618. [Google Scholar] [CrossRef] [PubMed]
- Roy, K.; Messina, L.; Smith, J.; Waters, D. Growing up as “Man of the House”: Adultification and the Transition into Adulthood for Young Men in Economically Disadvantaged Families. New Dir. Child Adoles. Dev. 2014, 143, 55–72. [Google Scholar] [CrossRef]
- Berzin, S.C.; de Marco, A.C. Understanding the impact of poverty on critical events in emerging adulthood. Youth Soc. 2010, 42, 278–300. [Google Scholar] [CrossRef]
- Watkins, D.C.; Green, B.L.; Rivers, B.M.; Rowell, K.L. Depression and black men: Implications for future research. J. Men’s Health Gender Issues 2006, 3, 227–235. [Google Scholar] [CrossRef]
- Watkins, D.C.; Abelson, J.M.; Jefferson, S.O. “Their depression is something different…It would have to be”: Findings from a qualitative study of black women’s perceptions of depression in black men. Am. J. Men’s Health 2013, 7, 45S–57S. [Google Scholar] [CrossRef]
- Givens, J.L.; Houston, T.K.; van Voorhees, B.W.; Ford, D.E.; Cooper, L.A. Ethnicity and preferences for depression treatment. Gen. Hosp. Psychiatry 2007, 29, 182–191. [Google Scholar] [CrossRef] [PubMed]
- Das, A.K.; Olfson, M.; McCurtis, H.L.; Weissman, M.M. Depression in African Americans: Breaking barriers to detection and treatment. J. Fam. Pract. 2006, 55, 30–39. [Google Scholar] [PubMed]
- Givens, J.L.; Katz, I.R.; Bellamy, S.; Holmes, W.C. Stigma and the acceptability of depression treatments among african americans and whites. J. Gen. Intern. Med. 2007, 22, 1292–1297. [Google Scholar] [CrossRef] [PubMed]
- Cooper, L.A.; Gonzales, J.J.; Gallo, J.J.; Rost, K.M.; Meredith, L.S.; Rubenstein, L.V.; Wang, N.Y.; Ford, D.E. The acceptability of treatment for depression among African-American, Hispanic, and white primary care patients. Med. Care 2003, 41, 479–489. [Google Scholar] [PubMed]
- Dwight-Johnson, M.; Sherbourne, C.D.; Liao, D.; Wells, K.B. Treatment preferences among depressed primary care patients. J. Gen. Intern. Med. 2000, 15, 527–534. [Google Scholar] [CrossRef] [PubMed]
- Blank, M.B.; Mahmood, M.; Fox, J.C.; Guterbock, T. Alternative mental health services: The role of the black church in the South. Am. J. Public Health 2002, 92, 1668–1672. [Google Scholar] [CrossRef] [PubMed]
- Assari, S. Multilevel approach to intimate partner violence research and prevention. Int. J. Prev. Med. 2013, 4, 616–617. [Google Scholar] [PubMed]
© 2015 by the authors; licensee MDPI, Basel, Switzerland. This article is an open access article distributed under the terms and conditions of the Creative Commons Attribution license (http://creativecommons.org/licenses/by/4.0/).
Share and Cite
Assari, S.; Smith, J.R.; Caldwell, C.H.; Zimmerman, M.A. Gender Differences in Longitudinal Links between Neighborhood Fear, Parental Support, and Depression among African American Emerging Adults. Societies 2015, 5, 151-170. https://doi.org/10.3390/soc5010151
Assari S, Smith JR, Caldwell CH, Zimmerman MA. Gender Differences in Longitudinal Links between Neighborhood Fear, Parental Support, and Depression among African American Emerging Adults. Societies. 2015; 5(1):151-170. https://doi.org/10.3390/soc5010151
Chicago/Turabian StyleAssari, Shervin, Jocelyn R. Smith, Cleopatra Howard Caldwell, and Marc A. Zimmerman. 2015. "Gender Differences in Longitudinal Links between Neighborhood Fear, Parental Support, and Depression among African American Emerging Adults" Societies 5, no. 1: 151-170. https://doi.org/10.3390/soc5010151
APA StyleAssari, S., Smith, J. R., Caldwell, C. H., & Zimmerman, M. A. (2015). Gender Differences in Longitudinal Links between Neighborhood Fear, Parental Support, and Depression among African American Emerging Adults. Societies, 5(1), 151-170. https://doi.org/10.3390/soc5010151